 Chen Lester R. Wu
 Tibor Y. Stigter
 Simon G. Craig
- Department of Water Resources and Ecosystems, IHE Delft Institute for Water Education, Delft, Netherlands
Uncertainties in the contamination and salinization mechanisms of the freshwater lens (FWL) in the semi-arid coral-limestone aquifer of Delft Island, Sri Lanka threatens its water security. The processes governing the quality and distribution of the FWL were therefore investigated through recharge assessment and hydrochemical analysis. Potential groundwater recharge zones based on land classification and geology were first identified. A rootzone water balance model was then built, which revealed the spatiotemporal variability of potential groundwater recharge occurring rapidly during the wet season (October to January) and most abundantly on pasture land underlain by yellow and brown sand. Recharge also varied largely between dry and wet years. Where the water table was shallow, intense rainfall in wet years was seen to result in surface flooding. Geochemical modeling using PHREEQC combined with diagrams (Piper and Stiff) and scatter plots, including stable water isotopes, revealed the meteoric origin of groundwater with salinization mainly caused by seawater mixing and slight evaporation. Findings also suggest that salinization is driven by the island's low-lying nature (maximum elevation of 6 m above sea level), the low hydraulic heads (maximum of 3.7 m above sea level), the shallow depth of the marine water, the presence of lagoons in the center which are inferred to be in hydraulic continuity with the ocean, and to some extent by unregulated abstraction of groundwater through shallow hand-dug wells. We hypothesize about infiltration and percolation of saline water through the root zone during storm inundations near the coast, supported by the combined occurrence of high values of partial CO2 pressure, alkalinity and salinity in groundwater samples. Cation exchange showed indications of salinization of wells mostly in low lying areas (minimum Na/Cl value of 0.66), and freshening in areas near the coast with high potential groundwater recharge (maximum Na/Cl value of 1.04). Elevated nitrate concentrations (maximum of 2.55 mmol/L ) in groundwater samples were observed. This suggests that anthropogenic contamination is further threatening the already scarce resource as well as coastal ecosystems that may be groundwater dependent.
Introduction
Water scarcity remains one of the most pressing issues across the world and is considered a major global risk in the coming decade (Tzanakakis et al., 2020). Particularly, in the case of small coral-reef islands such as Delft Island in Sri Lanka, where the scarcity of good drinking water, especially during the dry season, adversely affects the local population as well as its socio-economic development (Goonatilake et al., 2013). Small islands like Delft Island (50 km2) rely mainly on groundwater for various purposes. Groundwater in these islands typically occurs as thin layers of convex-shaped freshwater lenses (FWL) floating above the seawater in a phreatic aquifer (Falkland and Custodio, 1991; White and Falkland, 2009). One of the prevalent threats in these groundwater systems is saltwater intrusion attributed to natural and anthropogenic causes. Saltwater intrusion is expected to intensify in the future due to the anticipated sea-level rise, more frequent storms, and increasing anthropogenic pressures (White and Falkland, 2009; Polemio and Walraevens, 2019). Delft Island is no exception. Despite a relatively high amount of precipitation during the wet season, locals reported that some wells turn brackish. This could indicate the presence of shallow saline water or the existence of other salinization mechanisms that need to be studied. A recently published work (Craig et al., 2021) indeed revealed a maximum freshwater lens thickness of 2–3 m, much thinner than reported elsewhere [e.g. the small Pacific atoll island of Bonriki has an estimated natural lens thickness of 15 m (White et al., 2007)].
Uncertainties in the contamination and salinization mechanisms of the FWL in the semi-arid coral-limestone aquifer of Delft Island inhibit the development of an effective and sustainable groundwater management plan and threaten the future water security on the island. Previous studies reveal that the integration of geophysical surveys, isotopic analysis and hydrogeochemical characterization can provide essential information on the characteristics of the FWL and the governing processes influencing the quality of groundwater (White et al., 2002; Praveena and Aris, 2009; White and Falkland, 2009). Hence, the main objective of this research is to evaluate and explain the distribution of fresh and saline waters on Delft Island, Sri Lanka in relation to the spatiotemporal distribution of groundwater recharge rates and the governing hydrogeochemical processes. This research examines the effect of anthropogenic activities and natural events on the fresh groundwater lens formation and its degradation, both in terms of quantity and quality.
Methodology
Processing of existing data on rainfall, evaporation, and land classification, and geology of the island were combined with field observations and laboratory analysis to obtain an overview of the occurrence and distribution of the fresh and saline waters on Delft Island. The hydrochemical and water sampling field campaign was done from 22 November to 25 December 2019, during the northeast monsoon period.
Study Area
Situated in the dry zone of Sri Lanka, Delft Island receives an average annual rainfall of about 750 mm/year that is uniformly distributed over the island (Goonatilake et al., 2013). Peak rainfall (>100 mm per month) is caused by the northeast monsoon during the wet season (between October and January), with scattered rainfall caused by the southwest monsoon during April and May. More than 80% of the total amount of precipitation in a year (rainfall depth) falls during the northeast monsoon. Delft is a low lying, oval-shaped island with an area of about 50 km2, a maximum length of 8 km and a maximum width of 6 km. Its highest elevation is about 6 meters above mean sea level (masl). Most areas on the island have an elevation between 1 and 2 masl. Two elevated areas exist on the west coast and east coast of the island. The highest peak is situated in the northeast area. Two major lakes or kulam in the native Tamil language, which are brackish, are situated in the central area, namely the Periya Lake (South) and the Veddukali Lake (North), along with various fresh and brackish ponds and waterholes scattered throughout the island (Craig et al., 2021).
In general, the island consists of an argillaceous limestone base (limestone with clay deposits) which is over 600 m thick belonging to the Eocene, Upper Miocene and Pliocene eras (Cooray, 1984). A more recent study classified the argillaceous limestone as Vanathavillu Limestone which is characterized as hard, partly crystalline, compact, indistinctly bedded, fossiliferous, creamy colored rock (GSMB, 2002). At present, coral reef rubble interspersed with different marine deposits such as siltstone and calcareous mudstone covered most of the island's surface as shown in Figure 1, along with unconsolidated yellow and brown sand from the exposed and degraded coralline seabed in some areas (Goonatilake et al., 2013). The vegetation cover of the island is mainly composed of tropical trees and plants dominated by Asian Palmyra Palms, Phoenix thorny shrubs and grasses that thrive on the island's coralline soil.
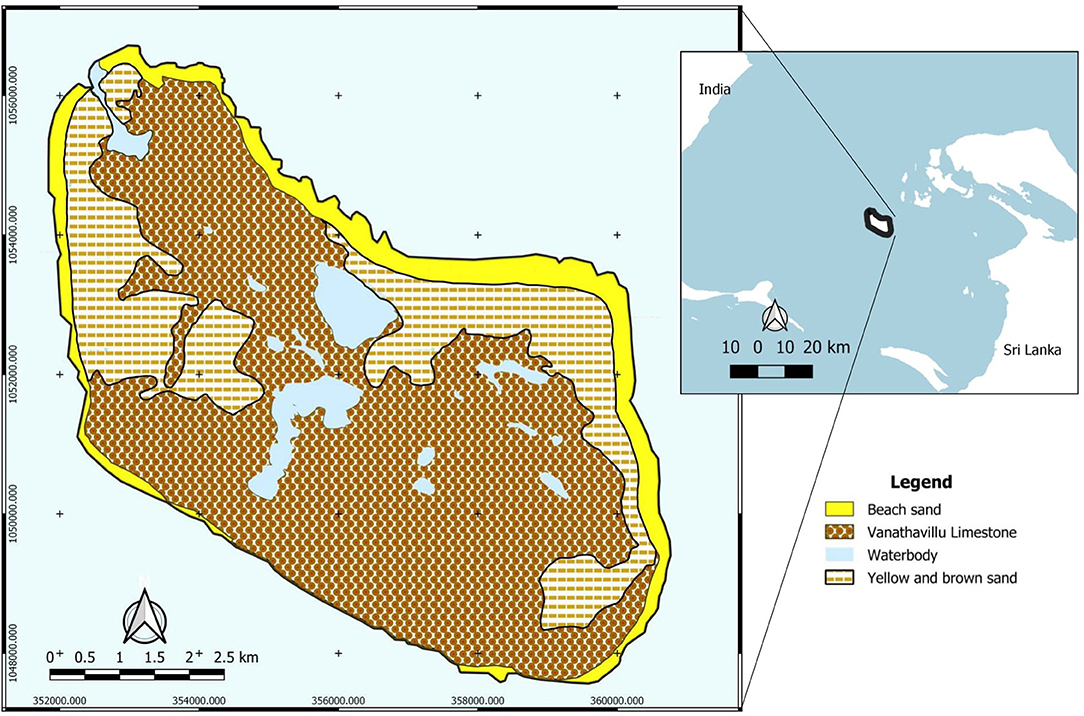
Figure 1. Geological map of Delft Island (Source: Modified from GSMB, 2002).
The ~5,000 residents of Delft manually extract freshwater from hand dug wells for domestic and agricultural purposes (Goonatilake et al., 2013). The estimated volume extracted ranges between 250 and 500 m3/day (OHCHR, 2010). This is extracted mostly during the wet season from about 50 shallow wells (up to 3.7 m deep) that are scattered throughout the island. The two well fields on Delft are comprised of about 12 wells each (Craig et al., 2021). The first well field is located in the Saarapiddy area in the southwest part of the island with coral limestone as the main geological unit of the aquifer. The second well field, locally referred to as Manarthari or Manathi Wells (translates to English as “sand flow wells” from the Tamil language) is situated in a shallow sandy aquifer located in the northeast area. The conceptual model of the possible freshwater lens occurrence in a karstic limestone aquifer and in a sandy aquifer (not to scale) which has similar traits with the identified shallow aquifer in the neighboring Jaffna region is provided in Supplementary Figure A (Cooray, 1984).
Groundwater Level and Recharge Assessment
To verify the areas with a possible freshwater lens, and to evaluate lens thickness and distribution together with possible influences from pumping practices, water levels in wells were measured using sounding devices, before being converted to a hydraulic head using the island's topographic elevation and the mean sea level as the datum.
Recharge assessment was then done to determine the locations where the freshwater lens would be expected to be most developed. First, zones with assumed similar recharge potential were delineated through GIS integration of geology map (Figure 1) and land use/land cover map (Supplementary Figure B). The potential groundwater recharge rate for each zone was then calculated using a soil water balance model (Nonner and and Stigter, 2019) with the 30-year rainfall (CHIRPS; Funk et al., 2014) and potential evapotranspiration data (MERRA-2; Gelaro et al., 2017) from 1990 to 2019 as input. This model calculates the amount of potential recharge derived from rainfall (output) by using as input data the daily rainfall (mm), daily potential evapotranspiration (mm), crop coefficient, depth of root zone and extinction depth (cm), available moisture at field capacity (%), runoff threshold (mm), and groundwater level (m) for the simulation of capillary rise. Input parameters for the model such as crop coefficient, depth of root zone, soil properties (field capacity and permanent wilting point, available moisture), and runoff coefficient were obtained from the available literature and provided as Supplementary Tables A–D.
For this research, the average crop coefficient and depth of root zone for each land use/land cover unit were determined and kept constant for the entire study period to reduce the complexity of the system. In reality, crop coefficient and the depth of root zone vary during the growing period of plants (Food and Agriculture Organization, 1998, 2007), which is particularly relevant for crops. Furthermore, the field capacity (FC) and permanent wilting point (PWP) of different soil types were obtained from Food and Agriculture Organization (2007), and the available moisture content at field capacity was computed as the difference between FC and PWP. For limestone formations it was assumed that the water holding capacity is low, resulting to the quick infiltration of rainwater mainly through the secondary porosity (Ran et al., 2014).
Runoff thresholds for different geological units were computed from literature values of runoff coefficients. The estimated runoff coefficient in a limestone environment was based on the results from the hydrogeochemical characterization of Jaffna's aquifer systems in Sri Lanka (Mikunthan et al., 2013) which suggest that ~33% of rainfall becomes runoff during the rainy season. For beach sand and yellow and brown sand, the average value of runoff coefficients from past studies were considered, in which beach sand was considered to have courser texture resulting in higher infiltration capacity and relatively lower runoff than yellow and brown sand with medium soil texture.
The rate of capillary flow at the root zone is influenced by several factors such as the soil pore size, available soil moisture, depth of water table, and the extinction depth. For shallow groundwater (<3 m) and fine-textured soil, capillary rise can significantly contribute to the loss of water in the aquifer (Bos et al., 2009). Capillary rise was not simulated in this study, because of lack of available data on monthly fluctuations of groundwater level and because the extinction depth is estimated to be relatively small on large part of the island. Therefore, the computed recharge rates correspond to the maximum potential groundwater recharge rate.
The slope and the number of stream segments per unit area, termed as drainage frequency, can also affect the potential groundwater recharge in terms of infiltration and runoff. Steep slope and high drainage frequency can lead to high runoff and thus low infiltration (Bonilla Valverde et al., 2016; Nogueira et al., 2019). However, these were not integrated into this groundwater recharge assessment, since the island is relatively flat (highest elevation of 6 m) and no streams nor rivers were observed during the fieldwork. Lastly, it was assumed that the soil conditions for both limestone (fractured system) and sandy layer (loose sediments at the root zone) satisfied the ‘piston flow' conditions, to allow the use of the soil water balance model.
Water Sampling and Hydrochemical Analysis
Field data collection and sampling of both surface water (ponds and lakes) and groundwater (public and private wells) were conducted. The physicochemical properties of water such as temperature, electrical conductivity (EC), dissolved oxygen (DO), pH, and alkalinity () were measured in the field, along with the estimation of nitrate () using the Quantofix semi-quantitative test strips, mainly because some water quality parameters can change rapidly. The instruments used to measure the different physicochemical properties include the Greisinger portable digital conductivity meters (model GMH 3430) for both EC and temperature, the WTW Oxi 3310 meter for DO and the WTW pH 323 and pH 340i meters for pH. Alkalinity was measured using the HACH titration test kit, with hydrochloric acid as the titrant and bromocresol green/methyl red as the indicator. Groundwater sampling was done by extracting water from the bottom of wells using a polyethylene bailer, while surface water samples were taken from ponds and lakes using a plastic bucket. The water samples were then filtered with 0.45 μm glass microfiber syringe filters. For anion analysis, 25 ml un-acidified polyethylene sampling bottles were used while for cation analysis, 25 ml pre-acidified polyethylene sampling bottles were used for storage. Pre-acidification is essential to keep the analytes of interest in the solution, which was accomplished by putting two to three drops of concentrated nitric acid (10%) into the sampling bottles before the fieldwork to obtain a pH value below 2. Samples were kept in cold storage to limit the degradation of water quality (e.g. oxidation, bacterial growth, precipitation) before the laboratory analysis. Furthermore, samples for the analysis of stable water isotopes oxygen-18 (δ18O) and deuterium (δ2H) were collected and stored in double capped 1.5 ml glass bottles to avoid evaporation during storage and transport. The concentrations of cations and anions (mmol/L) and isotope values were analyzed in the laboratory of IHE Delft following standard procedures. Additionally, the dissolved organic carbon (DOC) of water samples was measured using the combined ASI-V and TOC-V Shimadzu Auto samplers. A detailed description of the laboratory analyses can be found in Craig et al. (2021).
PHREEQC Interactive 3.4.0 (Parkhurst and Appelo, 1999) was used to calculate the ion balance errors, molality, calcite saturation index and partial pressure of CO2 of the water samples. The water type of the different samples was then defined according to the system suggested by Stuyfzand (1989). Surface and groundwater water samples were further classified into facies based on the different physicochemical parameters, using the hierarchical clustering technique (HCA). Several parameters were tested but only these nine parameters showed a significant correlation among samples within the same facies and concurrently high variation between different facies: EC, Na, K, Ca, Mg, Cl, SO4, NO3, and pollution index (PI). PI reflects the presence of contaminants from agricultural runoff, manure and organic matter, as well as wastewater infiltration. Additional explanations on HCA can be found in Swanson et al. (2001), Güler and Thyne (2004), Andrade and Stigter (2011), and Ghesquière et al. (2015). The resulting hydrochemical facies were visualized in plots and diagrams to facilitate the discussion of results. A redox index (RI) for each water type was also determined, based on the presence of constituents that are sensitive to reduction-oxidation such as O2, , Mn2+, Fe2+, , H2S, and CH4 (Stumm, 1984).
The water facies were also categorized depending on their usability. For potable freshwater, the upper threshold value was set to 2,000 μS/cm which is the recommended value according to local standards (Herath, 2014). A threshold value of 10,000 μS/cm was set as the reference EC in this research to distinguish between usable brackish water (below the threshold) and saline water (equal to or above the threshold). This threshold was based on firstly, observations during the fieldwork where groundwater, from wells with EC value of up to 9,500 μS/cm, was extracted for domestic purposes such as bathing and washing clothes and dishes. Secondly, the maximum tolerable value of EC in irrigated water for salt-tolerant crops and for some livestock such as cattle and horses that are adapted to high water salinity (MRCCC, 2013).
Results
Table 1, Figure 2 present the demarcated zones with homogenous recharge potential and their different characteristics. The spatial distribution of the average annual potential groundwater recharge rate is shown in Figure 3. The lowest computed value is 30 mm/year while the highest computed value is 530 mm/year. The zone with the lowest computed recharge value (lightest in color) is 5C, Palmyra woodland on limestone, while the zone with the highest computed recharge value (darkest in color) is 1A, coastal vegetation on the sandy shore. For zone 3B, the temporal variation of recharge rate (mm/year) for 30 years is shown in Figure 4. The maximum recharge rate of 690 mm/year occurred in 2010. The plot reveals the high variability in rainfall, which is also reflected in calculated potential recharge. Actual evapotranspiration (ETact) was more stable with an average of 540 mm/year. Runoff was prominent in years of high rainfall (e.g., 1993, 2005, 2008). For zones 3B and 4C, the annual recharge potential as a percentage of rainfall was plotted against the number of rainy days (Figure 5A) and annual average daily rainfall intensity (mm/d) (Figure 5B). The figures show the correlation between rainfall and potential recharge, with a positive link between the number of rain days and potential recharge (as a percentage of rainfall). Potential recharge rates were reduced either because of low rainfall intensity (e.g., 2018 and 2015, see red arrows in graphs) or very high intensity (e.g. 1993). The optimal combination for recharge is a high number of rain days with intermediate intensity, in particular for zone 4C, with lower infiltration capacity.
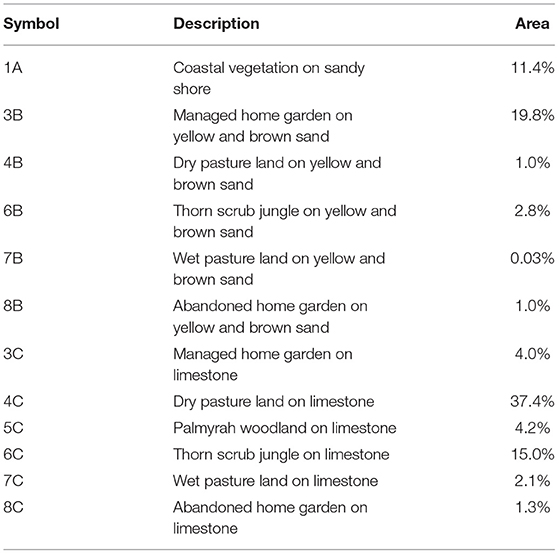
Table 1. Description of the identified zones based on characteristic recharge potential.
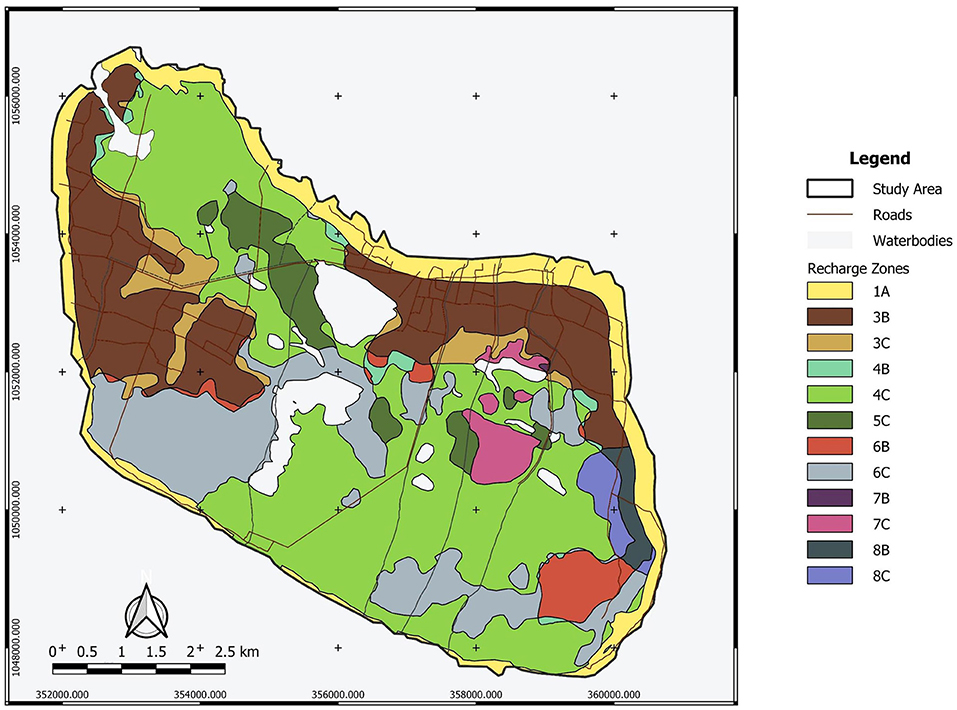
Figure 2. Identified zones on Delft Island based on characteristic recharge potential.
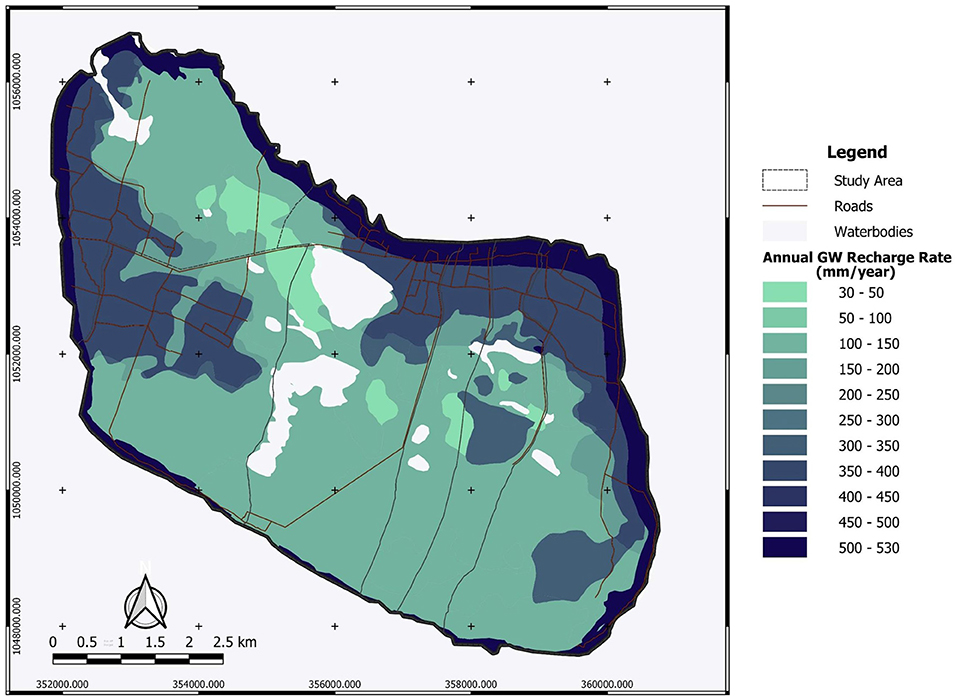
Figure 3. Average potential annual groundwater recharge rate on Delft Island (mm/year) based on 30-year data (1990 to 2019).
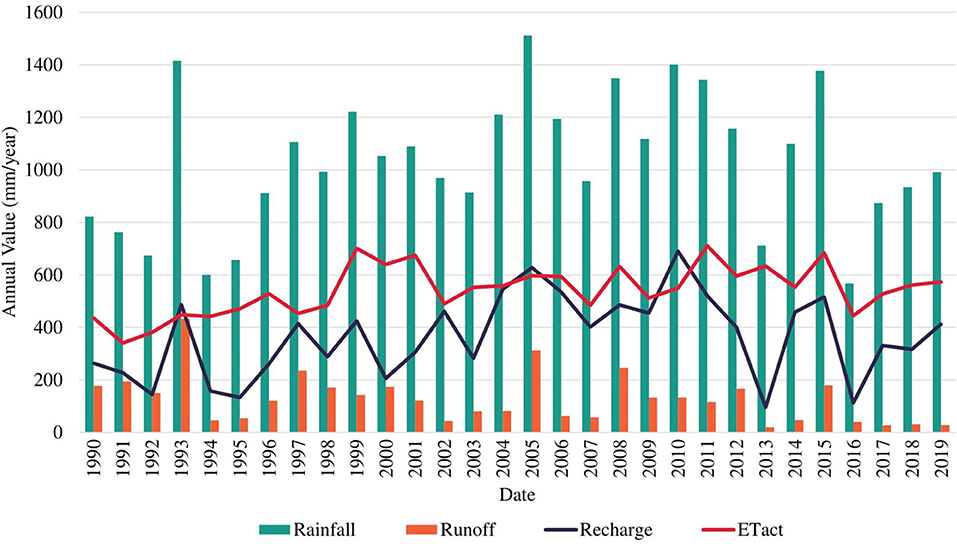
Figure 4. Temporal variation of average annual rainfall, runoff, actual ET, and potential groundwater recharge (mm/year) in zone 3B.
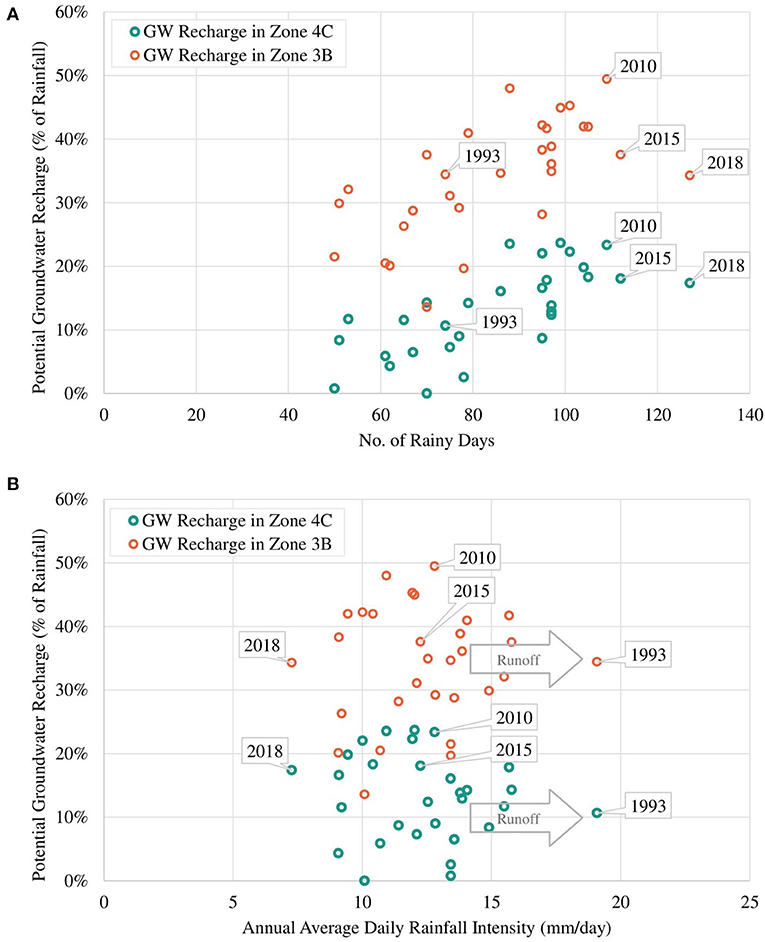
Figure 5. Annual potential recharge vs. number of rainy days (A) and rainfall intensity (B) in zones 3B and 4C.
In terms of hydraulic head, maximum values were found to be 3.68 masl, located in the eastern part of the island with relatively high elevation (4 m) while the minimum hydraulic head was computed as −0.98 masl located along the eastern coast (Figure 6). Hydraulic heads of about 3 masl were also observed in western and northeastern parts of the island that correspond to relatively high elevations in these areas (4 masl). The accuracy of the digital elevation model used (+/– 1 m) must be taken into consideration when interpreting the hydraulic head values.
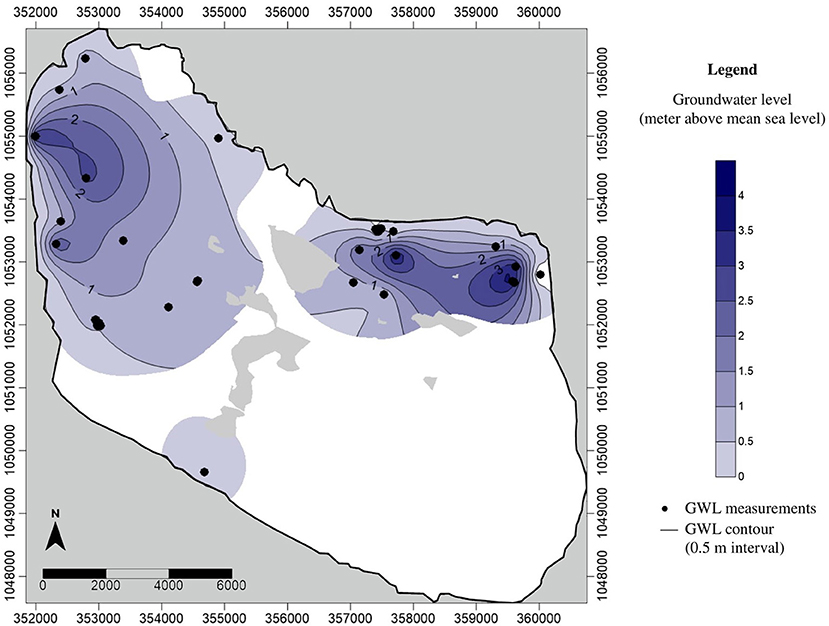
Figure 6. Groundwater head contour map of Delft Island based on measured water levels in the field.
Concentration of cations and anions obtained from laboratory measurements were reported in mmol/L. The main parameters and characteristics of the five major water facies (WF) identified are presented in Table 2. It can be observed from the table that only the WF-1 is considered freshwater with CaHCO3 as the dominant water type. The other WF ranged from usable brackish to brackish salt with NaCl as the dominant water type. Furthermore, all of the WF is supersaturated with calcite based on saturation index, with only two samples having equilibrium saturation. The representative dendrogram and the Stiff diagram of the mean composition of each facies are illustrated in Figure 7 along with some parameters. The majority of the samples were of NaCl-subtype (81% or 34 out of 42 samples) varying from usable brackish (41% or 14 out of 34 samples) to brackish salt (59% or 20 out of 34 samples) based on chloride concentration. Usable brackish water is the water being used in domestic activities but has a Cl− concentration between 300 to 1,000 mg/L, which is above the freshwater limit of 300 mg/L. Three samples are CaHCO3-subtype including the sample considered as the freshest water, one (1) CaCl-subtype, two (2) CaMix-subtype, and two (2) MgCl-subtype with varying concentration of Cl− from fresh-brackish (about 56 mg/L) to usable brackish (about 800 mg/L). All the samples were found to be supersaturated with calcite and dolomite as the SI values were above 0 ± 0.2 (Appelo and Postma, 2005). Furthermore, 29% of samples have a positive (freshening) Base Exchange index (BEX) while 33% have negative (salinization) BEX, and the remaining 38% showed no base exchange. The redox index of all facies falls within the redox cluster of 0–2 indicating oxic to suboxic conditions (Appelo and Postma, 2005). The Piper plot provided as Supplementary Figure C showed that all the water facies, except for WF-1, plot within the NaCl zone which indicates that Cl− and alkalis (Na+ + K+) dominated over and alkaline earth metals (Ca2+ + Mg2+). WF-1 waters, on the contrary, are mostly in between the CaHCO3 and NaCl zones implying the mixing of fresh and saline water. Moreover, the plot of Ca2+/ and Na+/Cl− in Figure 8 can be used to identify samples with cation exchange triggered by freshening or salinization. Samples D13W6S6, D15W2S3, and D16W3S2 have Na+ to Cl− ratio that is clearly above the conservative seawater mixing ratio of 0.86 and Ca2+ to ratio that is clearly below the conservative calcite dissolution ratio of 0.5. Whereas samples D15P6S7, D16W8S7, D16P1S5, and D13W4S4 have Na+ to Cl− ratio that is visibly below 0.86 and Ca2+ to ratio that is visibly above 0.5. The relatively high PI of surface water samples resulted from the high measured pH value (pH > 8.5) while elevated and concentrations led to the PI increase of groundwater samples. The spatial distribution of concentration in SW and GW samples is presented in Supplementary Figure D, labeled with the concentration based on field strip test for comparison. Increased levels of nitrate concentration above the permissible limit for safe drinking water of 50 mg/L of were observed both in the field and laboratory measurements.
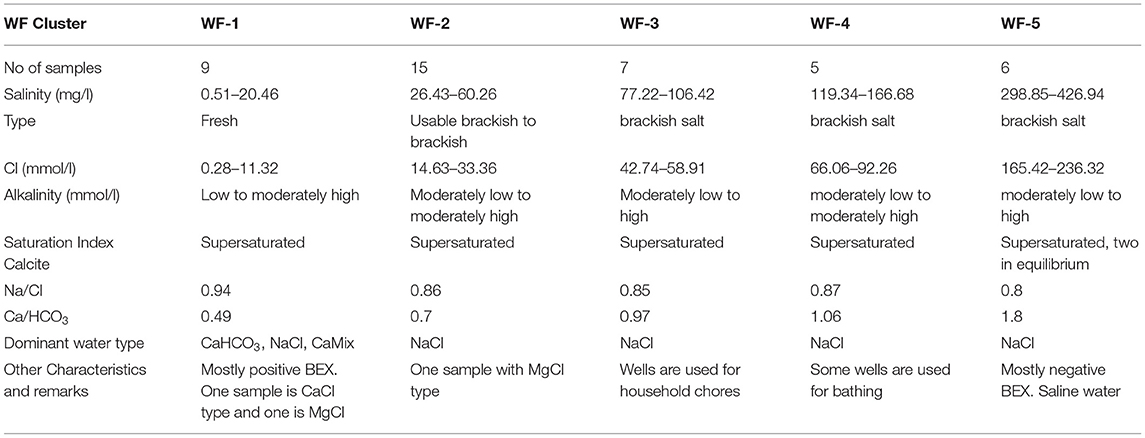
Table 2. Main characteristics of the five classified water facies on Delft Island.
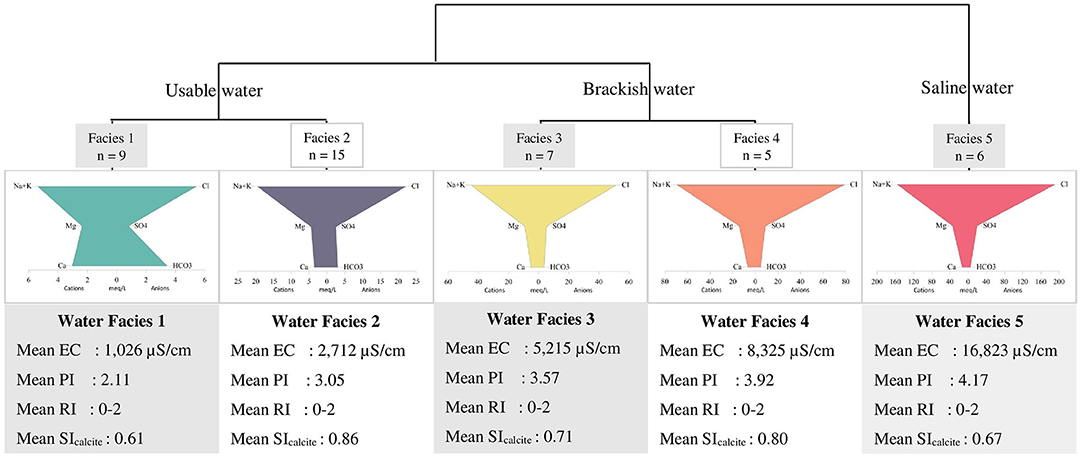
Figure 7. Dendogram of classified facies with representative Stiff diagrams (in meq/l). The sample size is denoted as n, electrical conductivity as EC, pollution index as PI, redox index as RI, and saturation index as SI.
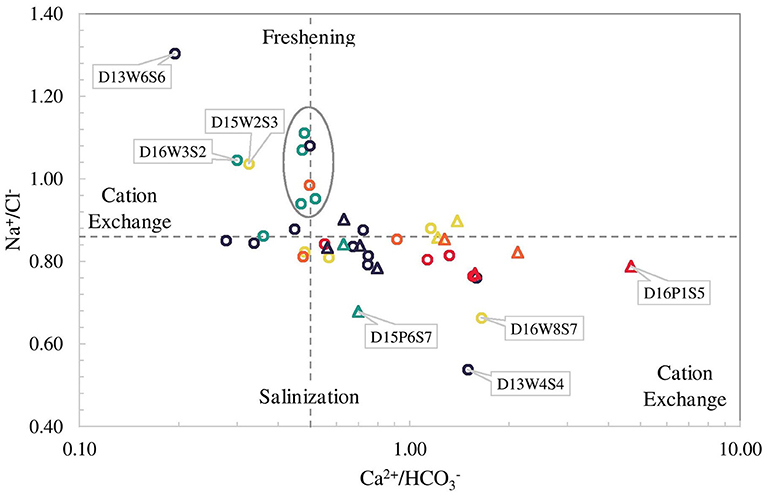
Figure 8. Plot of molar Ca2+/ against Na+/Cl− ratios with conservative calcite dissolution and seawater mixing lines (dash lines).
Figure 9 shows the distribution of the electrical conductivity (EC) of surface water (A) and groundwater (B) on the island with the circle size corresponding to an EC value. The EC values of surface water range from 240 μS/cm, measured in ponding water in the south of the conservation area, up to 32,100 μS/cm measured at the east side of Veddukali Lake. In turn, the EC of groundwater in the island ranges from 445 μS/cm (D5W7S4) up to 20,200 μS/cm (D13W5S5). The Saarapiddy area in the southwest of the island contains the freshest groundwater. The spatial distribution of the identified water facies, labeled according to Stuyfzand's water type classification, is illustrated in the Supplementary Figure E with a distinction between the surface and groundwater samples. The two major well fields have WF-1 and WF-2 samples except for one WF-3 sample and one WF-4 sample in the Manathi well field. WF-3 is more prominent in the western part of the island whilst WF-1 and WF-2 dominate the eastern and southern part of the island. WF-4 and WF-5 are mostly found in the northern part of the island where most of the locals are situated.
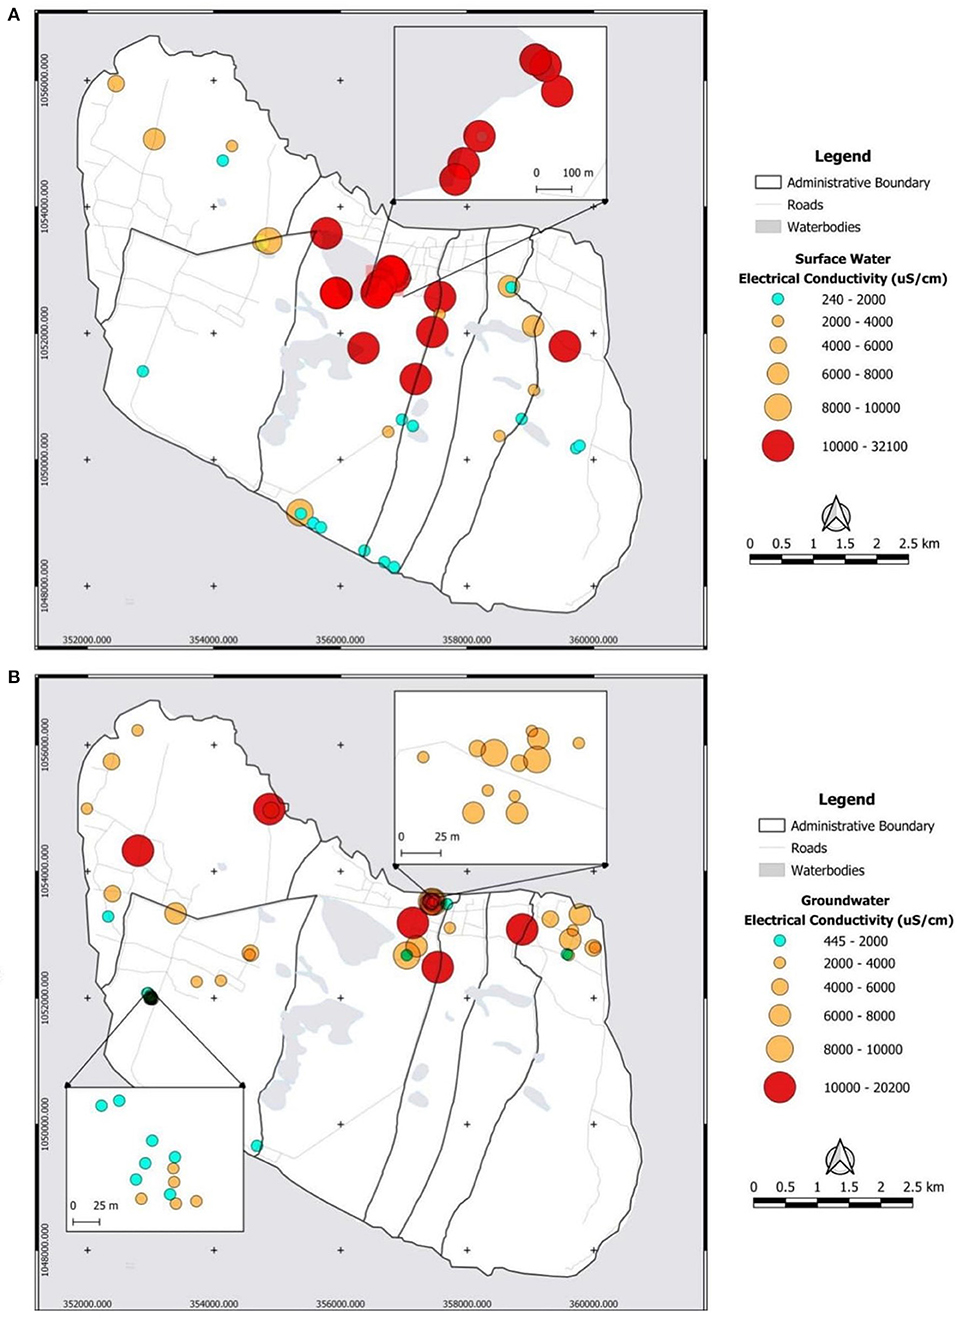
Figure 9. Electrical conductivity (μS/cm) distribution of surface (A) and groundwater (B) on Delft Island.
The plot of Cl− vs. log pCO2 (partial pressure of CO2) in Figure 10 shows the log pCO2 values in groundwater ranging from the upper limit of −1.5 for groundwater in contact with soils of high biological productivity to the lower limit of −3.5 for atmospheric conditions (Appelo and Postma, 2005). The plot further reveals that high and intermediate partial CO2 pressures are found in both saline and fresh groundwater. The plot of Cl− concentration (mmol/L) against δ18O composition (‰) in Figure 11 shows that pristine fresh groundwater has a more depleted δ18O composition, but that quite a few samples are affected by evaporation, other samples affected by the conservative mixing with seawater and yet others affected by both processes.
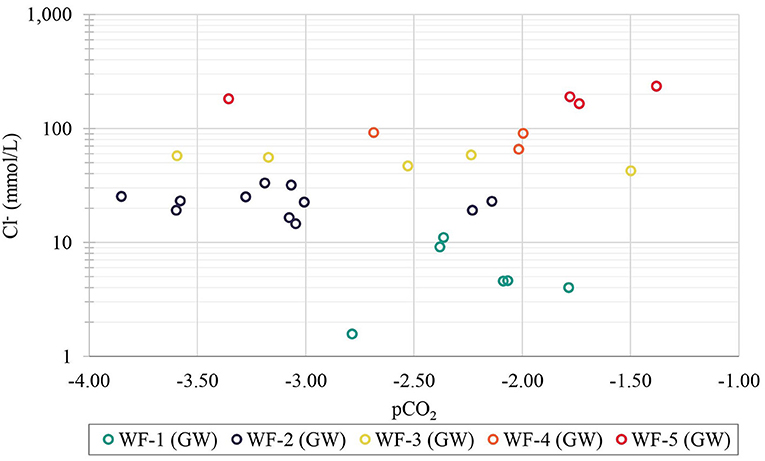
Figure 10. Plot of Cl− (mmol/L) against partial pressure of CO2 (pCO2) for groundwater samples on Delft Island.
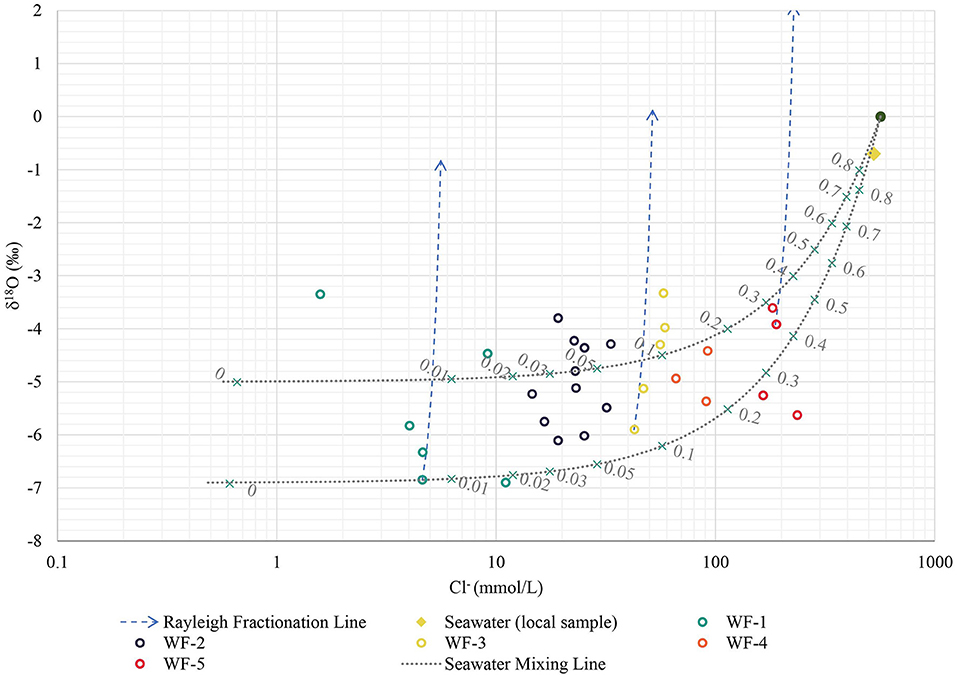
Figure 11. Plot of Cl− against δ18O with conservative seawater mixing lines.
Discussion
Freshwater Lens Development and Characteristics
Areas with relatively high potential groundwater recharge can be suitable sites for freshwater lens formation and development as increased groundwater recharge positively affects the freshwater lens thickness as derived from the Badon Ghijben-Herzberg principle (Ghyben, 1889; Herzberg, 1901; Pauw, 2015). The zone with the highest average annual potential recharge (50% of rainfall) is 7B, wet pasture land on yellow and brown sand, but the zone with the highest maximum annual recharge (62% of rainfall) is 1A, coastal vegetation on the sandy shore. This very high value is typically related to permeable sands with very high infiltration capacity and very low water holding capacity, resulting in extreme values of potential recharge during wet years with high rainfall intensity (Assouline, 2013). In zone 3B, the maximum recharge rate of about 690 mm/year occurred in 2010 with relatively low runoff. This was caused by a more uniformly distributed rainfall. A higher number of rain days and higher rainfall intensity do not necessarily correspond directly to a higher groundwater recharge rate (Wang et al., 2015; Asoka et al., 2018) as the distribution of rainfall throughout the year affects the amount of water lost through runoff (e.g. intense rainfall within a short period will result in a higher runoff than rainfall occurring within a longer period). This was further observed in zones 3B and 4C (Figures 5A,B), for the years 1993, 2015, and 2018 where more rain days and higher annual rainfall intensity (mm/day) resulted in higher runoff and lower recharge rate as compared to other years (e.g. 2010). This shows that moderate rainfall intensity with a high number of rain days provides the highest potential recharge, whereas high rainfall intensity but a low number of rain days results in high runoff and thus low recharge. Moreover, the lowest recharge occurs from the combination of low rainfall intensity and a low number of rain days.
The land use/soil unit with the lowest average annual recharge and the lowest minimum annual recharge, based on % rainfall, is 5C (Palmyra woodland on limestone) due to the assumed low runoff threshold value for limestone, combined with a relatively deeper root zone and high evapotranspiration rate of Palmyra trees. The low recharge potential of the coral reef limestone soil seems to contradict with previous studies on high effective infiltration rates for karstic aquifers (e.g. LaMoreaux et al., 1984; Bakalowicz, 2005; Alem et al., 2021). It is likely that the topography does not allow the development of clear karst features that promote infiltration, such as dolines or sinkholes (Goldscheider, 2015). Moreover, limestone and dolomite have higher horizontal than vertical hydraulic conductivity (Domenico and Schwartz, 1990) which can lead to high runoff even when karstified, in particular in the absence of surface karst features and shallow groundwater tables, as is the case on Delft Island. In addition, subsurface runoff triggered by a lower permeability of deeper coral layers, such as observed on coral atolls (Vacher and Quinn, 2004; Cui et al., 2021), is possibly also important. It should be observed that for the areas with limestone outcrops (observed during the field campaign) the results of the soil water balance method are overall of lower reliability, as here recharge frequently occurs through bypass flow. This is further revealed by the low CO2 pressure of certain freshwater samples, a result of direct infiltration of rainwater into the karstic limestone aquifer with little interaction with the soil zone.
The computed potential groundwater recharge rates were relatively high. A previous study estimated that the recharge rates of groundwater in the Jaffna District's limestone aquifer ranged from 23% to 25% of the annual rainfall using the soil moisture balance method, and ranged from 19% to 27% of the annual rainfall using the water table fluctuation method (Mikunthan and De Silva, 2009). Due to this, asensitivity analysis was conducted which revealed that the potential groundwater recharge rate is highly sensitive to the decrease in the runoff threshold value, which is highly dependent on the infiltration capacity of the soil, topography and vegetation (dry pasture land occurring in large part of the outcropping limestone area may also reduce the surface water retention and infiltration capacity). Hence, a better assessment of runoff and further studies on the characterization of the flow zones in Delft Island's limestone aquifer could result to a more accurate estimate of the potential groundwater recharge.
The computation of the potential groundwater recharge rates also does not account for ET from capillary rise, which could lead to an overestimation of the actual recharge values. Notwithstanding, the relatively low clay content in the soils of the study area will result in a relatively shallow extinction depth and limited capillary action.
In general, potential groundwater recharge is higher than the actual groundwater recharge as the potential recharge only considers the percolation of water through the unsaturated zone while the actual recharge considers the water reaching the water table which directly contributes to the groundwater reservoir (Lerner et al., 1990; Rushton, 1997). Hence, potential recharge may still be subjected to losses such as uptake of root zone, interflow, and surface discharges before being able to reach the aquifer (Healy, 2010). Long-term monitoring of the groundwater table fluctuation, and the actual rainfall, runoff and ET rates on the island, along with a more detailed study of the hydraulic properties of the soil and aquifer, are necessary for a more accurate assessment of actual groundwater recharge, ideally using alternative estimation methods (Walker et al., 2019).
It was observed from the spatial distribution of hydraulic heads (Figure 6) that the recharge zones or areas with relatively higher hydraulic heads are at the edge of the island. This coincides with the findings from the recharge assessment where the highest maximum annual recharge occurs at the coastal vegetation on the sandy shore sediments. This setting can negatively impact the freshwater lens thickness as this can result in a faster discharge into the ocean than into the discharge zones within the island. This is one of the reasons why the observed lens thickness does not correspond to that obtained by analytical calculations for circular islands, and the corresponding numerical modeling results (Craig et al., 2021). Delft island is irregularly shaped, with low-lying central part of the island built up of coral reef limestone, and the higher areas (up to 4–5 m above mean sea level) right at the coast. Outflows of fresh groundwater to the sea at the perimeter of the aquifer will reduce the potential for use of the recharged freshwater (White and Falkland, 2009). Moreover, one well located at the eastern part of the island has a negative head (−0.98 m). This well was also characterized by saline water (high EC). This could be the result of overpumping of water which was observed during the field work. A household near this well was operating a water pump continuously throughout the day at the time of water sampling. However, the accuracy of the digital elevation model used could also be the reason for the calculated negative head.
Salinization Mechanism
In coastal aquifers such as the freshwater lens of Delft Island, a high EC value is usually an indicator of the presence of saline water as the ions dissolved in these aquifers after salinization are predominantly Na+ and Cl− (Nogueira, 2017). It must be noted that the freshwater-saline water interface in groundwater is not a sharp boundary but exists as a mixing zone consisting of brackish water due to diffusion processes and mechanical dispersion (Custodio and Bruggeman, 1987; Voss and Souza, 1987; Nowroozi et al., 1999). The observed high EC values of the shallow wells (Figure 9), with low EC values of surrounding wells, that are closer to the ocean, can be an indication of saltwater upconing caused by unregulated extraction or overexploitation of groundwater in some areas where pumping of groundwater by households was observed, or the digging of some wells deeper than the freshwater lens and reaching the fresh and brackish water interface. Salinization of groundwater in small pacific islands due to over-pumping is not unusual and has been the focus of several studies (White et al., 2002; Aris et al., 2007; Praveena and Aris, 2009; White and Falkland, 2009).
Salinization of surface water in the north-central part of the island can be the result of flooding of seawater such as backwater flow from the sea and into the ponds through the canals near D16P1S5 (lake) and D14P7S5 (pond) during high tide (according to local interviews). Saltwater intrusion can also be caused by storm surges and overwash, resulting in flooding of areas inland, thereby increasing both the salinity of surface and groundwater (Werner et al., 2013). An example would be the tsunami event in 2004 during which the seawater was reported to have inundated the low-lying areas, and entered the aquifers through the open wells in greater part of Sri Lanka, including the Jaffna Peninsula. The intruded seawater, due to forced and free convection, vertically mixed in the aquifers rendering the wells unusable and thus prompting the locals to conduct a widespread pumping of wells in Sri Lanka which then resulted to saline water upconing (Llangasekare et al., 2006). Interviews with locals revealed that some areas on Delft Island also experienced inundations due to overwash, which seems to be reflected by the co-occurrence of high values of salinity, alkalinity and partial CO2 pressure in some of the groundwater samples (Figure 10). Such co-occurrence hints on the interaction of saline water with the soil, the most likely source of CO2 from organic matter oxidation (Hilberg et al., 2013), and open-system calcite dissolution. Freshwater lenses of low-lying islands such as Delft Island are particularly vulnerable to salinization caused by storm surge overwash, which in some cases puts greater pressure on the development of the fresh-saline mixing zone than tidal oscillations (Terry and Falkland, 2010; Wilson et al., 2011).
An increase in the relative concentration of ions can also be caused by evapoconcentration (Nogueira et al., 2019). Analysis of the stable water isotopes in Delft island (Figure 11) revealed that many of the groundwater samples plot within the range of conservative seawater mixing line which suggests that the increase in Cl− concentration was caused mainly by mixing of groundwater with seawater (Craig et al., 2021) with low partial CO2 pressure (Figure 10). Groundwater samples plotting above the seawater mixing line have enriched isotope concentrations, which is caused primarily by evaporation (Yuan et al., 2011; Horton et al., 2015). The enrichment of stable water isotopes corresponding to groundwater evaporation can be linked to either the way groundwater was recharged or how exposed groundwater is through the wells, or the combination of both (Bhandary et al., 2012). According to Kamai and Assouline (2018) evaporation can also be related to a shallow water table depth, which could play a minor role at the start of the dry season, when groundwater levels are high. In contrast, transpiration will not result in isotopic fractionation. It must be noted that the complete interpretation of Figure 11 relies on the plot of δ2H and δ18O which can be found in a parallel study (Craig et al., 2021). Here the relatively depleted composition of the groundwater samples as compared to the average composition of modern precipitation was confirmed and suggested to be a result of preferential recharge occurring during the wet season when rainfall isotope composition is relatively depleted, as also found by Han et al. (2014).
The identified water facies (Figure 7) can be categorized into three groups when considering the use of water observed during the fieldwork (only for well samples as there was no observed extraction of surface water in Delft Island). WF-1 and WF-2 were used by locals mainly for domestic purposes such as drinking, washing, and other household chores, hence these were classified as usable water. Well samples under WF-3 and WF-4 were found to be brackish to brackish-saline, hence considered as brackish water. However, some of the wells with brackish water were still utilized by locals for bathing during short periods in the wet season. WF-5 was considered as saline water due to significant Cl− content (>5,800 mg/L), and these wells are mostly public bathing wells with no observed users (abandoned wells). The pattern of saline water (WT-5) in the Stiff diagram (Figure 7) revealing a NaCl-type also characterizes the brackish water types (WT-3 and WT-4) and WT-2 showing evidence of saltwater mixing. This is in agreement with the isotope hydrochemistry findings where it was observed that the increase in salinity is caused mainly by seawater intrusion (from fresh WF-1 to saline WF-5), while the enrichment of heavier isotopes is related to evaporation (WF-1) and mixing with seawater (WF-2 to WF-5). The high concentrations of Na and Cl even in WF-1 (freshwater samples) and WF-2 (usable brackish water samples) are mainly due to the source from coastal rainwaters (WF-1) and mixing with more brackish water (WF-2).
Cation Exchange Revealing Salinization and Freshening
Aside from the enrichment of cations and anions through evaporation, seawater mixing, and mineral dissolution, changes in the final composition of water originally in equilibrium with its surrounding can cause ion exchange. During displacement of freshwater (salinization) or saltwater (freshening) in aquifers, solute cations initially adsorbed in clay and organic matter (or in oxy-hydroxides) can be separated due to exchange of cations, and this phenomenon is known as ion chromatography (Beekman, 1991; Appelo and Postma, 2005). Seawater intrusion generally leads to an increase in the concentration of Ca2+ and decrease of Na+ in water (exchange of Ca2+ by Na+ on the exchange complex) causing a shift toward Ca-Cl2 water type, while freshening is vice versa (exchange of Na+ by Ca2+ on the exchange complex) causing a shift toward NaHCO3 water type (Appelo and Postma, 2005). Groundwater samples (GW) plotted above the mixing line in Na+ vs. Cl− (Figure 8) have a positive Base Exchange Index (BEX) which suggests that these were driven by the freshening of the aquifer with an exchange of Ca2+ from the water to the adsorbed Na+ in the clay minerals and organic matter (Stuyfzand, 1989). The clay minerals seem to originate from the dissolution of argillaceous limestone, or limestone with an appreciable amount of clay but not exceeding 50% of the total composition (Neuendorf et al., 2005), which comprised the base of Delft Island (Cooray, 1984). Organic materials, mainly horse and cow manure, were frequently observed scattered throughout the island during the field visit. In contrast, the GW samples plotted below the mixing line in Na+ vs. Cl− (Figure 8) have negative BEX which is usually an indication of seawater intrusion with an exchange of Na+ in the water to the adsorbed Ca2+ in the clay or organic particles (Stuyfzand, 1989). The observed positive and negative BEX of different groundwater samples showed no spatial pattern (Supplementary Figure F). This could indicate a complex combination of vertical and horizontal seawater intrusion, as well as preferential flow in the coral reef limestone. The freshening of encircled samples in Figure 8 seems evident from the plot of Ca2+/ vs. Na+/Cl−. These GW samples were taken from wells located in areas with relatively high computed potential recharge (i.e. two WF-1 samples at the westernmost part, two WF-1 samples at the northernmost part, one WF-2 sample and one WF-4 sample at the easternmost part of the island). The measured salinity in these wells can be an indication of previous intrusions of saltwater caused by the extraction of water during the dry season or possibly a remnant of the past tsunami, while the wet season precipitation causes freshening. In addition, samples with Na+ to Cl− ratio above 0.86 and Ca2+ to ratio below 0.5 are possible signs of freshening with induced cation exchange, while samples with Na+ to Cl− ratio below 0.86 and Ca2+ to ratio above 0.5 are possible indications of saltwater intrusion with induced cation exchange. Freshening of well samples D13W6S6, D16W3S2, and D15W2S3 with cation exchange seems apparent. These wells are located in areas with yellow and brown sand, based on the geology map. However, the main aquifer unit is believed to be argillaceous limestone which contains clay particles with adsorbed Na+ from the previous salinization. These wells are private wells which, according to local accounts, occasionally turn brackish especially during the dry season. Natural thinning of the freshwater lens occurs due to the continuous discharge of freshwater into the sea as hydraulic losses at the edges of the island. Without groundwater recharge, such as during the dry season, this will result in a thin freshwater lens and increased mixing zone caused by tidal forcing and dispersion (White and Falkland, 2009; Stöckl and Houben, 2012). Precipitation during the wet season in the relatively high potential recharge zone could then have triggered the freshening of the aquifer. Meanwhile, two GW samples D16W8S7 and D13W4S4 and two SW samples D16P1S5 and D15P6S7 suggest seawater intrusion with possible cation exchange. Aside from the potential intrusion of seawater through upconing, intrusion of brackish water from the relatively brackish lakes and ponds and into the GW through seepage and percolation can result in salinization of the aforementioned wells, which consequently triggers cation exchange.
Nitrate Contamination
On Delft Island, elevated nitrate concentrations in surface and groundwater samples were observed (maximum of 155.6 mg/l), which indicate anthropogenic inputs, possibly from wastewater from domestic septic waste (Xiao et al., 2017) or manure fertilizer used in managed home gardens, known to lead to extensive pollution of nitrogen in groundwater (e.g. Rivett et al., 2008; Ibanhez et al., 2021). The most probable source of on Delft Island is domestic wastewater due to the lack of wastewater management, which is substantiated by high dissolved organic carbon (DOC) in surface and groundwater samples. Elevated levels of above the permissible limit of 50 mg/l for drinking water (WHO, 2011) were especially observed in the wells of the Manathi well field area characterized by the occurrence of a freshwater lens in the shallow sandy aquifer.
The enzymatic oxidation of , from wastewater, manure or mineral fertilizers results in the production of by nitrifying microorganisms in the process of nitrification which can then lead to water contamination through leaching (Galloway et al., 2008; Zendehbad et al., 2019). The elevated concentration of WF-3, WF-4, and WF-5, along with higher Ca2+ concentration (excess Ca2+ as compared to simple calcite dissolution) could suggest the role of cation exchange induced by seawater intrusion in the aquifer. Seawater intrusion is known to trigger the adsorption of Na+ onto the sediment complex with simultaneous release of Ca2+ and , resulting in mobilization of . This could be followed by nitrification if oxic conditions of the aquifer prevail, leading to elevated concentrations, or otherwise remain as ammonium. The release of from sediment sorption sites due to seawater intrusion has been reported in various studies (Gardner et al., 1991; Zhou et al., 2016; Widney et al., 2019).
If not remedied, excess nutrient loads in water can lead to the deterioration of coastal ecosystems when polluted groundwater discharges into the sea. This could promote excessive algae growth, known as eutrophication, and lead to subsequent depletion of available oxygen in the water by decomposing organisms (hypoxia), ultimately causing the death of aquatic organisms (Paerl, 1997; Lapointe et al., 2005; Teichberg et al., 2010; Su et al., 2012). Additionally, drinking water with high levels of (above 50 mg/l) can result in health-related problems, especially for infants (blue baby disease) (Al-Absi, 2013).
Conclusions
The thin freshwater lens on Delft Island is highly susceptible to seawater intrusion due to the low-lying nature of the island and the corresponding low hydraulic heads. Other factors playing an important role in increasing the island's susceptibility, despite its high rainfall, are a long dry season, a high aquifer permeability, the location of high recharge areas at the fringes of the islands, overwash from storm surges (in particular those associated with tropical cyclones), mixing with the underlying seawater due to tidal actions, and possible overexploitation of the groundwater by shallow well extractions. Hence, the development of sustainable water resources management plan is essential in preventing the total deterioration of available freshwater in the island.
The hydrochemical study also suggests that the water quality is mostly affected by the low-lying nature of the island, the small hydraulic heads, the shallow depth of the marine water and the presence of the lagoons in the center which are inferred to be in hydraulic continuity with the ocean. Of additional importance are evaporation of surface water and local overexploitation of groundwater. High alkalinity and CO2 pressure together with high salinity in several samples is hypothesized to be evidence of storm surges infiltrating into the soil zone. Carbonate mineral dissolution affects the freshwater chemistry, and cation exchange shows indications of salinization on some parts of the island and freshening on other parts, further revealing the competition between high rainfall/recharge and the factors triggering seawater intrusion. On the one hand, groundwater salinization through local upconing of seawater was observed in public wells situated mostly in areas with low elevation, indicative of groundwater overexploitation. On the other hand, freshening was observed in some wells situated in areas near the coast due to high potential groundwater recharge in these zones. Elevated nitrate and dissolved organic carbon concentrations in water samples reveal the presence of contaminant sources including animal manures, domestic wastewater, and agricultural runoff. If not remedied, excess nutrient loads in water can lead to the deterioration of coastal ecosystems through eutrophication and hypoxia. Drinking water with excess nitrate (above 50 mg/l) can also cause a number of health-related problems. The presence of nitrate in some groundwater samples under highly aerobic conditions, along with low pCO2 values (near atmospheric values) reveal the possible rapid interaction of groundwater with surface water.
Technical measures can be considered to prevent or control saltwater intrusion. These may include storm surge barriers, horizontal or skimming wells with relatively low discharges to prevent the upconing of saltwater, and hydraulic barriers (freshwater injection wells and seawater pumping wells). Freshwater can be injected (preferably further away from the coast) during the wet season when water is abundant and seawater that is pumped out can be processed in the reverse osmosis plant situated on the island. The effect of some of these measures in the freshwater lens thickness has been modeled and discussed in previous studies, but technical and financial supports, as well as coordination among various government and non-government units, are necessary to implement these measures.
Data Availability Statement
The original contributions presented in the study are included in the article/Supplementary Material, further inquiries can be directed to the corresponding author.
Author Contributions
CW designed the study, collected, analyzed data, and prepared the manuscript. TS conceived the study, offered supervision on study design, data collection, analysis, funding, and manuscript preparation. SC assisted in field data collection and sample preparation for laboratory analysis. All authors contributed to the article and approved the submitted version.
Funding
The Dutch Organization for Internationalisation in Education provided the financial support for study as scholarship. The Embassy of the Netherlands and the Dilmah Conservation in Sri Lanka funded the field data collection.
Conflict of Interest
The authors declare that the research was conducted in the absence of any commercial or financial relationships that could be construed as a potential conflict of interest.
Publisher's Note
All claims expressed in this article are solely those of the authors and do not necessarily represent those of their affiliated organizations, or those of the publisher, the editors and the reviewers. Any product that may be evaluated in this article, or claim that may be made by its manufacturer, is not guaranteed or endorsed by the publisher.
Acknowledgments
We would like to thank Nuffic, professors at IHE Delft, The Embassy of the Netherlands, Dilmah Conservation in Sri Lanka, District Secretariat of Jaffna in Sri Lanka, and the Jaffna University for all the valuable contributions for this research.
Supplementary Material
The Supplementary Material for this article can be found online at: https://www.frontiersin.org/articles/10.3389/frwa.2022.832227/full#supplementary-material
Supplementary Figure A. Conceptual model of the possible occurrence of the freshwater lens.
Supplementary Figure B. Land classification map of Delft Island as observed during wet season (Source: Modified from Goonatilake et al., 2013).
Supplementary Figure C. Piper plot showing water samples classified into different water facies.
Supplementary Figure D. Spatial distribution of concentration (mg/l) of surface and groundwater samples.
Supplementary Figure E. Spatial distribution of the different water facies identified in Delft Island.
Supplementary Figure F. Spatial distribution of base exchange index (BEX) of surface and groundwater samples.
Supplementary Table A. Crop coefficient for each land use/land cover unit.
Supplementary Table B. Average depth of root zone for each land use/land cover unit.
Supplementary Table C. Soil properties of each geological unit.
Supplementary Table D. Estimated runoff threshold (mm) based on percentage of rainfall lost as runoff.
References
Al-Absi, M. (2013). Blue baby syndrome. Pediatr. Health 8, 339–404. Available online at: https://www.researchgate.net/publication/342820505
Alem, H., Soudejani, A. E., and Fallahi, M. (2021). Estimate the amount of ground water recharge in hard formations, case study: Mashhad, Iran. Appl. Water Sci. 11, 6. doi: 10.1007/s13201-020-01317-w
Andrade, A. I. A. S.S., and Stigter, T. Y. (2011). Hydrogeochemical controls on shallow alluvial groundwater under agricultural land: case study in Central Portugal. Environ. Earth Sci. 63, 809–825. doi: 10.1007/s12665-010-0752-7
Appelo, C. A. J., and Postma, D. (2005). Geochemistry, Groundwater and Pollution, 2nd Edn. Rotterdam: A.A. Balkema Publishers. doi: 10.1201/9781439833544
Aris, A. Z., Abdullah, M. H., Ahmed, A., and Woong, K. K. (2007). Controlling factors of groundwater hydrochemistry in a small Island's Aquifer. Int. J. Environ. Sci. Technol. 4, 441. doi: 10.1007/BF03325979
Asoka, A., Wada, Y., Fishman, R., and Mishra, V. (2018). Strong linkage between precipitation intensity and monsoon season groundwater recharge in India. Geophysical Research Letters 45, 5536–5544. doi: 10.1029/2018GL078466
Assouline, S. (2013). Infiltration into soils: conceptual Approaches and Solutions. Water Resour. Res. 49, 1755–1772. doi: 10.1002/wrcr.20155
Bakalowicz, M. (2005). Karst groundwater: a challenge for new resources. Hydrogeol. J. 13, 148–160 doi: 10.1007/s10040-004-0402-9
Beekman, H. E. (1991). Ion Chromatography of Fresh and Salt Water Intrusions (Ph.D. thesis). Amsterdam: Free University.
Bhandary, H., Al-Fahad, K., Al-Senafy, M., and Al-Khalid, A. (2012). Usage of environmental isotopes in characterizing groundwater recharge sources. WIT Trans. Ecol. Environ. 164, 223–228. doi: 10.2495/WP120191
Bonilla Valverde, J., Blank, C., Roidt, M., Schneider, L., and Stefan, C. (2016). Application of a GIS multi-criteria decision analysis for the identification of intrinsic suitable sites in Costa Rica for the application of Managed Aquifer Recharge (MAR) through spreading methods. Water 8, 391. doi: 10.3390/w8090391
Bos, M. G., Kselik, R. A. L., Allen, R. G., and Molden, D. J. (2009). Water Requirements for Irrigation and the Environment. Dordrecht: Springer.
Cooray, P. G. (1984). An Introduction to the Geology of Sri Lanka (Ceylon). Colombo: National Museums of Sri Lanka. 340.
Craig, S. G., Wu, C. L. R., Stigter, T. Y., and Groen, J. (2021). Drivers of Groundwater Salinity and Potential for Freshwater Abstraction on a Semi-Arid Coral-Limestone Island in Sri Lanka. Global Water Security Issues Series 3. Paris: UNESCO International Centre for Water Security and Sustainable Management. 151–171.
Cui, X., Zhu, C., Hu, M., Wang, R., and Liu, H. (2021). Permeability of Porous media in coral reefs. Bull. Eng. Geol. Environ.. 80, 5111–5126. doi: 10.1007/s10064-020-02082-5
Custodio, E., and Bruggeman, G. A. (1987). Groundwater problems in coastal areas. Stud. Rep. Hydrol. 45, 595.
Domenico, P. A., and Schwartz, F. W. (1990). Physical and Chemical Hydrogeology. New York, NY: John Wiley & Sons. 824.
Falkland, A., and Custodio, E. (1991). Hydrology and Water Resources of Small Islands: A Practical Guide. International Hydrological Programme, IHP-111, Project 4.6. Paris: United Nations Educational, Scientific and Cultural Organization.
Food and Agriculture Organization (FAO) (1998). Crop Evapotranspiration - Guidelines for Computing Crop Water Requirements. Irrigation and Drainage Paper 56. Rome: FAO.
Food and Agriculture Organization (FAO) (2007). Handbook on Pressurized Irrigation Techniques. Rome: FAO.
Funk, C. C., Peterson, P. J., Landsfeld, M. F., Pedreros, D. H., Verdin, J. P., Rowland, J. D., et al. (2014). A Quasi-Global Precipitation Time Series for Drought Monitoring: U.S. Geological Survey Data Series 832. Reston, VA: U.S. Geological Survey. doi: 10.3133/ds832
Galloway, J. N., Townsend, A. R., Erisman, J. W., Bekunda, M., Cai, Z., Freney, J. R., et al. (2008). Transformation of the N cycle: Recent Trends, Questions and Potential Solutions. Science 320, 889–892. doi: 10.1126/science.1136674
Gardner, W. S., Seitzinger, S. P., and Malczyk, J. M. (1991). The effects of sea salts on the forms of nitrogen released from estuarine and freshwater sediments: does ion pairing affect ammonium flux? Estuaries 14, 157–166 doi: 10.2307/1351689
Gelaro, R., McCarty, W., Suárez, M. J., Todling, R., Molod, A., Takacs, L., et al. (2017). The modern-era retrospective analysis for research and applications, version 2 (MERRA-2). J Clim. 30, 5419–5454. doi: 10.1175/JCLI-D-16-0758.1
Ghesquière, O., Walter, J., Chesnaux, R., and Rouleau, A. (2015). Scenarios of groundwater chemical evolution in a region of the canadian shield based on multivariate statistical analysis. J. Hydrol. Reg. Stud. 4, 246–266. doi: 10.1016/j.ejrh.2015.06.004
Ghyben, W. B. (1889). Nota in Verband Met de Voorgenomen put Boring Rtabij. Amsterdam: K Inst Ingen Tijdschr Hague.
Goldscheider, N. (2015). Chapter 4 Overview of Methods Applied in Karst Hydrogeology. Switzerland: Springer International. doi: 10.1201/9781482266023
Goonatilake, S.d. A., Ekanayake, S., Kumara, T. P., Liyanapathirana, D., Weerakoon, D. K., and Wadugodapitiya, A. (2013). Sustainable Development of Delft Island: An Ecological, Socio-economic and Archaeological Assessment. Occasional Papers of IUCN Sri Lanka. No. 014. Colombo: IUCN.
GSMB (2002). Manipay – Kilinochi [Map]. Sri Lanka 1:100,000 Geology (Provisional Map Series). Geological Survey and Mines Bureau of Sri Lanka (Pitakotte: GSMB).
Güler, C., and Thyne, G. (2004). Hydrologic and geologic factors controlling surface and groundwater chemistry in Indian Wells-Owens Valley Area, South Eastern California, USA. J. Hydrol. 285, 177–198. doi: 10.1016/j.jhydrol.2003.08.019
Han, D. M., Song, X. F., Currell, M. J., Yang, J. L., and Xiao, G. Q. (2014). Chemical and isotopic constraints on evolution of groundwater salinization in the Coastal Plain Aquifer of Laizhou Bay, China. J. Hydrol. 508, 12–27. doi: 10.1016/j.jhydrol.2013.10.040
Healy, R. W. (2010). Estimating Groundwater Recharge. Cambridge: Cambridge University Press. doi: 10.1017/CBO9780511780745
Herath, G. (2014). Water Quality Management in Sri Lanka: Current Situation and Issues. Peradeniya: Department of Civil Engineering, University of Peradeniya [Powerpoint Slides]. Retrieved from http://wepa-db.net/activities/2014/20141127/pdf/2_3_WEPA%20Gemunu%20Herath%20Final%2028-11-14.pdf (accessed February 28, 2020).
Herzberg, A. (1901). Die Wasserversorgung Einiger Nordseebader. J für Gasbeleuchtung und Wasserversorgung Munich Jahrg 44, 815–819
Hilberg, S., Brandstätter, J., and Glück, D. (2013). CO2 partial pressure and calcite saturation in springs - useful data for identifying infiltration areas in mountainous environments. Environ. Sci. 15, 823–832. doi: 10.1039/c3em30973h
Horton, T. W., Defliese, W. F., Tripati, A. K., and Oze, C. (2015). Evaporation induced 18O and 13C enrichment in lake systems: a global perspective on hydrologic balance effects. Q. Sci. Rev. 131, 365–379. doi: 10.1016/j.quascirev.2015.06.030
Ibanhez, J. S. P., Alvarez-Salgado, X. A., and Rocha, C. (2021). Does nitrate enrichment accelerate organic matter turnover in Subterranean Estuaries? Front. Mar. Sci. 8, 661201. doi: 10.3389/fmars.2021.661201
Kamai, T., and Assouline, S. (2018). Evaporation from deep aquifers in arid regions: analytical model for combined liquid and vapor water fluxes. Water Resour. Res. 54, 4805–4822. doi: 10.1029/2018WR023030
LaMoreaux, P. E., Wilson, B. M., and Memon, B. A. (1984). Guide to the Hydrology of Carbonate Rocks. IHP Studies and Reports in Hydrology, Vol 41. Paris: UNESCO.
Lapointe, B. E., Barile, P. J., Littler, M. M., and Littler, D. S. (2005). Macroalgal blooms on Southeast Florida Coral Reefs: II. Cross-shelf discrimination of nitrogen sources indicates widespread assimilation of sewage nitrogen. Harmful Algae 4, 1106–1122 doi: 10.1016/j.hal.2005.06.002
Lerner, D., Issar, A., and Simmers, I. (1990). Groundwater Recharge: A Guide to Understanding and Estimating Natural Recharge. Heise: International Contributions to Hydrogeology.
Llangasekare, T., Illangasekare, T. H., Tyler, S. W., Clement, T. P., Villholth, K. G., Perera, A., Obeysekera, J. T., et al. (2006). Impacts of the 2004 Tsunami on groundwater resources in Sri Lanka. Water Resour. Res. 42, 9. doi: 10.1029/2006WR004876
Mikunthan, T., and De Silva, C. S. (2009). Estimation of groundwater recharge in limestone aquifer using an improved soil moisture balance method: a case study in Jaffna District. Trop. Agric. Res. 21, 51-−61. doi: 10.4038/tar.v21i1.2586
Mikunthan, T., Vithanage, M., Pathmarajah, S., Arasalingam, S., Ariyaratne, R., and Manthrithilake, H. (2013). Hydrogeochemical Characterization of Jaffna's Aquifer Systems in Sri Lanka. Colombo: International Water Management Institute (IWMI). 69. doi: 10.5337/2014.001
MRCCC (2013). Water Quality Standards. Mary River Catchment Coordinating Committee. Available online at: http://mrccc.org.au/wp-content/uploads/2013/10/Water-Quality-Salinity-Standards.pdf (accessed February 13, 2020).
Neuendorf, K. K. E., Mehl, J. P. Jr., and Jackson, J. A. (2005). Glossary of Geology, 5th Edn. Alexandria, VA: American Geological Institute.
Nogueira, G. E. H. (2017). Tracing the Hydrochemical Water Types and Salinization Mechanisms in the Great Maputo Area as a Function of Groundwater Recharge, Hydrogeological Properties and Human Activities (Master's thesis). IHE Delft Institute for Water Education, the Netherlands.
Nogueira, G. E. H., Stigter, T. Y., Zhou, Y., Mussa, F., and Juizo, D. (2019). Understanding groundwater salinization mechanisms to secure freshwater resources in the water-scarce City of Maputo, Mozambique. Sci. Total Environ. 661, 723–736 doi: 10.1016/j.scitotenv.2018.12.343
Nonner, J. C., and Stigter, T. Y. (2019). Manual for the Recharge Computation Spreadsheet. IHE Delft Institute for Water Education, the Netherlands.
Nowroozi, A. A., Horrocks, S. B., and Henderson, P. (1999). Salt water intrusion into the freshwater aquifer in the eastern shore of Virginia: a reconnaissance electrical resistivity survey. J. Appl. Geophys. 42, 1–22 doi: 10.1016/S0926-9851(99)00004-X
OHCHR. (2010). The Right to Water, Fact Sheet No. 35. Office of the United Nations High Commissioner for Human Right. Geneva. Available online at: http://www.ohchr.org/Documents/Publications/FactSheet35en.pdf
Paerl, H. W. (1997). Coastal eutrophication and harmful algal blooms: importance of atmospheric deposition and groundwater as “new” nitrogen and other nutrient sources. Limnol. Oceanogr. 42, 1154–1165 doi: 10.4319/lo.1997.42.5_part_2.1154
Parkhurst, D. L., and Appelo, C. A. J. (1999). User's Guide to PHREEQC (version 2) – A Computer Program for Speciation, Batch-Reaction, One-Dimesnional Transport, and Inverse Geochemical Calculations. Washington, DC: U.S. Geological Survey Water Resources Inv. Rep. 99–4259
Pauw, P. S. (2015). Field and Model Investigations of Freshwater Lenses in Coastal Aquifers. Wageningen: Wageningen University.
Polemio, M., and Walraevens, K. (2019). Recent research results on groundwater resources and saltwater intrusion in a changing environment. Water 11, 1118. doi: 10.3390/w11061118
Praveena, S. M., and Aris, A. Z. (2009). A review of groundwater in Islands using SWOT analysis: world review of science. Technol. Sustain. Dev. 6, 186–203 doi: 10.1504/WRSTSD.2009.031840
Ran, Q., Wang, Y., Sun, Y., Yan, L., and Tong, M. (2014). Chapter 6 - Identification and Prediction of Fractures in Volcanic Reservoirs. Volcanic Gas Reservoir Characterization. Houston, TX: Gulf Professional Publishing. 203–271. doi: 10.1016/B978-0-12-417131-2.00006-5
Rivett, M. O., Buss, S. R., Morgan, P., Smith, J. W. N., and Bemment, C. D. (2008). Nitrate attenuation in groundwater: a review of biogeochemical controlling processes. Water Resour. 42, 4215–4232. doi: 10.1016/j.watres.2008.07.020
Rushton, K. (1997). Recharge from Permanent Water Bodies. In Recharge of Phreatic Aquifers in (Semi) Arid Areas. Rotterdam: AA Balkema.
Stöckl, L., and Houben, G. (2012). Flow dynamics and age stratification of freshwater lenses: experiments and modeling. J. Hydrol. 458–459, 9–15. doi: 10.1016/j.jhydrol.2012.05.070
Stumm, W. (1984). Interpretation and measurement of redox intensity in natural waters. Schweizerische Zeitschrift für Hydrologie. 46. 291–296. doi: 10.1007/BF02538067
Stuyfzand, P. J. (1989). A New Hydrochemical Classification of Watertypes. Maryland: IAHS Publication.
Su, N., Burnett, W. C., Eller, K. T., MacIntyre, H. L., Mortazavi, B., Leifer, J., et al. (2012). Radon and Radium Isotopes, Groundwater Discharge and Harmful Algal Blooms in Little Lagoon, Alabama. Tokyo: Terrapub. 329–338
Swanson, S., Bahr, J., Schwar, M., and Potter, K. (2001). Two-way cluster analysis of geochemical data to constrain spring source waters. Chem. Geol. 179, 73–91. doi: 10.1016/S0009-2541(01)00316-3
Teichberg, M., Fox, S. E., Olsen, Y. S., Valiela, I., Martinetto, P., Iribarne, O., et al. (2010). Eutrophication and macroalgal blooms in temperate and tropical coastal waters: nutrient enrichment experiments with Ulva spp. Global Change Biol. 16, 2624–2637 doi: 10.1111/j.1365-2486.2009.02108.x
Terry, J. P., and Falkland, A. C. (2010). Responses of atoll freshwater lenses to storm-surge overwash in the Northern Cook Islands. Hydrogeol. J. 18:749–759 doi: 10.1007/s10040-009-0544-x
Tzanakakis, V., Paranychianakis, N., and Angelakis, A. (2020). Water supply and water scarcity. Water 12, 2347. doi: 10.3390/w12092347
Vacher, L., and Quinn, T. M. (2004). Geology and Hydrogeology of Carbonate Islands. Developments in Sedimentology, Vol. 54. Amsterdam: Elsevier Inc. doi: 10.1016/S0070-4571(04)80022-0
Voss, C. I., and Souza, W. R. (1987). Variable density flow and solute transport simulation of regional aquifers containing a narrow freshwater-salt water transition zone. Water Resour. Res. 23, 1851–1866 doi: 10.1029/WR023i010p01851
Walker, D., Parkin, G., Schmitter, P., Gowing, J., Tilahun, S. A., Haile, A. T., et al. (2019). Insights from a multi-method recharge estimation comparison study. Groundwater 57, 245–258. doi: 10.1111/gwat.12801
Wang, H., Gao, J. E., Zhang, M., Li, X., Zhang, S., and Jia, L. (2015). Effects of rainfall intensity on groundwater recharge based on simulated rainfall experiments and a groundwater flow model. CATENA 127, 80–91. doi: 10.1016/j.catena.2014.12.014
Werner, A. D., Bakker, M., Post, V. E. A., Vandenbohede, A., Lu, C., Ataie-Ashtiani, B., et al. (2013). Seawater intrusion processes, investigation and management: recent advances and future challenges. Adv. Water Resour. 51, 3–26 doi: 10.1016/j.advwatres.2012.03.004
White, I., Falkland, A., Etuati, B., Metai, E., and Metutera, T. (2002). “Hydrology and water resources management in the humid tropics,” in Proceedings Second International Colloquium, 22#x02013;26 March 1999, Panama, Republic of Panama (Paris), 299–332.
White, I., and Falkland, T. (2009). Management of freshwater lenses on small Pacific Islands. Hydrogeol. J. 18, 227–246. doi: 10.1007/s10040-009-0525-0
White, I., Falkland, T., Metutera, T., Metai, E., Overmars, M., Perez, P., et al. (2007). Climatic and human influences on groundwater in low atolls. Vadose Zone J. 6, 581–590. doi: 10.2136/vzj2006.0092
Widney, S., Smith, D., Herbert, E., Schubauer-Berigan, J., Li, F., Pennings, S., et al. (2019). Chronic but not acute saltwater intrusion leads to large release of inorganic N in a tidal freshwater marsh. Sci. Total Environ. 695, 133779. doi: 10.1016/j.scitotenv.2019.133779
Wilson, A. M., Moore, W. S., Joye, S. B., Anderson, J. L., and Schutte, C. A. (2011). Storm-driven groundwater flow in a salt marsh. Water Resour. Res. 47, W02535. doi: 10.1029/2010WR009496
Xiao, Y., Gu, X., Yin, S., Pan, X., Shao, J., and Cui, Y. (2017). Investigation of geochemical characteristics and controlling processes of groundwater in a typical long-term reclaimed water use area. Water 9, 800. doi: 10.3390/w9100800
Yuan, F., Sheng, Y., Yao, T., Fan, C., Li, J., Zhao, H., et al. (2011). Evaporative enrichment of oxygen-18 and deuterium in lake waters on the Tibetan Plateau. J. Paleolimnol. 46, 291–307. doi: 10.1007/s10933-011-9540-y
Zendehbad, M., Cepuder, P., Loiskandl, W., and Stumpp, C. (2019). source identification of nitrate contamination in the urban aquifer of Mashhad, Iran. J. Hydrol. 25, 100618. doi: 10.1016/j.ejrh.2019.100618
Keywords: salinization mechanism, freshwater lens, coral-limestone aquifer, hydrochemical analysis, recharge assessment, nitrate contamination
Citation: Wu CLR, Stigter TY and Craig SG (2022) Assessing the Quantity and Quality Controls of the Freshwater Lens on a Semi-Arid Coral-Limestone Island in Sri Lanka. Front. Water 4:832227. doi: 10.3389/frwa.2022.832227
Received: 09 December 2021; Accepted: 09 March 2022;
Published: 19 April 2022.
Edited by:
Constantinos V. Chrysikopoulos, Technical University of Crete, GreeceReviewed by:
Fernando Sola, University of Almeria, SpainVasiliki Syngouna, University of Patras, Greece
Copyright © 2022 Wu, Stigter and Craig. This is an open-access article distributed under the terms of the Creative Commons Attribution License (CC BY). The use, distribution or reproduction in other forums is permitted, provided the original author(s) and the copyright owner(s) are credited and that the original publication in this journal is cited, in accordance with accepted academic practice. No use, distribution or reproduction is permitted which does not comply with these terms.
*Correspondence: Chen Lester R. Wu, Y3J3dTJAdXAuZWR1LnBo