 Yerramilli Sai Rama Krishna
 N. Seetha
- Department of Civil Engineering, Indian Institute of Technology Hyderabad, Sangareddy, India
The transport behavior of pathogenic microorganisms and nanoparticles (NPs) in the subsurface is usually studied by performing laboratory soil column experiments. Parameters describing colloid deposition on grain surfaces are estimated by fitting observed breakthrough curves with an appropriate one-dimensional model. However, predictive tools to estimate colloid deposition parameters, knowing the system properties such as soil type, colloid type, solution chemistry, and flow velocity, are useful in estimating the travel distances of pathogenic microorganisms in the subsurface. Such predictive models are rare, except the colloid attachment rate coefficient predicted by colloid filtration theory (CFT) under favorable conditions. Although a couple of theoretical and empirical predictive models are available for estimating the deposition parameters under unfavorable conditions, they were developed for a small set of data, and their applicability to a wide range of conditions is unexplored. In this study, several sets of column-experimental data from literature, covering a wide range of experimental conditions, were analyzed to understand key factors that control colloid deposition. Empirical relationships were developed for deposition rate coefficients and sticking efficiency of various colloidal types [viruses, bacteria, graphene oxide (GO) NPs, silver (Ag) NPs, titanium dioxide (TiO2) NPs, and carboxylate-modified latex (CML) colloids] vis-à-vis 11 physicochemical parameters such as porosity, mean pore-water velocity, median grain size, colloid radius, solution ionic strength, surface potentials of colloids and grains, Hamaker constant, temperature, viscosity of water, and dielectric constant. While deposition of viruses and CML colloids on grain surfaces was found to be reversible, deposition of bacteria, GO NPs, Ag NPs, and TiO2 NPs was found to be irreversible. The empirical equations proposed in this study can predict deposition rate coefficients more closely (p < .001, R2 = 0.69−0.85) than CFT (p < .7, R2 ≤ 0.41). The performance of CFT in predicting the attachment rate coefficients of viruses, bacteria, GO NPs, TiO2 NPs, and CML colloids was found to improve significantly when estimated rate coefficients were multiplied by the sticking efficiency calculated using the empirical expression proposed in this study (p < .001, R2 = 0.65−0.95).
Introduction
Colloidal contaminants, such as pathogenic microorganisms (viruses, bacteria, and protozoa) and engineered nanoparticles (ENPs) enter the subsurface from various sources, including landfill leachates, industrial discharges, and land application of wastewater. Understanding the fate and transport of colloids in the subsurface is therefore essential to prevent groundwater contamination and protect human health.
The various mechanisms for retention of colloids in soil include deposition on grain surfaces, blocking, straining, and ripening. Colloid transport in porous media is usually studied by performing soil column experiments in the laboratory, and colloid retention parameters (attachment and detachment rate coefficients, maximum adsorption capacity of the soil, and straining coefficient) are in turn estimated by fitting the observed breakthrough curves with one-dimensional advection-dispersion equation with terms accounting for appropriate retention mechanisms. Literature shows that the rate coefficients of attachment and detachment of colloids to grain surfaces depend on various physicochemical factors, such as, flow velocity (Hendry et al., 1999; Tong and Johnson, 2006; Syngouna and Chrysikopoulos, 2013; Sasidharan et al., 2017a), grain size (Bradford et al., 2003; Knappett et al., 2008; Mitropoulou et al., 2013; Bai et al., 2016), colloid size (Tong and Johnson, 2006; Johnson et al., 2007), solution pH (Jewett et al., 1995; Sadeghi et al., 2011; Fang et al., 2013), ionic strength (Li et al., 2004; Johnson et al., 2007; Torkzaban et al., 2008a; Sadeghi et al., 2011; Fang et al., 2013), soil type (Chu et al., 2003; Schinner et al., 2010), colloid type (Li et al., 2004; Li and Johnson, 2005; Bai et al., 2016; Hedayati et al., 2016; Sasidharan et al., 2017a), temperature (Kim and Walker, 2009; Chrysikopoulos and Aravantinou, 2014; Schijven et al., 2016; Sasidharan et al., 2017b), and type of soil treatment (Tian et al., 2010). Predictive tools to estimate colloid attachment and detachment rate coefficients as functions of various physicochemical parameters influencing them will be useful in estimating the travel distances of various colloidal contaminants in groundwater (Schijven et al., 2000). However, such tools are rare, except for the theoretical expression for attachment rate coefficient under favorable conditions (interaction energy between colloid and grain surface being attractive at all separation distances) given by the colloid filtration theory (CFT; Yao et al., 1971), which describes deposition using a first-order irreversible kinetic model. However, environmental conditions in the subsurface are predominantly unfavorable for deposition (Ryan and Elimelech, 1996; Wan and Tokunaga, 2002). Unfavorable conditions for deposition arise when the interaction energy profile between the colloid and grain surface contains an energy barrier (Tufenkji and Elimelech, 2005). Under unfavorable conditions, colloid detachment from the grain surface is also important, and hence, deposition is usually described using a reversible kinetic model. Since the rate of deposition under unfavorable conditions is lower than under favorable conditions, the expression for attachment rate coefficient given by CFT is multiplied by a factor, α (α <1), called the sticking efficiency. Sticking efficiency is affected by various factors, such as, flow velocity, grain size, colloid size, solution pH and ionic strength, soil type, colloid type, and temperature (Keller et al., 2004; Tong and Johnson, 2006; Shen et al., 2008). However, theoretical expressions to estimate the value of α as a function of the above-mentioned system parameters are not available. Bai and Tien (1999), Elimelech (1992), Park et al. (2012), and Sadeghi et al. (2011) derived empirical expressions for α in terms of the various factors affecting it. Bai and Tien (1999) used several sets of experimental data on the transport of polystyrene latex particles through columns packed with glass beads, and derived a correlation equation for α in terms of flow velocity, colloid size, solution ionic strength, surface potentials of colloid and collector, temperature, viscosity, Hamaker constant, and dielectric constant of water. Elimelech (1992) used a semi-empirical approach to derive a quantitative relationship between α and parameters characterizing the system chemistry (colloid size, surface potentials of colloid and collector, ionic strength, and Hamaker constant) for the transport of latex particles through glass bead–packed columns. Park et al. (2012) and Sadeghi et al. (2011), using several sets of experimental data on the transport of Cryptosporidium parvum Oocysts and bacteriophage PRD1 through columns packed with sand or glass beads, derived empirical equations for α as a function of pH and ionic strength. The above empirical expressions were derived considering only a subset of factors affecting α, and their applicability to a wider range of experimental conditions is unexplored.
Although colloid detachment from grain surfaces is important under unfavorable conditions, no quantitative relationship between the detachment rate coefficient and the factors affecting it exists, except for the correlation equation for nanometre-sized particles derived by Seetha et al. (2015a, 2017). Seetha et al. (2015a, 2017) upscaled nanoparticle (NP) transport in porous media under unfavorable conditions from pore to the Darcy scale using pore network modeling, and derived correlation equations for attachment and detachment rate coefficients in terms of 10 Darcy-scale parameters, including porosity, mean pore radius, mean pore-water velocity, NP radius, ionic strength, dielectric constant, surface potentials of colloid and collector, temperature, and viscosity of the solution. They also derived expressions for attachment efficiency as a function of the above parameters. However, since Seetha et al. (2015a, 2017) assumed that surface properties of the porous medium and NPs were homogeneous, and NPs were spherical in shape, they did not account for the effect of: (a) heterogeneity of the grain surface and NPs and (b) shape of the NPs on particle deposition.
Quantitative relationships between attachment and detachment rate coefficients of colloidal contaminants, such as viruses, bacteria, and ENPs, and the various physicochemical parameters controlling them have not been developed yet. Empirical expressions offer the advantage of accounting for additional factors influencing colloid deposition, such as heterogeneity of grain surfaces and colloids and the shape of colloids, which are difficult to account for in theoretical models. In this study, several sets of column-experimental data for a variety of experimental conditions reported in literature were analyzed, and empirical relationships between attachment and detachment rate coefficients vis-à-vis the various physicochemical system parameters were developed for the transport of viruses, bacteria, graphene oxide (GO) NPs, silver (Ag) NPs, titanium dioxide (TiO2) NPs, and carboxylate-modified latex (CML) colloids through porous media composed of glass beads or quartz sand.
Methodology
Experimental Data to Develop Empirical Equations
Literature shows that the rate coefficients for colloid (viruses, bacteria, ENPs, and CML colloids) attachment to, and detachment from grain surfaces depend on 11 physicochemical parameters (Seetha et al., 2017): porosity (θ [-]), mean pore-water velocity (), median grain size (d50 [L]), colloid radius (a [L]), solution ionic strength (I [Molar]), surface potentials of colloids () and grains (), Hamaker constant (H [ML2T−2]), temperature (T [K]), viscosity of water (μ [ML−1T−1]), and dielectric constant (ε [-]). Hence, experimental data from research papers that reported all the above-listed parameter values, along with values of deposition rate coefficients for colloid transport through laboratory columns, were selected. In this study, only data from experiments performed using a monovalent background electrolyte were considered. There can be multiple retention mechanisms involved in the transport of colloids reported in a given study. For example, Qi et al. (2014) studied the transport of GO NPs through columns packed with quartz sand, and the transport behavior was described using a model that accounted for irreversible attachment and straining. However, in this study, only information on colloid attachment rate coefficient on to the grain surface was considered, assuming that deposition on grain surfaces and straining are two independent mechanisms. In another study, Torkzaban et al. (2008a) found that the retention of CML colloids to Ottawa sands is described using a one-site reversible kinetic model with blocking. In this study, only the values of rate coefficients of colloid attachment and detachment on to the grain surface were considered, thereby trying to estimate the values of deposition rate coefficients to an initially clean collector. Foppen et al. (2005) fitted the breakthrough data of E. coli using a two-site kinetic model, with site 1 being irreversible and site 2 being reversible. In this paper, the rate coefficient of attachment to only the irreversible site was considered, because most studies report that bacteria deposition on the grain surface is irreversible (Redman et al., 2004; Foppen et al., 2007; Torkzaban et al., 2008b; Kim and Walker, 2009; Bai et al., 2016).
The column-experimental papers selected to analyse the deposition of viruses, bacteria, GO NPs, Ag NPs, TiO2 NPs, and CML colloids are listed in Tables 1–6, respectively, along with experimental conditions and mechanisms behind observed retention. The selected data includes 41 datasets (Supplementary Table 1) depicting various environmental conditions reported in five papers (Syngouna and Chrysikopoulos, 2012, 2013, 2015; Sasidharan et al., 2017a,b) for the transport of viruses such as MS2, PRD1, and ΦX174 through columns packed with quartz sand or glass beads (Table 1). Table 1 shows that virus deposition on grain surface is described using a one-site reversible kinetic model for most experimental conditions. Six papers (Redman et al., 2004; Foppen et al., 2005, 2007; Torkzaban et al., 2008b; Kim and Walker, 2009; Bai et al., 2016) comprising 22 datasets (Supplementary Table 2) were selected for the analysis of deposition behavior of bacteria through sand and glass beads (Table 2). It is clear from Table 2 that the deposition of bacteria on solid grains is predominantly described using a one-site irreversible kinetic model. The different types of bacteria considered in this study are E. coli XL-1 Blue (Kim and Walker, 2009), E. coli D21g (Redman et al., 2004; Foppen et al., 2005, 2007; Torkzaban et al., 2008b), and Klebsiella Oxytoca (Bai et al., 2016). The deposition trend vis-à-vis the physicochemical parameters for GO NPs through sand was analyzed using experimental results from three papers (Qi et al., 2014; Sun et al., 2015; Wang et al., 2017) constituting 31 datasets (Table 3 and Supplementary Table 3). Similarly, for Ag and TiO2 NPs, 21 datasets (Liang et al., 2013, 2020; Park et al., 2016) and 23 datasets (Fang et al., 2013; Bayat et al., 2015; Lv et al., 2016) were analyzed, as listed in Tables 4, 5, respectively. The corresponding experimental datasets are listed in Supplementary Tables 4, 5, respectively. Tables 3–5 show that for experimental conditions considered in this study, ENP deposition on grain surface is described using a one-site irreversible kinetic model. Table 6 lists six selected papers (Li and Johnson, 2005; Li et al., 2005; Tong et al., 2005; Tong and Johnson, 2006; Johnson et al., 2007; Torkzaban et al., 2008a) comprising 50 datasets (Supplementary Table 6) used to understand the deposition behavior of CML colloids through glass beads and quartz sand. Table 6 shows that deposition of CML colloids on solid grains is mostly described using a one-site reversible kinetic model.
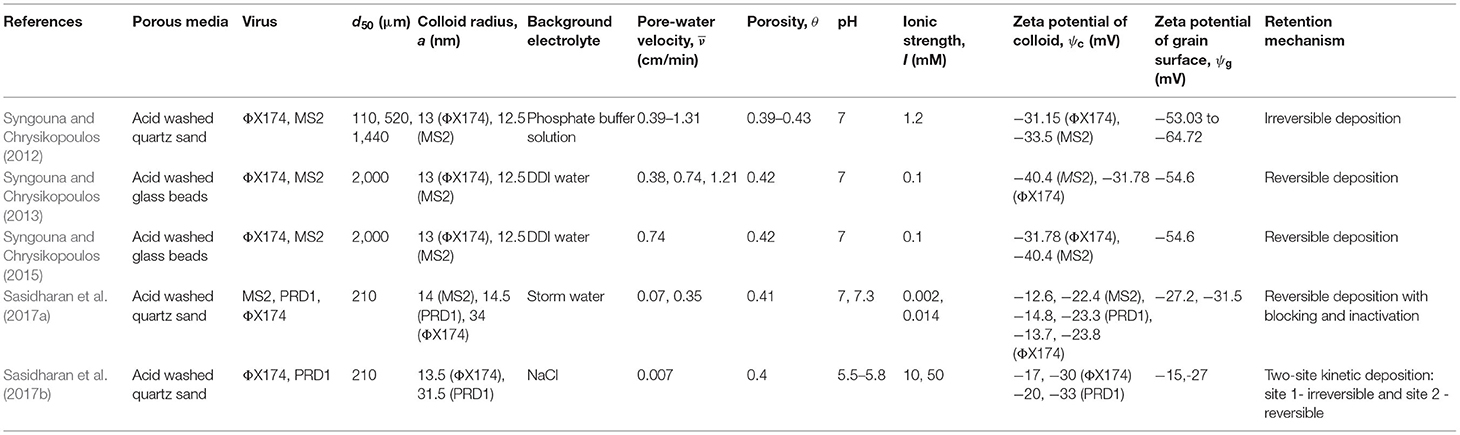
Table 1. Experimental conditions in papers selected to analyse deposition of viruses.
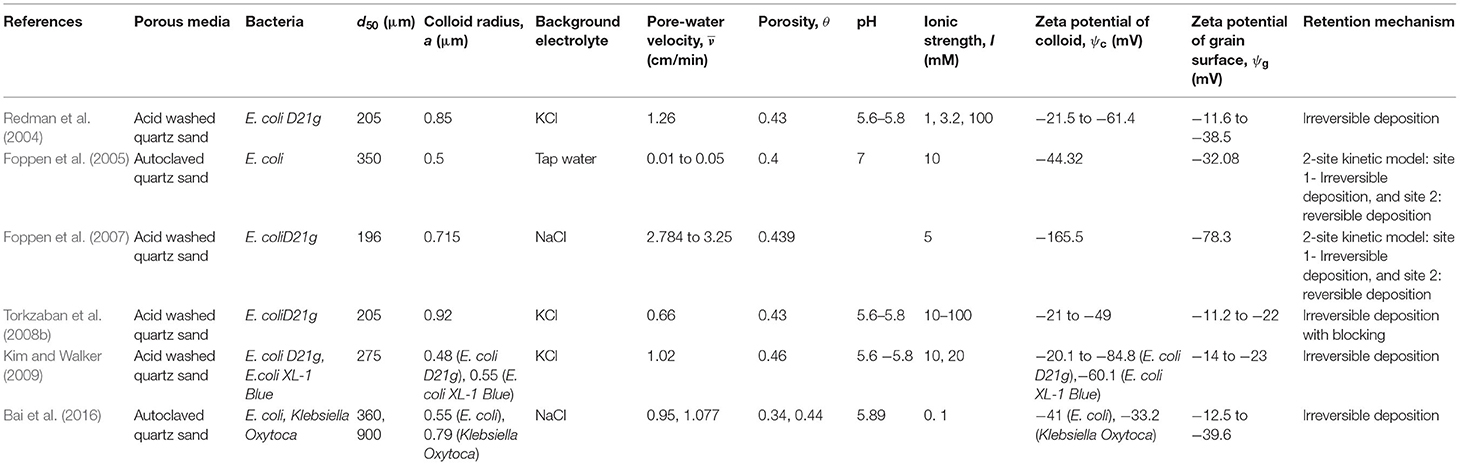
Table 2. Experimental conditions in papers selected to analyse deposition of bacteria.
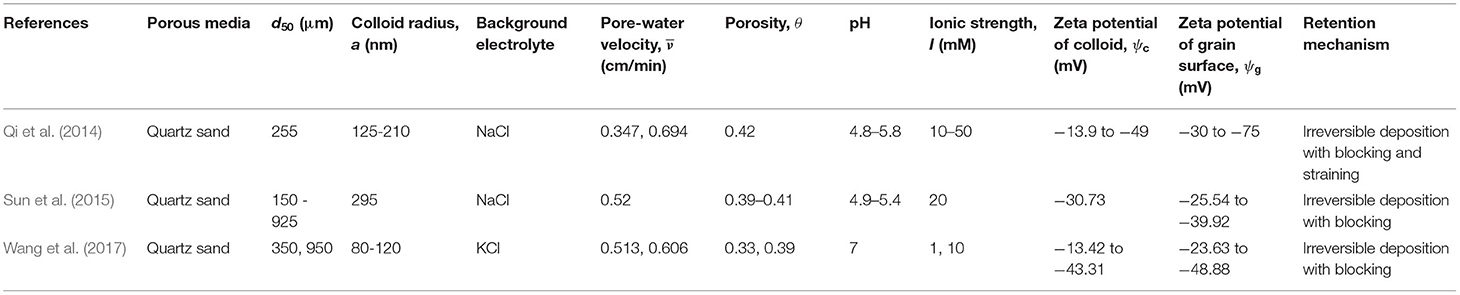
Table 3. Experimental conditions in papers selected to analyse deposition of GO NPs.
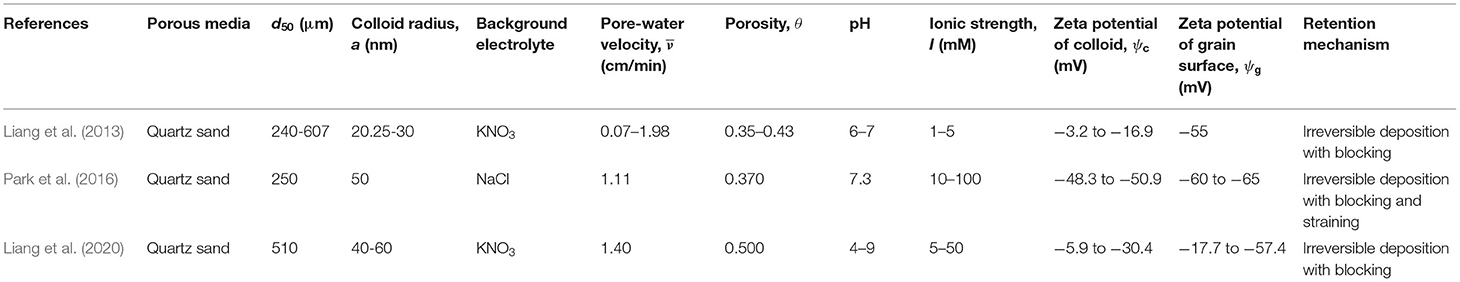
Table 4. Experimental conditions in papers selected to analyse deposition of Ag NPs.

Table 5. Experimental conditions in papers selected to analyse deposition of TiO2 NPs.
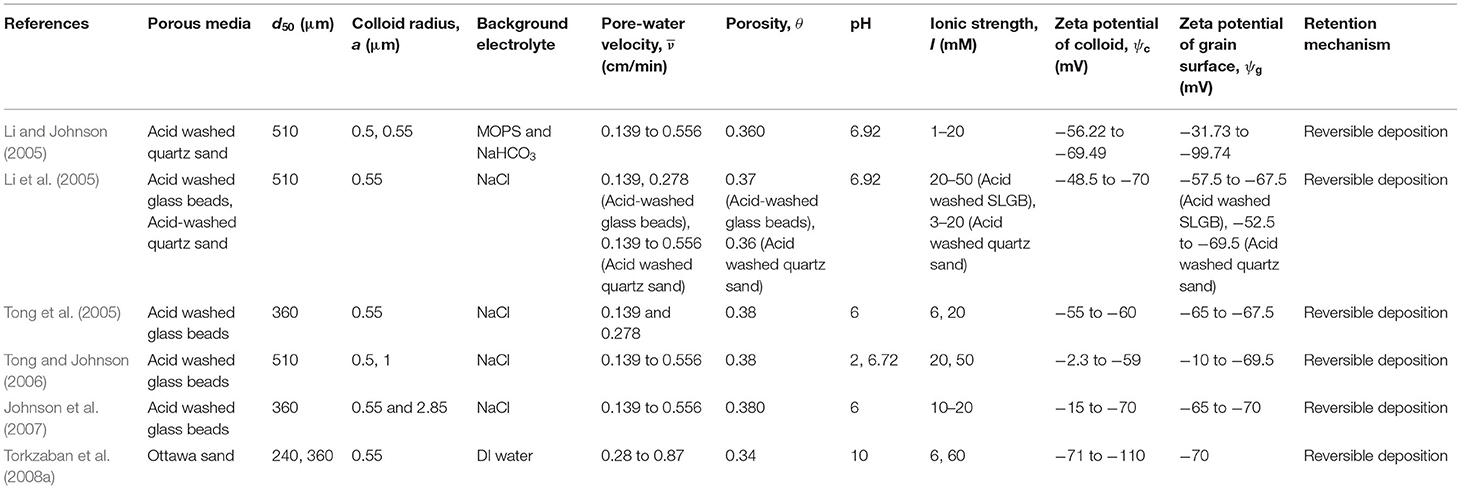
Table 6. Experimental conditions in papers selected to analyse deposition of CML colloids.
For each of the colloid types considered in this study, selected column-experimental data were analyzed to develop empirical equations for attachment and detachment rate coefficients as a function of 11 dimensional parameters as given below:
where are the rate coefficients for colloid attachment to and detachment from grain surfaces, respectively.
Dimensionless Parameters Controlling Colloid Deposition
Eleven dimensional parameters influencing colloid deposition were grouped into eight dimensionless parameters, including . Here, is the Peclet number, is the particle bulk diffusion coefficient, kB is the Boltzmann constant, is the interception parameter, where λ is the characteristic wavelength of interaction (λ = 100 nm), represents the magnitudes of surface potentials of colloid and grains, ε0 is the permittivity of vacuum, represents the ratio of surface potentials of colloid and soil grains, NDL = κa represents the ratio of colloid radius to Debye length, represents the inverse Debye length, NA is the Avogadro number, e is the elementary charge of the particle, and is the dimensionless Hamaker constant. The corresponding dimensionless rate coefficients are and , where Daa and Dad are Damkohler numbers for colloid attachment to and detachment from grain surfaces, respectively. Table 7 lists the range of values of dimensionless parameters for each colloid type for which empirical equations were developed in this study.
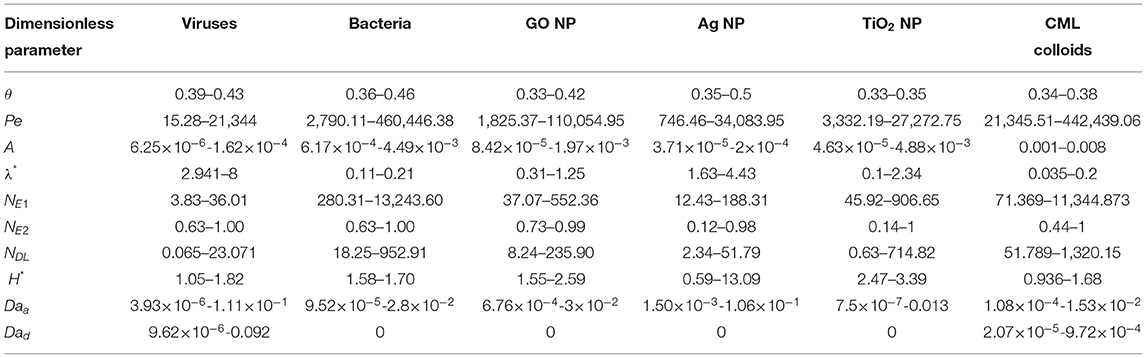
Table 7. Range of values of dimensionless parameters for various colloidal types.
Variation of Dimensionless Deposition Rate Coefficients With Individual Parameters
The selected column-experimental data were analyzed to identify the trend and the relationship between Daa and Dad vis-à-vis each of the eight dimensionless parameters (). Figures 1A,B show that a power-law relationship describes the variation of Daa vs Pe, A, and θ. Since the values of both NE1 and NE2 change with NDL, the variation of Daa vis-à-vis NE1, NE2, and NDL was plotted in Figures 1C,D, which show that a power-law relationship exists between them. Figures 1E–G show that the variation of Dad with NE1, NE2, NDL, and Pe can be described using a power-law function. No dataset showing the variation of Daa or Dad vs λ* and H*was found.
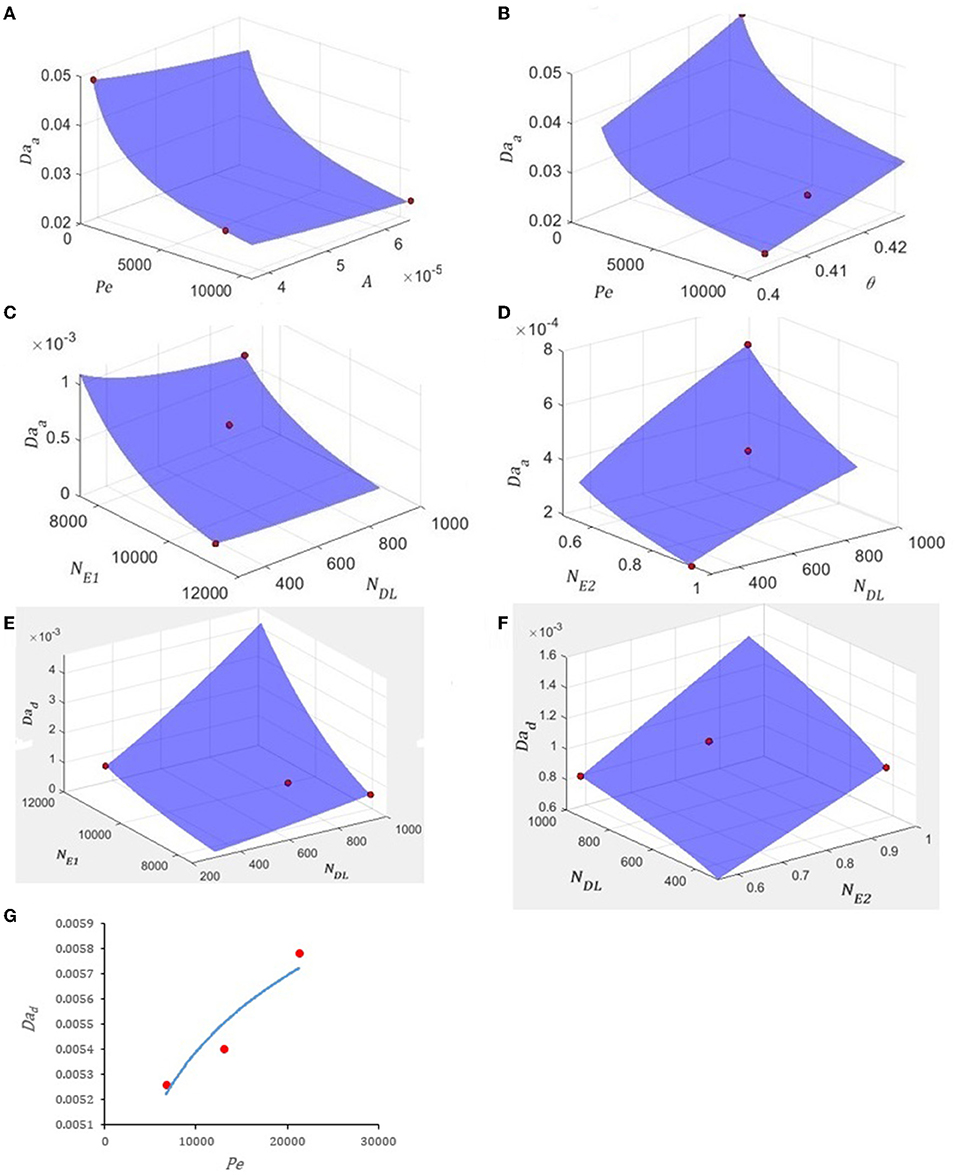
Figure 1. Variation of (A) Daa vs. Pe and A for Ag NPs, (B) Daa vs. Pe and θ for Ag NPs, (C) Daa vs. NE1 and NDL for CML colloids, (D) Daa vs. NE2 and NDL for CML colloids, (E) Dad vs. NE1 and NDL for CML colloids, (F) Dad vs. NDLand NE2 for CML colloids, and (G) Dad vs. Pe for ΦX174. The fitted equations are (A,B) and R2 = 1, (C,D) and R2 = 1, (E,F) and R2 = 1, and (G) and R2 = 0.89. The data (red circles) for this figure is from (A,B) Liang et al. (2013), (C,D) Johnson et al. (2007), (E,F) Johnson et al. (2007), and (G) Syngouna and Chrysikopoulos (2013). The values of the other dimensionless parameters are (A,B) λ* = 4.43, NE1 = 41.25, NE2 = 0.56, NDL = 2.34, and H* = 0.59, (C,D) θ= 0.38, Pe = 221217.14, A = 0.0079, λ* = 0.035, and H* = 1.68, (E,F) θ = 0.38, Pe = 221217.14, A = 0.0079, λ* = 0.035, and H* = 1.68, and (G) θ = 0.42, A = 6.5x10⁻⁶, λ* = 7.69, NE1 = 31.74, NE2 = 0.96, NDL = 0.43, and H* = 1.82.
Results and Discussion
Empirical Equations for Deposition Rate Coefficients of Colloids
Section Variation of Dimensionless Deposition Rate Coefficients With Individual Parameters and Figures 1A–G indicate that a power-law relationship describes the variation of Daa and Dad with respect to the various dimensionless parameters. Hence, in this study, the following empirical relationships between Daa and Dad vis-à-vis the eight dimensionless parameters were assumed for all the six different types of colloids considered:
where p1, p2, ….p9 and q1, q2, ….q9 are coefficients whose values were estimated using multiple-linear regression analysis. Empirical equations for deposition rate coefficients were developed separately for viruses, bacteria, GO NPs, Ag NPs, TiO2 NPs, and CML colloids. As mentioned previously, in published literature, the deposition of viruses and CML colloids is described using a first-order reversible kinetic model, whereas that of bacteria and ENPs (GO NPs, Ag NPs, and TiO2 NPs) is described using a first-order irreversible kinetic model. Hence, Equation 4 is applicable only to viruses and CML colloids. Estimated values of coefficients in empirical Equations 3, 4 for viruses, bacteria, GO NPs, Ag NPs, TiO2 NPs, and CML colloids are given in Table 8.
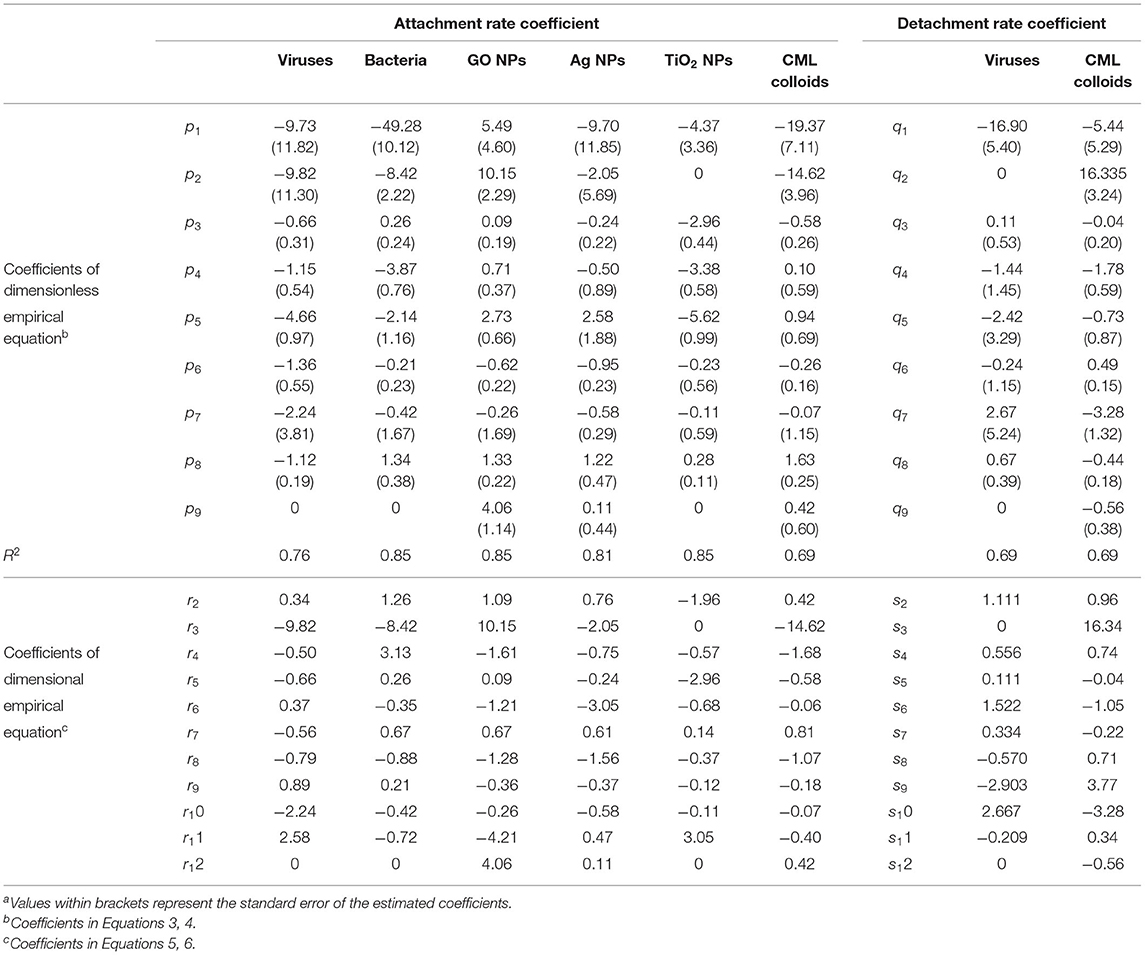
Table 8. Estimated values of coefficients in the empirical equations for the deposition rate coefficients of various colloidsa.
Equations for the dimensionless deposition rate coefficients, i.e., Equations 3, 4, were converted into dimensional form, resulting in empirical equations for ka and kd in terms of 11 dimensional parameters (vm, θ, d50, μ, a, I, ε, ψc, ψg, T, H) as follows:
where r1, r2, ….r12 and s1, s2, ….s12 are the coefficients. The values of coefficients r2, r3, ...r12 and s2, s3, ….s12 for all six colloidal types are listed in Table 8. The values of r1 and s1 were calculated in terms of various constants as given below:
The Hamaker constant was not found to have a significant impact on the model performance for Daa and Dad of viruses and was hence excluded from the model (Table 8). Similarly, porosity was found to have a negligible effect on the detachment rate coefficient of viruses and was thus excluded from the model (Table 8). Given the negligible variation in the value of the Hamaker constant for the experimental dataset of bacteria considered in this study (Table 7), it was not included in the model for Daa (Table 8). Similarly, variation in the value of porosity is minimal for the experimental data of TiO2 and was excluded from the model for Daa (Table 8). Additionally, the Hamaker constant was found to have a negligible effect on the predicted value of Daa for TiO2 NPs and was also not included in the equation for Daa (Table 8).
Figures 2A, 3, 4, 5A compare the Daa values predicted by the empirical equation developed in this study (Equation 3) with the corresponding values estimated by fitting the column-experimental data with appropriate models reported in the literature for viruses, bacteria, NPs, and CML colloids, respectively. It is apparent that the values of Daa calculated using the empirical equations developed in this study match the corresponding values obtained from experimental data reported in literature reasonably well. The empirical equations were statistically significant with p < .001. Figures 2B, 5B compare the Dad values predicted by the empirical equation developed in this study (Equation 4) with the corresponding values obtained by fitting the column-experimental data with appropriate models reported in the literature for viruses and CML colloids, respectively.
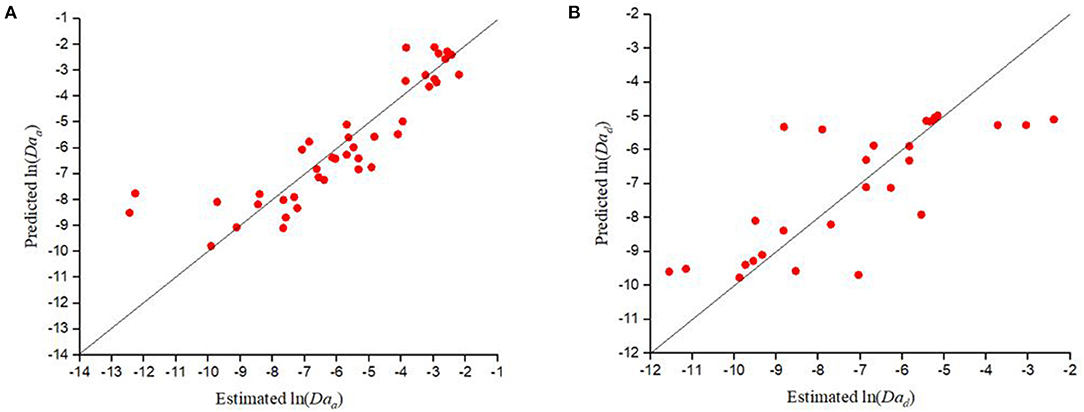
Figure 2. Comparison of values of (A) Daa (R2 = 0.76) and (B) Dad (R2 = 0.69) predicted by the empirical equations developed in this study for viruses vs the corresponding estimated values reported in the literature (Supplementary Table 1) obtained by fitting column experimental data with a 1D mathematical model.
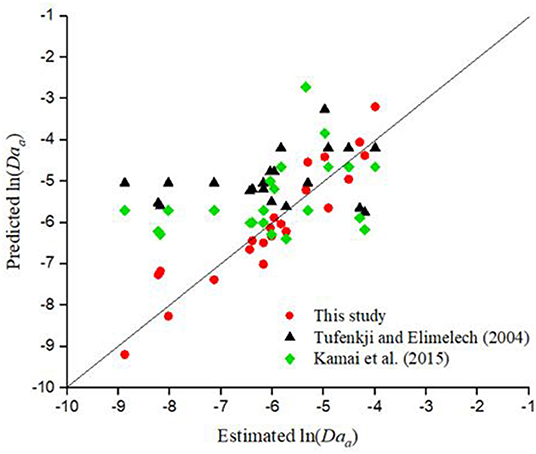
Figure 3. Comparison of values of Daa predicted by the empirical equation developed in this study for bacteria (red circles, R2 = 0.85) vs the corresponding estimated values reported in the literature (Supplementary Table 2) obtained by fitting column experimental data with a 1D mathematical model. Also shown in the figure are the values of Daa predicted by CFT with η0 calculated using the model of Tufenkji and Elimelech (2004; black triangles, R2 = 0.103), and Kamai et al. (2015; green diamonds, R2 = 0.156).
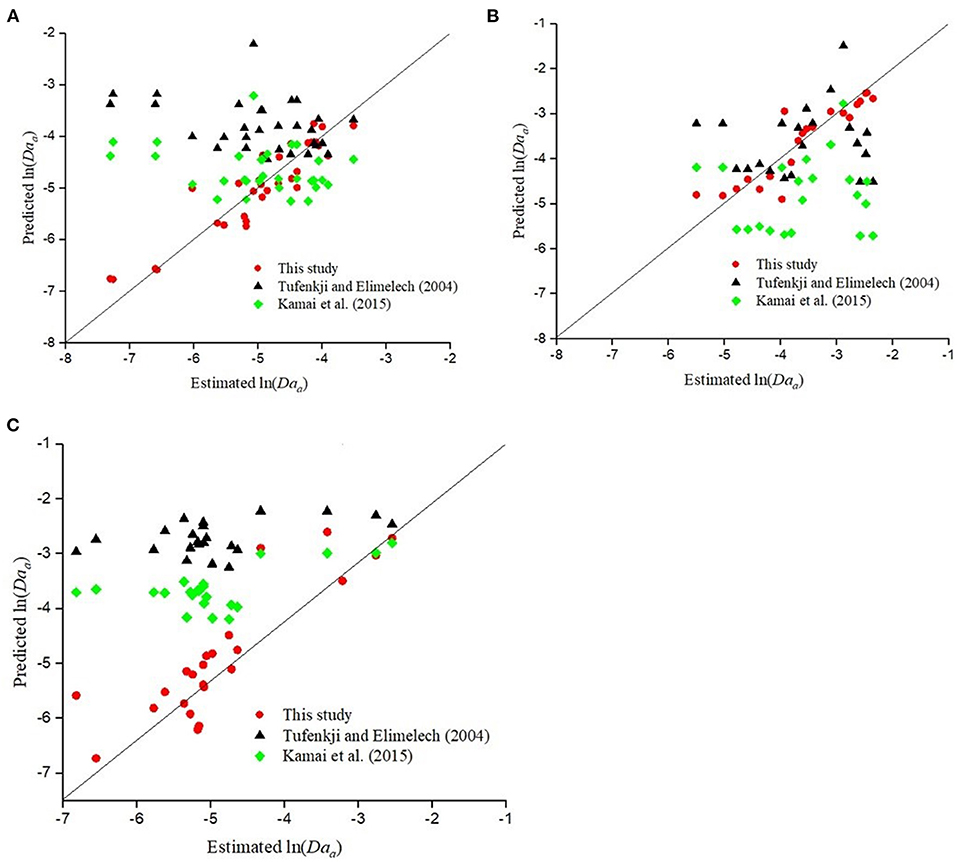
Figure 4. Comparison of values of Daa predicted by the empirical equation developed in this study for (A) GO NPs (red circles, R2 = 0.85) (B) AgNPs (red circles, R2 = 0.824) (C) TiO2 NPs (red circles, R2 = 0.85) vs. the corresponding estimated values reported in the literature (Supplementary Tables 1–3, respectively) obtained by fitting column experimental data with a 1D mathematical model. Also shown in the figure are the values of Daa predicted by CFT with η0 calculated using the model of Tufenkji and Elimelech (2004) for (A) GO NPs (black triangles, R2 = 0.139), (B) AgNPs (black triangles, R2 = 0.009), (C) TiO2 NPs (black triangles, R2 = 0.289) and Kamai et al. (2015) for (A) GO NPs (green diamonds, R2 = 0.078), (B) AgNPs (green diamonds, R2 = 0.007), (C) TiO2 NPs (green diamonds, R2 = 0.366).
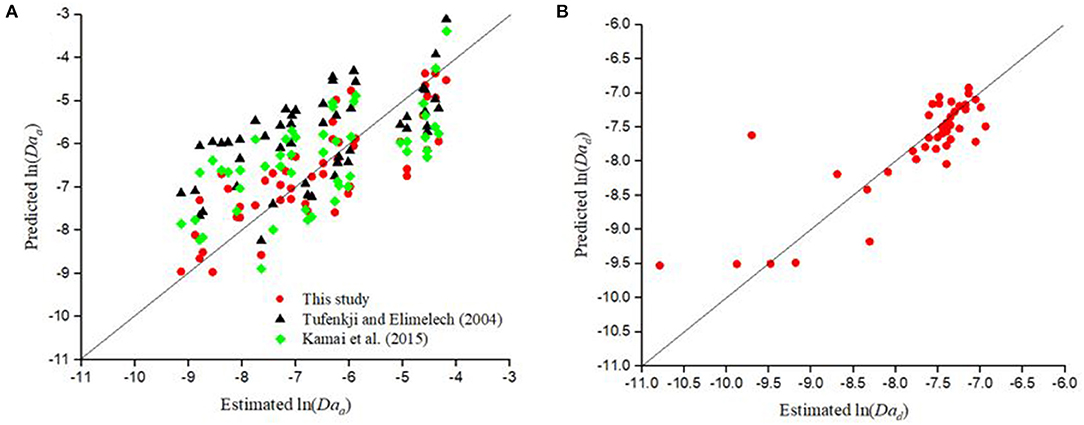
Figure 5. Comparison of values of (A) Daa (red circles, R2 = 0.69) and (B) Dad (red circles, R2 = 0.69) values predicted by the empirical equations developed in this study for CML colloids vs the corresponding estimated values reported in the literature (Supplementary Table 6) obtained by fitting column experimental data with a 1D mathematical model. Also shown in (A) are the values of Daa predicted by CFT with η0 calculated using the model of Tufenkji and Elimelech (2004; black triangles, R2 = 0.39) and Kamai et al. (2015; green diamonds, R2 = 0.41) with the value of α calculated using the empirical equation developed by Bai and Tien (1999).
The empirical model predicted a positive trend for ka with respect to mean pore-water velocity for all colloidal types, except TiO2 NPs (Equation 5 and Table 8). This is consistent with experimental results reported in literature for viruses, bacteria, Ag NPs, GO NPs, and CML colloids (Hendry et al., 1999; Liang et al., 2013; Qi et al., 2014; Seetha et al., 2015b; Ma et al., 2017). The empirical model predicted a negative trend for ka with respect to mean pore-water velocity for TiO2 NPs, which is in line with the experimental data published by Toloni et al. (2014). Equation 6 and Table 8 indicate that for viruses and CML colloids, kd increases with velocity. This is in agreement with the experimental results reported by Chowdhury et al. (2011), Syngouna and Chrysikopoulos (2013), Tong and Johnson (2006), and Zhang et al. (2012).
The empirical model predicted a negative trend for ka vis-à-vis grain size for all colloidal types, except bacteria (Equation 6 and Table 8). This is consistent with experimental studies conducted with E. coli (Foppen et al., 2007). In addition, for deposition of viruses and CML colloids, a positive correlation was found between kd and grain size. As the grain size increases, the specific surface area of the porous medium decreases and the diffusion length to the grain surface increases. This results in lesser attachment with increasing grain size. This trend is consistent with CFT (Yao et al., 1971; Tufenkji and Elimelech, 2004) and experimental studies reported in literature for the deposition of bacteriophages, GO NPs, AgNPs, TiO2 NPs, and CML colloids (Knappett et al., 2008; Kasel et al., 2013; Liang et al., 2013; Sun et al., 2015; Lv et al., 2016).
As viscosity increases, the particle diffusion coefficient decreases leading to lesser transport of particles from the liquid phase to the grain surface and from grain surface to the liquid phase. This caused a negative correlation between ka and μ for viruses, AgNPs, TiO2 NPs, and CML colloids (Equation 5 and Table 8). However, a positive correlation between ka and μ was found for bacteria and GO NPs (Equation 5 and Table 8).
Diffusion coefficient of colloids increases with temperature, resulting in a higher rate of transfer of colloids to the grain surface, and hence increased deposition. This is consistent with the empirical equation for ka (Equation 5) developed in this study for all colloid types, except bacteria. Kim and Walker (2009) performed experiments with different E. coli strains at varying temperatures and observed that temperature did not significantly affect bacterial deposition. They attributed the retention of bacteria to biological processes rather than transport processes.
Colloid deposition on grain surface increases with ionic strength because of decreasing electrostatic repulsive force between colloids and soil grains, due to their less negative surface potentials and compression of the double layer. This causes the attachment rate coefficient to increase with ionic strength (Chen and Zhu, 2004; Li et al., 2004, 2011; Johnson et al., 2007; Kim and Walker, 2009; Fang et al., 2013) and decrease with increasing values of and (ψcψg). Furthermore, the detachment rate coefficient was expected to decrease with increase in ionic strength. This is in line with the trend predicted by the empirical equation for ka vis-à-vis ionic strength (Equation 5 and Table 8) for all colloid types, except viruses. The opposite trend predicted by the empirical model for viruses may be due to the narrow range of ionic strength values in the data used for developing the empirical equation. Additionally, Equation 5 and Table 8 show a negative trend between ka vs and (ψcψg) for all colloid types, except viruses and bacteria.
The empirical equation for ka (Equation 5) predicts a negative trend with respect to particle radius for all colloid types, except viruses (Table 8). Since viruses are extremely small, diffusive transport dominates advective transport, and ka (Equation 5) showed a positive trend with respect to particle radius due to increasing depth of the secondary minimum (Table 8). However, this is not true for NPs. NPs tend to aggregate, and the size of the aggregate is typically much larger than the size of individual NPs. Therefore, as particle size increases, the diffusion coefficient decreases, and the rate of transport of particles to the grain surface decreases (Tong and Johnson, 2006; Shen et al., 2008; Wang et al., 2012). As a result of their relatively large size, the ka (Equation 5) for NPs, bacteria, and CML colloids showed a decreasing trend with increasing particle radius (Table 8).
Colloid deposition on grain surface increases with Hamaker constant due to an increase in attractive force between the colloid and soil grains. This is consistent with the empirical equation for ka (Equation 5), which predicted a positive trend with Hamaker constant for GO NPs, Ag NPs, and CML colloids (Table 8). The empirical equation for viruses, bacteria, and TiO2 NPs did not include the Hamaker constant, as there is less variability in its value in the experimental dataset of these colloids considered in this study.
Comparison With Models in Literature
The performance of empirical equations for Daa and Dad developed in this study was compared with CFT. CFT (Yao et al., 1971) describes the deposition of colloids on grain surfaces under favorable conditions using a first-order irreversible kinetic model and the attachment rate coefficient was calculated as:
where η0 is the single collector contact efficiency. Several theoretical expressions are available in the literature (Rajagopalan and Tien, 1976; Tufenkji and Elimelech, 2004; Ma et al., 2009; Nelson and Ginn, 2011) to calculate the value of η0 for different collector geometries, range of parameter values and forces responsible for colloid attachment to the collector surface. Kamai et al. (2015) developed a semi-empirical expression for η0 by regressing the correlation equation for η0 proposed by Rajagopalan and Tien (1976) against the experimentally estimated values of η0 to find the coefficients in the equation. This helps to account for additional factors such as surface heterogeneity of collectors, grain packing, incomplete mixing within and between pores, and particle aggregation, which were not accounted for in the mechanistic models for η0. In this study, expressions for η0 proposed by Tufenkji and Elimelech (2004) and Kamai et al. (2015) were used to predict the value of ka(CFT) using Equation 9. Tufenkji and Elimelech (2004) proposed the following equation for single collector contact efficiency (η0(TE)):
where As is the porosity dependent parameter in Happel's model, i.e., , γ= (1− θ)1/3, ρp [ML−3] is the particle density, ρf [ML−3] is the fluid density, and g [LT−2] is the acceleration due to gravity.
Kamai et al. (2015) developed the following equation for single collector contact efficiency (η0(KNNG)):
The Damkohler number for attachment, predicted by CFT (Daa(CFT)), was then calculated as . Since deposition to the grain surface was found to be irreversible in the case of bacteria and NPs, CFT was used to predict the corresponding values of Daa for the experimental data considered in this study. Figure 3 shows that CFT [with η0 calculated using models proposed by Tufenkji and Elimelech (2004) and Kamai et al. (2015)] considerably overestimated the value of Daa for the experimentally estimated ln (Daa) values < −6 for the deposition of bacteria, and that the performance for η0, calculated using the model suggested by Tufenkji and Elimelech (2004) (p =.14, R2 = 0.10), is poor compared to the model proposed by Kamai et al. (2015) (p =.07, R2 = 0.16). It is also apparent from Figure 3 that in contrast to CFT, the empirical equation developed in this study is capable of estimating the Daa values for bacteria more closely to the experimentally estimated Daa values.
Figure 4A compares the Daa values predicted by CFT and the empirical model developed in this study (Equation 3 and Table 8) with the Daa values estimated by fitting the experimental data with a one-dimensional model for the deposition of GO NPs. It is clear that the empirical model developed in this study is capable of predicting the Daa values reasonably well, whereas the performance of CFT is poor (p =.04−.13, R2 = 0.08−0.14). Figure 4B shows that for Ag NPs, with η0 calculated as per Kamai et al. (2015) (p =.7, R2 = 0.01), CFT underestimated the value of Daa whereas with η0 calculated as per Tufenkji and Elimelech (2004) (p =.68, R2 = 0.01), CFT overestimated the value of Daa for ln(Daa) < −4. Overall, for the entire range of Daa values for Ag NPs, the empirical equation developed in this study (Equation 3 and Table 8) performed reasonably well. A comparison between the Daa values for TiO2 NPs predicted by CFT and the empirical equation developed in this study (Equation 3 and Table 8) is shown in Figure 4C. It is clear that with η0 calculated as per both Tufenkji and Elimelech (2004) (p =.01, R2 = 0.29) and Kamai et al. (2015) (p =.002, R2 = 0.37), CFT overestimated the Daa values for TiO2 NPs by several orders of magnitude, whereas the performance of the empirical equation developed in this study is reasonably satisfactory.
The deposition of CML colloids on grain surfaces is predominantly described using a reversible kinetic model, which indicates unfavorable conditions for deposition. The attachment rate coefficient of colloids under unfavorable conditions can be predicted using CFT by multiplying Equation 9 by α. Although a theoretical expression for α as a function of various physicochemical parameters is not available in literature, Bai and Tien (1999) developed an empirical equation for α as a function of various physicochemical parameters for the deposition of polystyrene latex particles to glass beads, which is given below:
Figure 5A shows the Daa values for CML colloids predicted by CFT with η0 calculated using the expression derived by either Tufenkji and Elimelech (2004) or Kamai et al. (2015) and α using Equation 12. CFT overestimated (p < .001, R2 = 0.39−0.41) the values of Daa and its performance was poorer than the empirical equation developed in this study (Equation 3 and Table 8).
Figures 3, 4A,C, 5 show that CFT overpredicted the deposition of bacteria, GO NPs, TiO2 NPs, and CML colloids, respectively, indicating that the attachment rate coefficient predicted by CFT must be multiplied by the sticking efficiency to make reasonable predictions. Sticking efficiency is calculated as the ratio of experimentally estimated Daa and Daa(CFT). Hence, for the dataset given in Supplementary Tables 1–3, 5, 6, α values were calculated separately using the η0 expressions proposed by Tufenkji and Elimelech (2004) or Kamai et al. (2015), and then used to find an empirical expression between α and eight dimensionless parameters for viruses, bacteria, GO NPs, TiO2 NPs, and CML colloids, as given below:
where l1, l2…..l9 are coefficients whose values are estimated using multiple-linear regression analysis. Two separate equations for α are proposed in this study for each colloid type, corresponding to the calculation of η0 using expressions proposed by either Tufenkji and Elimelech (2004) or Kamai et al. (2015). For certain data points in Supplementary Tables 1–3, 5, 6, α was found to be greater than one, and such data points were excluded from the regression analysis. The values of coefficients l1, l2…..l9 for various colloidal types are given in Table 9. CFT underpredicted the deposition of Ag NPs (Figure 4B), indicating that CFT is not suitable for predicting the attachment rate coefficient of Ag NPs. The general form of the equation for α in terms of dimensional parameters is:
where m1, m2,…. m12 are the coefficients. Table 9 lists the values of coefficients m2, m3…. m12 for various colloid types. The value of m1can be calculated as:
Figure 6 compares the values of α predicted by the empirical model (Equation 13 and Table 9) developed in this study for various colloid types compared to the estimated values of α obtained from CFT using the expressions for η0 proposed by Tufenkji and Elimelech (2004) and Kamai et al. (2015). The empirical model was found to predict the sticking efficiency reasonably well for various colloids. A comparison between the Daa values predicted by CFT by multiplying Equation 9 by α calculated using the empirical model developed in this study (Equation 13 and Table 9), and the corresponding estimated values obtained from experimental data reported in the literature for viruses, bacteria, GO NPs, TiO2 NPs, and CML colloids, is shown in Supplementary Figure 1. It is clear from Figures 3–5 and Supplementary Figure 1 that the performance of CFT in predicting the Daa values improved (p < .001, R2 = 0.65−0.95) when Daa(CFT) (Equation 9) was multiplied by α calculated using the empirical model developed in this study (Equation 13 and Table 9).
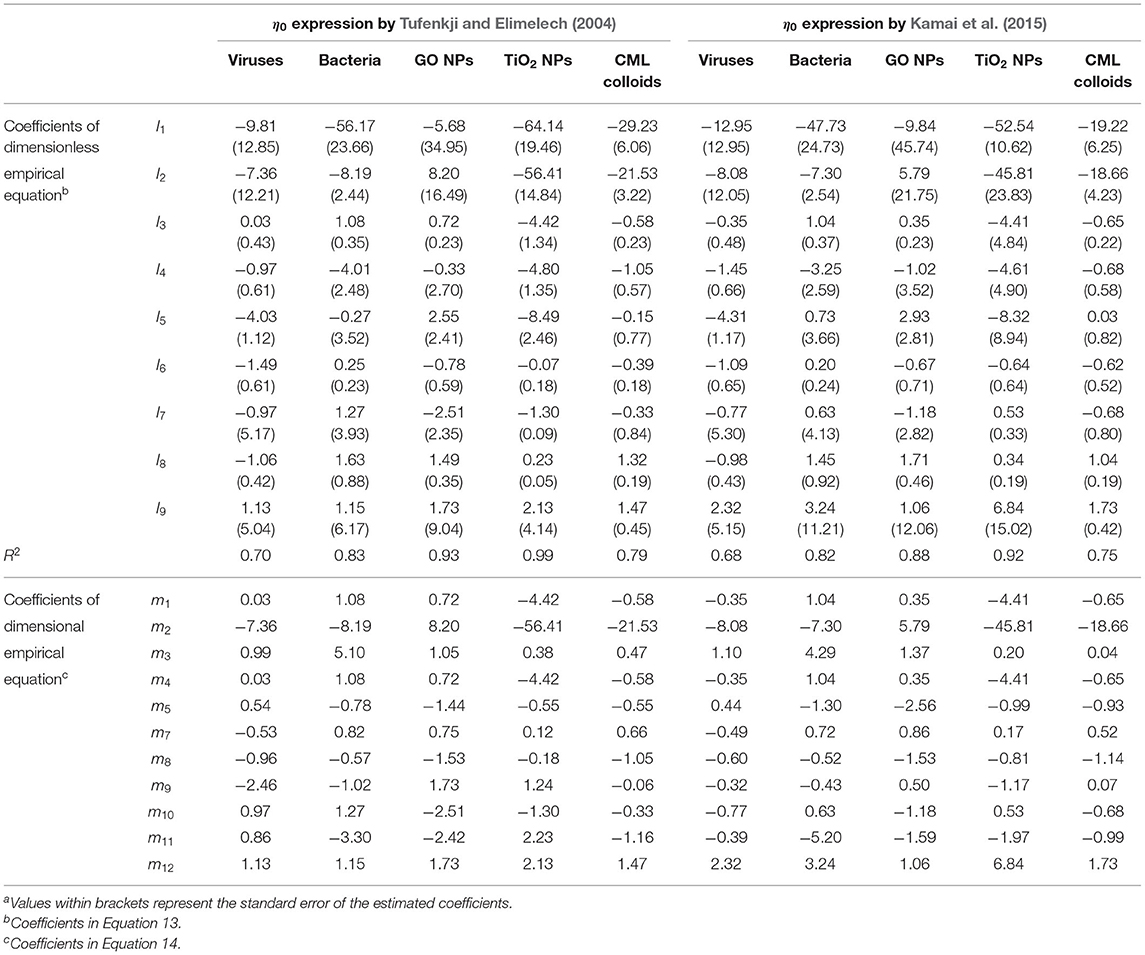
Table 9. Estimated values of coefficients in the empirical equations of α for various colloidsa.
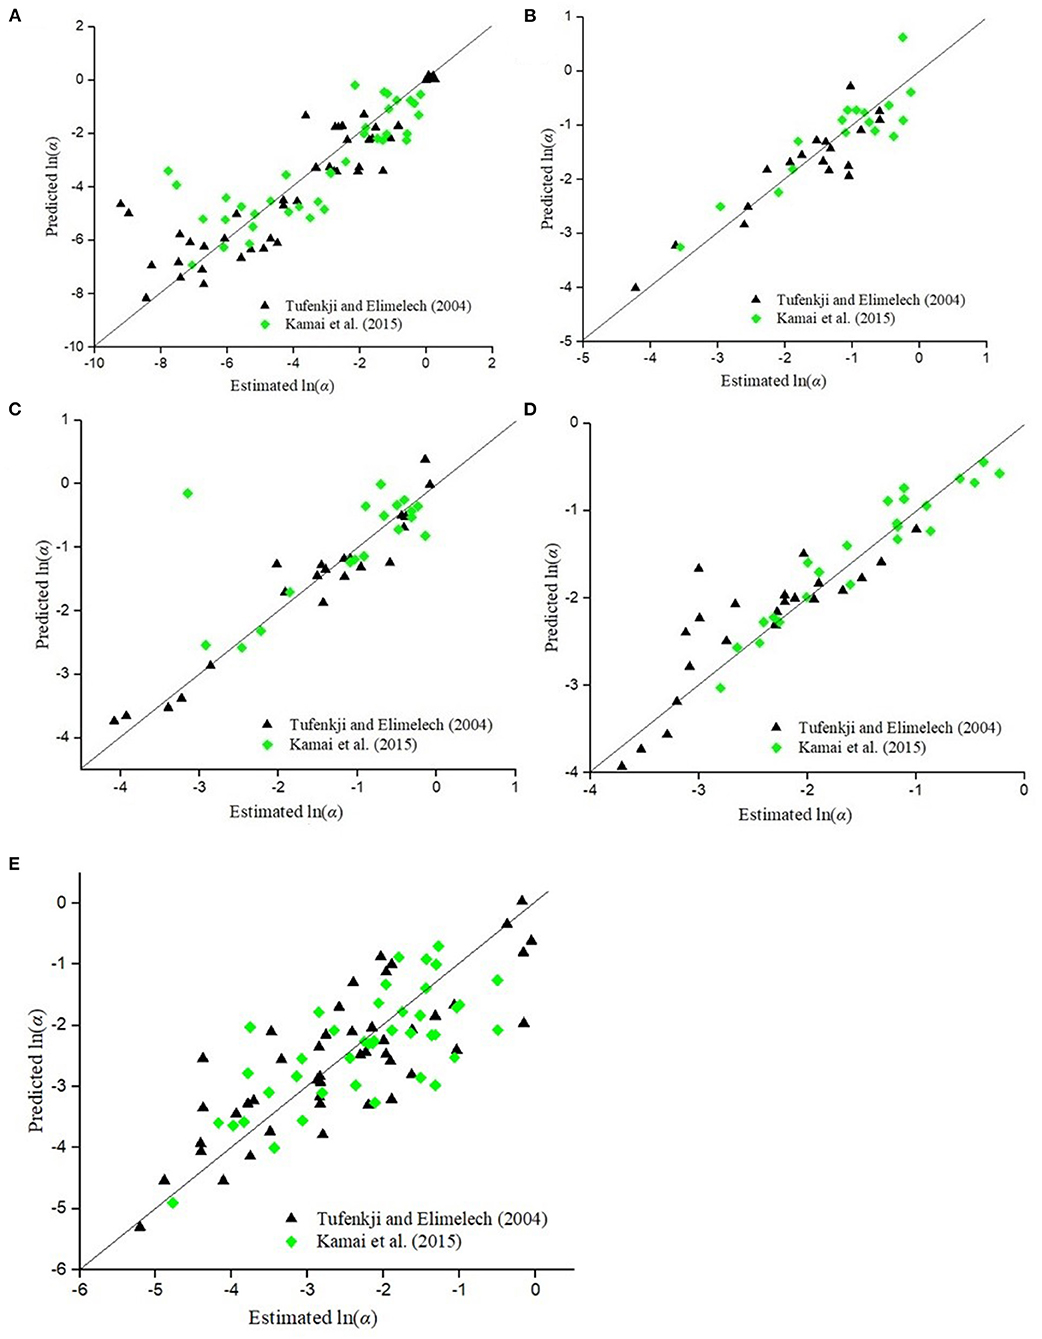
Figure 6. Comparison of α values predicted by the empirical model Equation (13) developed in this study with the corresponding values calculated as the ratio of experimentally estimated Daa and Daa(CFT) for η0 expressions proposed by Tufenkji and Elimelech (2004) and Kamai et al. (2015) for (A) viruses, (B) bacteria, (C) GO NPs, (D) TiO2 NPs, and (E) CML colloids.
Conclusion
Empirical equations to estimate the first-order deposition rate coefficients of viruses, bacteria, GO NPs, Ag NPs, TiO2 NPs, and CML colloids to grain surfaces were developed as a function of 11 physicochemical parameters, including porosity, mean pore-water velocity, median grain size, colloid radius, solution ionic strength, surface potentials of colloids and grains, Hamaker constant, temperature, viscosity of water, and dielectric constant. Deposition of bacteria, GO NPs, Ag NPs, and TiO2 NPs was described using an irreversible kinetic model, whereas the deposition of viruses and CML colloids was described using a reversible kinetic model. It was found that a power-law relation describes the variation of deposition rate coefficients with respect to various physicochemical parameters. The empirical model developed in this study was found to predict the attachment and detachment rate coefficients of various colloids reasonably well, and its performance was found to be better than that of CFT. The discrepancy between the simulated and expected trend of deposition rate coefficients of viruses and bacteria vis-à-vis certain parameters may be due to: (a) the broad range of values of parameters and associated deposition rate coefficients depicting varying experimental conditions simulated in this study, (b) different sources of soil used in different studies, leading to differences in grain size distribution and surface properties of soils, (c) differences in the surface properties of synthetic colloids and biocolloids used in different studies, and (d) biological factors that are not accounted for in this study. Although the model is expected to perform well in terms of predicting the rate coefficients for an unknown dataset if the parameter values, soil type, and mineral composition of soil satisfy the conditions considered in model formulation, its performance outside the considered parameter range, and in particular, for soils with different mineral compositions, needs to be explored further. Empirical expressions were developed for the sticking efficiency of viruses, bacteria, GO NPs, TiO2 NPs, and CML colloids as a function of various physicochemical parameters, which were found to improve the performance of CFT in predicting the attachment rate coefficients of these colloids.
Data Availability Statement
The original contributions presented in the study are included in the article/Supplementary Material, further inquiries can be directed to the corresponding author/s.
Author Contributions
YK: conceptualization, methodology, data curation, formal analysis, and writing—original draft. NS: conceptualization, methodology, writing—review and editing, and supervision. All authors contributed to the article and approved the submitted version.
Funding
The authors acknowledge the funding received from Department of Science and Technology, Government of India [grant number: DST/TM/WTI/WIC/2K17/100(G) 2] for carrying out this research.
Conflict of Interest
The authors declare that the research was conducted in the absence of any commercial or financial relationships that could be construed as a potential conflict of interest.
Publisher's Note
All claims expressed in this article are solely those of the authors and do not necessarily represent those of their affiliated organizations, or those of the publisher, the editors and the reviewers. Any product that may be evaluated in this article, or claim that may be made by its manufacturer, is not guaranteed or endorsed by the publisher.
Supplementary Material
The Supplementary Material for this article can be found online at: https://www.frontiersin.org/articles/10.3389/frwa.2022.827923/full#supplementary-material
References
Bai, H., Cochet, N., Drelich, A., Pauss, A., and Lamy, E. (2016). Comparison of transport between two bacteria in saturated porous media with distinct pore size distribution. RSC Adv. 6, 14602–14614. doi: 10.1039/C5RA21695H
Bai, R., and Tien, C. (1999), Particle deposition under unfavorable surface interactions. J. Colloid Interface Sci.. 218, 488–499. doi: 10.1006/jcis.1999.6424
Bayat, A. E., Junin, R., Derahman, M. N., and Samad, A. A. (2015). TiO2 nanoparticle transport and retention through saturated limestone porous media under various ionic strength conditions. Chemosphere 134, 7–15. doi: 10.1016/j.chemosphere.2015.03.052
Bradford, S. A., Simunek, J., Bettahar, M., Van Genuchten, M. T., and Yates, S. R. (2003). Modeling colloid attachment, straining, and exclusion in saturated porous media. Environ. Sci. Technol. 37, 2242–2250. doi: 10.1021/es025899u
Chen, G., and Zhu, H. (2004). Bacterial deposition in porous medium as impacted by solution chemistry. Res. Microbiol. 155, 467–474. doi: 10.1016/j.resmic.2004.02.004
Chowdhury, I., Hong, Y., Honda, R. J., and Walker, S. L. (2011). Mechanisms of TiO2 nanoparticle transport in porous media: role of solution chemistry, nanoparticle concentration, and flowrate. J. Colloid Interface Sci. 360, 548–555. doi: 10.1016/j.jcis.2011.04.111
Chrysikopoulos, C. V., and Aravantinou, A. F. (2014). Virus attachment onto quartz sand: Role of grain size and temperature. J. environ. Chem. Eng. 2, 796–801.
Chu, Y., Jin, Y., Baumann, T., and Yates, M. V. (2003). Effect of soil properties on saturated and unsaturated virus transport through columns. J. Environ. Qual. 32, 2017–2025. doi: 10.2134/jeq2003.2017
Elimelech, M. (1992). Predicting collision efficiencies of colloidal particles in porous media. Water Resour. Res. 26, 1–8, doi: 10.1016/0043-1354(92)90104-C
Fang, J., Xu, M., Wang, D., Wen, B., and Han, J. Y. (2013). Modeling the transport of TiO2 nanoparticle aggregates in saturated and unsaturated granular media: effects of ionic strength and pH. Water Res. 47, 1399–1408. doi: 10.1016/j.watres.2012.12.005
Foppen, J. W., Van Herwerden, M., and Schijven, J. (2007). Measuring and modelling straining of Escherichia coli in saturated porous media. J. Contaminant Hydrol. 93, 236–254. doi: 10.1016/j.jconhyd.2007.03.001
Foppen, J. W. A., Mporokoso, A., and Schijven, J. F. (2005). Determining straining of Escherichia coli from breakthrough curves. J. Contaminant Hydrol. 76, 191–210. doi: 10.1016/j.jconhyd.2004.08.005
Hedayati, M., Sharma, P., Katyal, D., and Fagerlund, F. (2016). Transport and retention of carbon-based engineered and natural nanoparticles through saturated porous media. J. Nanoparticle Res. 18, 1–11. doi: 10.1007/s11051-016-3365-6
Hendry, M. J., Lawrence, J. R., and Maloszewski, P. (1999). Effects of velocity on the transport of two bacteria through saturated sand. Ground Water 37, 103–112. doi: 10.1111/j.1745-6584.1999.tb00963.x
Jewett, D. G., Hilbert, T. A., Logan, B. E., Arnold, R. G., and Bales, R. C. (1995). Bacterial transport in laboratory columns and filters: influence of ionic strength and pH on collision efficiency. Water Res. 29, 1673–1680. doi: 10.1016/0043-1354(94)00338-8
Johnson, W. P., Li, X., and Assemi, S. (2007). Deposition and re-entrainment dynamics of microbes and non-biological colloids during non-perturbed transport in porous media in the presence of an energy barrier to deposition. Adv. Water Resour. 30, 1432–1454. doi: 10.1016/j.advwatres.2006.05.020
Kamai, T., Nassar, M. K., Nelson, K. E., and Ginn, T. R. (2015). Colloid filtration prediction by mapping the correlation-equation parameters from transport experiments in porous media. Water Resour. Res. 51, 8995–9012. doi: 10.1002/2015WR017403
Kasel, D., Bradford, S. A., Šimunek, J., Heggen, M., Vereecken, H., and Klumpp, E. (2013). Transport and retention of multi-walled carbon nanotubes in saturated porous media: effects of input concentration and grain size. Water Res. 47, 933–944. doi: 10.1016/j.watres.2012.11.019
Keller, A. A., Sirivithayapakorn, S., and Chrysikopoulos, C. V. (2004). Early breakthrough of colloids and bacteriophage MS2 in a water-saturated sand column. Water Resour. Res. 40, 1–11. doi: 10.1029/2003WR002676
Kim, H. N., and Walker, S. L. (2009). Escherichia coli transport in porous media: influence of cell strain, solution chemistry, and temperature. Colloid. Surf. B Biointerfaces 71, 160–167. doi: 10.1016/j.colsurfb.2009.02.002
Knappett, P. S., Emelko, M. B., Zhuang, J., and McKay, L. D. (2008). Transport and retention of a bacteriophage and microspheres in saturated, angular porous media: effects of ionic strength and grain size. Water Res. 42, 4368–4378. doi: 10.1016/j.watres.2008.07.041
Li, X., and Johnson, W. P. (2005). Nonmonotonic variations in deposition rate coefficients of microspheres in porous media under unfavorable deposition conditions. Environ. Sci. Technol. 39, 1658–1665. doi: 10.1021/es048963b
Li, X., Scheibe, T. D., and Johnson, W. P. (2004). Apparent decreases in colloid deposition rate coefficients with distance of transport under unfavorable deposition conditions: a general phenomenon. Environ. Sci. Technol. 38, 5616–5625. doi: 10.1021/es049154v
Li, X., Zhang, P., Lin, C. L., and Johnson, W. P. (2005). Role of hydrodynamic drag on microsphere deposition and re-entrainment in porous media under unfavorable conditions. Environ. Sci. Technol. 39, 4012–4020. doi: 10.1021/es048814t
Li, Z., Sahle-Demessie, E., Hassan, A. A., and Sorial, G. A. (2011). Transport and deposition of CeO2 nanoparticles in water-saturated porous media. Water Res. 45, 4409–4418. doi: 10.1016/j.watres.2011.05.025
Liang, Y., Bradford, S. A., Simunek, J., Vereecken, H., and Klumpp, E. (2013). Sensitivity of the transport and retention of stabilized silver nanoparticles to physicochemical factors. Water Res. 47, 2572–2582. doi: 10.1016/j.watres.2013.02.025
Liang, Y., Zhou, J., Dong, Y., Klumpp, E., Šimunek, J., and Bradford, S. A. (2020). Evidence for the critical role of nanoscale surface roughness on the retention and release of silver nanoparticles in porous media. Environ. Poll. 258:113803. doi: 10.1016/j.envpol.2019.113803
Lv, X., Gao, B., Sun, Y., Dong, S., Wu, J., Jiang, B., et al. (2016). Effects of grain size and structural heterogeneity on the transport and retention of nano-TiO2 in saturated porous media. Sci. Tot. Environ. 563, 987–995. doi: 10.1016/j.scitotenv.2015.12.128
Ma, E., Ouahbi, T., Wang, H., Ahfir, N. D., Alem, A., and Hammadi, A. (2017). Modeling of retention and re-entrainment of mono- and poly-disperse particles: effects of hydrodynamics, particle size and interplay of different-sized particles retention. Sci. Tot. Environ. 596–597, 222–229. doi: 10.1016/j.scitotenv.2017.03.254
Ma, H., Pedel, J., Fife, P., and Johnson, W. P. (2009). Hemispheres-in-cell geometry to predict colloid deposition in porous media. Environ. Sci. Technol. 43, 8573–8579. doi: 10.1021/es901242b
Mitropoulou, P. N., Syngouna, V. I., and Chrysikopoulos, C. V. (2013). Transport of colloids in unsaturated packed columns: role of ionic strength and sand grain size. Chemical Eng. J. 232, 237–248. doi: 10.1016/j.cej.2013.07.093
Nelson, K. E., and Ginn, T. R. (2011). New collector efficiency equation for colloid filtration in both natural and engineered flow conditions. Water Resour. Res. 47:9587. doi: 10.1029/2010WR009587
Park, C. M., Heo, J., Her, N., Chu, K. H., Jang, M., and Yoon, Y. (2016). Modeling the effects of surfactant, hardness, and natural organic matter on deposition and mobility of silver nanoparticles in saturated porous media. Water Res. 103, 38–47. doi: 10.1016/j.watres.2016.07.022
Park, Y., Atwill, E. R., Ho, L., Packman, A. I., and Harter, T. (2012). Deposition of cryptosporidium parvum Oocysts in porous media: a synthesis of attachment efficiencies measured under varying environmental conditions. Environ. Sci. Technol. 46, 9491–9500. doi: 10.1021/es300564w
Qi, Z., Zhang, L., Wang, F., Hou, L., and Chen, W. (2014). Factors controlling transport of graphene oxide nanoparticles in saturated sand columns. Environ. Toxicol. Chem. 33, 998–1004. doi: 10.1002/etc.2525
Rajagopalan, R., and Tien, C. (1976). Trajectory analysis of deep-bed filtration with the sphere-in-cell porous media model. AIChE J. 22, 523–533. doi: 10.1002/aic.690220316
Redman, J. A., Walker, S. L., and Elimelech, M. (2004). Bacterial adhesion and transport in porous media: role of the secondary energy minimum. Environ. Sci. Technol. 38, 1777–1785. doi: 10.1021/es034887l
Ryan, J. N., and Elimelech, M. (1996). Colloid mobilization and transport in groundwater. Colloid. Surf. A Physicochem. Eng. Aspects 107, 1–56. doi: 10.1016/0927-7757(95)03384-X
Sadeghi, G., Schijven, J. F., Behrends, T., Hassanizadeh, S. M., Gerritse, J., and Kleingeld, P. J. (2011). Systematic study of effects of pH and ionic strength on attachment of phage PRD1. Ground Water 49, 12–19. doi: 10.1111/j.1745-6584.2010.00767.x
Sasidharan, S., Bradford, S. A., Šimunek, J., Torkzaban, S., and Vanderzalm, J. (2017a). Transport and fate of viruses in sediment and stormwater from a managed aquifer recharge site. J. Hydrol. 555, 724–735. doi: 10.1016/j.jhydrol.2017.10.062
Sasidharan, S., Torkzaban, S., Bradford, S. A., Cook, P. G., and Gupta, V. V. S. R. (2017b). Temperature dependency of virus and nanoparticle transport and retention in saturated porous media. J. Contaminant Hydrol. 196, 10–20. doi: 10.1016/j.jconhyd.2016.11.004
Schijven, J. F., Hassanizadeh, S. M., Dowd, S. E., and Pillai, S. D. (2000). Modeling virus adsorption in batch and column experiments. Quantitat. Microbiol. 2, 5–20. doi: 10.1023/A:1010062728286
Schijven, J. F., Sadeghi, G., and Hassanizadeh, S. M. (2016). Long-term inactivation of bacteriophage PRD1 as a function of temperature, pH, sodium and calcium concentration. Water Res. 103, 66–73. doi: 10.1016/j.watres.2016.07.010
Schinner, T., Letzner, A., Liedtke, S., Castro, F. D., Eydelnant, I. A., and Tufenkji, N. (2010). Transport of selected bacterial pathogens in agricultural soil and quartz sand. Water Res. 44, 1182–1192. doi: 10.1016/j.watres.2008.11.038
Seetha, N., Kumar, M. M., and Hassanizadeh, S. M. (2015b). Modeling the co-transport of viruses and colloids in unsaturated porous media. J. Contaminant Hydrol. 181, 82–101. doi: 10.1016/j.jconhyd.2015.01.002
Seetha, N., Majid Hassanizadeh, S., Mohan Kumar, M. S., and Raoof, A. (2015a). Correlation equations for average deposition rate coefficients of nanoparticles in a cylindrical pore. Water Resour. Res. 51, 8034–8059, doi: 10.1002/2015WR017723
Seetha, N., Raoof, A., Mohan Kumar, M. S., and Majid Hassanizadeh, S. (2017). Upscaling of nanoparticle transport in porous media under unfavorable conditions: pore scale to Darcy scale. J. Contaminant Hydrol. 200, 1–14. doi: 10.1016/j.jconhyd.2017.03.002
Shen, C., Huang, Y., Li, B., and Jin, Y. (2008). Effects of solution chemistry on straining of colloids in porous media under unfavorable conditions. Water Resour. Res. 44, 1–12. doi: 10.1029/2007WR006580
Sun, Y., Gao, B., Bradford, S. A., Wu, L., Chen, H., Shi, X., et al. (2015). Transport, retention, and size perturbation of graphene oxide in saturated porous media: effects of input concentration and grain size. Water Res. 68, 24–33. doi: 10.1016/j.watres.2014.09.025
Syngouna, V. I., and Chrysikopoulos, C. V. (2012). Transport of biocolloids in water saturated columns packed with sand: effect of grain size and pore water velocity. J. Contaminant Hydrol, 129–130, 11–24. doi: 10.1016/j.jconhyd.2012.01.010
Syngouna, V. I., and Chrysikopoulos, C. V. (2013). Cotransport of clay colloids and viruses in water saturated porous media. Colloids Surf. A. 416, 56–65, doi: 10.1016/j.colsurfa.2012.10.018
Syngouna, V. I., and Chrysikopoulos, C. V. (2015). Experimental investigation of virus and clay particles cotransport in partially saturated columns packed with glass beads. J. Colloid Interface Sci. 440, 140–150. doi: 10.1016/j.jcis.2014.10.066
Tian, Y., Gao, B., Silvera-Batista, C., and Ziegler, K. J. (2010). Transport of engineered nanoparticles in saturated porous media. J. Nanoparticle Res. 12, 2371–2380. doi: 10.1007/s11051-010-9912-7
Toloni, I., Lehmann, F., and Ackerer, P. (2014). Modeling the effects of water velocity on TiO2 nanoparticles transport in saturated porous media. J. Contaminant Hydrol. 171, 42–48. doi: 10.1016/j.jconhyd.2014.10.004
Tong, M., and Johnson, W. P. (2006). Excess colloid retention in porous media as a function of colloid size, fluid velocity, and grain angularity. Environ. Sci. Technol. 40, 7725–7731. doi: 10.1021/es061201r
Tong, M., Li, X., Brow, C. N., and Johnson, W. P. (2005). Detachment-influenced transport of an adhesion-deficient bacterial strain within water-reactive porous media. Environ. Sci. Technol. 39, 2500–2508. doi: 10.1021/es049013t
Torkzaban, S., Bradford, S. A., van Genuchten, M. T., and Walker, S. L. (2008a). Colloid transport in unsaturated porous media: the role of water content and ionic strength on particle straining. J. Contaminant Hydrol. 96, 113–127. doi: 10.1016/j.jconhyd.2007.10.006
Torkzaban, S., Tazehkand, S. S., Walker, S. L., and Bradford, S. A. (2008b). Transport and fate of bacteria in porous media: coupled effects of chemical conditions and pore space geometry. Water Resour. Res. 44:6541. doi: 10.1029/2007WR006541
Tufenkji, N., and Elimelech, M. (2004). Correlation equation for predicting single-collector efficiency in physicochemical filtration in saturated porous media. Environ. Sci. Technol. 38, 529–536. doi: 10.1021/es034049r
Tufenkji, N., and Elimelech, M. (2005). Breakdown of colloid filtration theory: role of the secondary energy minimum and surface charge heterogeneities. Langmuir 21, 841–852. doi: 10.1021/la048102g
Wan, J., and Tokunaga, T. K. (2002). Partitioning of clay colloids at air–water interfaces. J. Colloid Interface Sci. 247, 54–61. doi: 10.1006/jcis.2001.8132
Wang, C., Bobba, A. D., Attinti, R., Shen, C., Lazouskaya, V., Wang, L. P., et al. (2012). Retention and transport of silica nanoparticles in saturated porous media: effect of concentration and particle size. Environ. Sci. Technol. 46, 7151–7158. doi: 10.1021/es300314n
Wang, M., Gao, B., Tang, D., Sun, H., Yin, X., and Yu, C. (2017). Effects of temperature on graphene oxide deposition and transport in saturated porous media. J. Hazard. Mater. 331, 28–35. doi: 10.1016/j.jhazmat.2017.02.014
Yao, K.-M., Habibian, M. T., and O'Melia, C. R. (1971). Water and waste water filtration: concepts and applications. Environ. Sci. Technol. 5, 8153–8158. doi: 10.1021/es60058a005
Keywords: colloids, viruses, bacteria, nanoparticles, deposition, attachment rate coefficient, porous media
Citation: Krishna YSR and Seetha N (2022) Predicting the Rate Coefficients of Attachment and Detachment of Colloids in Saturated Porous Media. Front. Water 4:827923. doi: 10.3389/frwa.2022.827923
Received: 02 December 2021; Accepted: 07 February 2022;
Published: 21 March 2022.
Edited by:
Jan Willem Foppen, IHE Delft Institute for Water Education, NetherlandsReviewed by:
Vasileios Katzourakis, Technical University of Crete, GreeceVasiliki Syngouna, University of Patras, Greece
Copyright © 2022 Krishna and Seetha. This is an open-access article distributed under the terms of the Creative Commons Attribution License (CC BY). The use, distribution or reproduction in other forums is permitted, provided the original author(s) and the copyright owner(s) are credited and that the original publication in this journal is cited, in accordance with accepted academic practice. No use, distribution or reproduction is permitted which does not comply with these terms.
*Correspondence: N. Seetha, c2VldGhhQGNlLmlpdGguYWMuaW4=