
95% of researchers rate our articles as excellent or good
Learn more about the work of our research integrity team to safeguard the quality of each article we publish.
Find out more
ORIGINAL RESEARCH article
Front. Water , 17 March 2022
Sec. Water and Climate
Volume 4 - 2022 | https://doi.org/10.3389/frwa.2022.826293
This article is part of the Research Topic Hydroclimatology of the Great Lakes Region of North America View all 16 articles
 Craig A. Clark1*
 Nicholas D. Metz2
 Kevin H. Goebbert1
 Bharath Ganesh-Babu1
 Nolan Ballard1
 Andrew Blackford1
 Andrew Bottom1
 Catherine Britt2
 Kelly Carmer3
 Quenten Davis1
 Jilliann Dufort1
 Anna Gendusa1
 Skylar Gertonson1
 Blake Harms1
 Matthew Kavanaugh1
 Jeremy Landgrebe1
 Emily Mazan1
 Hannah Schroeder1
 Nicholas Rutkowski1
 Caleb Yurk1
The Laurentian Great Lakes have substantial influences on regional climatology, particularly with impactful lake-effect snow events. This study examines the snowfall, cloud-inferred snow band morphology, and environment of lake-effect snow days along the southern shore of Lake Michigan for the 1997–2017 period. Suitable days for study were identified based on the presence of lake-effect clouds assessed in a previous study and extended through 2017, combined with an independent classification of likely lake-effect snow days based on independent snowfall data and weather map assessments. The primary goals are to identify lake-effect snow days and evaluate the snowfall distribution and modes of variability, the sensitivity to thermodynamic and flow characteristics within the upstream sounding at Green Bay, WI, and the influences of snowband morphology. Over 300 lake-effect days are identified during the study period, with peak mean snowfall within the lake belt extending from southwest Michigan to northern Indiana. Although multiple lake-effect morphological types are often observed on the same day, the most common snow band morphology is wind parallel bands. Relative to days with wind parallel bands, the shoreline band morphology is more common with a reduced lower-tropospheric zonal wind component within the upstream sounding at Green Bay, WI, as well as higher sea-level pressure and 500-hPa geopotential height anomalies to the north of the Great Lakes. Snowfall is sensitive to band morphology, with higher snowfall for shoreline band structures than for wind parallel bands, especially due south of Lake Michigan. Snowfall is also sensitive to thermodynamic and flow properties, with a greater sensitivity to temperature in southwest Michigan and to flow properties in northwest Indiana.
The Great Lakes have a significant impact on the climatology of downwind locations, most notably through the presence of wintertime lake-effect snowfall. Many lake-effect events have modest snowfall, but multi-day, high impact events with substantial snowfall also occur (Niziol et al., 1995; Schmidlin and Kosarik, 1999; Kristovich et al., 2000, 2017). Large events bring greater societal costs, including dangerous road conditions, snow removal expenses, damage to trees and buildings, and power outages (Schmidlin, 1993; Schmidlin and Kosarik, 1999). These impacts have motivated a substantial body of research focused on lake-effect snow climatology (e.g., Braham and Dungey, 1995; Suriano and Leathers, 2017b), trend assessments (e.g., Burnett et al., 2003; Bard and Kristovich, 2012), field experiments (e.g., Kristovich et al., 2000, 2017), forecasting (e.g., Rothrock, 1969; Niziol, 1987), numerical simulations (e.g., Lavoie, 1972; Ballentine et al., 1998) and morphology (e.g., Hjelmfelt, 1990; Laird et al., 2017).
Some of the earliest papers provided a physical paradigm that continues to inform the present, often gleaned from case studies (e.g., Mitchell, 1921; Sheridan, 1941). This early paradigm is summarized nicely by Lavoie (1972) and highlighted the frictional difference between land and lake surfaces (Remick, 1942), as well as the role of instability and associated heat and moisture fluxes (e.g., Sheridan, 1941; Petterssen and Calabrese, 1959). Studies utilizing numerical simulations subsequently have illustrated the importance of boundary layer growth, latent heat release, topography, mesoscale circulations, and snow band morphology (e.g., Lavoie, 1972; Ballentine, 1982; Hjelmfelt, 1990; Laird et al., 2003).
Large turbulent fluxes are driven by strong vertical gradients in temperature and moisture and are common during lake-effect snow events (e.g., Agee and Hart, 1990), with additional diurnal modifications (Kristovich and Spinar, 2005) and reductions for lake ice exceeding 70% coverage (Gerbush et al., 2008). The surface sensible heat flux is critical for boundary layer growth over the lake, along with entrainment from the top of the layer (Kelly, 1982; Agee and Gilbert, 1989; Kristovich et al., 2000) and deepening associated with the mesoscale circulation (Niziol et al., 1995). The latent heat flux is critical for subsequent cloud development, latent heat release, and strengthening of the mesoscale circulation (e.g., Ballentine, 1982; Hjelmfelt and Braham, 1983).
Many forecasting parameters date back to some of the earliest research, as well as local event climatology and forecaster experience (Niziol et al., 1995), although these parameters have been reinforced and confirmed by recent studies (e.g., Baijnath-Rodino et al., 2018). These include horizontal and vertical temperature gradients, fetch over the lake and flow properties, inversion characteristics, and synoptic-scale considerations (e.g., Sheridan, 1941; Remick, 1942; Rothrock, 1969). Adding to the complexity, small-scale orographic features (Hjelmfelt, 1992; Niziol et al., 1995), substantial lake ice concentrations (e.g., Niziol et al., 1995; Cordeira and Laird, 2008), and multiple lake interactions (Sousounis and Mann, 2000; Mann et al., 2002) can affect snowfall. Based on published work and forecast experience, detailed methodologies have evolved for specific regions (e.g., Niziol, 1987).
Particularly pertinent to the present study, Rothrock (1969) presented forecasting guidelines for the Lake Michigan basin, largely determined from sounding-based parameters and based on cases from a 2-year period. Findings indicated that snowfall is primarily dependent on the lake to 850-hPa temperature difference and the fetch across the lake. The chief inhibiting factor was inversion base height, with snowfall reduced for heights below ~900 m. This inhibition has been supported by numerical simulations (Hjelmfelt, 1990), although an upstream inversion may be substantially altered as the boundary layer deepens across the lake (Agee and Gilbert, 1989; Chang and Braham, 1991; Niziol et al., 1995; Kristovich et al., 2003). Strong wind shear (Rothrock, 1969; Niziol, 1987) and low upstream relative humidity (Rothrock, 1969; Hjelmfelt, 1990) can also inhibit snowfall.
Climatological evaluations of lake-effect snowfall have been extensive in the literature, including satellite-based climatology (Laird et al., 2017), lake-effect contribution to seasonal snowfall (e.g., Chagnon, 1968; Braham and Dungey, 1995), trend assessments (e.g., Burnett et al., 2003; Kunkel et al., 2009; Bard and Kristovich, 2012; Clark et al., 2016), 21st century projections (Kunkel et al., 2002; Notaro et al., 2015; Suriano and Leathers, 2016), sensitivity to teleconnection patterns (Kluver and Leathers, 2015; Clark et al., 2016, 2018; Suriano and Leathers, 2017a), and seasonal prediction (Kluver and Leathers, 2015). For trend assessments and the influences of canonical teleconnections, a challenge is posed by the difficulty isolating the lake-effect contribution to seasonal snowfall, with estimates sensitive to methodology (Braham and Dungey, 1995). This uncertainty has been addressed by using transects to estimate the lake contribution to snowfall (Bard and Kristovich, 2012), or employing daily-scale classification to estimate synoptic patterns (Leathers and Ellis, 1996; Suriano and Leathers, 2017a) and snowfall (Clark et al., 2020) associated with lake-effect events.
The morphology of lake-effect snow bands has been explored through analyses of satellite data (Kristovich and Steve, 1995; Laird et al., 2017), field experiments (e.g., Kristovich et al., 2017; Mulholland et al., 2017) and numerical simulations (Hjelmfelt, 1990; Laird et al., 2003; Laird and Kristovich, 2004). Laird and Kristovich (2004) demonstrated that the ratio of wind speed (U) to maximum fetch distance (L) is useful in separating morphology, with a higher U/L exceeding ~0.09 m s−1 km−1 for wind-parallel events (Laird et al., 2003). These wind-parallel events are the most common in the western Great Lakes (Kristovich and Steve, 1995; Laird et al., 2017), with cross-lake winds generating multiple bands (Braham, 1983) associated with horizontal rolls and cellular structures (Kelly, 1984; Kristovich and Steve, 1995). While not as common in the western Great Lakes (e.g., Laird et al., 2017), mid-lake and shoreline bands are associated with a lower U/L (Laird et al., 2003), while mesoscale vortices occur with weak flow (Forbes and Merritt, 1984; Laird and Kristovich, 2004) and are comparatively rare (Hjelmfelt, 1990; Laird et al., 2017). In addition to these primary band types, smaller misovortices have been observed within other band structures (Kristovich and Steve, 1995; Mulholland et al., 2017). Herein, the sensitivity of snowfall to band morphology is examined.
The present study combines the satellite-inferred cloud data from Laird et al. (2017), an update to the cloud data set through December 2017, and the classification approach from Clark et al. (2020) in order to examine the lake-effect snow day climatology along the southern shore of Lake Michigan. Based on these lake-effect snowfall days from 1997 to 2017, the present study examines the climatology in order to address the following questions:
1. What is the sensitivity of lake-effect snowfall along the southern shore of Lake Michigan to lake band morphology?
2. What large-scale meteorological pattern across North America is associated with lake-effect days along the southern shore of Lake Michigan?
a. What is the sensitivity of lake band morphology to the large-scale pattern?
3. What is the sensitivity of snowfall to thermodynamic and wind characteristics from the upstream sounding at Green Bay, WI?
a. How does this sensitivity vary spatially within the region?
b. What is the sensitivity of lake band morphology to the sounding variables?
Precipitation data from the National Weather Service Cooperative Observer Program (COOP) sites were retrieved from the National Centers for Environmental Information (NCEI). The study region surrounds the southern shore of Lake Michigan, as defined by the southern sub-regions of the Clark et al. (2016, 2018) Lake Michigan basin snowfall climatology. As described in detail within Clark et al. (2016), stations were selected in order to represent six subregions surrounding the lake during a 1950–2013 study period and screened for missing data. In addition to the southern subregions within the previous study, LaPorte and Wanatah, IN, are included in the present study in order to better resolve the snowfall sensitivity to wind direction and morphology along the southern shore. The region for the present study is shown in Figure 1, with station information provided in Table 1.
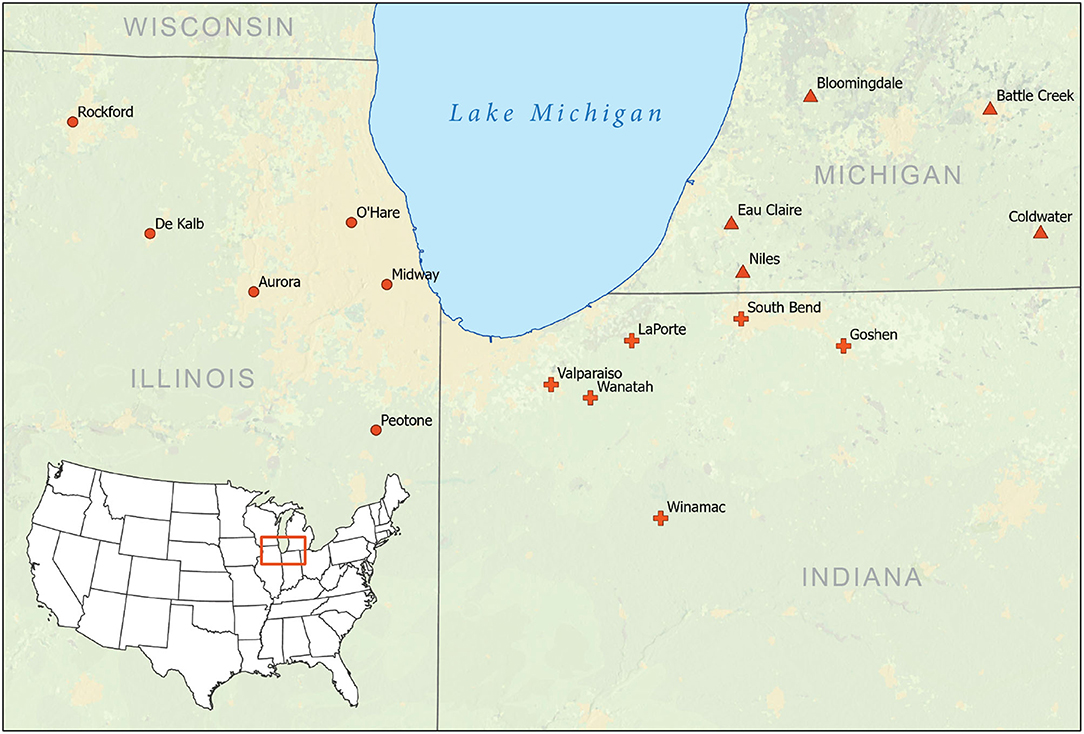
Figure 1. Map of stations included in the analysis of lake-effect snowfall along the southern shore of Lake Michigan. Dots, pluses, and triangles denote stations in IL, IN, and MI, respectively.
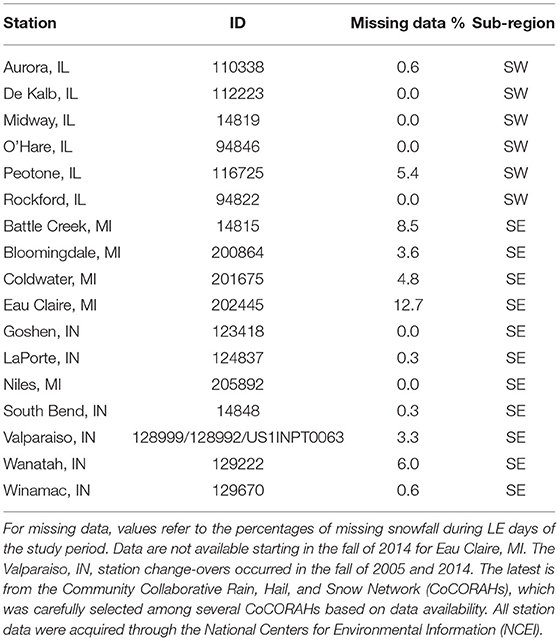
Table 1. Information on snowfall locations, including the identification number, missing data indicator, and sub-region from Clark et al. (2016).
Lake-effect snow band morphology was obtained from the 17-cold season lake-effect cloud climatology described by Laird et al. (2017). This climatology was recently updated through the end of 2017, creating a nearly 21-cold season climatology of lake-effect cloud events used herein. In short, visible satellite imagery for each cold-season day spanning October through March was visually inspected using stepwise animation to identify the lake-effect snow band type present over each lake on each day. For a given day, each lake could feature wind-parallel bands (WPB), shoreline bands (SPB), mesoscale vorticies (MSV), or unclear lake-effect organization along with synoptic cloudiness. Each lake could receive multiple band-type characterizations on a single day as the cloud structure often evolved on a given day or multiple cloud types were routinely identified simultaneously. For more detail on the cloud-band climatology, see Laird et al. (2017) and Section Data and Methods.
Since the cloud-inferred lake-effect days (LE_cloud) frequently have synoptic clouds observed on the same day, a complementary identification of likely lake-effect snowfall days (LE_envsnow) was completed following the approach within Clark et al. (2020) for the classification of November snow days in the Lake Michigan region. The process is summarized here, with examples and comparison with a cluster-based approach provided in Clark et al. (2020). For each of the October through March days within the October 1997 to December 2017 study period during which peak snowfall was at least 2 cm, the identification of likely lake-effect days was based on the snowfall distribution and visual inspection of the surface map depiction from the Daily Weather Map online archive [from the National Oceanic and Atmospheric Administration (NOAA) Central Library Data Imaging Project] and upper-level maps available through the online archive through the NOAA Storm Prediction Center and/or maps produced using NOAA/National Center for Environmental Prediction/National Center for Atmospheric Research Reanalysis 1 (Kalnay et al., 1996). Although this study is concerned with locations along the southern shore of Lake Michigan, the precipitation map within the Daily Weather Map and snowfall from the other four Clark et al. (2016) sub-regions was sometimes helpful in isolating lake-effect days (station information for these supplementary locations is provided in Supplementary Table 1).
Likely LE_envsnow days were indicated by a lack of a synoptic-scale disturbance as a probable forcing for precipitation in the region, as well as the spatial snowfall distribution. Since the timing of snowfall is important for interpretation and the reporting time of 24-h snowfall measurements varies among the stations, Monthly Record of Climatological Observations Form reports from COOP observers were consulted in many instances; these were especially helpful in cases for which the observer noted the time period over which the snowfall occurred. To minimize error, there were three independent sets of evaluations for each day. Two were completed by co-authors, with an additional evaluation from the lead author. Cases with disagreement between the evaluations were re-considered. For cases in November, the identified days within Clark et al. (2020) through 2012 were utilized.
LE_envsnow days herein are intended as “pure” lake-effect days, with significant (≥2 cm) snowfall entirely or primarily confined to downwind locations and a lack of substantial map-based, synoptic-scale forcing for precipitation. For days with a broad pattern of significant snowfall through the region, then LE_envsnow is not the deemed designation. Although lake enhancement can occur as synoptic-scale disturbances impact the region, the focus in this study is pure lake-effect days and their sensitivity to the environment.
Many of the days with snowfall in the region are not identified as LE_envsnow days; these are not the focus of the current study, but are briefly described here and with more detail in Clark et al. (2020). For most of these non-LE_envsnow days, denoted as system (SYS) snow days in Clark et al. (2020), there is map-based evidence of synoptic-scale forcing from migrating mid-latitude cyclones in the region. There is also typically a broad pattern of snowfall through the region, although the progression of synoptic disturbances through the region can result in snowfall in locations west or east of the lake. Other non-likely lake-effect days are delineated as Both (system snow days with substantial likely lake augmentation), Remnant (snowfall of at least 2 cm actually occurred the previous calendar day based on archived monthly observer reports of timing), Unclear (for days with unclear forcing and timing issues, if not error), and Insignificant (the peak snowfall report is <2 cm).
The days with both LE_cloud and LE_envsnow designations are evaluated in the present study and denoted as lake-effect (LE) days. For an assessment of the sensitivity of LE day snowfall to variables gleaned from the sounding at Green Bay, WI, sounding data were retrieved from online archives at the University of Wyoming. Thermodynamic and flow variables were extracted at mandatory levels in order to examine their correlations with snowfall. In order to create sounding composites, the radiosonde data were linearly interpolated to every millibar and analyzed using the MetPy library (May et al., 2021). For the assessment of inversion characteristics, the lowest non-surface-based temperature inversion through 700 hPa was examined, with the strength defined as the amount of warming from the base of the inversion to the top. Surface-based inversions weren't included, since these nocturnal near-surface inversions may be quickly obviated by the sensible heat flux from the warm lake. In order to examine the temperature difference between mandatory levels and Lake Michigan, the daily Lake Michigan temperature was provided through the Great Lakes Surface Environmental Analysis and acquired online through the Great Lakes Environmental Research Laboratory.
Sounding data at 00 and 12 UTC were evaluated; the sensitivity of snowfall to the 12 UTC sounding variables was stronger and is shown herein. An alternative “best time” approach was also considered, based on a comparison of 00 and 12 UTC conditions each day, but this introduces a bias regarding which thermodynamic or flow property is prioritized. The sensitivities of LE day snowfall to sounding variables were assessed using data visualization and Pearson correlation coefficients (with reported significance based on a 95% confidence interval). Since independent observations cannot be assumed with instances of neighboring lake-effect days, a bootstrapping approach was also used for these significance assessments. Specifically, 10,000 realizations of 100-member sub-samples were generated, with the correlation calculated for each; if the resulting 95% of the correlation distribution doesn't include zero, then the correlation is deemed significant.
For visualization of large-scale patterns associated with the LE snow days, maps of the NOAA/National Center for Environmental Information/National Center for Atmospheric Research Reanalysis 1 data were generated. Daily anomalies at 12 UTC were calculated for sea level pressure, 850-hPa temperature and 500-hPa geopotential height for each case, based on the 30-year climatology baseline from 1980 to 2010 for each of the days.
System and lake-effect cloud structures were observed frequently during the study period, although many lacked accumulating snowfall along the southern shore of Lake Michigan (Table 2). Roughly 82% of the days identified as likely lake-effect days had lake-effect cloud structures observed, while ~89% of the days identified as likely system snow days had synoptic cloud structures. An evaluation of mismatches reveals the key role of snowfall timing; for most of these days, 24-h snowfall reports influenced the classification of likely precipitation forcing, while the cloud data is effectively “ground truth” for the daytime hours of the date in question. For example, a day may have observed lake-effect cloud structures and a clearly favorable environment for lake-effect processes, yet not be classified as a lake-effect snow day due to a broad region of synoptically-induced snowfall from the previous night (which is reported in the morning for multiple locations). The study herein utilizes the 331 days which have observed lake-effect cloud structures and were also identified as likely lake-effect snow days. These will subsequently be referred to as lake-effect snow (LES) days. Although it is not uncommon for LE days to occur sequentially, individual days are evaluated in this study in order to evaluate the sensitivity to cloud morphology and environmental factors.
The peak snowfall varies substantially among LE days; the mean peak snowfall is a modest 9.7 cm, yet the top 5 days exceed 30 cm and the peak snowfall day was an impressive 66 cm (not shown). The highest mean snowfall occurs within the belt extending from southwest Michigan into adjacent northern Indiana, with a reduction in mean snowfall for western stations and the easternmost locations in Michigan (Figure 2). The peak snowfall region also has much more frequently observed LES, although there were ~10 days with LES west of Lake Michigan (not shown). Seasonally, the LE days span the October through March study season, with a peak of nearly one-third of the LE days in January.
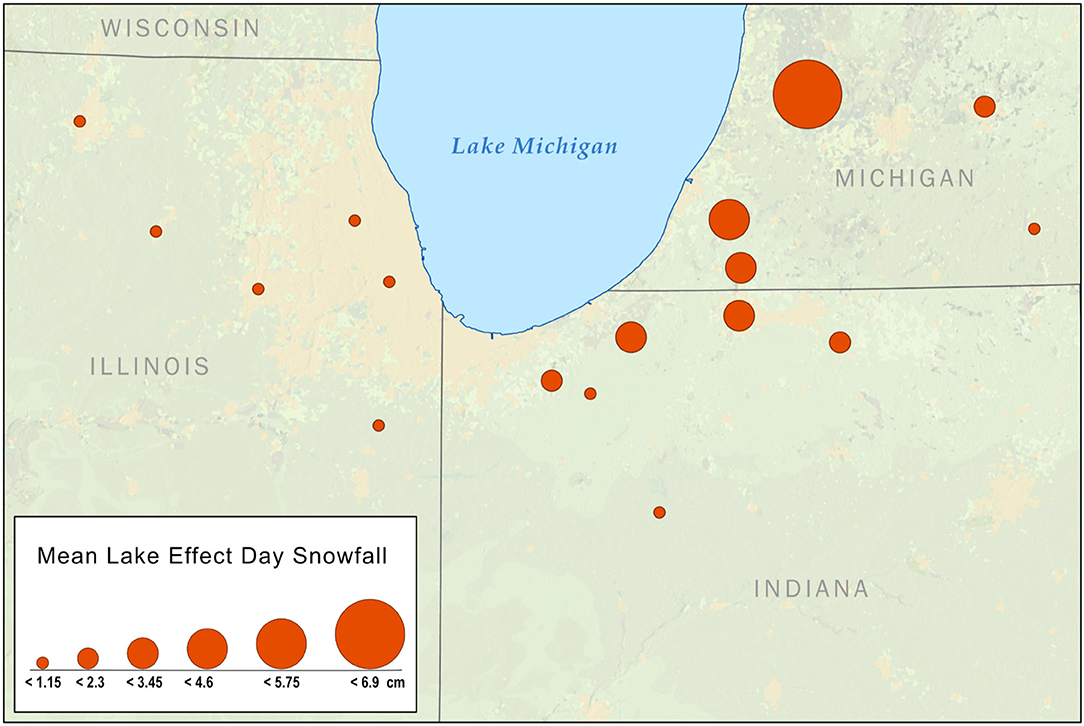
Figure 2. Map of mean snowfall (cm day−1) for LE snow days. These days include the 331 days for which there is a combination of LE_cloud and LE_envsnow designations. These LE days occurred from October (7 days) to March (27 days), with 36 in November, 71 in December, 110 in January, and 80 in February.
On LE days, the most common lake-effect cloud type is WPB, followed by SPB, Unclear morphology, and MSV (Table 3). Although many of the WPB days lack other LE morphological types, a substantial fraction of days with other morphologies have multiple types observed. Nearly three-quarters of the SPB days have multiple cloud structures observed, while nearly half of the Unclear days have other structures observed and only one MSV day lacks another morphology (Table 3). Despite this notable amount of concurrent snowband morphologies, WPB and SPB days are of great interest herein, since they are the most common. Furthermore, the less common SPB days are associated with different snowfall patterns and environments.
The mean snowfall on SPB days is higher for westernmost locations than on the more common WPB days, with a peak in northwest Indiana (Figure 3). In contrast, the far more plentiful WPB days have peak snowfall near the shoreline in southwest Michigan, and since these days are more common, they dominate the overall LE snowfall distribution (as in Figure 2). However, the impact of the less common SPB days is often substantial. In addition to the difference in spatial snowfall patterns (Figure 3), it is noteworthy that four of the top five LE day accumulations had SPB structures observed (although the WPB morphology was also documented). These four large SPB-associated snowfalls (all exceeding 30 cm) occurred at different locations within the region, including Eau Claire, Michigan, and Valparaiso, La Porte, and South Bend, Indiana.
During lake-effect snow days, negative 500-hPa geopotential height anomalies are present in the Great Lakes, with a trough axis in the eastern Great Lakes (Figure 4A). Cold anomalies at 850-hPa are also present over Lake Michigan, with northwest flow (Figure 4B). Higher than average sea-level pressure (SLP) is present over the Central United States, while lower SLP is found to the northeast (Figure 4C). Comparing the patterns per morphology, SPB days have higher 500-hPa geopotential heights and warmer 850-hPa temperatures northwest of the Great Lakes (Figures 5A,B). The difference in SLP anomalies reveals higher SLP within and to the north of the Great Lakes (Figure 5C). The wind direction over Lake Michigan on the surface and 850-hPa SPB day composites (Figures 5B,C) suggests a longer fetch than for the LE day composite (Figures 4B,C), which is consistent with Laird et al. (2003).
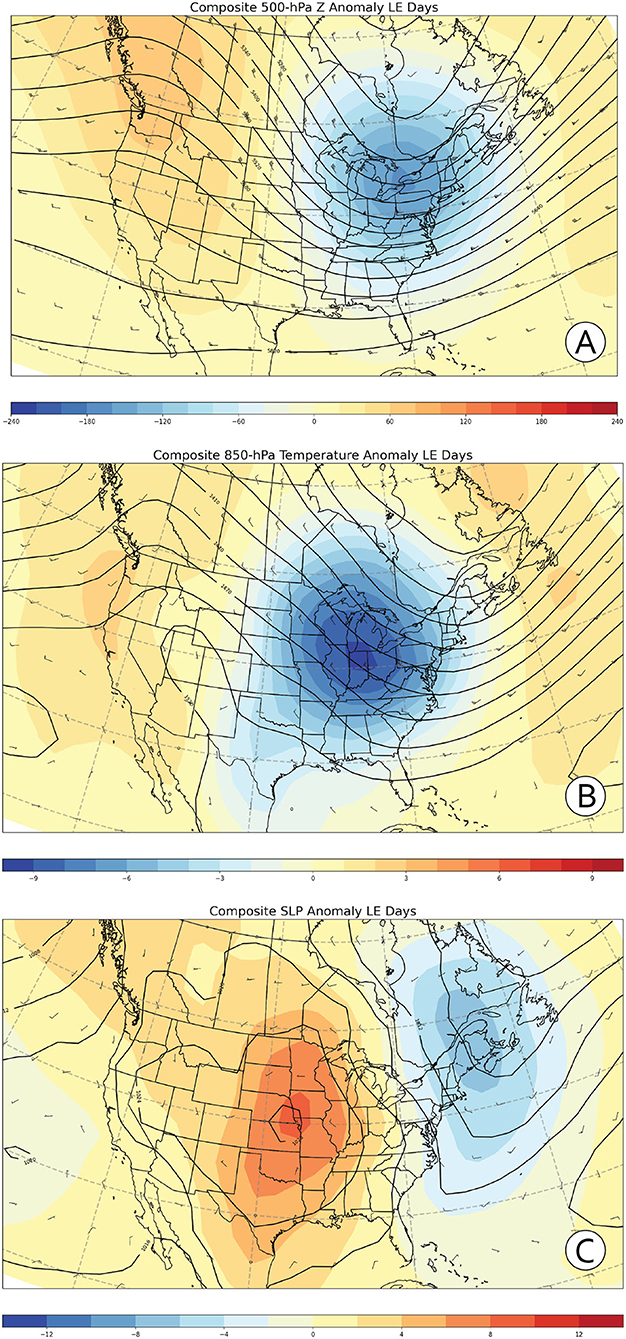
Figure 4. Composite 12 UTC anomaly maps of Reanalysis I (A) 500-hPa geopotential height, (B) 850-hPa temperature, and (C) sea-level pressure for LE days. Filled contours represent anomalies of geopotential height (upper), temperature (middle) and sea-level pressure (lower), while solid contours represent mean geopotential height (upper, middle) and sea-level pressure (lower). Wind barbs are also included. There are 331 days represented within the composite. NCEI reanalysis data provided by the NOAA Earth System Research Laboratory/Physical Sciences Division, Boulder, CO from their web site (http://www.esrl.noaa.gov/psd/).
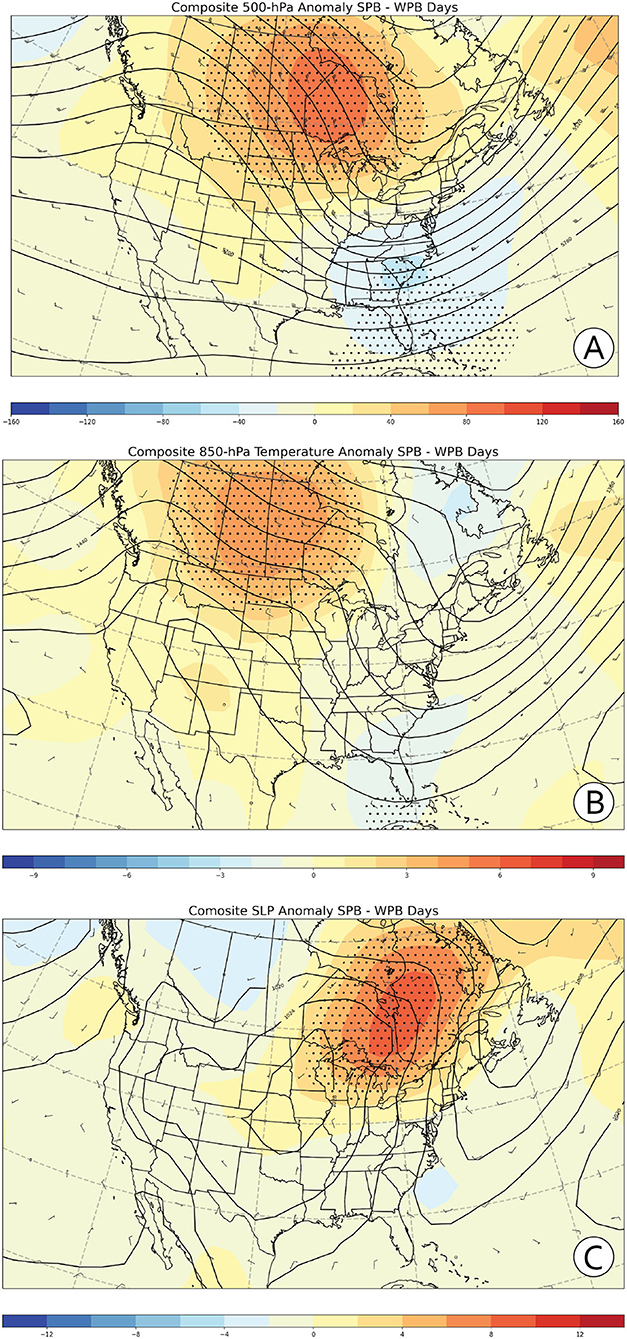
Figure 5. Composite 12 UTC Reanalysis I (A) 500-hPa geopotential height (upper), (B) 850-hPa temperature (middle) and (C) sea-level pressure (lower) differences between days with SPB and WPB cloud classifications. Differences are indicated by filled and solid contours. Dots indicate regions for which the null hypothesis of equal mean SPB and WPB 500-hPa geopotential height, 850-hPa temperature and sea-level pressure can be rejected, respectively. This assessment is based on bootstrap simulations using 10,000 50-member sub-samples.
Consistent with this environment in the Great Lakes, the sounding composite from Green Bay, WI, indicates a cold lower troposphere with northwesterly flow (Figure 6). The lower tropospheric winds on SPB days are lighter and more northerly than on WPB days. Interestingly, the morphology is more sensitive to the zonal component of the wind than to the meridional component, with a much weaker zonal component at 850-hPa on SPB days (Table 4). The lower tropospheric temperature is also modestly warmer on SPB days, although the difference is not significant at 850-hPa. Other modest thermodynamic differences are also insignificant based on the bootstrap-based assessments, including differences in inversion characteristics and relative humidity.
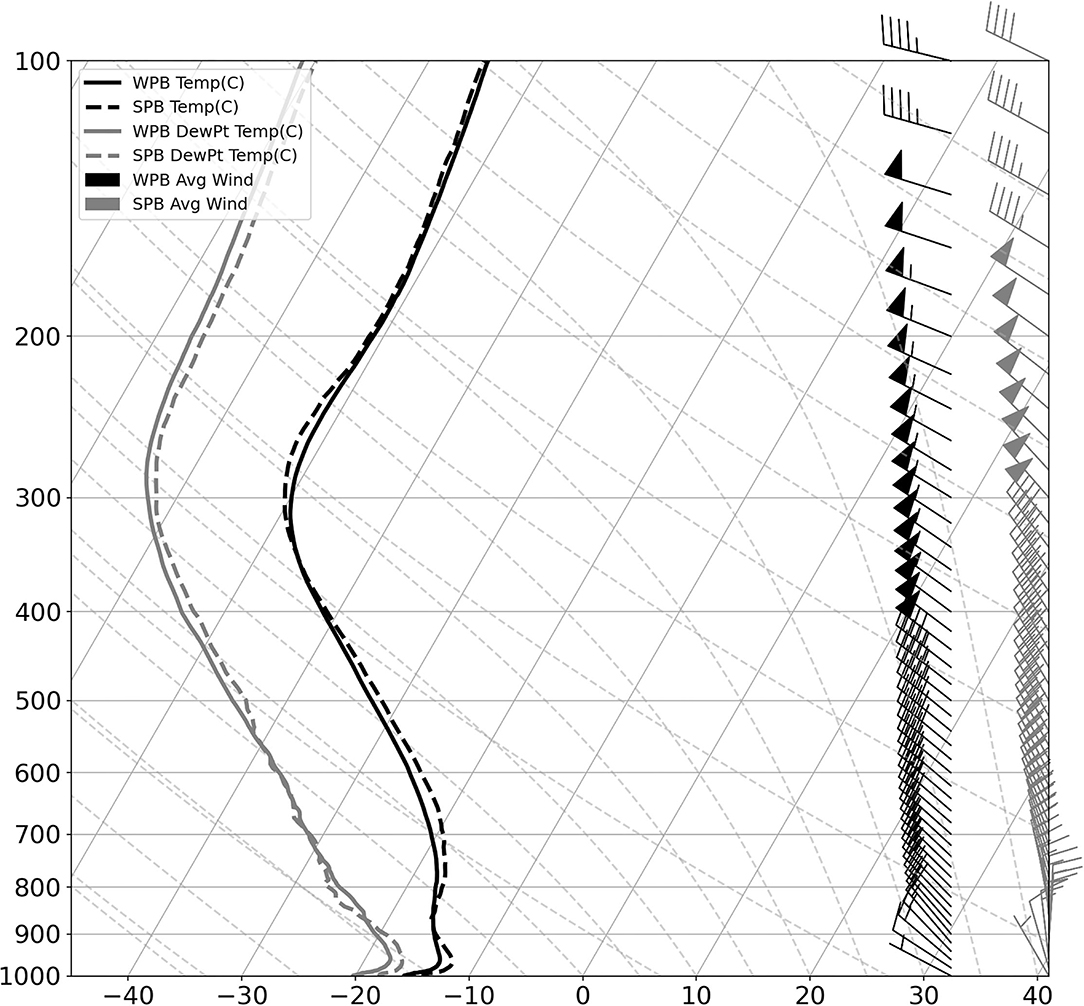
Figure 6. Composite 12 UTC Green Bay, WI, sounding temperature for WPB (solid black) and SPB (dashed black) days. Composite dew point temperature is indicated by gray lines for WPB (solid) and SPB (dashed) days, and the wind profiles for WPB (black) and SPB (gray) days are also provided. Thirteen soundings were unavailable.
Based on the 12 UTC sounding data from Green Bay, WI, the peak daily snowfall per LE day is significantly anticorrelated with the 850-hPa zonal wind component, but not significantly correlated with the meridional component (Table 5). Spatially, the sensitivity to the 850-hPa zonal wind component peaks in northwest Indiana and is weaker in southwest Michigan (Figure 7A). This stronger sensitivity to the zonal wind component in northwest Indiana is consistent with the morphological results noted previously, with increased likelihood of SPB structure as the zonal wind becomes weaker. There is also a significant anticorrelation of snowfall with the 850-hPa meridional wind component in some locations, with the peak impact in north-central Indiana (Figure 7B). Other wind characteristics were considered as well. The sensitivity to the wind direction is consistent with the zonal and meridional wind results (not shown), while correlation of peak snowfall with wind speed is effectively non-existent (Table 5). Although there is some evidence of a non-linear snowfall reduction for very high wind speeds, the sample size encumbers this analysis (not shown).
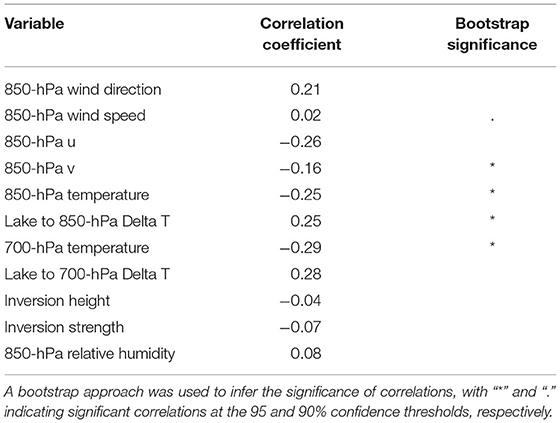
Table 5. Correlation coefficients between peak snowfall and several variables from the upstream sounding at Green Bay, WI, during lake-effect snow days.
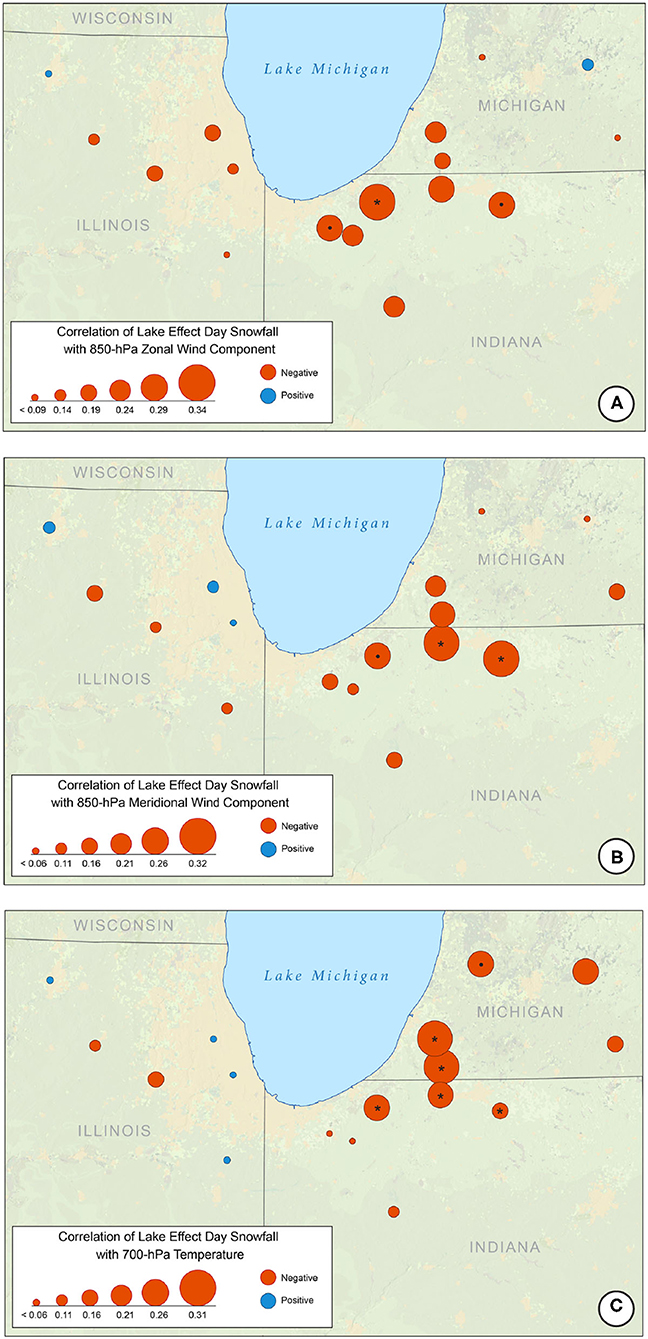
Figure 7. Map of correlation coefficients of snowfall and variables from the upstream sounding at Green Bay, WI, during lake-effect snow days. Sounding variables include the 850-hPa zonal (u; A) and meridional (v; B) wind components and 700-hPa temperature (C). A bootstrap approach was used to infer the significance of correlations at the 95 and 90% confidence thresholds, respectively.
There is a significant dependence of peak LE day snowfall on lower tropospheric temperature, as well as the associated lake to 850 and 700-hPa temperature differences (Table 5). The relationship appears strongest with 700-hPa temperature and peaks in southwest Michigan, where the sensitivity to the wind is somewhat weaker (Figure 7C). Interestingly, other thermodynamic factors lack a meaningful linear relationship with peak snowfall; these include inversion base height and strength, as well as 850-hPa relative humidity (Table 5). The lack of a significant correlation with inversion characteristics is surprising, but may simply be indicative of the capacity of boundary layer growth across the lake to erode the inversion. Furthermore, as with high wind speeds, there is some visual evidence that very strong inversions tend to reduce peak snowfall; however, the sample size of this small subset does not foster robust hypothesis testing or related confidence.
The southern shore of Lake Michigan frequently experiences lake-effect snow events, some of which produce heavy snowfall in the region. The most common snow band morphology is WPB, which is fostered by a cold environment and relatively strong zonal wind component in the lower troposphere. The resulting snowfall typically has a peak in southwest Michigan, consistent with northwest flow. Since these LE days are most plentiful in the Lake Michigan region, this snowfall mode determines much of the spatial distribution of lake-effect snow.
A very different mode of snowfall occurs during SPB days, although WPB structures are often present during the same day. These SPB days are primarily fostered by a weaker zonal wind component and typically produce greater snowfall than WPB in northwest Indiana. Although not every SPB day produces prolific snowfall, they account for four of the five largest snowfalls (at four different locations- ranging geographically from Valparaiso, IN, to Eau Claire. Michigan). This makes SPB particularly impactful, especially when they occur in locations which experience less frequent lake-effect snowfall (e.g., Valparaiso, IN). These two modes of snowfall in the region are identifiable within the leading principal components of daily snowfall in the region, while other statistical modes are more localized (not shown).
In general, greater LE snowfall in the region is associated with colder conditions, weak zonal wind flow, and a northerly meridional wind component in the lower troposphere. Snowfall is not significantly correlated with inversion characteristics, likely due to the impacts of Lake Michigan on boundary layer growth across the lake. There is some visual evidence that very strong inversions and high wind speeds tend to reduce peak snowfall; however, the sample size of this subset is too small for a robust evaluation.
It is noteworthy that none of the relationships with snowfall herein explain a large fraction of the snowfall variance. The variance of snowfall is substantial, with a great deal of internal variability beyond the signal associated with environmental characteristics and snow band morphology. Additionally, the intraday changes to the environment may be substantial, yet this is not captured here; even if it were, the snowfall data represents 24-h totals. In any case, the sensitivity to 00 UTC sounding characteristics was also considered, but the sensitivity to the 12 UTC environment was greater. Although a “best time” approach was also considered, it leads to an unintentional bias as the role of flow properties and temperature are subjectively weighted. An alternative approach could also analyze multi-day events, rather than individual LE days. Although this option was explored, a daily data approach was ultimately used in order to better assess the sensitivity to the environment and snowband morphology.
The region of study was chosen to highlight the importance of snowband morphology and associated environmental factors along the southern shore. Northern regions of the Lake Michigan basin are also worthy of study (as are regions surrounding other Great Lakes), with likely different sensitivity to thermodynamic and flow characteristics. It may also be beneficial to evaluate the environments of LE_cloud days in which snowfall accumulation did not occur, although this is beyond the scope of the current study. Lastly, although the cloud data would not be available, the analysis could be extended to earlier years in order to increase the sample size for other aspects of the analysis.
The raw data supporting the conclusions of this article will be made available by the authors, without undue reservation.
CC designed the project and completed analysis, with the help of NM and KG. BG-B designed the maps of snowfall results and also helped with other graphics. KG made the composite soundings and helped with Python code for Reanalysis maps. The update to the cloud data was completed by NM, with the help of CB and KC. The identification of LE_envsnow days was lead by CC, with the help of NB, ABl, ABo, QD, JD, AG, SG, BH, MK, JL, EM, HS, NR, and CY. All authors contributed to the article and approved the submitted version.
This work was funded by Valparaiso University and NSF Grant AGS-2040594.
The authors declare that the research was conducted in the absence of any commercial or financial relationships that could be construed as a potential conflict of interest.
All claims expressed in this article are solely those of the authors and do not necessarily represent those of their affiliated organizations, or those of the publisher, the editors and the reviewers. Any product that may be evaluated in this article, or claim that may be made by its manufacturer, is not guaranteed or endorsed by the publisher.
The authors thank Dr. Neil Laird for use of the Laird et al. (2017) cloud assessment data. The authors also thank the National Oceanic and Atmospheric Administration (NOAA) and National Centers for Environmental Information (NCEI) for the online access to daily station data and scanned monthly COOP reports, the NOAA Central Library Data Imaging Project for the archived Daily Weather Map series, the NOAA Physical Sciences Division and Climate Prediction Center for teleconnection indices, the Python program (http://python.org) and the open source statistical package, R (available at http://cran.r-project.org/).
The Supplementary Material for this article can be found online at: https://www.frontiersin.org/articles/10.3389/frwa.2022.826293/full#supplementary-material
Agee, E. M., and Gilbert, S. R. (1989). An aircraft investigation of mesoscale convection over Lake Michigan during the 1984 cold air outbreak. J. Atmos. Sci. 46, 1877–1897. doi: 10.1175/1520-0469(1989)046<1877:AAIOMC>2.0.CO;2
Agee, E. M., and Hart, M. L. (1990). Boundary layer and mesoscale structure over Lake Michigan during a wintertime cold air outbreak. J. Atmos. Sci. 47, 2293–2316. doi: 10.1175/1520-0469(1990)047<2293:BLAMSO>2.0.CO;2
Baijnath-Rodino, J. A., Duguay, C. R., and LeDrew, E. (2018). Climatological trends of snowfall over the Laurentian Great Lakes basin. Int. J. Climatol. 38, 3942–3962. doi: 10.1002/joc.5546
Ballentine, R. J. (1982). Numerical simulations of land-breeze-induced snowbands along the western shore of Lake Michigan. Month. Weather Rev. 110, 1544–1553. doi: 10.1175/1520-0493(1982)110<1544:NSOLBI>2.0.CO;2
Ballentine, R. J., Stamm, A. J., Chermack, E. E., Byrd, G. B., and Schleede, D. (1998). Mesoscale model simulation of the 4-5 January 1995 lake-effect snowstorm. Weather Forecast. 13, 893–920. doi: 10.1175/1520-0434(1998)013<0893:MMSOTJ>2.0.CO;2
Bard, L., and Kristovich, D. A. R. (2012). Trend reversal in Lake Michigan contribution to snowfall. J. Appl. Meteor. 51, 2038–2046. doi: 10.1175/JAMC-D-12-064.1
Braham, R. R. (1983). The Midwest snow storm of 8-11 December 1977. Month. Weather Rev. 111, 253–272. doi: 10.1175/1520-0493(1983)111<0253:TMSSOD>2.0.CO;2
Braham, R. R., and Dungey, M. J. (1995). Lake-effect snowfall over Lake Michigan. J. Appl. Meteor. 34, 1009–1019. doi: 10.1175/1520-0450(1995)034<1009:LESOLM>2.0.CO;2
Burnett, A. W., Kirby, M. E., Mullins, H. T., and Patterson, W. P. (2003). Increasing Great Lake-effect snowfall during the twentieth century: a regional response to global warming? J. Clim. 16, 3535–3542. doi: 10.1175/1520-0442(2003)016<3535:IGLSDT>2.0.CO;2
Chagnon, S. A. (1968). Precipitation climatology of Lake Michigan basin. Illinois State Water Survey Bull. 52, 88.
Chang, S. S., and Braham, R. R. (1991). Observational stuffy of a convective internal boundary layer over Lake Michigan. J. Atmos. Sci. 48, 2265–2279. doi: 10.1175/1520-0469(1991)048<2265:OSOACI>2.0.CO;2
Clark, C., Ganesh-Babu, B., Elless, T., Lyza, A., Koning, D. M., Carne, A. R., et al. (2018). Spatio-temporal November and March snowfall trends in the Lake Michigan region. Int. J. Climatol. 38, 3250–3263. doi: 10.1002/joc.5498
Clark, C. A., Elless, T. J., Lyza, A. W., Ganesh-Babu, B., Koning, D. M., Carne, A. R., et al. (2016). Spatiotemporal snowfall variability in the Lake Michigan region: how is warming affecting wintertime snowfall? J. Appl. Meteorol. Climatol. 55, 1813–1830. doi: 10.1175/JAMC-D-15-0285.1
Clark, C. A., Goebbert, K. H., Ganesh-Babu, B., Young, A. M., Heinlein, K. N., Casas, E. G., et al. (2020). Classification of Lake Michigan snow days for estimation of the lake-effect contribution to the downward trend in November snowfall. Int. J. Climatol. 40, 5656–5670. doi: 10.1002/joc.6542
Cordeira, J. M., and Laird, N. F. (2008). The influence of ice cover on two lake-effect events over Lake Erie. Month. Weather. Rev. 139, 2747–2763. doi: 10.1175/2007MWR2310.1
Forbes, S. F., and Merritt, J. H. (1984). Mesoscale vortices over the Great Lakes in wintertime. Mon. Wea. Rev. 112, 377–381. doi: 10.1175/1520-0493(1984)112<0377:MVOTGL>2.0.CO;2
Gerbush, M. R., Kristovich, D. A. R., and Laird, N. F. (2008). Mesoscale boundary layer and heat flux variations over pack ice–covered Lake Erie. J. Appl. Meteorol. Climatol. 47, 668–682. doi: 10.1175/2007JAMC1479.1
Hjelmfelt, M. R. (1990). Numerical study of the influence of environmental conditions on lake-effect snowstorms over Lake Michigan. Month. Weather Rev. 118, 138–150. doi: 10.1175/1520-0493(1990)118<0138:NSOTIO>2.0.CO;2
Hjelmfelt, M. R. (1992). Orographic effects in simulated lake-effect snowstorms over Lake Michigan. Month. Weather Rev. 120, 373–377. doi: 10.1175/1520-0493(1992)120<0373:OEISLE>2.0.CO;2
Hjelmfelt, M. R., and Braham, R. R. (1983). Numerical simulation of the airflow over Lake Michigan for a major lake-effect snow event. Month. Weather Rev. 111, 205–219. doi: 10.1175/1520-0493(1983)111<0205:NSOTAO>2.0.CO;2
Kalnay, E., Kanamitsu, M., Kistler, R., Collins, W., Deaven, D., Gandin, L., et al. (1996). The NCEP/NCAR 40-year reanalysis project. Bull. Amer. Meteor. Soc. 77, 437–70.
Kelly, R. D. (1982). A single Doppler study of horizontal-roll convection in a lake-effect snow storm. J. Atmos. Sci. 39, 1521–1531. doi: 10.1175/1520-0469(1982)039<1521:ASDRSO>2.0.CO;2
Kelly, R. D. (1984). Horizontal roll and boundary-layer interrelationships observed over Lake Michigan. J. Atmos. Sci. 11, 1816–1826. doi: 10.1175/1520-0469(1984)041<1816:HRABLI>2.0.CO;2
Kluver, D. B., and Leathers, D. J. (2015). Winter snowfall prediction in the United States using multiple discriminant analysis. Int. J. Climatol. 35, 2003–2018. doi: 10.1002/joc.4103
Kristovich, D. A., Clark, R. D., Frame, J., Geerts, B., Knupp, K. R., Kosiba, K. A., et al. (2017). The Ontario winter lake-effect systems field campaign: scientific and educational adventures to further our knowledge and prediction of lake-effect storms. Bull. Am. Meteorol. Soc. 98, 315–332. doi: 10.1175/BAMS-D-15-00034.1
Kristovich, D. A. R., Laird, N. F., and Hjelmfelt, M. R. (2003). Convective evolution across Lake Michigan during a widespread lake-effect snow event. Month. Weather Rev. 131, 643–655. doi: 10.1175/1520-0493(2003)131<0643:CEALMD>2.0.CO;2
Kristovich, D. A. R., and Spinar, M. L. (2005). Diurnal variations in lake-effect precipitation near the western Great Lakes. J. Hydrometeor. 6, 210–218. doi: 10.1175/JHM403.1
Kristovich, D. A. R., and Steve, R. A. (1995). A satellite study of cloud-band frequencies over the Great Lakes. J. Appl. Meteor. 34, 2083–2090. doi: 10.1175/1520-0450(1995)034<2083:ASSOCB>2.0.CO;2
Kristovich, D. A. R., Young, G. S., Verlinde, J., Sousounis, P. J., Mourad, P., Lenschow, D., et al. (2000). The lake-induced convection experiment (Lake-ICE) and the snowband dynamics project. Bull. Am. Meteorol. Soc. 81, 519–542. doi: 10.1175/1520-0477(2000)081<0519:TLCEAT>2.3.CO;2
Kunkel, K. E., Ensor, L., Palecki, M., Easterling, D., Robinson, D., Hubbard, K. G., et al. (2009). A new look at lake-effect snowfall trends in the Laurentian Great Lakes using a temporally homogeneous data set. J. Great Lakes Res. 35, 23–29. doi: 10.1016/j.jglr.2008.11.003
Kunkel, K. E., Westcott, N. E., and Kristovich, D. A. R. (2002). Effects of climate change on heavy lake-effect snowstorms near Lake Erie. J. Great Lakes Res. 28, 521–536. doi: 10.1016/S0380-1330(02)70603-5
Laird, N. F., and Kristovich, D. A. R. (2004). Comparison of observations with idealized model results for a method to resolve winter lake-effect mesoscale morphology. Month. Weather Rev. 132, 1093–1103. doi: 10.1175/1520-0493(2004)132<1093:COOWIM>2.0.CO;2
Laird, N. F., Kristovich, D. A. R., and Walsh, J. E. (2003). Idealized model simulations examining the mesoscale structure of winter lake-effect circulations. Month. Weather Rev. 131, 206–221. doi: 10.1175/1520-0493(2003)131<0206:IMSETM>2.0.CO;2
Laird, N. F., Metz, N. D., Gaudet, L., Grasmick, C., Higgins, L., Loeser, C., et al. (2017). Climatology of cold season lake-effect cloud bands for the North American Great Lakes. Int. J. Climatol. 37, 2111–2121. doi: 10.1002/joc.4838
Lavoie, R. L. (1972). A mesoscale numerical model of lake-effect storms. J. Atmos. Sci. 29, 1025–1040. doi: 10.1175/1520-0469(1972)029<1025:AMNMOL>2.0.CO;2
Leathers, D. J., and Ellis, A. W. (1996). Synoptic mechanisms associated with snowfall increases to the lee of Lakes Erie and Ontario. Int. J. Climatol. 16, 1117–1135. doi: 10.1002/(SICI)1097-0088(199610)16:10<1117::AID-JOC80>3.0.CO;2-4
Mann, G. E., Wagenmaker, R. B., and Sousounis, P. J. (2002). The influence of multiple lake interactions upon lake-effect storms. Month. Weather Rev. 130, 1510–1530. doi: 10.1175/1520-0493(2002)130<1510:TIOMLI>2.0.CO;2
May, R. M., Arms, S. C., Marsh, P., Bruning, E., Leeman, J. R., Goebbert, K., et al. (2021). MetPy: A Python Package for Meteorological Data. Unidata. Available online at: https://github.com/Unidata/MetPy (accessed November 1, 2021).
Mitchell, C. L. (1921). Snow flurries along the eastern shore of Lake Michigan. Month. Weather Rev. 49, 502–503.
Mulholland, J. P., Frame, J., Nesbitt, S. W., Steiger, S. M., Kosiba, K. A., and Wurman, J. (2017). Observations of misovortices within a long-lake-axis-parallel lake-effect snowband during the OWLeS project. Month. Weather Rev. 145, 3265–3291 doi: 10.1175/MWR-D-16-0430.1
Niziol, T. A. (1987). Operational forecasting of lake-effect snowfall in western and central New York. Weather Forecast. 2, 310–321. doi: 10.1175/1520-0434(1987)002<0310:OFOLES>2.0.CO;2
Niziol, T. A., Snyder, W. R., and Waldstreicher, J. S. (1995). Winter weather forecasting throughout the eastern United States. Part IV: lake effect snow. Weather Forecast. 10, 61–77. doi: 10.1175/1520-0434(1995)010<0061:WWFTTE>2.0.CO;2
Notaro, M., Bennington, V., and Varvus, S. (2015). Dynamically downscaled projections of lake-effect snow in the Great Lakes basin. J. Clim. 28, 1661–1684. doi: 10.1175/JCLI-D-14-00467.1
Petterssen, S., and Calabrese, P. A. (1959). On some influences due to warming of the air by the Great Lakes in winter. J. Meteor. 16, 646–652. doi: 10.1175/1520-0469(1959)016<0646:OSWIDT>2.0.CO;2
Remick, J. T. (1942). The effect of Lake Erie on the local distribution of precipitation in winter (I). Bull. Am. Meteor. Soc. 23, 1–4. doi: 10.1175/1520-0477-23.1.1
Rothrock, H. J. (1969). An aid in forecasting significant lake snows. Environmental Science Services Administration Tech. Memo. WBTM CR-30. National Weather Service, 12pp.
Schmidlin, T. W. (1993). Impacts of heavy snowfall during 1989 in the Lake Erie snowbelt. J. Clim. 6, 659–667. doi: 10.1175/1520-0442(1993)006<0759:IOSWWD>2.0.CO;2
Schmidlin, T. W., and Kosarik, J. (1999). A record breaking snowfall during 9-14 November 1996. Bull. Am. Meteor. Soc. 80, 1107–1116. doi: 10.1175/1520-0477(1999)080<1107:AROSDN>2.0.CO;2
Sheridan, L. W. (1941). The influence of Lake Erie on local snows in Western New York. Bull. Am. Meteor. Soc. 22, 393–395. doi: 10.1175/1520-0477-22.10.393
Sousounis, P. J., and Mann, G. E. (2000). Lake-aggregate mesoscale disturbances. Part V: Impacts on lake-effect precipitation. Month. Weather Rev. 128, 728–745. doi: 10.1175/1520-0493(2000)128<0728:LAMDPV>2.0.CO;2
Suriano, Z. J., and Leathers, D. J. (2016). Twenty-first century snowfall projections within the Eastern Great Lakes region: Detecting the presence of a lake-induced snowfall signal in GCMs. Int. J. Climatol. 36, 2200–2209. doi: 10.1002/joc.4488
Suriano, Z. J., and Leathers, D. J. (2017a). Synoptic climatology of lake effect snowfall conditions in the Eastern Great Lakes region. Int. J. Climatol. 36:2200–2209. doi: 10.1002/joc.5093
Keywords: Great Lakes, lake-effect snow, winter, climatology, snowfall
Citation: Clark CA, Metz ND, Goebbert KH, Ganesh-Babu B, Ballard N, Blackford A, Bottom A, Britt C, Carmer K, Davis Q, Dufort J, Gendusa A, Gertonson S, Harms B, Kavanaugh M, Landgrebe J, Mazan E, Schroeder H, Rutkowski N and Yurk C (2022) Climatology of Lake-Effect Snow Days Along the Southern Shore of Lake Michigan: What Is the Sensitivity to Environmental Factors and Snowband Morphology? Front. Water 4:826293. doi: 10.3389/frwa.2022.826293
Received: 30 November 2021; Accepted: 02 February 2022;
Published: 17 March 2022.
Edited by:
Galina Guentchev, Met Office, United KingdomReviewed by:
Jeffrey Frame, University of Illinois at Urbana-Champaign, United StatesCopyright © 2022 Clark, Metz, Goebbert, Ganesh-Babu, Ballard, Blackford, Bottom, Britt, Carmer, Davis, Dufort, Gendusa, Gertonson, Harms, Kavanaugh, Landgrebe, Mazan, Schroeder, Rutkowski and Yurk. This is an open-access article distributed under the terms of the Creative Commons Attribution License (CC BY). The use, distribution or reproduction in other forums is permitted, provided the original author(s) and the copyright owner(s) are credited and that the original publication in this journal is cited, in accordance with accepted academic practice. No use, distribution or reproduction is permitted which does not comply with these terms.
*Correspondence: Craig A. Clark, Y3JhaWcuY2xhcmtAdmFscG8uZWR1
Disclaimer: All claims expressed in this article are solely those of the authors and do not necessarily represent those of their affiliated organizations, or those of the publisher, the editors and the reviewers. Any product that may be evaluated in this article or claim that may be made by its manufacturer is not guaranteed or endorsed by the publisher.
Research integrity at Frontiers

Learn more about the work of our research integrity team to safeguard the quality of each article we publish.