 Gareth B. Simpson1,2*
 Graham P. W. Jewitt2,3
 William Becker4
 Jessica Badenhorst1
 Sara Masia3,5
 Ana R. Neves6Pere Rovira7Victor Pascual7
- 1Jones & Wagener (Pty) Ltd., Pretoria, South Africa
- 2Centre for Water Resources Research, University of KwaZulu-Natal, Pietermaritzburg, South Africa
- 3IHE Delft Institute for Water Education, Delft, Netherlands
- 4BlueFox Data Consulting, Ispra, Italy
- 5CMCC Foundation – Euro-Mediterranean Centre on Climate Change, Impacts on Agriculture, Forests and Ecosystem Services Division, Sassari, Italy
- 6Joint Research Centre, Competence Centre on Composite Indicators and Scoreboards, Ispra, Italy
- 7OneTandem SL, Barcelona, Spain
The call for measuring synergies and trade-offs between water, energy, and food is increasing worldwide. This article presents the development and application of a country-level index that has been calculated for 181 nations using open databases. Following an assessment of 87 water-, energy-, and food-related indicators, 21 were selected to constitute the Water-Energy-Food (WEF) Nexus Index. In this article, the WEF Nexus Index is utilized to assess the Southern African Development Community, where it demonstrates that food security is an area of concern, while the potential for beneficially exploiting water resources and energy projects exists in several countries. Water for agriculture could be achieved through the drought-proofing of rainfed agriculture and systematic irrigation development, with energy as the critical enabler. Neither the composite indicator nor the WEF nexus approach is the panacea that will solve all the significant development or environmental challenges facing humanity. However, they could contribute to integrated resource management and policy-making and are complementary to the Sustainable Development Goals. In this study, the methodology set out by the Joint Research Centre's Competence Center on Composite Indicators and Scoreboards has been followed. A set of visualizations associated with the WEF Nexus Index have been compiled in an interactive website, namely www.wefnexusindex.org.
Introduction
The global demand for resources such as water, energy and food is expected to escalate dramatically in the forthcoming decades (Beddington, 2009; World Economic Forum, 2011; National Intelligence Council, 2012; WWF and SABMiller, 2014). The increasing demand is being driven by a worldwide population growth not only in number but also in consumption patterns, primarily due to a burgeoning middle class and urbanization (FAO, 2018). While much economic development has occurred over the past two and a half centuries, there has been a marked disparity in this growth. In the world's least developed countries:
• the agricultural sector utilizes 71 and 30% of the global water withdrawals and energy, respectively (Mohtar and Daher, 2012; FAO, 2014);
• one-third of all food produced globally is either lost or wasted (IRENA, 2015);
• 10% of the globally available freshwater is utilized in energy production (WWAP, 2020), while domestic uses constitute 14% of water utilization (World Economic Forum, 2011);
• the bioenergy sector utilizes 1% of all food produced (Garcia and You, 2016);
• in 2011, only 13% of the energy generated globally originated from renewable sources (Hoff, 2011); and
• 4% of all energy generated is utilized for the abstraction, conveyance and treatment of water (WWAP, 2020), while total industrial withdrawals account for 16% of today's global water demand (World Economic Forum, 2011).
This disparity has resulted in global efforts to support initiatives to achieve resource securities for the “bottom billion,” which is that portion of the “world's population living on < US$1.25 per day” (UNESCO, 2014). A further stressor is that the international supply chain system must deliver products and resources on a planet where predominant risks include extreme weather events, natural disasters, and resource depletion (World Economic Forum, 2018). This has been demonstrated in the outworking of the COVID-19 pandemic.
The 2008 financial crisis raised concerns about resource-efficient management and the consequent feedback on the environment, livelihoods and economic development (Beddington, 2009, 2010; Rockstrom et al., 2009). Salam et al. (2017) argue that the disparity between future availability and demand will not be closed through an increased supply but rather through effective demand-side management and policy interventions. Since 2011, significant attention has been given to the water-energy-food (WEF) nexus in the academic, policy, regulatory and development communities (Simpson and Jewitt, 2019a). The Bonn2011 Conference (Hoff, 2011) and the World Economic Forum's publication Water Security: The Water-Food-Energy-Climate Nexus (World Economic Forum, 2011) were influential in this regard.
The word nexus means to “connect” (De Laurentiis et al., 2016), although its application is varied. The view that water resources, energy generation, and food production are interdependent is not novel (Allouche et al., 2015; Muller, 2015; Wichelns, 2017). Sušnik (2018) argues that the earliest global study on a nexus was the publication The Limits of Growth (Meadows et al., 1972) in 1972. One of the main goals of the nexus approach is to reduce or avoid trade-offs resulting from policy development in institutional “silos” (Belinskij, 2015). The WEF nexus approach has, however, not been without criticism. Cairns and Krzywoszynska (2016) considered it to be a “buzzword,” and several recent publications have argued that the approach has not lived up to its potential (Albrecht et al., 2018; FAO, 2018; Galaitsi et al., 2018). These critiques have emphasized the need for a migration from “nexus thinking” to “nexus doing” (McGrane et al., 2018). The imperative to integrate qualitative and quantitative nexus assessments has been highlighted in recent literature (FAO, 2018; Galaitsi et al., 2018; Allouche et al., 2019; Hoff et al., 2019; Simpson and Jewitt, 2019b).
Salam et al. (2017) argue that the interconnections between the Sustainable Development Goals (SDGs) emphasize the need for nexus thinking. El Costa (2015) suggested that since the SDGs seek to incorporate multiple development goals, identifying targets at the nexus of various sectors can be instrumental in yielding a less complicated SDG framework. Internationally, the WEF nexus has become accepted as a mechanism for facilitating progress toward the relevant sector-related SDGs, i.e., SDGs 2, 6, and 7 (Simpson and Jewitt, 2019a). The WEF nexus approach is, therefore, recognized as a promising tool for achieving the relevant sector-related SDGs and holds promise for the guidance of development initiatives aligned with Nationally Determined Contributions (NDCs) of the Paris Agreement.
Ringler et al. (2013) suggested that the SDGs present a crucial test for implementing the nexus approach at an international level. Yet to date, no country is on track to achieve all the goals by 2030 (Sachs et al., 2018). Furthermore, if the nexus is to be utilized as a lens for sustainable development, then any conceptual framework developed for the WEF nexus must also address the global disparity in access to resources, i.e., equity, together with environmental rights (Biggs et al., 2015; de Grenade et al., 2016).
While there has been a considerable effort to develop tools to monitor progress toward the SDGs (Sachs et al., 2019), there is less progress in assessing trade-offs between different SDGs or resource sectors such as those represented by a nexus within the SDGs, e.g., the WEF nexus. One means of assessing a multifaceted system where parameters are quantified with different units of measurement (de Loë and Patterson, 2017; Wichelns, 2017) is through the development of a composite indicator (or index), which results “when individual indicators are compiled into a single index on the basis of an underlying model” (OECD, 2008). The aim of this work is to introduce a composite indicator that allows a stakeholder to quantify and monitor the WEF nexus interlinkages at a national level. Following an assessment of 87 globally applicable water-, energy-, and food-related indicators, 21 were selected to constitute the WEF Nexus Index, which was calculated for 181 countries.
This article presents the WEF Nexus Index with its application to the Southern African Development Community (SADC). The SADC nations share many natural resources and have complex political and social systems that influence the availability and access to these resources. The SADC region is an ideal case study for applying the WEF Nexus Index due to the inherent opportunities and threats to sustainable development and the potential for policy interventions.
Methods
In this study, the methodology set out by the Joint Research Centre's Competence Center on Composite Indicators and Scoreboards (JRC:COIN) has been followed (Saisana et al., 2018). The JRC:COIN have been involved in over 60 statistical audits of composite indicators, amongst others, the Environmental Performance Index (Yale University, Columbia University), the Multidimensional Poverty Assignment Tool (UN International Fund for Agricultural Development), the Global Competitiveness Index (World Economic Forum), and the Corruption Perceptions Index (Transparency International) (Saisana et al., 2018).
The JRC:COIN's methodology consists of 10 steps (OECD, 2008; Saisana et al., 2018). Initially, a conceptual framework needs to be developed for the context under assessment. This framework is subsequently utilized to guide the selection of a set of relevant and available indicators. These indicators are normalized, weighted and aggregated, thereby yielding a unitless index that represents the context being appraised. An index is complementary to the underlying data, representing it in a coherent manner. The index also provides an access point to the complex data set upon which it is based, thereby enabling the identification of patterns and trends. Indices must be developed sensibly and transparently and used responsibly, since they can be misused (Saisana et al., 2018). However, they have been shown to be valuable decision making and policy tools.
Development of the Framework
According to the JRC:COIN, the first step in forming a composite indicator is the development of a framework for the system under assessment (Saisana et al., 2018). To this end, the anthropocentric WEF nexus framework, presented in Figure 1, was utilized as the basis for the WEF Nexus Index's construction. The basis of this framework's development was a consideration of what lies at the center of this nexus. It was concluded that humanity lies at its center. At the core of this framework is, therefore, human society, i.e., Anthropos (Greek for human), with its insatiable demand for resources. Globally, access to resources such as water, energy and food is not equitable, hence the inclusion of three water-, energy-, and food-related SDGs in this framework. Each SDG has targets that “are universally applicable and aspirational” (UN Water, 2018). The framework also reflects the priorities of the global South in achieving both access to and provision of resources (Simpson et al., 2020).
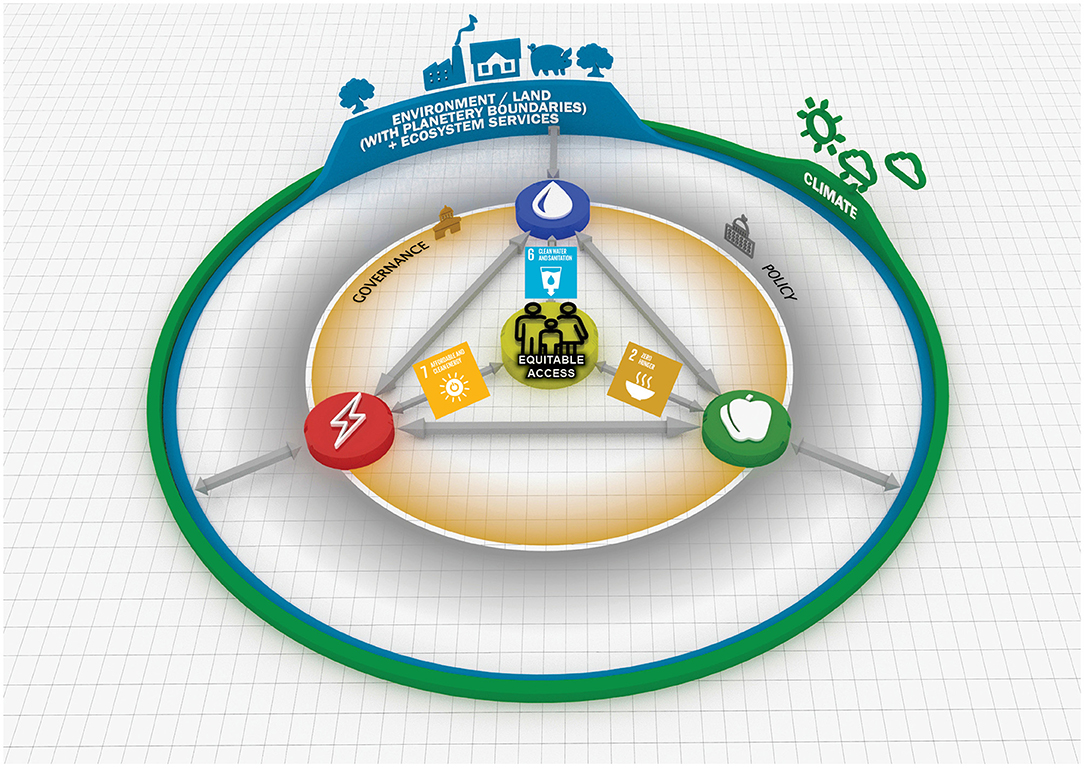
Figure 1. The Anthropocentric WEF nexus framework (from Simpson et al., 2020).
Further, water, energy, and food are ultimately obtained from the natural resource base (Rockström and Sukhdev, 2016) and the flow of resources from the environment to the source of demand, i.e., humans, is therefore the dominant driver within this system. These resources are procured from the environment in manners that are either renewable or non-renewable. In addition, the climate and environment are managed and regulated through sound (or poor) governance and policies, as shown by the two intermediate layers within the proposed framework. At the core of this framework is “access” and “demand” related to the three core resource sectors, i.e., “leave no one behind” and managing the global supply chain system. This proposed framework is especially applicable to the developing world due to its emphasis on SDGs 2, 6, and 7, as well as the all-encompassing role of governance and policy that promotes sustainable development and the protection of the environment.
The environment, land, and climate are represented by the outer layers of this framework since, in many cases, planetary boundaries are being tested or even exceeded (Steffen et al., 2018). The framework also demonstrates that while humanity is at the center of the global supply chain system, they are also custodians of the governance and policies related to these three interdependent resources.
Selection of Indicators
The second stage of the JRC:COIN methodology in the development of a composite indicator is the selection of the indicators that will constitute the index. Figure 2 shows that, for a given context (e.g., the WEF nexus), indicators and indices are developed from data to yield information that can ultimately be used for decision- and policy-making and the interactions between these aspects. These decisions and policies will then be based on firm knowledge, founded on verifiable information, which will limit knee-jerk decisions and conjecture. As information is developed, it can, in turn, influence the data collection and indicators for refining the process. Other quantitative and qualitative studies can augment the information generated, and various feedback loops can improve and optimize the data gathering process. These studies could include socio-economic and institutional indicators, models or surveys.

Figure 2. From data to decision making; modified from Segnestam (2002) and Waas et al. (2014).
Based on the framework shown in Figure 1, the WEF Nexus Index has three equal pillars representing water, energy and food (refer to Figure 3). Each of these resource sectors, in turn, have “access” and “availability” sub-pillars. The “access” component of the WEF nexus relates to the urgent need for worldwide distributional justice, i.e., equitable access to resources. This is the perspective from which the WEF Nexus Index was developed (Simpson et al., 2020). While equitable access to resources is essential, the physical availability thereof is of equal importance. Therefore, the energy-access sub-pillar includes an access indicator, two indicators that represent renewable energy consumption and output, and an indicator related to CO2 emissions per capita. This is because this pillar relates to SDGs 7 and 13, i.e., access to modern energy that addresses climate action.
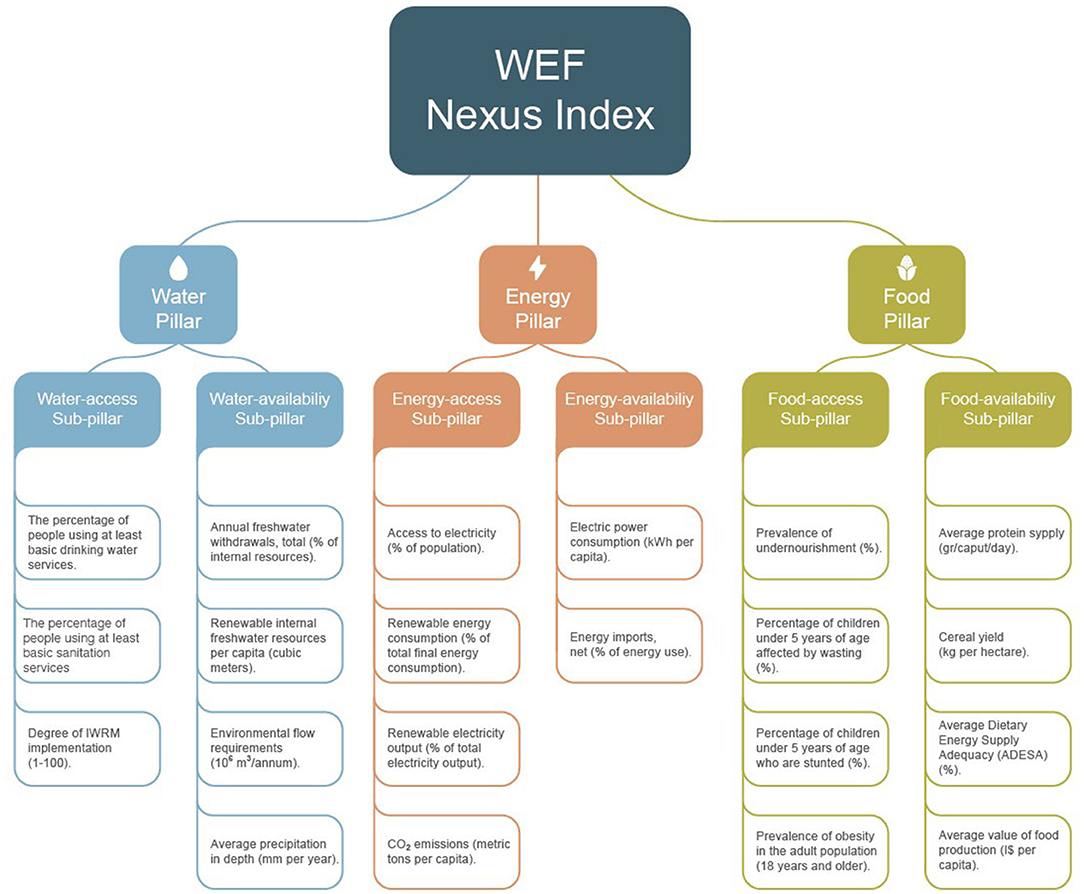
Figure 3. Schematic layout of the WEF Nexus Index, with its constituent pillars, sub-pillars, and indicators.
Internationally, data are collected by various organizations such as national statistical offices, government departments, non-governmental organizations and international organizations such as the World Bank, International Energy Agency (IEA), Food and Agriculture Organization of the United Nations (FAO) and the World Health Organization (WHO). A global search of these databases resulted in a list of 87 water-, energy-, and food-related indicators that were subsequently reviewed for both relevance and data availability at a national scale via a rigorous and iterative process. For an indicator to be included in an index, at the indicator level, at least 65% of countries should have valid data. Similarly, and at the country level, at least 65% of indicators should have valid data (Saisana et al., 2018).
Selection criteria included relevance, added value, data availability, and reliability, together with a correlation analysis to identify possible aggregation issues or double-counting (Simpson et al., 2020). If the correlation of the indicators was too high, taken to be equal to or >0.92 in this study, then this constituted double-counting, i.e., effectively including the same variable twice (OECD, 2008). In this case, one of the highly correlated indicators was omitted from the WEF Nexus Index.
Details of each indicator evaluated, and a rationale for its inclusion or exclusion in the WEF Nexus Index is provided in Addendum A. One of the challenges experienced in the selection of indicators is that there are very few indicators that measure the linkages between the constituent sectors, i.e., “nexus” indicators that measure water for energy, water for food, energy for water, etc. Where these “nexus” or “integrated” indicators do exist, they are invariably reported by too few countries to form part of the index. These indicators could, however, form part of an in-depth study for countries that do report these parameters.
Both the anthropocentric WEF nexus framework and the selection of indicators to form the WEF Nexus Index were presented at various forums during this project to facilitate stakeholder/expert engagement. These interactions proved to be beneficial in obtaining vital input on both the interpretation of the framework and the final selection of indicators. The forums that the conceptual framework and indicators were presented at include:
• A Research-on-Tap Seminar entitled “Toward a Water-Energy-Food Nexus Index” at the University of KwaZulu-Natal's Center for Water Resources Research on 25 April 2019, in Pietermaritzburg, South Africa,
• A workshop entitled the “Development of the Water-Energy-Food Nexus Index and its application to South Africa and the South African Development Community (SADC): From Theory to Practice” at the Water Research Commission in Pretoria, South Africa, on 10 May 2019,
• A presentation at the 2019 European Climate Change Adaptation Conference in Lisbon, Portugal, on 30 May 2019, entitled the “Development of the Water-Energy-Food Nexus Index and its application to South Africa and SADC,”
• A lunchtime seminar at IHE Delft Institute for Water Education, Delft, The Netherlands on 5 June 2019, entitled the “Development of the Water-Energy-Food Nexus Index and its application to South Africa and SADC,” and
• A JRC:COIN Open Day in Ispra, Italy, on 7 June 2019, entitled the “Development of the Water-Energy-Food Nexus Index and its application to South Africa and SADC.”
The outcome of this analysis and stakeholder/expert engagement was that a set of 21 indicators were selected to compose the WEF Nexus Index, the structure of which is presented in Figure 3. Adequate data is available for the index to be calculated for 181 nations.
The water-access sub-pillar represents SDG 6 (access to at least basic drinking water and sanitation services) and the degree of IWRM (which is an indicator of good governance in terms of water resources management). The energy-access sub-pillar includes both access to electricity (SDG indicator 7.1.1) and two indicators that appertain to the degree of renewable energy consumption (SDG indicator 7.2.1) and implementation, as well as CO2 emissions (which is an indicator of the degree of dependence on fossil fuels). These indicators have been aggregated because SDG 7 appertains to access to affordable, reliable, sustainable and modern energy for all, and not simply “access to energy.”
The food-access sub-pillar includes, amongst others, SDG indicators 2.1.1 (prevalence of undernourishment), 2.2.1 (percentage of children under 5 years of age who are stunted) and FAO indicator 4.8 (prevalence of obesity in the adult population). The food-accessibility sub-pillar includes FAO indicators 1.1 (average dietary energy supply adequacy), 1.2 (average value of food production) and 1.4 (average protein supply), and the cereal yield in kilograms per hectare.
The latest available data (in August 2019) was utilized for the calculation of the WEF Nexus Index, with the reference year varying between indicators, as presented in Addendum A.
Data Treatment and Normalization
Following the selection of indicators, missing data were imputed where appropriate or necessary in accordance with the JRC:COIN guidelines. One case of imputation was for levels of undernourishment in high-income countries. Here, average values reported by UNICEF were utilized, e.g., the average prevalence of undernourishment in high-income countries is 1.2% (Sachs et al., 2018). All indicators were then normalized to transform them into a uniform scale: [0:100] (OECD, 2008). This is standard practice in composite indicator construction, since not only are the indicators measured in different units, but their values vary markedly, e.g., the indicator Percentage of children under 5 years of age who are affected by wasting varies from 0.3 to 22.7%, whereas the Renewable internal freshwater resources per capita vary from 2.5 to 519 265 cubic meters. In this project, the min-max method was utilized to normalize the data (Saisana et al., 2018; Simpson et al., 2020). Where there was no data for an indicator, shallow imputation was applied, whereby it “calculates the sub-pillar score by taking the mean only over the indicators that have data” (Becker et al., 2019). This is the same as substituting the missing value with the normalized mean of the other indicators in the aggregation group (e.g., pillar or sub-pillar).
Outliers were treated in particular cases. This practice is necessary since outliers “generally spoil basic descriptive statistics such as the mean, the standard deviation, and correlation coefficient, thus causing misinterpretation” (Saisana et al., 2018). Where the skewness and kurtosis of an indicator's data set exceeded the generally accepted range, i.e., |<2| and |<3.5|, respectively, a process of either Winsorisation (where there are five or fewer outliers) or a Box-cox transformation (if the number of outliers exceeds five) was adopted (Saisana et al., 2018). This is described in more detail in Simpson et al. (2020).
Weighting and Aggregation of Indicators
The sub-pillar scores were obtained by determining the weighted arithmetic average of the indicators in each sub-pillar. Pillar scores were calculated using the arithmetic average of the corresponding sub-pillar scores, and the final index score was an arithmetic average of the pillar scores. Equal weighting was used at the pillar level to preserve the multi-centric philosophy of the WEF nexus approach, such that each resource sector has equal importance (Allouche et al., 2015; Benson et al., 2015; Owen et al., 2018). Given that some sub-pillars contain more indicators than others and the fact that some indicators in a sub-pillar have stronger weightings than others, the final weight of each indicator in the overall index is unequal. The final weights, per aggregation level, are presented in Addenda B, C.
The arithmetic mean was used for aggregation despite its known property of compensability. Compensability refers to the extent to which a decrease in one indicator can be compensated for by an increase in another indicator. If the indicators are summed, i.e., using the arithmetic mean, there is a higher degree of compensability than if they are multiplied, i.e., using the geometric mean. This is because the latter method “penalizes” lower scores in indicators to a greater extent than the former method. The use of the arithmetic mean to calculate the WEF Nexus Index was, nevertheless, prefered because there is a reasonable degree of substitutability between constituent indicators and utilizing the arithmetic mean is easier to understand than the geometric mean. This method of aggregation was also adopted in the development of the SDG Index (Sachs et al., 2016, 2018).
Results
The WEF Nexus Index has been calculated for the 181 nations that had sufficient data for 2019, as presented in Figure 4. The five highest-ranking countries are Iceland, Canada, Norway, New Zealand, and the United States of America, respectively, while the five lowest-ranking countries are Eritrea, South Sudan, Chad, Somalia and Haiti. Amongst the 20 highest-ranking nations for the index are 12 Organization for Economic Co-operation and Development (OECD) countries. While the 20 highest-ranking nations are predominantly developed countries, four South American and three Asian countries are on this list. The four South American countries in the top 20 are Brazil, Uruguay, Columbia, and Paraguay. The three Asian nations are Bhutan, Hong Kong and Lao. While no African countries feature in the 20 highest-ranking nations for the index, it is striking that 17 of the lowest-ranking countries are from Africa. Based on this finding, an in-depth analysis of the WEF Nexus Index is presented for the SADC. A dashboard for all the 181 countries, with their rank, is presented in Addendum D. The 21 indicators calculated for the 16 SADC nations are presented graphically in Supplementary Figures S1–S21 in Addendum E. In Addendum F, the untreated indicator data (e.g., from the World Bank, International Energy Agency, and FAO) for the 21 indicators that constitute the WEF Nexus Index are presented.
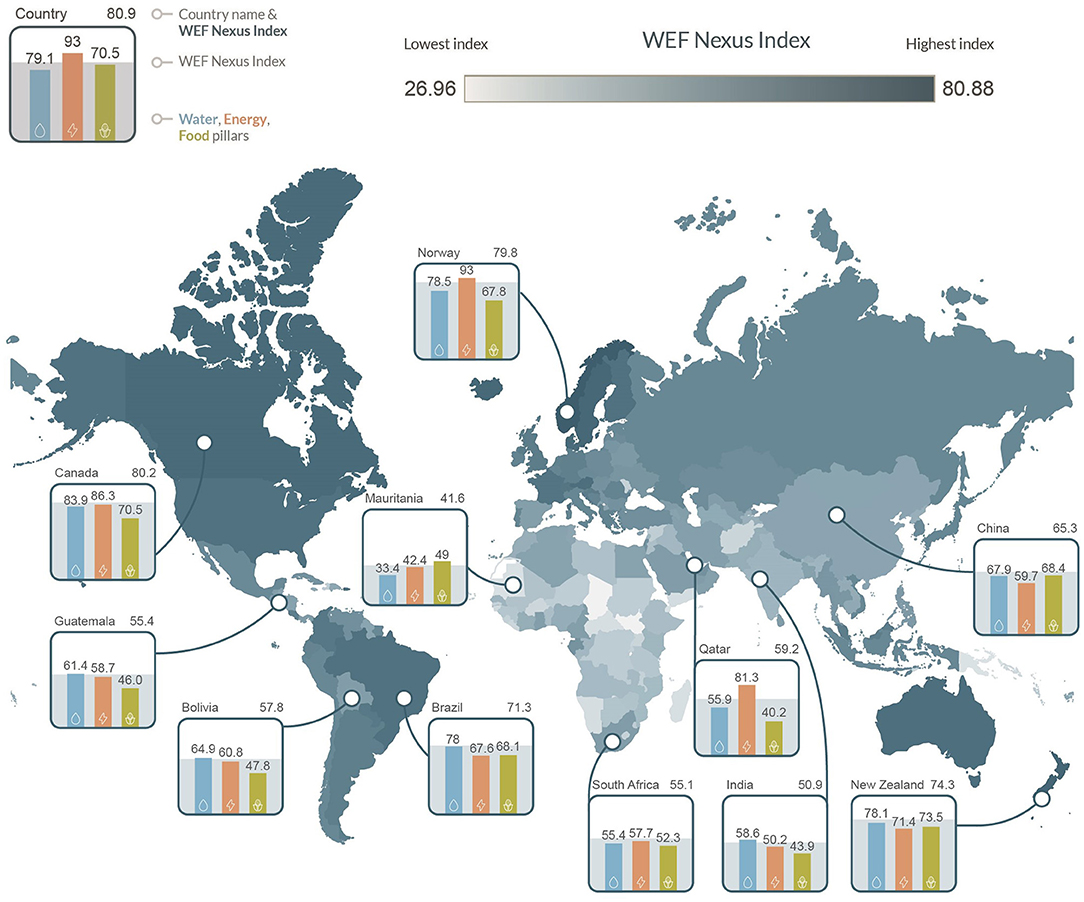
Figure 4. WEF Nexus Index world map with a focus (in glyphs) on selected countries (interactive website at https://www.wefnexusindex.org/). Latest available data as of August 2019.
SADC Case Study
The purpose of this case study is to demonstrate how the WEF Nexus Index, and its hierarchically structured constituents, can be utilized in a systematic analysis for a region. By exploring the underlying pillars, sub-pillars and indicators, the SADC nation's status in terms of access to and availability of water, energy and food becomes evident and emphasizes the remaining work required for this region to attain the SDGs and NDCs. Table 1 presents the median WEF Nexus Index values and ranks for the 16 SADC nations, together with the median and average values.

Table 1. WEF Nexus Index, ranks, pillar and sub-pillar values for 16 SADC countries.
The two highest-ranking SADC nations, in terms of the WEF Nexus Index, are Seychelles and Mauritius, with global ranks of 64th and 89th, respectively. The two lowest-ranking SADC countries are Madagascar and Botswana, 175th and 171st, respectively.
The average water, energy, and food pillar scores for the SADC countries are 50.4, 52.3, and 42.3, respectively. The energy pillar is, therefore, the highest-ranking pillar of the three, on average, while the food pillar scores the lowest, on average, for the SADC nations. The nation with the highest pillar value is Comoros (energy pillar = 74.9), with Seychelles having the highest value for the water pillar (74.7), and Mauritius (61.0) having the highest value for the food pillar, highlighting the relatively good access and supply of these resources to those nations populations. Seven nations have food pillar values below 40. South Africa, Mauritius, Comores, and Seychelles have relatively high index values. Interestingly, for Mauritius, the energy pillar is the lowest of any of the nations, yet the food pillar is the highest. In the lower ranking countries, food is generally the lowest ranking pillar, with the exception of Tanzania (where water is the lowest).
Access to basic drinking water and sanitation services has improved across the region since 1990 (Zimbabwe is one exception) (World Bank, 2018). However, our study shows that only Mauritius and Seychelles exceed the global median value1 for these two indicators (Supplementary Figures 1, 2 in Addendum E). There is, therefore, much work remaining within this region to achieve SDG 6 by 2030, with the median levels of access to at least basic drinking water and sanitation services for the SADC nations being 67.2 and 39.4%, respectively. In contrast, regarding the degree of Integrated Water Resources Management (IWRM) implementation, i.e., SDG indicator 6.5.1 (Supplementary Figure 3 in Addendum E), eight nations have values that exceed the global median (45.0), illustrating the relatively strong adoption of IWRM principles within several SADC countries' policies, institutions, management tools and financing.
The annual freshwater withdrawals as a percentage of the total internal resources is a vital sustainability indicator, as evidenced by its inclusion as an official SDG indicator (6.4.2). Six SADC nations have withdrawal levels that exceed the global median value (7.7%), with Mauritius, South Africa, Eswatini, and Zimbabwe having levels that exceed 25% (Supplementary Figure 4 in Addendum E). Eight SADC countries2 have annual freshwater withdrawal rates that are <5% of their internal resources. The potential to utilize freshwater beneficially in these countries is evident when it is considered that Angola, Comoros, the DRC, Lesotho, Mozambique and Zambia only utilize 0.5, 0.8, 0.08, 0.8, 0.9, and 2% of their annual freshwater resources, respectively. The renewable freshwater resources per capita in five of these countries exceed the global median (Supplementary Figure 5 in Addendum E), which suggests that not only is freshwater underutilized, but it is relatively abundant. It must be noted that, due to the significant flows in these nations, these river systems have relatively high environmental flow requirements (Supplementary Figure 6 in Addendum E), with those in the DRC being the most significant (982 million m3/yr). The average precipitation depths for the SADC countries are presented in Supplementary Figure 7 in Addendum E, with seven nations receiving, on average, a rainfall depth that equals or exceeds the global average rainfall depth of 1,028 mm per annum, although with high seasonality.
SDG 7 is the aspirational goal of ensuring access to affordable, reliable, sustainable and modern energy for all. The global median level of access to electricity (SDG indicator 7.1.1) is 100%. Seychelles provides access to electricity for their entire population, while only 11% of Malawi's populace have access to electricity (Supplementary Figure 8 in Addendum E). The average and median levels of access to electricity within the SADC countries are 57 and 55%, respectively. In terms of renewable energy consumption (SDG indicator 7.2.1), an average of 55.6% of the total final energy consumed is classified as being renewable for SADC nations (Supplementary Figure 9 in Addendum E). Similarly, on average, 56.1% of the total electricity output is renewable (Supplementary Figure 1 in Addendum E); the global median value is 30.9%. Countries with low levels of renewable electricity output include Botswana and South Africa (0.03 and 2.3%, respectively), highlighting their dependence on coal-fired power stations (World Bank, 2018). Six SADC nations have renewable electricity output levels that exceed 80% of the total electricity output and renewable energy consumption levels that exceed 80% of the total final energy consumption. Hydropower is the dominant electricity source in these countries.
Many SADC nations have very low CO2 emissions, with the median value for these 16 nations being 0.9 metric tons per capita per annum (Supplementary Figure 11 in Addendum E). South Africa is a notable exception. In 2014 it emitted nine tons of CO2 per capita, and 3 years later was the fourteenth highest net emitter of CO2 globally (Fleming, 2019).
Electric power consumption per capita levels in the SADC countries are generally significantly below the global median (2,584 kWh/capita), with South Africa being the only exception. The electric power consumption levels per capita are instructive because they provide context for renewable electricity output levels. For example, the DRC has a renewable electricity output level of 99.8% of the total electricity output, but the electric power consumption in this nation is only 109 kWh per capita, which is significantly below the global median of 2,584 kWh per capita.
The indicator “Energy imports, net (% of energy use)” provides an indication of a nation's independence in terms of energy supply, which provides a perspective of energy security. Because many nations generate surplus energy and export that additional capacity, these countries have negative values for this indicator (Supplementary Figure 13 in Addendum E). The indicator, therefore, measures both imports and exports of energy—for example, Angola and Mozambique export energy, the former to a large degree.
As noted above, the food pillar is generally the lowest scoring in the SADC region. A deeper analysis highlights that the prevalence of undernourishment in SADC countries exceeds the global median value for all but two nations, namely Mauritius and South Africa (Supplementary Figure 14 in Addendum E; there is no data for this indicator for Seychelles, Comoros and the DRC). Similar patterns are evident in the percentage of children under 5 years of age affected by wasting and stunting (Supplementary Figures 15, 16 in Addendum E, respectively). These concerning levels are supported indirectly by assessing obesity in the SADC nations, with South Africa being the only nation to exceed the global median (Supplementary Figure 17 in Addendum E). In terms of the availability of food, two critical indicators are the cereal yield (kg/ha) and the average value of food production (I$/capita3)—Supplementary Figures 19, 21 in Addendum E, respectively. While three nations (Madagascar, Mauritius and South Africa) have cereal yields that exceed the global median (3,032 kg/ha), many of the remaining SADC nations have very low crop yields. None of the 16 SADC nations has an average value of food production that exceeds the global median. This is reflected in the indicators related to the prevalence of undernourishment and the percentage of children under 5 years of age who are stunted (median values of 26.3 and 33.8%, respectively, for the SADC nations). The median values for these indicators for the 181 countries assessed are 6.5 and 14.1%, respectively.
Whilst the high-level comparative analyses above are illustrative, an important aspect of the WEF Nexus Index is that it provides an entry point for deeper analysis and identification of opportunities to address the higher level issues identified, rather than an endpoint or target.
Analysis of Index Construction
In order to provide context and a degree of validation to the index, it has been compared with the well-known Human Development Index (HDI), and both cluster and sensitivity analyses have been performed. Furthermore, there has been a strong effort in providing interactive visualization tools for the index.
Comparison With Human Development Index
While there is a medium-to-strong correlation between the HDI and the WEF Nexus Index (R2 = 0.57; Supplementary Figure 22 in Addendum E), these two indices represent contrasting facets of development (UNDP, 2018a,b). The former combines indicators relating to health, education and income (providing a nexus perspective of, amongst others, SDGs 3, 4, 8). The latter presents sustainable development in terms of access to and availability of water, energy and food. These three crucial resource sectors directly represent four of the 17 SDGs, i.e., 2, 6, 7, and 13. The two indices can, therefore, be beneficially utilized by different academics, non-governmental organizations, policy- and decision-makers to inform their areas of research, interest or responsibility. The medium-to-strong correlation is constructive. If the HDI and WEF Nexus Index were weakly correlated, then they would not both be offering a perspective on sustainability. The existence of the one does not, therefore, nullify the need for the other.
Cluster Analysis
A k-means clustering algorithm was applied to the 181 countries' WEF Nexus Index values, thus allowing the countries to be grouped according to these values. The analysis yielded two clusters, i.e., countries with WEF Nexus Index values lower than the global median and those with values higher than the global median index, as presented in Figures 5A,B. From Figure 5A, it is evident that while the median for the food pillar is the lowest and the water pillar the highest, countries with a WEF Nexus Index value above the median do not necessarily rank highly for all three resource sector pillars. Figure 5B presents the correlation between the various pillars, which is generally poor. This lack of correlation is anticipated since the pillars represent independent resource sectors. The two sectors that are most strongly correlated are the water and food pillars.
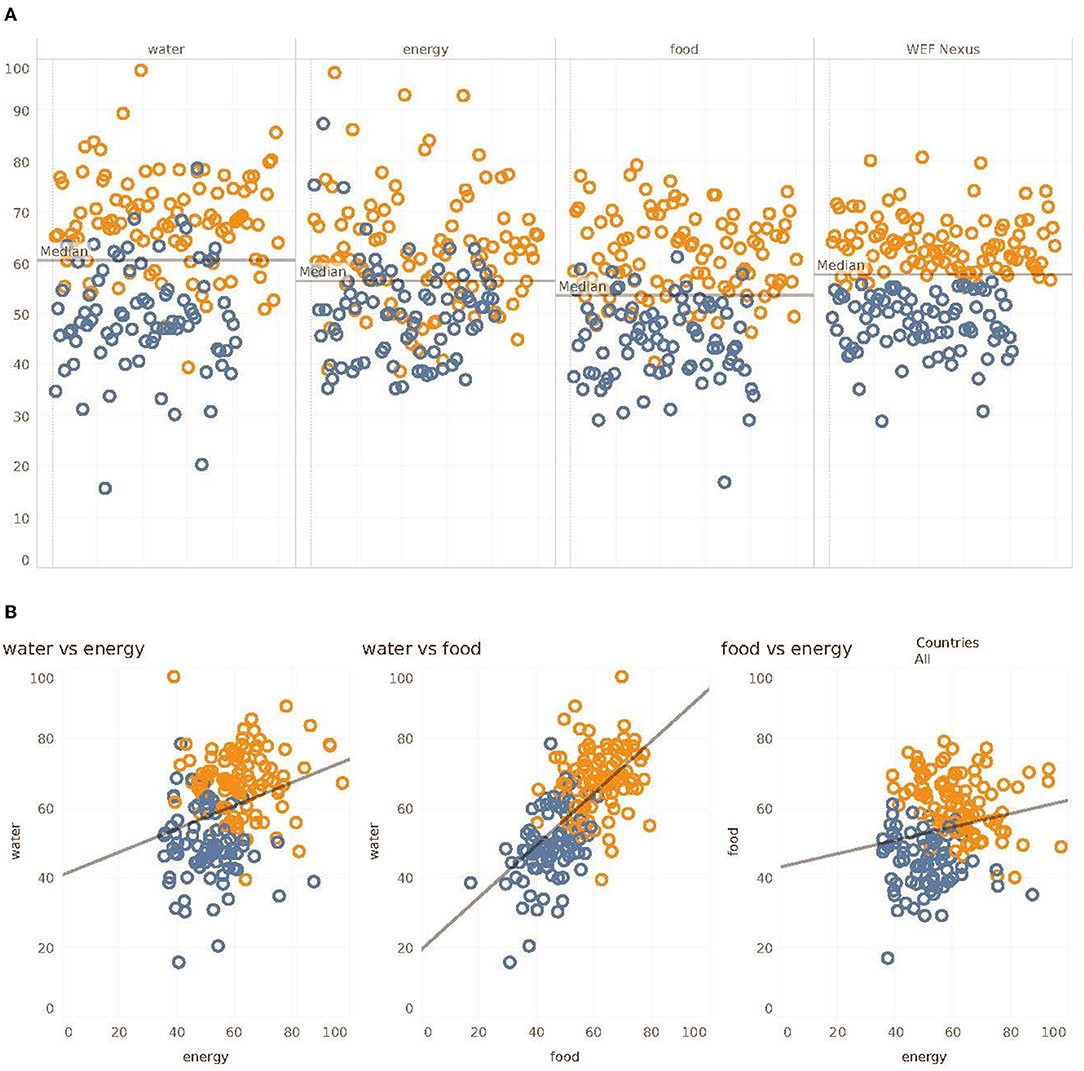
Figure 5. (A) Plot of the pillar and WEF Nexus Index values vs. the median pillar/index value for the 181 countries assessed, and (B) Scatter plots of the WEF Nexus Index pillars, water vs. energy, water vs. food, and food vs. energy (orange indicates countries with WEF Nexus Index values above the global median while blue indicates values below the global median index value).
Sensitivity Analysis
Like any composite indicator or model, the WEF Nexus Index has uncertainties in the underlying data and the methodological decisions made in its construction. Here, a sensitivity analysis is performed to investigate the effects of these uncertainties, using a Monte Carlo analysis to estimate confidence intervals on country ranks and a global sensitivity analysis to ascertain the individual contribution of each input's uncertainty (Becker, 2021).
Three key uncertainties were chosen to be investigated, namely:
1. The aggregation method: By default, the WEF Index is aggregated using an arithmetic mean. However, it could be argued that the water, energy and food components of the nexus are not fully compensable; therefore, the geometric mean could be a plausible alternative for the last level of aggregation.
2. The normalization method: The index is normalized using a min-max approach. Plausible alternatives could be a “distance to maximum” approach (each indicator is normalized with the distance to the maximum country value) or using “z-scores” (indicators are normalized to have the same mean and variance).
3. The weighting: By default, indicators have fixed weights, as described elsewhere in the article. Here, the assumption is relaxed by allowing indicators to vary randomly within ± 25% of their nominal values.
While this list is not exhaustive, it provides a summary of some of the important methodological uncertainties. Strictly speaking, an uncertainty analysis quantifies the uncertainties in the outputs of a system, while a sensitivity analysis apportions this output uncertainty to individual inputs. Here, the output is considered as the ranks of the index. The WEF Nexus Index was re-run 2,000 times in a Monte Carlo analysis, each time randomly selecting an aggregation method, normalization method, and a random set of weights within the prescribed limits. Each time, the ranks were recorded for each nation.
Figure 6 shows the 90% confidence intervals of the ranks of the WEF Nexus Index (countries are not labeled due to a large number of points). There is a moderate but manageable amount of uncertainty in the ranks of the countries. The average difference between nominal and median rank is 2.86 places. As is typical in composite indicators, the top and bottom nations are relatively stable, whereas there is more variation in the middle-ranked countries.
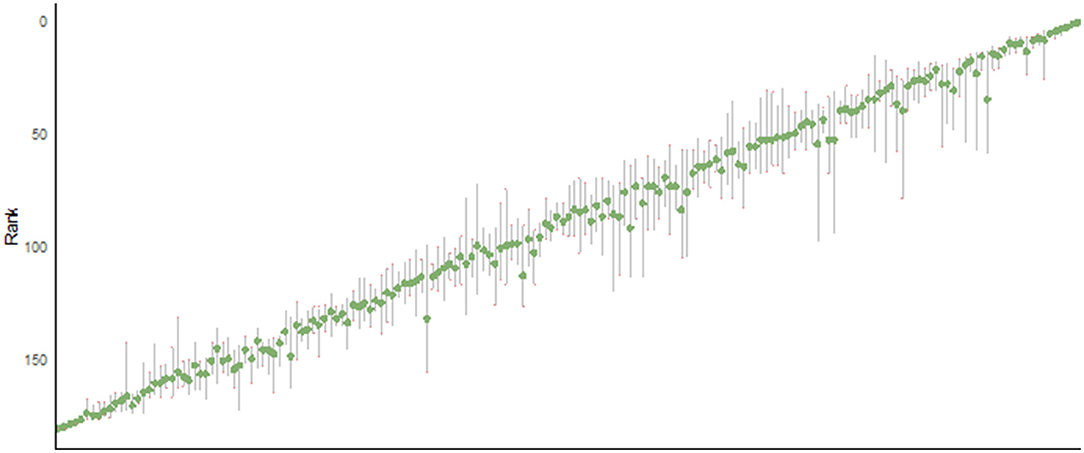
Figure 6. 90% confidence intervals on ranks of the WEF Nexus Index. The gray bars are the 90% confidence intervals. Countries are ordered according to their nominal rank. The green point is the median rank across the uncertainty analysis.
Next, a global sensitivity analysis was run following the methodology of Saisana et al. (2005). This method uses a Monte Carlo approach to estimate variance-based sensitivity indices; specifically, the first-order index, which measures the individual contribution of each input to the output uncertainty, and the total order index, which measures the contribution of each input including interactions with other inputs (Saisana et al., 2005; Saltelli et al., 2008).
The sensitivity indices were estimated by re-running the WEF Nexus Index calculation 5,000 times according to a Monte Carlo design. The results are shown in Figure 7, where each sensitivity index includes bootstrapped confidence intervals.

Figure 7. First order (Si) and total order (STi) sensitivity indices of input assumptions plotted as mean (dot) and 90% confidence intervals by bootstrapping.
The results show that the most sensitive assumption is the normalization method, followed by the weights and the aggregation method. This means that, at least in terms of the ranks and the alternatives investigated here, the WEF Nexus Index is robust to the aggregation method and essentially robust to its weights. The normalization method is somewhat more sensitive, and this may also be because three alternatives were investigated.
Open Science and Visualization
An essential part of this project is the communication of the WEF Nexus Index. Now, more than ever, visualizing data in an engaging manner is vital for the acceptance and dissemination of public data, making it more accessible and understandable (Shneiderman, 1996; van Wijk, 2005). Data visualization is the discipline that studies how to interpret and understand graphics and charts that represent complex data (Tufte, 1983). Its primary design principles have been applied in a set of visualizations compiled in an interactive website associated with the WEF Nexus Index, namely www.wefnexusindex.org.
The website, published to disseminate the WEF Nexus Index, provides data at hierarchical levels. First, it offers a global view of the main index, as well as its three main pillars (water, energy and food), utilizing an interactive globe. The globe includes a novel legend that combines a classical color legend with a strip plot, which graphically presents the distribution of the selected index or pillar.
At the same level of visualization and complementary to the globe are visualizations comprising glyphs. These glyphs represent the WEF Nexus Index and its pillars by country. These glyphs can be compared and sorted in order to facilitate a WEF nexus analysis. Further, each country has a dedicated page that provides more details for that nation, such as the availability and access sub-pillar values, a radar chart, global rankings, a scatter plot of accessibility and access (which highlights correlations), together with the untreated indicator values themselves.
Discussion
The purpose of utilizing a case study is to demonstrate how the WEF Nexus Index and its pillars, sub-pillars and indicators can be utilized as a catalyst for WEF nexus assessments. The set of 16 radar charts in Figure 8 presents the six sub-pillars (where available) per SADC nation. From these graphs, it is evident that access to and availability of water, energy and food is both constrained and varied within the region.
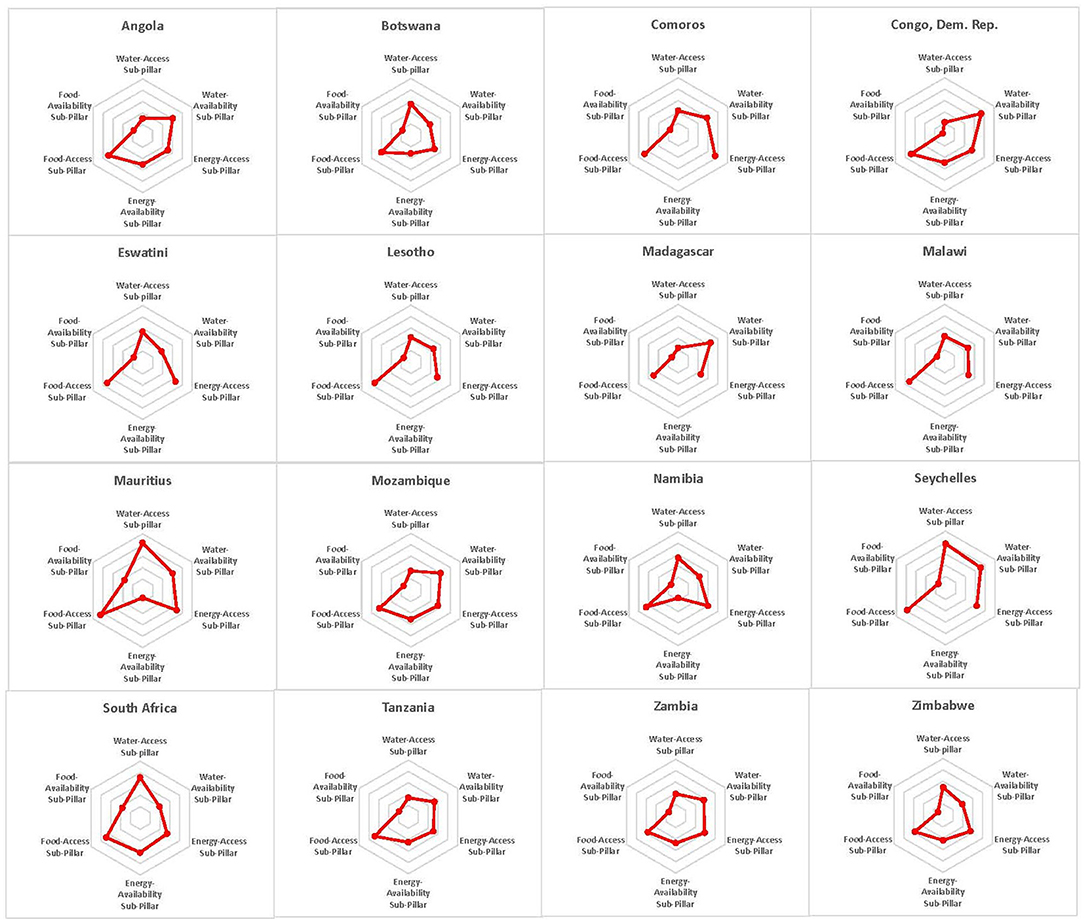
Figure 8. Radar graphs of the sub-pillars for the 16 SADC nations.
Through an integrated analysis, it has been noted that the lowest pillar for the SADC nations, on average, is the food pillar. Secondly, the lowest sub-pillar, on average, is the food-availability sub-pillar. Thirdly, the low value of the food-availability sub-pillar can be attributed principally to the low cereal yields and a low average value of food production within this region (refer to indicators 19 and 21 in Addendum D). At a very high level, this would suggest that critical interventions are needed to enhance access to and availability of food through the use of the available water and energy. In this regard, UN Water (2018) state that Sub-Saharan Africa experiences the highest level of food insecurity, affecting almost 30% of the population. Schreiner and Baleta (2015) suggest that the agricultural potential of countries like Zambia could be exploited for the benefit of the entire region. While this is true, it is ironic that fertile countries such as Zambia experience high levels of undernourishment (World Bank, 2018).
Eight SADC nations have annual freshwater withdrawal levels of <5% of their total internal resources, i.e., low levels of withdrawal. If this available water could be utilized beneficially for food production, be it through the drought-proofing of rainfed agriculture (Bossio et al., 2011) or a “steady positive trend in irrigation development” (Van der Zaag, 2010)—or, ideally, both—it could go a long way in addressing food security concerns in the region. Such actions must be married with endeavors to boost nutrient balances (through suitable fertilizer addition), access to markets, agricultural training and research (Van der Zaag, 2010; Mueller et al., 2012; Lu and Tian, 2017). In terms of synergies, there is a clear opportunity to produce more food through the utilization of available water resources in several SADC countries. This will enhance food security and reduce levels of malnourishment, wasting and stunting, while increasing the values of the water and food pillars. A trade-off is that more energy will be required.
Energy is required to efficiently pump, treat, convey and irrigate water. All the SADC countries, except Seychelles, have electricity access levels below the median global value, with half the populations in nine of these nations having no electricity access. Electrical power consumption per capita is low when compared to the global average of 2,584 kWh/capita. RES4Africa and Enel (2019) state that the WEF nexus “offers an innovative perspective on bridging the energy access gap by considering energy as an enabler for development.” From a nexus perspective, there are clear opportunities for energy systems to be developed beneficially to use the available water to facilitate enhanced agricultural development and food security. This philosophy is aligned with the United Nation's Deputy Secretary-General, Amina Mohammed, who stated that “sustainable energy is the golden thread that links most of the SDGs and the pledge to leave no one behind” (Mohammed, 2018).
The SADC countries share an energy grid, termed the Southern African Power Pool (SAPP), and several nations within the zone export and import power from each other to meet their local demand (Mabhaudhi et al., 2016). A paradox in Africa is that some nations, such as Angola and Mozambique, have their populaces languishing with low levels of access to electricity and limited electric power consumption per capita, yet they export energy (the former, significantly), illustrating the potential trade-off of increased supply to local populations against lower foreign earnings. Another seeming contradiction is that a nation such as South Africa exports energy, yet it has struggled with rolling power-cuts for over a decade. Mauritius, Botswana and Namibia are three SADC nations that rely on energy imports.
Hydropower forms a significant component of the regional energy supply with widespread sharing within the SAPP. Conway et al. (2015) note that almost 100% of electricity production in the DRC, Lesotho, Malawi and Zambia is generated by means of hydropower. Regarding energy in SADC, “challenges include low tariffs, poor project preparation, issues with power purchase agreements, and absent regulatory frameworks that stunt investment and financing in the energy sector” (Schreiner and Baleta, 2015). A great opportunity results from Southern Africa being endowed with significant potential in terms of solar and wind power generation (Gies, 2016). However, although recognized as opportunities in most of the region's NDCs, the prevalence of coal-fired stations which are not yet at the end of their design life in South Africa means significant rigidity in the energy production system. Thus, any “policy-driven transition to a low carbon and climate resilient society must take into account and emphasize its overriding priority to address poverty and inequality” (DEA, 2016). In other words, the SDGs must be given priority.
A project that has been touted to transform the SADC region is the development of the vast hydropower potential of the Inga Falls in the Congo River. The Grand Inga Dam Project, which has been discussed for half a century, could produce 40 GW of hydroelectric power, more than one-third of the total electricity currently generated in Africa (Sachs, 2015). Political and technical obstacles have, until now, limited the development of this project.
The need to address resource planning in an integrated manner is evident when the water resources in the region are assessed. The national boundaries within SADC were determined politically and not hydrologically, and 85% of the region's water resources are transboundary (Mabhaudhi et al., 2016). SADC coordinates transboundary water cooperation in 15 basins across Southern Africa (UN Water, 2013). These shared basins present opportunities for cooperation to enhance socio-economic security and ensure further progress in achieving the SDGs. However, the availability of resources within the region is not evenly distributed. Over 70% of SADC's freshwater resources are shared between two or more member states (Schreiner and Baleta, 2015). The ratification of SADC's revised protocol on shared watercourses together with the establishment of various river basin organizations, has promoted cooperation and the sharing of benefits from these basins (Claassen, 2013). Hoff (2011) explained that one of the early nexus analyses focussed on the Zambezi River basin. This integrated project included the co-development of hydropower, new irrigation schemes and other water-related sectors, including wetlands and their ecosystem services. More recent analyses of the basin highlight the critical trade-offs between hydropower generation and irrigation, where optimisation of one occurs at the expense of the other, and the recommendation that increasing efficiency of dryland production is an essential aspect of a WEF nexus guided strategy (Payet-Burin et al., 2019).
Kurian and Kojima (2021) argue that “Composite indicators can enable integrative modeling of trade-offs by incorporating information about biophysical, socio-economic and institutional dimensions” of a context under assessment, e.g., water reuse or drought adaption. They are concerned that the WEF nexus context is too narrow in order to adequately inform policy making, and propose the broader context of the environment-development nexus. The WEF Nexus Index can form part of the environment-development nexus studies, highlighting relatively rapidly, on a national level, where interventions, or further assessments are required. The context of the WEF Nexus Index is, however, integrated resource security. Kurian and Kojima (2021) also note that “A composite index can also be useful to compare insitutional responses of different regions within a country or different countries in response to a global goal.” To this end, by updating the WEF Nexus Index each year, until 2030, a critical measure of the nexus of a subset of SDGs can be assessed over time.
Benefits of the WEF Nexus Index
A composite indicator, or index, by its nature, provides an integrated perspective of the context under analysis, e.g., the WEF nexus. This is true even if the composite indicator is not constituted of “nexus” indicators. Rather, the OECD (2008) emphasizes that a “composite indicator should ideally measure multi-dimensional concepts which cannot be captured in a single indicator, e.g., competitiveness, industrialization, sustainability,” i.e., an index provides a nexus perspective which individual indicators cannot offer. However, it cannot—nor is it designed to—provide detailed insight into every aspect of its constituent indicators.
Thus, the WEF Nexus Index, together with its associated visualization website (www.wefnexusindex.org), presented in this work can be used to (i) draw attention to an issue, (ii) allow a hierarchical dataset to be explored, and (iii) facilitate global comparisons. The index serves as a gateway to the underlying pillars, sub-pillars, and indicators (as demonstrated for SADC). While a nation's unitless index value is not significant on its own, the ranking of 181 countries demonstrates national progress in terms of integrated resource management and security. It also facilitates benchmarking against other nations, be they geographically or socio-economically similar, or a top performer like Iceland. The gap between this value and the SADC nation's index values highlights the disparity in integrated resource management and security globally. However, the fact that Iceland and Canada are the only countries that have index values that exceed 80 indicates that no country has achieved complete water, energy and food security. In this regard, rather than being an end in itself, the WEF Nexus Index is a tool that provides an entry point for further in-depth analyses.
Assessments of the hierarchical dataset can be utilized to ascertain focus areas for synergistic efforts, such as the SAPP or the Zambezi Watercourse Commission (ZAMCOM). Providing a quantification of a subset of the SDGs could assist policy-makers in avoiding the trade-offs that result from a silo approach, e.g., pursuing fossil-fuel-based energy security in South Africa at the expense of water and food security (and the loss of biodiversity) (Simpson et al., 2019). The WEF Nexus Index can, therefore, serve as a tool to inform water-for-food, food-for-energy, energy-for-water, water-for-energy, energy-for-food, and food-for-water.
Limitations
Condensing a nation's integrated resource management status into a single number is complex (Daher and Mohtar, 2015; Garcia and You, 2016; Wicaksono et al., 2017; McGrane et al., 2018; Simpson and Jewitt, 2019a). The WEF Nexus Index does not consider political and social impacts to resource security due to the lack of sufficient data for the countries analyzed and the challenge of linking these indicators to the sub-pillars within the index. Social and political issues directly influence natural resource availability and management by determining the amount and quality of resources available to the population, particularly when resources are exported to neighboring nations. The trade of resources between countries constitutes complex interactions and an essential consideration in resource security that may be added to the WEF Nexus Index when the data becomes available.
Conclusions
The wide range of WEF Nexus Index values indicates the extent to which water, energy, and food security differ on a global scale. The relatively strong correlation between the HDI and the WEF Nexus Index indicates that although these two indices are measuring different aspects of sustainable development, they are complementary.
The results of the sensitivity analysis related to the uncertainties in the index's construction show that the most sensitive assumption is the normalization method, followed by the weights and the aggregation method. The cluster analysis indicates that there is a clear separation of nations between those with WEF Nexus Index values above the global median and those below, with the divide aligned between high income, technologically advanced and low income, technologically underdeveloped countries. Of the pillars, water and food security are most strongly correlated.
Within the SADC, food security is a significant concern. Eight of these nations have annual freshwater withdrawal rates that are <5% of their internal resources, and rainfall depth in several countries is above the global median. This indicates that if this available water could be utilized beneficially for food production, be it through the drought-proofing of rainfed agriculture or irrigation development—or both—it could contribute significantly to addressing food security concerns in the region. The enhancement of access to reliable, modern, renewable, affordable energy is a critical enabler of any development, agricultural or otherwise.
Based on the constituent indicators, the WEF Nexus Index is a function of the national resource base (e.g., land, water and fossil fuels), governance and service delivery, and the degree of the energy transition to renewable sources, consumption and self-sufficiency. The proposed WEF Nexus Index is not a “silver bullet” aimed at solving development and environmental challenges facing humanity. Rather it is a tool that can be added to the sustainability toolbox that is being developed and utilized to create “the future we want” reflected both in the SDGs and the NDCs of the Paris Agreement.
Data Availability Statement
The datasets presented in this study can be found in online repositories. The names of the repository/repositories and accession number(s) can be found at: http://dx.doi.org/10.17632/2krwdc8n8d.1.
Author Contributions
GS wrote the manuscript in consultation with GJ, who supervised the project. WB and AN provided input into the development of the WEF Nexus Index. WB developed the sensitivity analysis and contributed to the final manuscript. JB assisted with the selection of indicators and in the literature review of the WEF nexus in South Africa and contributed to the final manuscript. PR and VP developed the data visualizations and cluster analysis, described the philosophy, and importance of visualization in this study. SM contributed to the final manuscript. All authors contributed to the article and approved the submitted version.
Funding
This work is based on the research supported by the Water Research Commission (Project Number K5/2959) and the National Research Foundation (Grant Number: 114692), both of South Africa, and the Ministry of Foreign Affairs of the Netherlands through the WEF-Tools project of the Partnership Programme for Water and Development (DUPC2) under Activity Number No. 28325/DME0121369.
Conflict of Interest
GS and JB are employed by Jones & Wagener (Pty) Ltd. WB is employed by BlueFox Data Consulting. PR and VP are employed by OneTandem SL.
The remaining authors declare that the research was conducted in the absence of any commercial or financial relationships that could be construed as a potential conflict of interest.
Publisher's Note
All claims expressed in this article are solely those of the authors and do not necessarily represent those of their affiliated organizations, or those of the publisher, the editors and the reviewers. Any product that may be evaluated in this article, or claim that may be made by its manufacturer, is not guaranteed or endorsed by the publisher.
Supplementary Material
The Supplementary Material for this article can be found online at: https://www.frontiersin.org/articles/10.3389/frwa.2022.825854/full#supplementary-material
Addendum A. The indicator selection table, which presents the 87 indicators reviewed in the development of the WEF Nexus Index, as well as their definitions, source, data adequacy, reference year, and a motivation of why each indicator was, or was not, included in the composite index.
Addendum B. Detailed description of the selection and weighting of indicators.
Addendum C. A table presenting the conceptual framework associated with the WEF Nexus Index's composition. This table includes the index, pillars, sub-pillars, and indicators with each of their weights, forms of aggregation, and directions.
Addendum D. A dashboard developed from the treated data. The published data for the 21 indicators have been treated by normalizing each of the data sets [using the min-max method (OECD, 2008; Saisana et al., 2018)] so that they conform to a range from 0 to 100. The normalizing of the data is also necessary to ensure that each indicator's data set is unitless such that it can be combined in the composite indicator. The data treatment includes the minimizing of the distorting effect of outliers on the data using statistical methods, which are described in this article. The dashboard has different colors for the treated data for each indicator in the following ranges: 0–25%; 25–50%; 50–75%; and 75–100%.
Addendum E. Supplementary Figures S1–S21, which are graphical plots of each indicator for the 16 SADC nations included in this assessment.
Addendum F. The untreated indicator data table includes the published data (e.g., by the World Bank, IEA, and FAO) for the 21 indicators that constitute the WEF Nexus Index, for the 181 nations that have adequate data.
Footnotes
1. ^The global median value relates to the median calculated for a particular indicator for the 181 nations included in this study.
2. ^Angola, Comoros, DRC, Lesotho, Madagascar, Mozambique, Namibia, and Zambia.
3. ^International dollars per capita: An international dollar could purchase, in the cited country, a comparable amount of goods and services that a US$ would acquire in the United States of America. This term is generally utilized in conjunction with Purchasing Power Parity (PPP) data.
References
Albrecht, T. R., Crootof, A., and A S., C. (2018). The water-energy-food nexus: a systematic review of methods for nexus assessment. Environ. Res. Lett. 13:043002. doi: 10.1088/1748-9326/aaa9c6
Allouche, J., Middleton, C., and Gyawali, D. (2015). Technical veil, hidden politics: interrogating the power linkages behind the nexus. Water Alternatives 8, 610–626. Available online at: https://www.water-alternatives.org/index.php/alldoc/articles/vol8/v8issue1/277-a8-1-1/file
Allouche, J., Middleton, C., and Gyawali, D. (2019). The Water-Energy-Food Nexus: Power, Politics, and Justice. Abingdon: Routledge. doi: 10.4324/9781315209067
Becker, W. (2021). Composite Indicator Development and Analysis in R With COINr. Available online at: https://bluefoxr.github.io/COINrDoc/
Becker, W., Benavente, D., Dominguez Torreiro, M., Moura, C., Neves, A., Saisana, M., et al. (2019). COIN Tool User Guide. Luxembourg: Publications Office of the European Union.
Beddington, J. (2009). Food, Energy, Water and the Climate: A Perfect Storm of Global Events? London: Government Office for Science.
Beddington, J. (2010). Food security: contributions from science to a new and greener revolution. Philos. Trans. R. Soc. B 365, 61–71. doi: 10.1098/rstb.2009.0201
Belinskij, A. (2015). Water-energy-food nexus within the framework of international water law. Water 7, 5396–5415. doi: 10.3390/w7105396
Benson, D., Gain, A. K., and Rouillard, J. J. (2015). Water governance in a comparative perspective: from IWRM to a 'Nexus' approach? Water Alternatives 8, 756–773. Available online at: https://www.water-alternatives.org/index.php/alldoc/articles/vol8/v8issue1/275-a8-1-8/file
Biggs, E. M., Bruce, E., Boruff, B., Duncan, J. M. A., Horsley, J., Pauli, N., et al. (2015). Sustainable development and the water–energy–food nexus: a perspective on livelihoods. Environ. Sci. Policy 54, 389–397. doi: 10.1016/j.envsci.2015.08.002
Bossio, D., Jewitt, G., and van der Zaag, P. (2011). Smallholder system innovation for integrated watershed management in Sub-Saharan Africa. Agric. Water Manage. 98, 1683–1686 doi: 10.1016/j.agwat.2011.07.006
Cairns, R., and Krzywoszynska, A. (2016). Anatomy of a buzzword: the emergence of ‘the water-energy-food nexus' in UK natural resource debates. Environ. Sci. Policy 64, 164–170. doi: 10.1016/j.envsci.2016.07.007
Claassen, M. (2013). Integrated water resource management in South Africa. Int. J. Water Governance 1, 323–338. doi: 10.7564/13-IJWG12
Conway, D., van Garderen, E. A., Deryng, D., Dorling, S., Krueger, T., Landman, W., et al. (2015). Climate and southern Africa's water-energy-food nexus. Nat. Clim. Chang. 5, 837–846. doi: 10.1038/nclimate2735
Daher, B. T., and Mohtar, R. H. (2015). Water-energy-food (WEF) Nexus Tool 2.0: guiding integrative resource planning and decision-making. Water Int. 40, 748–771. doi: 10.1080/02508060.2015.1074148
de Grenade, R., House-Peters, L., Scott, C. A., Thapa, B., Mills-Novoa, M., Gerlak, A., et al. (2016). The nexus: reconsidering environmental security and adaptive capacity. Curr. Opin. Environ. Sustain. 21, 15–21. doi: 10.1016/j.cosust.2016.10.009
De Laurentiis, V., Hunt, D. V. L., and Rogers, C. D. F. (2016). Overcoming food security challenges within an Energy/Water/Food Nexus (EWFN) approach. Sustainability 8, 1–23. doi: 10.3390/su8010095
de Loë, R. C., and Patterson, J. J. (2017). Rethinking water governance: moving beyond water-centric perspectives in a connected and changing world. Nat. Resour. J. 57, 75–99. Available online at: https://digitalrepository.unm.edu/nrj/vol57/iss1/4
DEA (2016). South Africa's Intended Nationally Determined Contribution (INDC). Department of Environmental Affairs. Available online at: https://www4.unfccc.int/sites/ndcstaging/PublishedDocuments/South%20Africa%20First/South%20Africa.pdf
El Costa, D. (2015). Conceptual Frameworks for Understanding the Water, Energy and Food Security Nexus. Working Paper Report Number: E/ESCWA/SDPD/2015/WP. Beirut: Economic and Social Commission for Western Asia (ESCWA).
FAO (2014). The Water-Energy-Food Nexus A New Approach in Support of Food Security and Sustainable Agriculture. Rome: Food and Agriculture Organization of the United Nations.
FAO (2018). Water-Energy-Food Nexus for the Review of SDG 7. New York, NY: Food and Agriculture Organization.
Fleming, S. (2019). Chart of the Day: These Countries Create Most of the World's CO2 Emissions. World Economic Forum. Available online at: https://www.weforum.org/agenda/2019/06/chart-of-the-day-these-countries-create-most-of-the-world-s-co2-emissions/ (accessed June 17, 2019).
Galaitsi, S., Veysey, J., and Huber-Lee, A. (2018). Where is the Added Value? A Review of the Water-Energy-Food Nexus Literature. Somerville, MA: Stockholm Environmental Institute.
Garcia, D. J., and You, F. (2016). The water-energy-food nexus and process systems engineering: a new focus. Comput. Chem. Eng. 91, 49–67. doi: 10.1016/j.compchemeng.2016.03.003
Hoff, H. (2011). Understanding the Nexus. Background Paper for the Bonn2011 Conference: The Water, Energy and Food Security Nexus. Stockholm: Stockholm Environment Institute.
Hoff, H., Alrahaife, S. A., El Hajj, R., Lohr, K., Mengoub, F. E., Farajalla, N., et al. (2019). A nexus approach for the MENA region - from concept to knowledge to action. Front. Environ. Sci. 7, 48. doi: 10.3389/fenvs.2019.00048
IRENA (2015). Renewable Energy in the Water, Energy & Food Nexus. Abu Dhabi: International Renewable Energy Agency.
Kurian, M., and Kojima, U. (2021). “A data light approach to monitoring the environment-development Nexus,” in Boundary Science: Re-imagining Water-Energy-Food Interactions in the Context of a Data Light Approach to Monitoring the Environment-Development Nexus, eds M. Kurian and U. Kojima (Cambridge, MA: Elsevier), 75–118.
Lu, C., and Tian, H. (2017). Global nitrogen and phosphorus fertilizer use for agriculture production in the past half century: shifted hot spots and nutrient imbalance. Earth Syst. Sci. Data 9, 181–192. doi: 10.5194/essd-9-181-2017
Mabhaudhi, T., Mpandeli, S., Madhlopa, A., Modi, A. T., Backeberg, G., and Nhamo, L. (2016). Southern Africa's water-energy nexus: towards regional integration and development. Water 8, 235. doi: 10.3390/w8060235
McGrane, S. J., Acuto, M., Artioli, M., Chen, P.-Y., Comber, R., Cottee, J., et al. (2018). Scaling the nexus: towards integrated frameworks for analysing water, energy and food. Geogr. J. 185, 1–13. doi: 10.1111/geoj.12256
Meadows, D. H., Meadows, D. L., Randers, J., and Behrens, W. W. III. (1972). The Limits to Growth. New York, NY: Universe Books.
Mohammed, A. (2018). Sustainable Energy ‘Golden Thread' Linking 2030 Agenda with Pledge to Leave No One Behind, Especially Rural Women, Deputy Secretary-General Tells Side Event. New York, NY: United Nations.
Mohtar, R. H., and Daher, B. (2012). Water, Energy, and Food: The Ultimate Nexus, 2nd Edn. West Lafayette, IN: Taylor & Francis.
Mueller, N. D., Gerber, J. S., Johnston, M., Ray, D. K., Ramankutty, N., and Foley, J. A. (2012). Closing yield gaps through nutrient and water management. Nature 490, 254–257. doi: 10.1038/nature11420
Muller, M. (2015). The 'Nexus' as a step back towards a more coherent water resource management paradigm. Water Alternatives 8, 675–694. Available online at: https://www.water-alternatives.org/index.php/all-abs/271-a8-1-4/file
National Intelligence Council (2012). Global Trends 2030: Alternative Worlds. Washington, DC: National Intelligence Council.
OECD (2008). Handbook on Constructing Composite Indicators: Methodology and User Guide. Paris: Organisation for Economic Co-operation and Development.
Owen, A., Scott, K., and Barrett, J. (2018). Identifying critical supply chains and final products: an input-output approach to exploring the energy-water-food nexus. Appl. Energy 210, 632–642. doi: 10.1016/j.apenergy.2017.09.069
Payet-Burin, R., Kromann, M., Pereira-Cardenal, S., Strzepek, K. M., and Bauer-Gottwein, P. (2019). WHAT-IF: an open-source decision support tool for water infrastructure investment planning within the water-energy-food-climate nexus. Hydrol. Earth Syst. Sci. 23, 4129–4152. doi: 10.5194/hess-23-4129-2019
RES4Africa and Enel (2019). Africa's Future Counts - Renewables & the Water-Energy-Food Nexus in Africa. Rome: RES4Africa.
Ringler, C., Bhaduri, A., and Lawford, R. (2013). The nexus across water, energy, land and food (WELF): potential for improved resource use efficiency? Curr. Opin. Environ. Sustain. 5, 617–624. doi: 10.1016/j.cosust.2013.11.002
Rockstrom, J., Steffen, W., Noone, K., Persson, A., F., S, Chapin, I., et al. (2009). Planetary boundaries: exploring the safe operating space for humanity. Ecol. Soc. 14, 32. doi: 10.5751/ES-03180-140232
Rockström, J., and Sukhdev, P. (2016). How Food Connects all the SDGs. Stockholm: Stockholm Resilience Centre.
Sachs, J., Schmidt-Traub, G., Kroll, C., Durand-Delacre, D., and Teksoz, K. (2016). SDG Index & Dashboards - Global Report. New York, NY: Bertelsmann Stiftung and Sustainable Development Solutions Network (SDSN).
Sachs, J., Schmidt-Traub, G., Kroll, C., Lafortune, G., and Fuller, G. (2018). SDG Index and Dashboards Report 2018: Global Responsibilities - Implementing the Goals. Paris: Bertelsmann Stiftung and Sustainable Development Solutions Network.
Sachs, J., Schmidt-Traub, G., Kroll, C., Lafortune, G., and Fuller, G. (2019). Sustainable Development Report 2019. New York, NY.
Saisana, M., Alberti, V., Alvarez, M., Becker, W., Caperna, G., Cocco, C., et al. (2018). 16th JRC Annual Training on Composite Indicators and Scoreboards. Ispra: Joint Research Centre: Competence Centre on Composite Indicators and Scoreboards.
Saisana, M., Saltelli, A., and Tarantola, S. (2005). Uncertainty and sensitivity analysis techniques as tools for the quality assessment of composite indicators. J. R. Stat. Soc. Ser. A 168, 307–323. doi: 10.1111/j.1467-985X.2005.00350.x
Salam, P. A., Pandey, V. P., Shrestha, S., and Anal, A. K., (eds.). (2017). “The need for the nexus approach,” in Water-Energy-Food Nexus: Principles and Practices (Hoboken, NJ: John Wiley & Sons, Inc), 1–10.
Saltelli, A., Ratto, M., Andres, T., Campolongo, F., Cariboni, J., Gatelli, D., et al. (2008). Global Sensitivity Analysis: The Primer. West Sussex: John Wiley & Sons.
Schreiner, B., and Baleta, H. (2015). Broadening the lens: a regional perspective on water, food and energy integration in SADC. Aquatic Procedia 5, 90–103. doi: 10.1016/j.aqpro.2015.10.011
Segnestam, L. (2002). Indicators of Environment and Sustainable Development: Theories and Practical Experience. Washington, DC: The World Bank Environment Department.
Shneiderman, B. (1996). “The eyes have it: a task by data type taxonomy for information visualizations,” in Proceedings 1996 IEEE Symposium on Visual Languages (Boulder, CO: IEEE).
Simpson, G. B., Badenhorst, J., Berchner, M., Jewitt, G. P. W., and Davies, E. (2019). Competition for land: the water-energy-food nexus and coal mining in Mpumalanga province, South Africa. Front. Environ. Sci. 7, 1–12. doi: 10.3389/fenvs.2019.00086
Simpson, G. B., and Jewitt, G. P. W. (2019a). The development of the water-energy-food nexus as a framework for achieving resource security: a review. Fron. Environ. Sci. 7, 1–9. doi: 10.3389/fenvs.2019.00008
Simpson, G. B., and Jewitt, G. P. W. (2019b). The water-energy-food nexus in the anthropocene: moving from ‘nexus thinking' to ‘nexus action'. Curr. Opin. Environ. Sustain. 40, 117–123. doi: 10.1016/j.cosust.2019.10.007
Simpson, G. B., Jewitt, G. P. W., and Badenhorst, J. (2020). The Water-Energy-Food Nexus Index and its application to South Africa and the Southern African Development Community. WRC Report no. 2959/1/19. Water Research Commission, Pretoria. Available online at: http://wrcwebsite.azurewebsites.net/wp-content/uploads/mdocs/2959_final.pdf
Steffen, W., Rockstrom, J., Richardson, K., Lenton, T. M., Folke, C., Liverman, D., et al. (2018). Trajectories of the earth system in the anthropocene. Proc. Natl. Acad. Sci. U.S.A. 115, 8252–8259. doi: 10.1073/pnas.1810141115
Sušnik, J. (2018). Data-driven quantification of the global water-energy-food system. Resourc. Conserv. Recycl. 133, 179–190. doi: 10.1016/j.resconrec.2018.02.023
UN Water (2013). Water Security and the Global Water Agenda. UN-Water Analytical Brief. Hamilton, ON: United Nations University.
UN Water (2018). Sustainable Development Goal 6: Synthesis Report on Water and Sanitation. New York, NY: United Nations.
UNDP (2018a). 2018 Statistical Annex - Human Development Reports. Available online at: hdr.undp.org/sites/default/files/2018_statistical_annex_all.xlsx. United Nations Development Programme.
UNDP (2018b). Human Development Indices and Indicators 2018 Statistical Update. New York, NY: United Nations Development Programme.
UNESCO (2014). United Nations World Water Development Report 2014: Water and Energy. Paris: UNESCO. p. 230.
Van der Zaag, P. (2010). Viewpoint – Water variability, soil nutrient heterogeneity and market volatility – why sub-Saharan Africa's Green Revolution will be location-specific and knowledge-intensive. Water Alternatives 3, 154–160. Available online at: https://www.water-alternatives.org/index.php/allabs/76-a3-1-9/file
van Wijk, J. (2005). The value of visualization. IEEE Visual. 5, 79–86. doi: 10.1109/VISUAL.2005.1532781
Waas, T., Hugé, J., Block, T., Wright, T., Benitez-Capistros, F., and Verbruggen, A. (2014). Sustainability assessment and indicators: tools in a decision-making strategy for sustainable development. Sustainability 6, 5512–5534. doi: 10.3390/su6095512
Wicaksono, A., Jeong, G., and Kang, D. (2017). Water, energy, and food nexus: review of global implementation and simulation model development. Water Policy 19, 440–462. doi: 10.2166/wp.2017.214
Wichelns, D. (2017). The water-energy-food nexus: is the increasing attention warranted, from either a research or policy perspective? Environ. Sci. Policy 69, 113–123. doi: 10.1016/j.envsci.2016.12.018
World Bank (2018). Indicators. Data. Available online at: http://data.worldbank.org/indicator/ (accessed March 1, 2019)
World Economic Forum (2011). Water Security: The Water-Energy-Food-Climate Nexus. Washington, DC: World Economic Forum.
World Economic Forum (2018). The Global Risks Report 2018 - 13th Edition. Geneva: World Economic Forum.
WWAP (2020). United Nations World Water Development Report 2020: Water and Climate Change. Perugia: UNESCO.
WWF SABMiller (2014). The Water-Food-Energy Nexus: Insights into Resilient Development, 20. Available online at: http://assets.wwf.org.uk/downloads/sab03_01_sab_wwf_project_nexus_final.pdf
Keywords: WEF, nexus, composite indicator, SDGs, SADC, open data
Citation: Simpson GB, Jewitt GPW, Becker W, Badenhorst J, Masia S, Neves AR, Rovira P and Pascual V (2022) The Water-Energy-Food Nexus Index: A Tool to Support Integrated Resource Planning, Management and Security. Front. Water 4:825854. doi: 10.3389/frwa.2022.825854
Received: 30 November 2021; Accepted: 02 February 2022;
Published: 10 March 2022.
Edited by:
Tendai Polite Chibarabada, WaterNet Trust, BotswanaReviewed by:
Bassel Daher, Texas A&M Energy Institute, United StatesRabi Mohtar, Texas A&M University, United States
Copyright © 2022 Simpson, Jewitt, Becker, Badenhorst, Masia, Neves, Rovira and Pascual. This is an open-access article distributed under the terms of the Creative Commons Attribution License (CC BY). The use, distribution or reproduction in other forums is permitted, provided the original author(s) and the copyright owner(s) are credited and that the original publication in this journal is cited, in accordance with accepted academic practice. No use, distribution or reproduction is permitted which does not comply with these terms.
*Correspondence: Gareth B. Simpson, c2ltcHNvbkBqYXdzLmNvLnph