 Kenneth E. Kunkel1*
 Xungang Yin2†
 Liqiang Sun1
 Sarah M. Champion1
 Laura E. Stevens1
 Katharine M. Johnson1
- 1North Carolina Institute for Climate Studies, North Carolina State University, Asheville, NC, United States
- 2Riverside Technology Inc., Asheville, NC, United States
Trends in extreme precipitation and their causes were analyzed for events within the Laurentian Great Lakes for several periods: 1908–2020, 1949–2020, 1980–2019, and 1980–2020. Upward trends in extreme precipitation were found for multiple metrics, including the number of exceedances of return period thresholds for several durations and average recurrence intervals (ARI), the number of extreme basin-average 4-day precipitation totals, and the annual maximum daily station precipitation. The causes of extreme events were classified into 5 meteorological categories: fronts of extratropical cyclones (ETC-FRT), extratropical cyclones but not proximate to the fronts (ETC-NFRT), mesoscale convective systems (MCS), tropical cyclones (TC), and air mass convection (AMC). For daily events exceeding the threshold for 5-yr ARI, ETC-FRTs account for 78% of all events, followed by ETC-NFRTs (12%), MCSs (6%), TCs (2%), and AMC (1%). Upward trends in the number of events by cause were found for all categories except AMC. An examination of basin-wide 4-day extreme events (40 largest events during 1980–2019) found that all events were caused by ETC-FRTs (85%) or ETC-NFRTs (15%).
Introduction
The Laurentian Great Lakes represent the largest freshwater resource in North America. They are utilized in many ways, including as a municipal water supply source, a transportation waterway, a major commercial fishery, and a recreational destination for fishing, boating, and skiing. Fluctuations in water levels and available water quantity can have major impacts on these uses. For example, on Lakes Michigan-Huron over the period 2010 to 2020, annual average water levels ranged from 175.9 m above sea level in 2013 to 177.31 m in 2020. These fluctuations are sufficiently large in magnitude to have contrasting impacts on lake uses. For example, anomalously high lake levels increase the risk of shoreline damage during storms but increase the maximum load that cargo ships can carry through shallow portions of navigation channels. Anomalously low levels reduce maximum loads but reduce shoreline damage during storms (Wuebbles et al., 2019).
A major question is the impact of future anthropogenically forced climate change on the hydroclimatology of the Great Lakes Basin (GLB). Most global climate model (GCM) simulations under increased future greenhouse gas (GHG) concentrations show an increase in both mean annual precipitation and extreme precipitation frequency and intensity over the GLB (Easterling et al., 2017). However, accurate simulation of precipitation remains a challenge for GCMs because of the complexity of precipitation physics and the coarse resolution of GCMs (Seneviratne et al., 2021).
To address such issues, a growing research area is a focus on the meteorological causes of extreme precipitation events, trends, and variations. Such causes can be broadly categorized into thermodynamic and dynamic components (Emori and Brown, 2005; Nie et al., 2018). The former accounts for atmospheric moisture content, q, the saturated value of which, according to the Clausius–Clapeyron relationship, increases at a rate of ~7%/K (Trenberth et al., 2003). In addition to its obvious effect through supply of moisture, the atmospheric moisture content can also indirectly affect potential extreme precipitation magnitudes through changes in atmospheric convective stability. The dynamic component accounts for atmospheric motion, specifically the vertical velocity (VV), and is associated with specific weather system types.
Quantifying how changes in these components affect the local extreme precipitation distribution is complicated. While progress is expected in the future using convection-permitting models (Kendon et al., 2021), the capability to observe and model changes in small-scale convective processes affecting local extreme precipitation is still limited (Prein et al., 2017) because the spatial resolution of both global and regional climate models remains too coarse to directly simulate the small-scale circulations and associated micro-physical processes in clouds. On the other hand, important progress has been made on linking regional changes in extreme precipitation to large-scale processes. Barlow et al. (2019) state that global climate models “are generally better at capturing synoptic-scale features associated with extreme precipitation than extreme precipitation, itself.” A study of the northeast US, including the eastern part of the GLB, found that a set of models from the Coupled Model Intercomparison Project Phase 6 (CMIP6) exhibited mixed results in their simulation of extreme precipitation metrics with slightly better performance for the circulation patterns associated with heavy precipitation (Agel and Barlow, 2020). Kunkel et al. (2020a) found concurrent increasing trends in extreme precipitation and precipitable water (PW; the column integrated q) aggregated in large regions of the US. Similar results have been found in Australia by Roderick et al. (2020). Kunkel et al. (2020b) examined the relationship of individual station extreme precipitation event magnitudes with associated values of PW and VV and found a strong positive correlation.
In this study, we examine trends in extreme precipitation and the relationship of those trends to large-scale weather systems. Such systems are generally simulated adequately by GCMs. This analysis provides the basis for an alternate approach to future projections that uses the large-scale weather factors causing extreme precipitation rather than precipitation itself.
Previous analyses of extreme precipitation that included the Great Lakes generally indicate upward trends. For the United States, Easterling et al. (2017) found upward trends over the northeastern quadrant of the US for several extreme metrics for both 1901–2016 and 1958–2016. The metrics include the number of daily precipitation events exceeding an average recurrence interval (ARI) of 5 years, the 5-yr maximum daily precipitation, and the total amount of precipitation falling on days exceeding the 99th percentile of daily precipitation. Kunkel et al. (2020a) found upward trends in the number of extreme events for the northeast US for 35 combinations of duration (1, 2, 3, 5, 10, 20, and 30 days) and ARI (1, 2, 5, 10, and 20 years) over the period 1949–2016. Vincent et al. (2018) analyzed trends over 1901–2016 for Canadian stations in the GLB. For the number of days exceeding the 90th percentile threshold of daily precipitation, most stations indicated upward trends. However, for the annual maximum daily precipitation, they found a mix of upward and downward trends, with most not statistically significant.
Some of the above studies presented composite analyses that included portions of the GLB, but they do not include results specifically for the basin. This study builds upon previous regional studies by focusing on both trends and meteorological causes of extreme precipitation events exclusively for the GLB.
Data and Methods
Station Observations of Precipitation
The Global Historical Climatology Network—Daily (GHCN-D) was used as the source of station observations of daily precipitation (Menne et al., 2012). A set of United States stations with <10% missing daily precipitation data for 1895–2009 from Kunkel et al. (2012) was screened for those within the boundaries of the GLB; a total of 57 stations were identified. To enhance spatial coverage, two additional sets of stations from GHCN-D were identified, meeting the criterion of <10% missing daily precipitation observations for 1949–2020 and 1980–2020; these included available Canadian stations. Geospatial analysis was performed on these subsets of stations to determine those within the boundaries of the Great Lakes basin. A total of 171 (188) stations were identified for the period 1949–2020 (1980–2020), including 42 stations common to all three sets. The locations of these three sets of stations are shown in Figure 1.
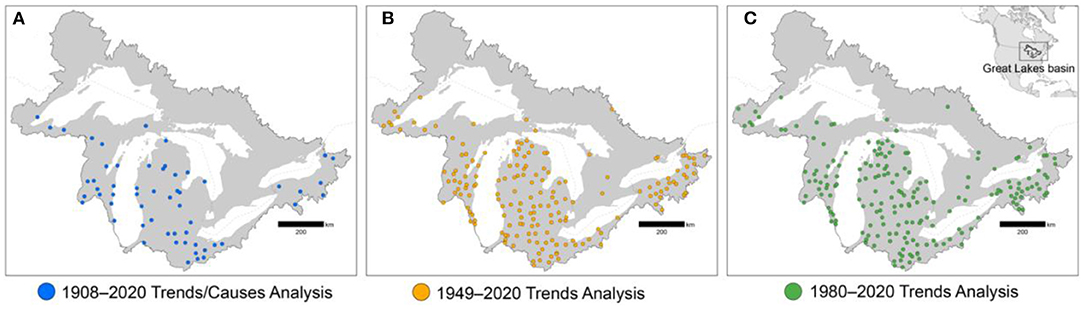
Figure 1. Locations of the stations used in (A) the trends and causes analysis for 1908–2020, (B) the trends analysis for 1949–2020, and (C) the trends analysis for 1980–2020. The white area indicates water bodies and the dark gray area indicates land area within the Great Lakes drainage basin.
The 1895–2020 long-term set of 57 stations had been analyzed by Kunkel et al. (2012) to identify daily precipitation events exceeding the threshold for a 1-in-5-yr average recurrence interval (ARI). In that study, they restricted the analysis of meteorological causes to the period 1908–2009 because of inadequacies in the data needed to identify causes before that period. For this current study, we used the events and causes for that shorter period of 1908–2009. The data for 2010–2020 were also analyzed to identify additional events exceeding the threshold, creating a data set for 1908–2020. For this additional analysis period of 2010–2020, the number of stations meeting the minimum data availability threshold (300 or more days in a year) for analysis varied from 45 to 51. Three annual resolution time series were constructed. For each year, based on the events exceeding the station-specific 1-in-5-yr threshold in that year, three metrics were computed: (1) the total number of station events; (2) the mean precipitation for those daily station events; and (3) the single largest (maximum) precipitation value for those daily station events. The annual values were normalized by the number of stations meeting the data availability criterion for that year. The resulting three annual time series were analyzed for trends.
The 1949–2020 and 1980–2020 sets of 171 and 181 stations were analyzed following Kunkel et al. (2020a) for trends in the number of events exceeding thresholds of extreme precipitation accumulation for 35 combinations of duration (1, 2, 3, 5, 10, 20, and 30 days) and ARI (1, 2, 5, 10, and 20 years). The analysis of this large range of combinations addresses the question of whether the results are sensitive to a perhaps-fortuitous choice of extreme precipitation metric. By examining this large set, we can assess the robustness of the observed trends.
Reanalysis Precipitation
Precipitation extremes at individual stations can have substantial local impacts. We were also interested in examining basin-wide extremes because they potentially can have sizeable effects on Great Lakes water levels. However, the variations in station density, particularly the lack of long-term stations in the northern portions of the basin (Figure 1), limit the suitability of station averages to infer basin-wide extremes. For this reason, we used a reanalysis product, the Modern-Era Retrospective analysis for Research and Applications, Version 2 (MERRA-2; Gelaro et al., 2017), to investigate extreme precipitation events of large areal extent. Meteorological reanalyses use weather forecast models that assimilate observations to provide 3-dimensional fields of the atmospheric state that evolve temporally in a manner that is consistent with physical laws and the observations. Unlike some reanalyses, the MERRA-2 reanalysis assimilates in situ precipitation observations and has been shown to produce superior estimates of precipitation (Bosilovich et al., 2017). The MERRA-2 spatial resolution is 0.5° latitude by 0.625° longitude. Daily values of precipitation accumulations were obtained covering the period 1980–2019. The MERRA-2 grid points within the GLB boundaries were identified (281 grid points), and the data for these grid points were averaged to produce a daily basin-average time series of precipitation. The basin-average mean annual precipitation from this dataset is 1,067 mm. Four-day rolling precipitation totals were calculated (days 1–4, 2–5, 3–6, etc.). The 40 largest non-overlapping events of 4-day duration were identified and used for climatological analysis. The selection of the 40 largest events in a 40-yr record is equivalent to choosing all events exceeding the 1-yr ARI threshold. The duration of 4 days was chosen to be consistent with the results of Kunkel and Champion (2019).
Meteorological Causes
Kunkel et al. (2012) identified station-specific values for the 1-in-5 yr threshold of daily precipitation by first ranking daily precipitation amounts. The 1-in-5 yr threshold was then calculated empirically as the rank N value where N = (number of available years of data)/5. For a station with 100 years of data, this is the rank 20 daily precipitation value. The station thresholds calculated in Kunkel et al. (2012) were used here to identify additional station events for 2010–2020. These additional daily extreme precipitation events were assigned a meteorological cause using manual expert judgment, resulting in a dataset of causes covering the period of 1908–2020. In their study, the categories relevant to the GLB included extratropical cyclones (ETCs), tropical cyclones (TCs), mesoscale convective systems (MCSs), and air mass convection (AMC). The ETC category was subdivided into 2 categories: events near one of the ETC fronts (ETC-FRT) and events not near the fronts (ETC-NFRT).
MCSs are organized areas of thunderstorms that persist for several hours and can produce heavy rainfall and severe weather. They can be classified as internally or externally driven (Schumacher and Rasmussen, 2020). Externally driven MCSs are triggered by another weather feature, such as a front. Internally driven MCSs develop and maintain their character primarily through self-generated features. In the Kunkel et al. (2012) study, extending back to 1908, the necessary data (e.g., satellite cloud cover, radar) to definitively identify MCSs, whether externally- or internally-driven, was not available for the entire period. Therefore, extreme events associated with organized areas of precipitation, which possibly could be classified as MCSs if the necessary data were available, were instead classified by the large-scale trigger, typically a front, in the case of externally-driven MCSs. Extreme events associated with organized areas of precipitation, but with no large-scale weather system trigger, were classified into the MCS category. Thus, our MCS category is restricted to the internally-driven type. It should be noted that we could have identified externally-driven MCSs for the additional 2010–2020 events, but we maintained the same procedures as the original study to maintain temporal consistency in the causes data.
For the 2010–2020 addition to the causes data, the manual expert identification of the cause for each extreme precipitation event at each station was assigned based on several data sources. Weather analyses charts from the NOAA National Weather Service (NWS) National Centers for Environmental Prediction (NCEP) (https://www.ncei.noaa.gov/data/ncep-charts/access/) were used to identify synoptic scale features. A 1° latitude by 1° longitude gridded dataset, described in Kunkel et al. (2012), was used to create daily maps of temperature and precipitation for use in identifying precipitation clusters and temperature gradients. Written material, such as event-related scientific papers, technical notes, news reports, and historical observations from nearby stations, supplemented the information provided by the maps.
Figures 2–5 show examples of two of the maps used in the causes evaluation for 4 different causes: ETC-FRT, ETC-NFRT, MCS, and TC, respectively. The maps display the precipitation distribution and surface weather features on the day of the event. Similar maps for the day before and after the event as well as surface temperature and 500 hPa geopotential height were also generated to illustrate temporal evolution; this aided in the station event cause classification. In the ETC-FRT example for August 28, 2018 (Figure 2), the two extreme precipitation events on that day (one located in Wisconsin and the other in the Michigan Upper Peninsula) are near a front that extends across the western part of the basin. In the ETC-NFRT example for April 30, 2020 (Figure 3), the event is located in northern Michigan, to the north of the ETC center moving across the southern portion of the basin. In the MCS example for July 19, 2020 (Figure 4), the event in eastern Michigan is within a larger area of heavy precipitation; the front to the west is too far from the event to be considered as the trigger. In the TC example for October 30, 2012 (Figure 5), the six events occur along the path of Hurricane Sandy while it was transitioning into an extratropical system; this case illustrates that we categorized events as TCs whether they occurred while the system was tropical or in a post-tropical stage.
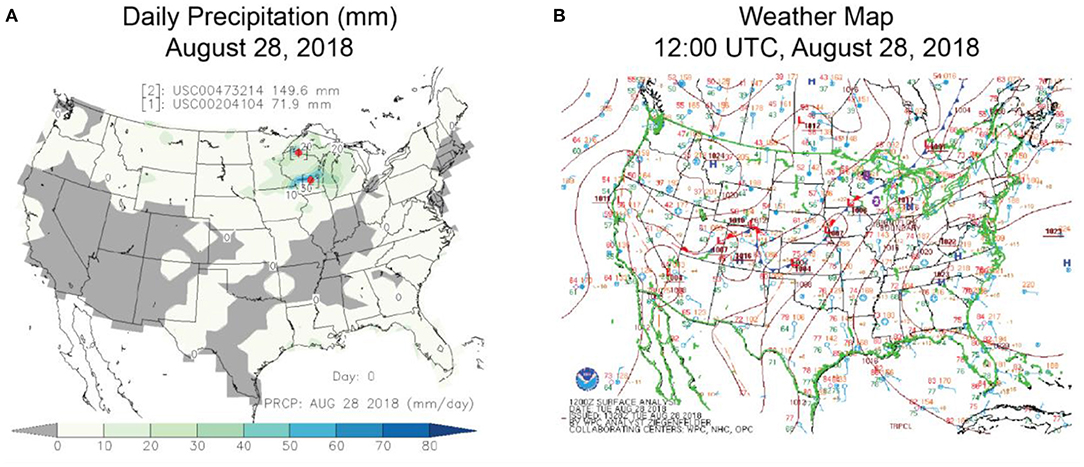
Figure 2. Weather maps including (A) map of daily precipitation (mm) and (B) map of weather features, for a day (August 28, 2018) with two extreme events caused by a front (ETC-FRT). The red dots in (A) and the white-on-purple numbers in (B) indicate the locations of the two events.
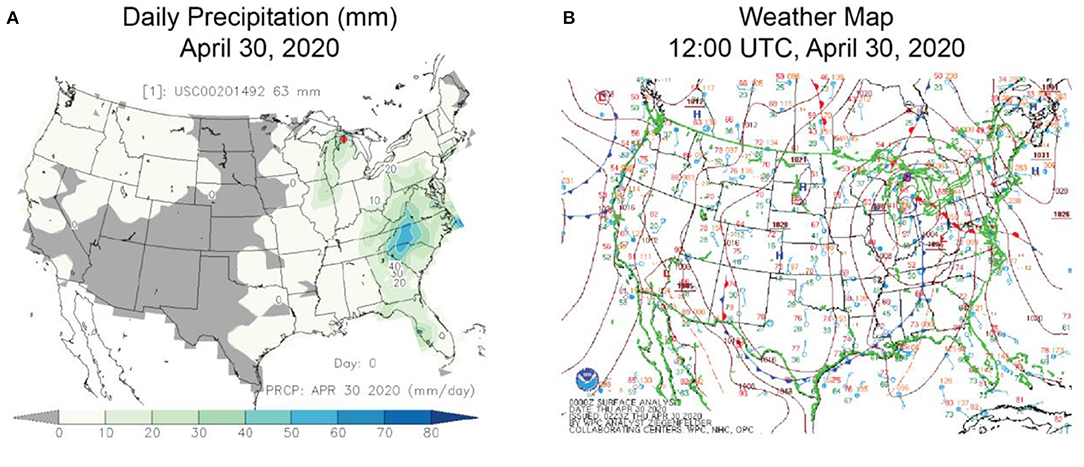
Figure 3. Weather maps including (A) map of daily precipitation (mm) and (B) map of weather features, for a day (April 30, 2020) with one extreme event caused by an extratropical cyclone (ETC-NFRT). The red dot in (A) and the white-on-purple number in (B) indicate the location of the event.
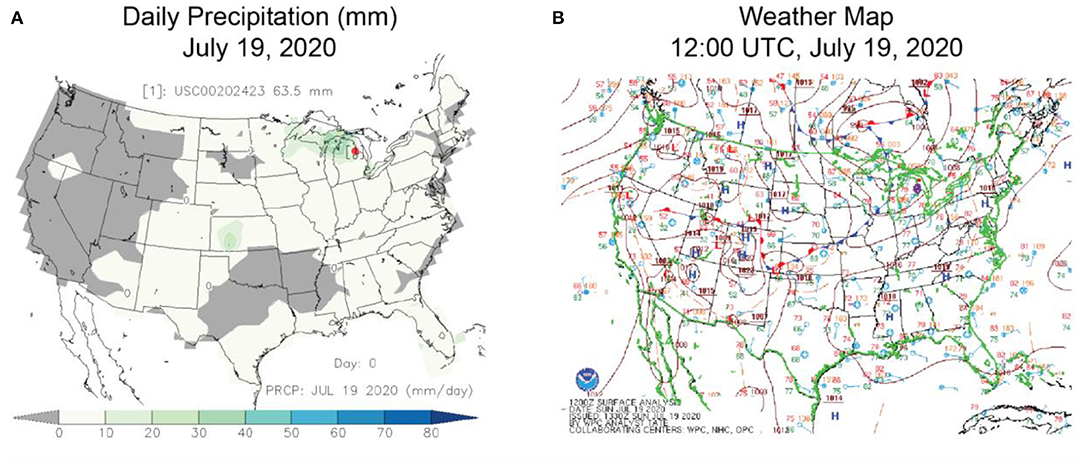
Figure 4. Weather maps including (A) map of daily precipitation (mm) and (B) map of weather features, for a day (July 19, 2020) with one extreme event caused by a mesoscale convective system (MCS). The red dot in (A) and the white-on-purple number in (B) indicate the location of the event.
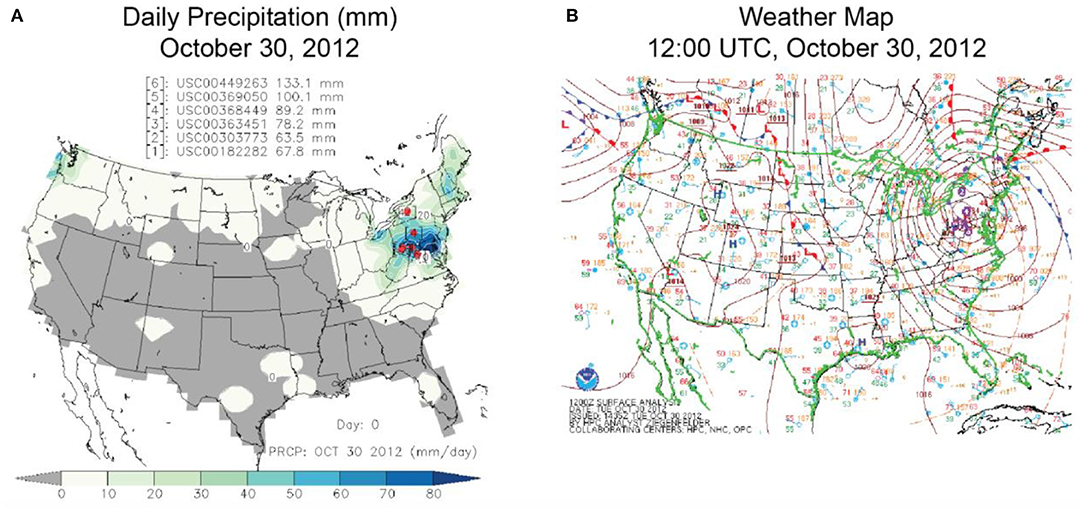
Figure 5. Weather maps including (A) map of daily precipitation (mm) and (B) map of weather features, for a day (October 30, 2012) with 6 extreme events caused by a tropical cyclone (TC; Hurricane Sandy). The red dots in (A) and the white-on-purple numbers in (B) indicate the locations of the 6 events.
The causes of the 40 highest basin-average 4-day total precipitation events were determined following Kunkel and Champion (2019) using a manual expert judgment process similar to that used for evaluating daily extreme events at individual stations but adjusted to account for the evolution of the atmospheric state during these multi-day events and the availability of sources to identify weather features. An initial assessment of the meteorological cause was done by referencing historical surface weather charts from the NOAA Central Library Data Imaging Project (n.d) for the dates and locations of the events. For events suggesting proximity to a named TC, the assignment of TC as the cause was confirmed through further research matching the dates and locations of the precipitation event with the International Best Track Archive for Climate Stewardship set of TC track data (Knapp et al., 2010). As needed to confirm the cause, maps of atmospheric fields (including mean sea level pressure, 500 hPa geopotential height, 2 m temperature, precipitation, 2 m specific humidity, and vertical motion) were produced using the NCEP/National Center for Atmospheric Research (NCAR) reanalysis (Kalnay et al., 1996). The resolution of the reanalysis is 2.5° x 2.5°. Maps of surface weather features, 500 hPa height contours, and 24-hr precipitation were assembled side-by-side for each day of an event. These daily composites were then assembled so that they could be looped to show the daily evolution of patterns. The sequence of these daily patterns was effective in revealing the coincidence of atmospheric features and surface precipitation locations and amounts. Maps of 4-day average and anomalies of selected atmospheric state variables (1,000 hPa temperature, 500 hPa geopotential height, and 500 hPa vertical velocity) were produced to identify persistent features. These maps effectively revealed the upper-level troughs, surface gradients, and large-scale forcing patterns. A common situation was day-to-day variability in the causal mechanisms, particularly between ETC-FRT and ETC-NFRT. In such situations, the amount of precipitation on each day served as a weighting function to decide on the primary mechanism. Three of the co-authors performed the expert judgment. Each of the experts reviewed the work of the others.
Water Vapor and Vertical Velocity Analysis
Following Kunkel et al. (2020b), maximum daily 3-hr values of PW and VV were derived from the NCEP/NCAR reanalysis. For each station used in the 1949–2020 period analysis, each daily 1-yr ARI event was assigned PW and VV values from the NCE/NCAR grid box containing the station. The individual station event values were aggregated into PW and VV bins.
Results
Temporal Trends
Figures 6–8 show the results of our 3 types of trend analyses and illustrate that extreme precipitation exhibits an upward trend by several metrics. For the 1908–2020 long-term set of stations for which causes were analyzed, there is a statistically significant (at the p=0.01 level) upward trend in the number of 1-in-5 yr events over the period 1908–2020 (Figure 6) of 8.8% decade−1. The time series of the annual maximum precipitation value among the extreme events shows a sizable upward trend of about 30% per century (Figure 7). However, the average precipitation per event for all events in a year shows no trend (Figure 7).
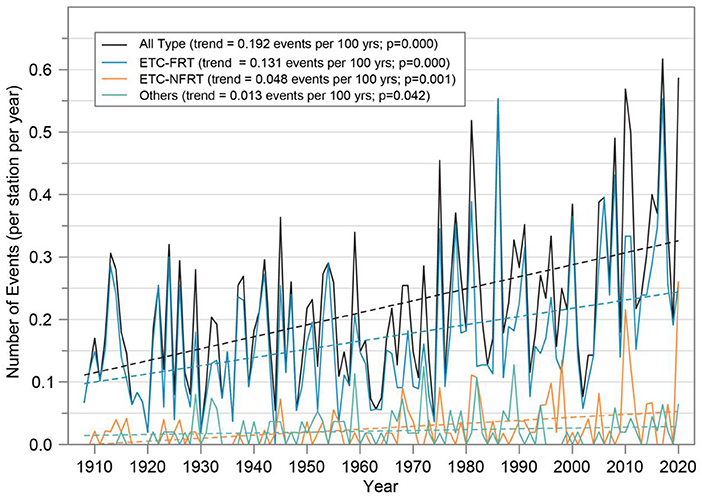
Figure 6. Annual time series of the overall number of extreme events per station (“All Type”; black line), events caused by one of the ETC fronts (“ETC-FRT”; blue), events caused by an ETC not near a front (“ETC-NFRT”; orange), and events caused by all other types (“Others”; green). Dashed lines indicate linear least-squares fits to the annual data. The trend values and p-values of the trend lines are displayed in the legend.
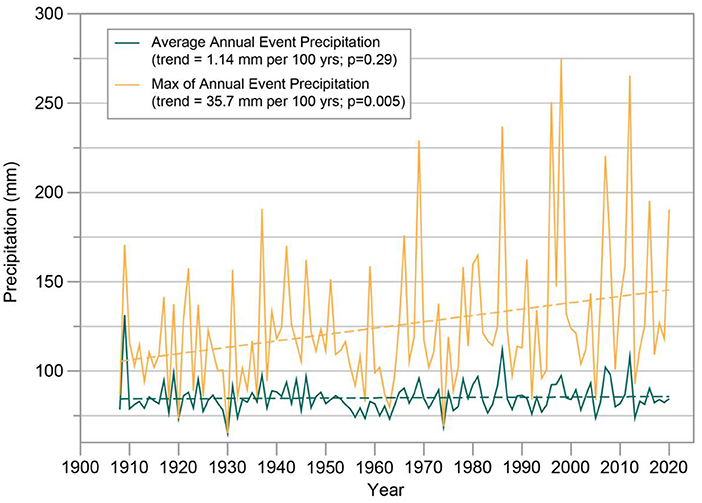
Figure 7. Annual time series (1908–2020) of two metrics of the precipitation amounts for those events exceeding the station-specific thresholds for daily 5-yr ARI events: the average precipitation for the extreme events (“Average Annual Event Precipitation”; teal color) and the single largest precipitation value among the extreme events (“Max of Annual Event Precipitation”; orange color). These time series are based on data from the 57 long-term stations. The trend values and p-values of the trend lines are displayed in the legend.
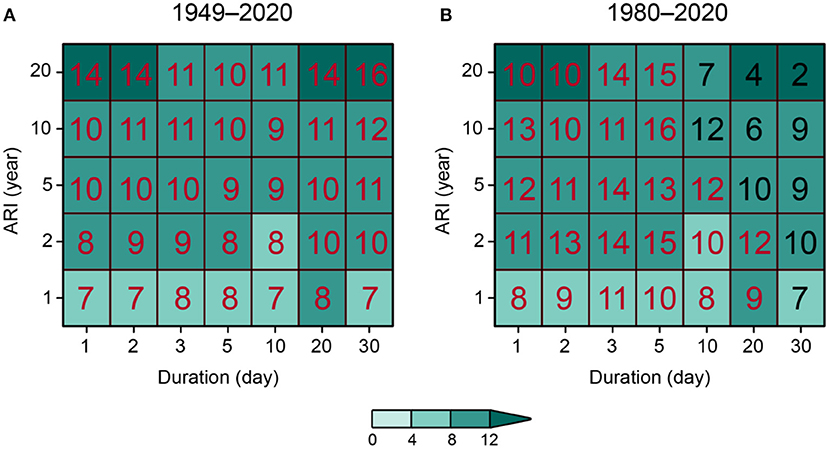
Figure 8. Trends (% decade−1) in the frequency of occurrences for the Great Lakes basin of the 35 duration–ARI combinations for the periods of (A) 1949–2020 and (B) 1980–2020. Statistically significant trends are shown in red. All trends are upward. For the 1949–2020 analysis period, all trends are statistically significant (p = 0.05 significance level for a two-tailed test). For the 1980–2020 period, all trends are statistically significant for the 1, 2, 3, and 5 day durations, but not for the 10, 20, and 30 day durations.
The larger set of stations analyzed over the two shorter periods of 1949–2020 and 1980–2020 show upward trends for all 35 ARI-duration combinations (Figure 8). All trends are statistically significant (p = 0.05) for the 1949–2020 period of analysis (Figure 8A). Higher percentage trends were found for the larger (rarer) ARI values. For the shorter period of 1980–2020, all the trends are statistically significant for 1, 2, 3, and 5 day durations, but not for all of the 10, 20, and 30 day durations (Figure 8B). The temporal distribution of the 40 largest 4-day basin-wide average precipitation totals also shows an upward trend (Figure 9). Almost half (45%) of those events occurred during the most recent decade (2010–2019).
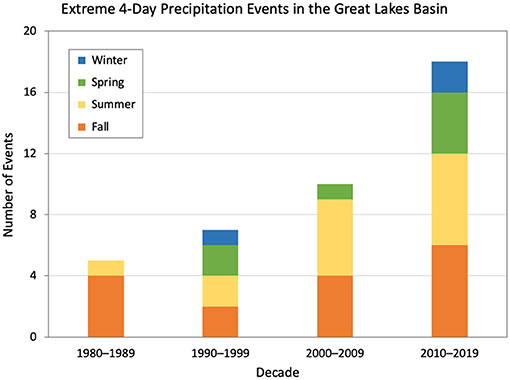
Figure 9. Number of the 40 largest basin-wide 4-day precipitation events by decade from 1980–1989 to 2010–2019 delineated by season. Precipitation is calculated from the MERRA-2 reanalysis and averaged over the Great Lakes Basin.
Meteorological Causes of Station Events
The predominant cause of the station extreme events is ETC-FRT (78%). This is similar to what was found by Kunkel et al. (2012) in regions that include parts of the GLB. The second largest category is ETC-NFRT, causing 12% of the events. Smaller contributions are made by MCSs (6%), TCs (2%), and AMC (1%). There is strong seasonality in the distribution of station extremes (Figure 10). The majority of events occur in the summer (60%), while 25% occur in the fall. Only 2% of events occur in the winter, while 13% occur in the spring. ETC-FRT is the dominant category in all seasons. ETC-NFRT events are the second most common. Events caused by the minor categories of MCS and AMC mostly occur in the summer, while the few events associated with TCs are evenly distributed between summer and fall.
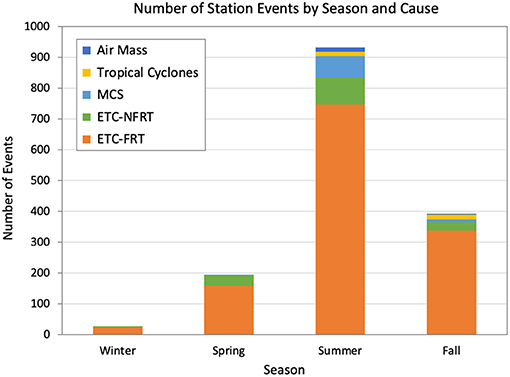
Figure 10. Seasonal distribution of the number of extreme station events categorized by meteorological cause.
There are upward trends in the number of events for the ETC-FRT (0.131 events 100 yr−1 or 7.6% decade−1) and ETC-NFRT (0.048 events 100 yr−1 or 18.5% decade−1) categories (Figure 6). There are also upward trends in the total of MCS and TC categories (“Others”; 0.013 events 100 yr−1 or 5.9% decade−1). All of these trends are statistically significant at the p = 0.05 level.
Meteorological Causes of Extreme Basin-Wide Average Events
Figure 11 shows the distribution over time of the 40 largest 4-day basin-average total precipitation events, along with their meteorological causes. The event with the highest total precipitation occurred on September 10–13, 1986, with 59.2 mm. The seasonal distribution of basin-wide extreme events (Figure 9) indicates nearly equal numbers in the summer and fall (16 and 14, respectively). Seven and three basin-wide extreme events occurred in the spring and winter, respectively. The category of ETC-FRT is the primary meteorological cause for 85% of these events, slightly higher than the 78% for the station events. The primary cause for the remaining 15% is ETC-NFRT. ETC-NFRT is a secondary cause in 10 of the events, and a TC makes a contribution to one of the events. A study by Kunkel and Champion (2019), demonstrated that ETC-FRTs were also the dominant category (59%) of the top 100 events in the coterminous US, however none of those events were located in the Great Lakes basin. Most were located in the Gulf Coast region and along the Pacific Coast. The TC category (25%) and West Coast atmospheric rivers (15%) were the other dominant categories. The TC category contributed to one of the GLB events.
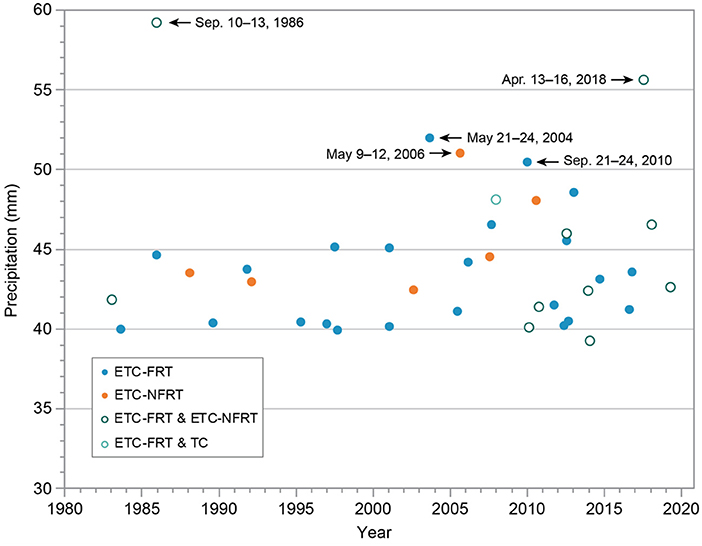
Figure 11. Scatter plot of the 40 largest basin-wide events showing precipitation amounts and year of occurrence. The symbols indicate the meteorological cause(s). The open symbols indicate events with both a primary (ETC-FRT) cause and a secondary cause (either ETC-NFRT or TC). The dates of the 5 largest events are indicated next to the symbols.
Water Vapor and Vertical Velocity Relationships
Figure 12 shows the boxplot statistics of the distribution of event precipitation amounts as a function of PW. At values of PW <30 mm, precipitation amounts vary little and even slightly decrease with PW. For PW >30 mm, precipitation amounts increase with PW consistent with the overall results of Kunkel et al. (2020b). If extreme precipitation amounts scaled with the Clausius-Clapeyron (C-C) relationship, the fractional change in precipitation amounts would be the same as the fractional change in PW. For PW values between 30 and 60 mm, precipitation amounts increase but at a smaller fractional rate than PW. At about 60 mm, the change in precipitation amounts is similar to the fractional change in PW, or close to the C-C relationship. The results for VV (not shown) did not indicate a robust relationship between precipitation amounts and the magnitude of VV, again similar to the results of Kunkel et al. (2020b).
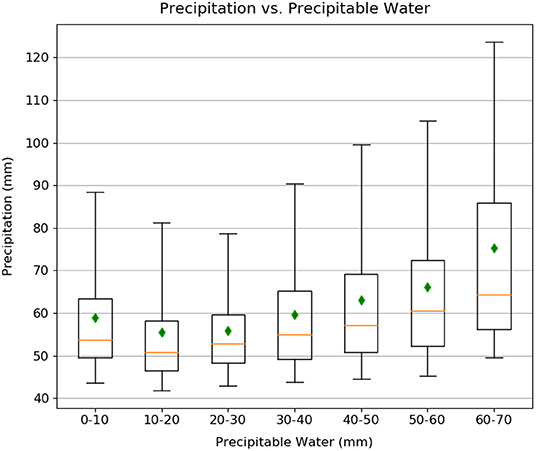
Figure 12. Boxplot distributions for the 1-yr, 1-dy partial duration series events of precipitation event amount vs. the same-day 3-h maximum PW sorted into 10 mm interval bins. Boxplots display mean (green diamonds), median (orange horizontal lines), 25th and 75th percentiles (box limits), and 5th and 95th percentiles (whiskers).
The strong seasonality (summer-fall maximum) in the occurrence of extreme precipitation amounts is explained by the high correlation between water vapor and extreme precipitation amounts. While weather systems are needed to force upward vertical motion, the actual amount of precipitation is determined mainly by available atmospheric water vapor, which is maximized in the warm season.
Discussion
Most regional studies that include the Great Lakes basin have found an upward trend in extreme precipitation. The analysis herein focused solely on stations within the basin, most of them within the US, and found upward trends for most extreme precipitation metrics. An analysis of basin-wide events using precipitation from the MERRA-2 reanalysis identified the 40 largest 4-day precipitation events since 1980. There is a large upward trend in the decadal count of these basin-wide events, with the last decade (2010–2019) accounting for 45% of all events. These results are similar to other studies that analyzed regions which included all or portions of the Great Lakes basin.
Fronts are the dominant cause of extreme precipitation at individual stations. For daily extreme events exceeding the 5-yr ARI, 78% of all events are caused by fronts. For the 40 basin-wide average extreme events, fronts are an even more dominant cause, representing 85% of all events. These results are similar to those of Kunkel et al. (2012). In that study, the defined regions included the U.S. portion of the Great Lakes, but did not focus specifically on the basin. The additional 11 years analyzed in this study indicates a continuation of fronts as the dominant cause.
The water vapor and vertical velocity analysis results are similar to the findings of Kunkel et al. (2020b) in showing a positive correlation between precipitation amounts and PW at PW values above 30 mm, but no correlation between precipitation amounts and vertical velocity. The relationship between precipitation amounts and PW is less than Clausius-Clapeyron for PW values <60 mm. This is the same threshold as found in Kunkel et al. (2020b).
The dominant role of fronts as the cause of extreme events has implications for assessing future changes in extreme precipitation if global warming continues. The identification of meteorological phenomena in global climate model simulations is advancing (Mudigonda et al., 2021). Biard and Kunkel (2019) developed a method using a deep learning neural network to automatically identify fronts in reanalysis fields. A similar approach was used by Lagerquist et al. (2019). Such methods applied to GCM simulations can be used to provide a meteorological basis for potential future changes. Such approaches can provide an alternative to direct use of model-generated precipitation.
Priestley et al. (2020) provide an analysis of GCM simulation of ETCs in the CMIP6 suite of simulations. They find that the simulation of ETCs has improved in CMIP6 relative to CMIP5. Furthermore, higher resolution CMIP6 models show superior performance compared to lower resolution CMIP6 models. Over the Great Lakes, the CMIP6 models exhibit a low bias of 10–20% in the number of ETCs in the winter and a high bias of 10–20% in the summer.
The positive correlation between precipitation amounts of water vapor, equaling the C-C relationship at higher PW amounts, provides a strong foundation for application to the planning and design of structures that have multi-decadal lifetimes. One of the most confident projections of global warming is continued increases in global mean column integrated water vapor and near-surface specific humidity over land (Douville et al., 2021; Lee et al., 2021). Thus, it would be prudent to plan for higher extreme precipitation amounts in the future.
There are a few limitations in this study. Firstly, while the trend analysis of the available station data is robust, there is a low number of Canadian stations with available long-term data in the GHCN-D dataset. Thus, there is uncertainty as to whether upward trends have occurred in the northern portion of the basin. It is not known to us whether there are sources of long-term station data that are not available in GHCN-D.
Secondly, the study was limited to daily and multi-day extreme precipitation amounts. At these time scales, it is not surprising that large-scale meteorological systems are principally responsible for the events. At sub-daily timescales, it is likely that local intense convection arising from mesoscale convective systems and air mass convection would play a more important role in the mix of meteorological systems responsible for precipitation extremes. Simulation of such systems by current generation climate models is challenging (Feng et al., 2021) compared to extratropical cyclones and associated fronts. A recommended future study is to analyze long-term hourly precipitation data and, as in the present study, determine the causes of extreme sub-daily precipitation events.
Data Availability Statement
The raw data supporting the conclusions of this article will be made available by the authors, without undue reservation.
Author Contributions
KK designed the overall research goals and protocols and wrote the first draft of the paper. XY determined the causes of the station extreme events for 2010–2020. LS analyzed the MERRA-2 precipitation data and identified the causes of some of the 40 basin-wide average extreme events. SC developed the procedures for identifying the causes of the basin-wide average extremes and identified the causes of some of those events. LES identified the causes of some of the basin-wide extreme events and performed the water vapor and vertical motion analysis. KJ provided the GIS analysis to identify stations and MERRA-2 gridpoints within the basin. All authors contributed to the writing of the paper.
Funding
This work was supported by NOAA through the Cooperative Institute for Satellite Earth System Studies under Cooperative Agreement NA19NES4320002.
Conflict of Interest
XY was employed by Riverside Technology Inc.
The remaining authors declare that the research was conducted in the absence of any commercial or financial relationships that could be construed as a potential conflict of interest.
Publisher's Note
All claims expressed in this article are solely those of the authors and do not necessarily represent those of their affiliated organizations, or those of the publisher, the editors and the reviewers. Any product that may be evaluated in this article, or claim that may be made by its manufacturer, is not guaranteed or endorsed by the publisher.
References
Agel, L., and Barlow, M. (2020). How well do CMIP6 historical runs match observed Northeast US Precipitation and extreme precipitation-related circulation? J Clim. 33, 9835–9848. doi: 10.1175/JCLI-D-19-1025.1
Barlow, M., Gutowski, W. J. Jr, Gyakum, J. R., Katz, R. W., Lim, Y.-K., Schumacher, R. S., et al. (2019). North American extreme precipitation events and related large-scale meteorological patterns: a review of statistical methods, dynamics, modeling, and trends. Clim. Dyn. 53, 6835–6875. doi: 10.1007/s00382-019-04958-z
Biard, J. C., and Kunkel, K. E. (2019). Automated detection of weather fronts using a deep learning neural network. Adv. Stat. Climatol. Meteorol. Oceanogr. 5, 147–160. doi: 10.5194/ascmo-5-147-2019
Bosilovich, M. G., Robertson, F. R., Takacs, L., Molod, A., and Mocko, D. (2017). Atmospheric water balance and variability in the MERRA-2 reanalysis. Clim. J. 30, 1177–1196. doi: 10.1175/JCLI-D-16-0338.1
Douville, H., Raghavan, K., Renwick, J., Allan, R. P., Arias, P. A., Barlow, M., et al. (2021). “Water cycle changes,” in Climate Change 2021: The Physical Science Basis. Contribution of Working Group I to the Sixth Assessment Report of the Intergovernmental Panel on Climate Change, eds V. Masson-Delmotte, P. Zhai, A. Pirani, S. L. Connors, C. Péan, S. Berger, et al. (Cambridge; New York, NY: Cambridge University Press). 1055–1210.
Easterling, D. R., Kunkel, K. E., Arnold, J. R., Knutson, T., LeGrande, A. N., Leung, L. R., et al. (2017). “Precipitation change in the United States,” in Climate Science Special Report: Fourth National Climate Assessment, Volume, eds I. D. J. Wuebbles, D. W. Fahey, K. A. Hibbard, D. J. Dokken, B. C. Stewart, and T. K. Maycock (Washington, DC: U.S. Global Change Research Program), 207–230. doi: 10.7930/J0H993CC
Emori, S., and Brown, S. J. (2005). Dynamic and thermodynamic changes in mean and extreme precipitation under changed climate. Geophys. Res. Lett. 32, L17706. doi: 10.1029/2005GL023272
Feng Song, Z. F., Sakaguchi, K., and Leung, L. R. (2021). Evaluation of mesoscale convective systems in climate simulations: methodological development and results from MPAS-CAM over the United States. Clim. J. 34, 2611–2633. doi: 10.1175/JCLI-D-20-0136.1
Gelaro, R., McCarty, W., Suárez, M. J., Todling, R., Molod, A., Takacs, L., et al. (2017). The modern-era retrospective analysis for research and applications, version 2 (MERRA-2). Clim. J. 30, 5419–5454. doi: 10.1175/JCLI-D-16-0758.1
Kalnay, E., Kanamitsu, M., Kistler, R., Collins, W., Deaven, D., Gandin, L., et al. (1996). The NCEP/NCAR 40-year reanalysis project. Bull. Amer. Meteor. Soc. 77, 437–472.
Kendon, E. J., Prein, A. F., Senior, C. A., and Stirling, A. (2021). Challenges and outlook for convection-permitting climate modelling. Philos. Trans. R. Soc. A 379. doi: 10.1098/rsta.2019.0547
Knapp, K. R., Applequist, S., Diamond, H. J., Kossin, J. P., Kruk, M., and Schreck, C. (2010). NCDC International Best Track Archive for Climate Stewardship (IBTrACS) Project, Version 3. NOAA National Centers for Environmental Information. Available online at: https://www.ncei.noaa.gov/access/metadata/landing-page/bin/iso?id=gov.noaa.ncdc:C00834 (accessed October 14, 2021).
Kunkel, K. E., and Champion, S. M. (2019). An assessment of rainfall from Hurricanes Harvey and Florence relative to other extremely wet storms in the United States. Geophys. Res. Lett. 46, 13500–13506. doi: 10.1029/2019GL085034
Kunkel, K. E., Easterling, D. R., Kristovich, D. A. R., Gleason, B., Stoecker, L., and Smith, R. (2012). Meteorological causes of the secular variations in observed extreme precipitation events for the conterminous United States. J. Hydrometeor. 13, 1131–1141. doi: 10.1175/JHM-D-11-0108.1
Kunkel, K. E., Karl, T. R., Squires, M. F., Yin, X., Stegall, S. T., and Easterling, D. R. (2020a). Precipitation extremes: trends and relationships with average precipitation and precipitable water in the contiguous United States. J. Appl. Meteor. Climatol. 59, 125–142. doi: 10.1175/JAMC-D-19-0185.1
Kunkel, K. E., Stevens, S. E., Stevens, L. E., and Karl, T. R. (2020b). Observed climatological relationships of extreme daily precipitation events with precipitable water and vertical velocity in the contiguous United States. Geophys. Res. Lett. 47, e2019GL086721. doi: 10.1029/2019GL086721
Lagerquist, R. A., McGovern, D. J., and Gagne, I. I. (2019). Deep learning for spatially explicit prediction of synoptic-scale fronts. Wea. Forecasting 34, 1137–1160. doi: 10.1175/WAF-D-18-0183.1
Lee, J. Y., Marotzke, J., Bala, G., Cao, L., Corti, S., Dunne, J. P., et al. (2021). “Future global climate: scenario-based projections and near-term information,” in Climate Change 2021: The Physical Science Basis. Contribution of Working Group I to the Sixth Assessment Report of the Intergovernmental Panel on Climate Change, eds V. Masson-Delmotte, P. Zhai, A. Pirani, S. L. Connors, C. Péan, S. Berger, et al. (Cambridge; New York, NY: Cambridge University Press). 553–672.
Menne, M. J., Durre, I., Vose, R. S., Gleason, B. E., and Houston, T. G. (2012). An overview of the Global Historical Climatology Network-Daily database. J. Atmos. Oceanic Technol. 29, 897–910. doi: 10.1175/JTECH-D-11-00103.1
Mudigonda, M., Ram, P., Kashinath, K., Racah, E., Mahesh, A., Liu, Y., et al. (2021). “Deep learning for detecting extreme weather patterns,” in Chapter 12, Within Deep Learning for the Earth Sciences: A Comprehensive Approach to Remote Sensing, Climate Science and Geosciences, G. Camps-Valls, D. Tuia, X. X. Zhu, M. Reichstein (Hoboken, NJ: Wiley), 163–185. doi: 10.1002/9781119646181.ch12
Nie, J., Sibel, A. H., Shaevitz, D. A., and Wang, S. (2018). Dynamic amplification of extreme precipitation sensitivity. Proc. Natl. Acad. Sci. U. S. A. 115, 9467–9472. doi: 10.1073/pnas.0.1800357115
NOAA Central Library Data Imaging Project. (n.d). U. S. Daily Weather Maps. Available online at: https://library.noaa.gov/Collections/Digital-Collections/US-Daily-Weather-Maps (accessed August 22, 2021).
Prein, A. F., Rasmussen, R. M., Ikeda, K., Liu, C., Clark, M. P., and Holland, G. J. (2017). The future intensification of hourly precipitation extremes. Nat. Clim. Change 7, 48–52. doi: 10.1038/nclimate3168
Priestley, M. D. K., Ackerley, D., Catto, J. L., Hodges, K. I., McDonald, R. E., and Lee, R. W. (2020). An overview of the extratropical storm tracks in CMIP6 historical simulations. Clim. J. 33, 6315–6343. doi: 10.1175/JCLI-D-19-0928.1
Roderick, T. P., Wasko, C., and Sharma, A. (2020). An improved covariate for projecting future rainfall extremes? Water Resour. Res. 56, e2019WR026924. doi: 10.1029/2019WR026924
Schumacher, R. S., and Rasmussen, K. L. (2020). The formation, character and changing nature of mesoscale convective systems. Nat. Rev. Earth Environ. 1, 300–314. doi: 10.1038/s43017-020-0057-7
Seneviratne, S. I., Zhang, X., Adnan, M., Badi, W., Dereczynski, C., Di Luca, A., et al. (2021). “Weather and climate extreme events in a changing climate,” in Climate Change 2021: The Physical Science Basis. Contribution of Working Group I to the Sixth Assessment Report of the Intergovernmental Panel on Climate Change, eds V. Masson-Delmotte, P. Zhai, A. Pirani, S. L. Connors, C. Péan, S. Berger, et al. (Cambridge; New York, NY: Cambridge University Press). 1513–1766.
Trenberth, K. E., Dai, A., Rasmussen, R. M., and Parsons, D. B. (2003). The changing character of precipitation. Bull. Am. Meteor. Soc. 84, 1205–1217. doi: 10.1175/BAMS-84-9-1205
Vincent, L. A., Zhang, X., Mekis, É., Wan, H., and Bush, E. J. (2018). Changes in Canada's climate: trends in indices based on daily temperature and precipitation data. Atmos. Ocean 56, 332–349. doi: 10.1080/07055900.2018.1514579
Wuebbles, D., Cardinale, B., Cherkauer, K., Davidson-Arnott, R., Hellmann, J., Infante, D., et al (2019). An Assessment of the Impacts of Climate Change on the Great Lakes. Chicago, IL: Environmental Law and Policy Center, 74. Availalble online at: https://elpc.org/wp-content/uploads/2020/04/2019-ELPCPublication-Great-Lakes-Climate-Change-Report.pdf (accessed January 25, 2022).
Keywords: Great Lakes (North America), extreme precipitation, weather fronts, meteorology, trends
Citation: Kunkel KE, Yin X, Sun L, Champion SM, Stevens LE and Johnson KM (2022) Extreme Precipitation Trends and Meteorological Causes Over the Laurentian Great Lakes. Front. Water 4:804799. doi: 10.3389/frwa.2022.804799
Received: 29 October 2021; Accepted: 28 April 2022;
Published: 23 May 2022.
Edited by:
Adam Burnett, Colgate University, United StatesReviewed by:
Munir Ahmad Nayak, Indian Institute of Technology Indore, IndiaHuanping Huang, Berkeley Lab (DOE), United States
Timothy Hawkins, Shippensburg University, United States
Copyright © 2022 Kunkel, Yin, Sun, Champion, Stevens and Johnson. This is an open-access article distributed under the terms of the Creative Commons Attribution License (CC BY). The use, distribution or reproduction in other forums is permitted, provided the original author(s) and the copyright owner(s) are credited and that the original publication in this journal is cited, in accordance with accepted academic practice. No use, distribution or reproduction is permitted which does not comply with these terms.
*Correspondence: Kenneth E. Kunkel, a2VrdW5rZWxAbmNzdS5lZHU=
†Present address: Xungang Yin, NOAA National Centers for Environmental Information, Asheville, NC, United States