
94% of researchers rate our articles as excellent or good
Learn more about the work of our research integrity team to safeguard the quality of each article we publish.
Find out more
ORIGINAL RESEARCH article
Front. Water, 11 March 2022
Sec. Environmental Water Quality
Volume 4 - 2022 | https://doi.org/10.3389/frwa.2022.737920
This article is part of the Research TopicThe UN International Day of Forests 2022: Forests and WaterView all 4 articles
 Kasey E. Clark1*†
 Viviana D. Bravo1
 Sarah N. Giddings2
 Kristen A. Davis3,4
 Geno Pawlak2,5
 Mark A. Torres6
 Anne E. Adelson2
 Carolina I. César-Ávila1
 Ximena Boza1
 Rachel Collin1
Land use and land cover (LULC) can significantly alter river water, which can in turn have important impacts on downstream coastal ecosystems by delivering nutrients that promote marine eutrophication and hypoxia. Well-documented in temperate systems, less is known about the way land cover relates to water quality in low-lying coastal zones in the tropics. Here we evaluate the catchment LULC and the physical and chemical characteristics of six rivers that contribute flow into a seasonally hypoxic tropical bay in Bocas del Toro, Panama. From July 2019 to March 2020, we routinely surveyed eight physical and chemical characteristics (temperature, specific conductivity, salinity, pH, dissolved oxygen (DO), nitrate and nitrite, ammonium, and phosphate). Our goals were to determine how these physical and chemical characteristics of the rivers reflect the LULC, to compare the water quality of the focal rivers to rivers across Panama, and to discuss the potential impacts of river discharge in the Bay. Overall, we found that the six focal rivers have significantly different river water characteristics that can be linked to catchment LULC and that water quality of rivers 10 s of kilometers apart could differ drastically. Two focal catchments dominated by pristine peat swamp vegetation in San San Pond Sak, showed characteristics typical of blackwater rivers, with low pH, dissolved oxygen, and nutrients. The remaining four catchments were largely mountainous with >50% forest cover. In these rivers, variation in nutrient concentrations were associated with percent urbanization. Comparisons across Panamanian rivers covered in a national survey to our focal rivers shows that saltwater intrusions and low DO of coastal swamp rivers may result in their classification by a standardized water quality index as having slightly contaminated water quality, despite this being their natural state. Examination of deforestation over the last 20 years, show that changes were <10% in the focal catchments, were larger in the small mountainous catchments and suggest that in the past 20 years the physical and chemical characteristics of river water that contributes to Almirante Bay may have shifted slightly in response to these moderate land use changes. (See supplementary information for Spanish-language abstract).
Global environmental change, such as anthropogenic and climate changes, impact river water quality and biogeochemical cycles (Carpenter et al., 1992; Schlesinger et al., 2006; Stevenson and Sabater, 2010; Muehlbauer et al., 2020). Changes in tropical climates and ecologies may differ from changes experienced in non-tropical regions (Vitousek, 1994; Keys and McConnell, 2005; Intergovernmental Panel on Climate Change, 2014). The humid tropics cover 1/5 of the global land surface and rivers in this region generate the greatest fraction of global runoff (Fekete et al., 2002). Despite this, however, most of our understanding of rivers comes from research carried out in temperate regions (Turner and Rabalais, 1991; Rosgen, 1994; Smith et al., 1997; Brogna et al., 2017).
Oligotrophic tropical waters support some of the most diverse and productive marine ecosystems such as coral reefs and seagrass meadows. Oligotrophic ecosystems thrive under low nutrient and low turbidity conditions, which promote benthic diversity, complex food webs, environmental stability, and ecosystem spatial heterogeneity (Hallock, 1988). These ecosystems, however, are under threat from global environmental change (Waycott et al., 2009; Poloczanska et al., 2013; Chollett et al., 2017; Sippo et al., 2018), and oligotrophic systems are particularly threatened by nutrient-laden runoff. Under normal conditions, rivers are an important source of vital elements to these marine biogeochemical cycles (Eyre, 1994; Poulton and Raiswell, 2002; Morel and Price, 2003; Bruland and Lohan, 2006; Howarth et al., 2011; Fernandes et al., 2018). However, excessive inputs of nutrients from terrestrial erosion, and agricultural and urban runoff can cause ecosystem degradation, including eutrophication and hypoxia in downstream estuaries and coastal zones (Smith, 2006; Rabalais et al., 2009; Garnier et al., 2010; Alves et al., 2013; Silva et al., 2013; Salas et al., 2015; Bailey et al., 2020).
River water quality is related to the catchment land use and land cover (LULC) (Ngoye and Machiwa, 2004; Slaughter and Mantel, 2013; Kebede et al., 2014; Gallo et al., 2015; de Oliveira et al., 2016; Dumago et al., 2018; Łaszewski et al., 2021). The impacts of LULC change on river water quality are enhanced in the tropics due to biotic factors, such as higher biomass, and more productive tropical forests (Saatchi et al., 2011; Malhi, 2012); a abiotic factors, such as higher precipitation, intense and frequent flooding, and warmer temperatures (Stallard and Murphy, 2012); and anthropogenic factors such as rapidly expanding agricultural practices and population growth which can lead to different water quality responses in tropical rivers compared to temperate rivers (Laurance et al., 2014; Tanaka et al., 2021). LULC changes in the tropics are driven by logging, pasture/ranching, urbanization, agriculture, and burning of vegetation (Tanaka et al., 2021). Generally, LULC change in the tropics increases nitrates, phosphates (), ammonium (), electrical conductivity (including Na+, Mg2+, Cl−, K+, Ca2+), chlorophyll-a and suspended solids/turbidity and decreases dissolved oxygen (DO) in downstream rivers and estuaries (Deegan et al., 2011; Riskin et al., 2017; Santos and De Paula, 2019; Tanaka et al., 2021). In some situations, opposite trends have been found. For example river nitrate concentrations were found to decrease in Panama and Brazil where primary forest was converted to pasture (Deegan et al., 2011; Valiela et al., 2013, 2014). In contrast, some river water characteristics such as pH do not show a consistent trend with LULC change (Ling et al., 2016; Ríos-Villamizar et al., 2017; Santos and De Paula, 2019; Tanaka et al., 2021), and underlying geology may be a more important factor in these cases (Young et al., 2005).
Here we describe river water physical and chemical characteristics, including nutrient concentrations of six focal rivers that provide freshwater inputs to Almirante Bay on the Caribbean coast of Bocas del Toro, Panama. This semi-enclosed bay experiences well-documented periodic hypoxia associated with warming that has negatively impacted the local marine life (Altieri et al., 2017; Lucey N. et al., 2020; Lucey N. M. et al., 2020; Weinstock and Collin, 2021). Recent analyses have demonstrated that stratification and temperature inversions associated with hypoxia in Almirante Bay (Neal et al., 2014) are likely driven by physical processes (Adelson et al., in review). However, it is not yet known if or how nutrient inputs might contribute to hypoxia in the Bay. As a step toward understanding how land cover and riverine inputs impact Almirante Bay, we addressed the following questions: (1) How temporally and spatially variable are the physical and chemical (temperature, specific conductivity, salinity, pH, DO, nitrate and nitrites as total oxidized nitrogen (TON), ammonium, and phosphate) characteristics of six focal rivers that contribute to Almirante Bay? (2) How does LULC influence the physical and chemical properties of the focal rivers? (3) How do the focal rivers compare to rivers across Panama?
Within the Almirante Bay catchment, there are many small catchments that drain into the Bay, with a combined area of 445 km2 (Figure 1). The mountainous terrain to the south of the Bay is mostly secondary forest, with some pasture and scrub/bushes (Figure 2). The low-lying coastal areas are swampy, and an expanse of peat swamp forest lies to the northwest. The peat swamp forest is in a national protected area, San San Pond Sak, an internationally recognized Ramsar wetland (Tejada, 1993; Ramsar, 2020). Ramsar wetlands are wetlands of international importance especially as waterfowl habitat (Ramsar, 2016). Within the Almirante Bay catchment there are three towns, Almirante located on the coast of the mainland in the back of the bay, Bocas del Toro located on Colon Island, and Old Bank, located on Bastimentos Island (Figure 1). We monitored six focal rivers that drain into or near Almirante Bay that were accessible by road or boat, and which span a range of catchment areas and vegetation types (Figures 1, 2). Monitoring sites were selected in each of these rivers in July 2019 (Figure 1). Measurements were taken at the focal rivers every 2 weeks over 9 months from July 2019 to March 2020. Sampling ended abruptly at the end of March, 2020 due to the COVID-19 pandemic (see Supplementary Table 1). The river monitoring took place over 2 days; the small mountainous rivers were measured on land 1 day, and the coastal rivers were measured by boat the subsequent day. Some additional sampling took place at the start of the field campaign in July 2019, and in November 2019 to capture storm flow (see Supplementary Table 1). Based on geomorphological and vegetation differences, we divided the focal river catchments into three general river types. They are as follows: two swamp rivers (Black and Changuinola Canal); one large mountainous river (the Changuinola River); and three small mountainous rivers (Nigua, Oeste, and Pastores Rivers).
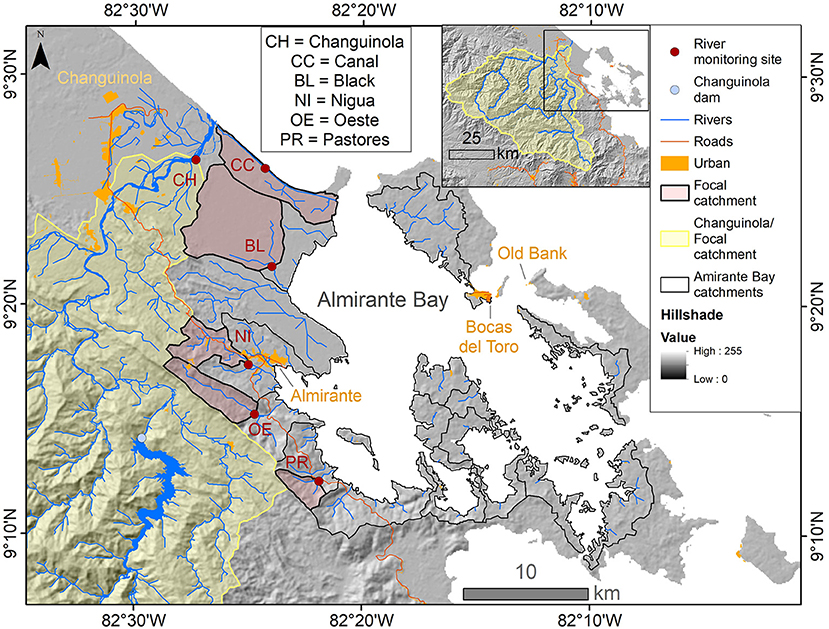
Figure 1. Almirante Bay and the Bocas del Toro region of Panama. The monitored focal catchments that flow directly into Almirante Bay are outlined in black with red fill and the monitored focal catchment Changuinola flows into the ocean is outlined and filled with yellow. The locations of the river monitoring sites are indicated by filled circles. Other elements of importance are urban areas (Ministerio de Ambiente, 2012), primary roads modified from STRI GIS Laboratory (2011), and the Changuinola Dam. The basemap is hillshade derived from SRTM DEM (CGIAR and NASA, 2019). The inset shows the extent of the Changuinola catchment and the location of the enlarged area is delineated by the black box.
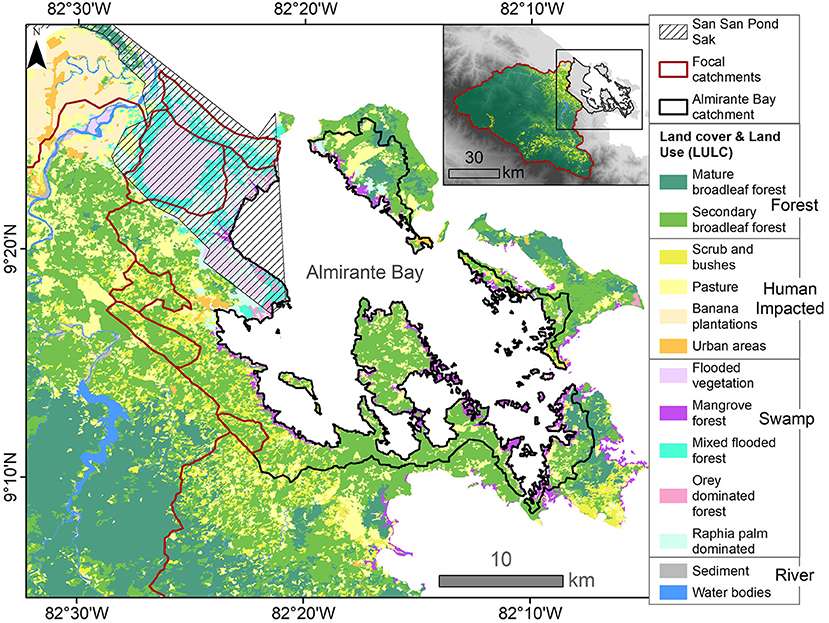
Figure 2. Land use and land cover (LULC) for the Almirante Bay and Bocas del Toro region, modified from Ministerio de Ambiente (2012) and Sjögersten et al. (2020). The focal catchments are outlined in dark red, and the San San Pond Sak Ramsar wetland and national protected area (Ramsar, 2020) is represented by thatched gray lines (Tejada, 1993). The inset shows the LULC of the Changuinola catchment, the extent of the Almirante Bay catchment, and location of the enlarged area which is delineated by the black box.
The Changuinola River is the third largest river in Panama (subsequently referred to as Changuinola) (Comité de Alto Nivel de Seguridad Hídrica, 2016). The catchment boundary runs along the Continental Divide, and stretches into Costa Rica to the west (Figure 1 inset). The river discharges into the open coast of the Caribbean Sea, northwest of Almirante Bay (Figure 1). Under certain conditions, river discharge moves southeast along the shore and enters the bay. The catchment has an area of 3,124 km2 and a mean elevation of 1,283 m above sea level (masl) (see Supplementary Table 2). The mountainous portions are mostly mature forest (Figure 2). In the lower reaches and in the floodplain, there is pasture, banana plantations, and the town of Changuinola (Figure 2). There is a large hydroelectric dam in the mountains 46 km upstream draining ~45% of the Changuinola catchment, with a reservoir that extends 15 km upstream (Figure 1). The dam was finished in 2011, it appears to moderate the river flow, generally reducing high and low discharges (ANAM, 2009, 2013). The Changuinola monitoring site was located in the floodplain, ~3 km from the river mouth. The site is influenced by the tide and is located near sea level. The river is wide, shallow, and fast flowing; thus, the river was sampled from an anchored boat (Figure 3a).
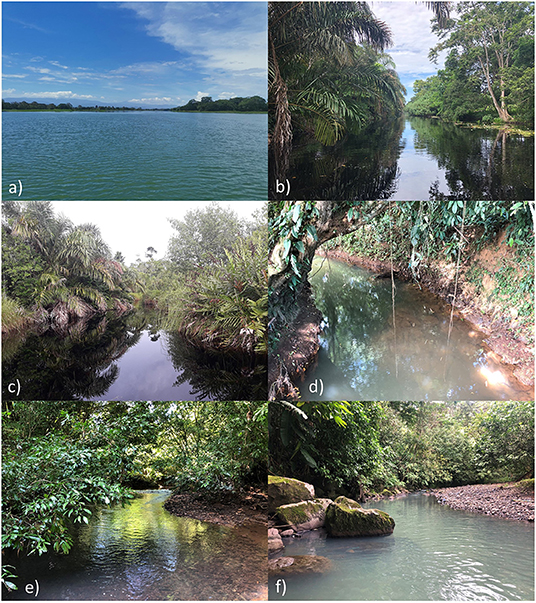
Figure 3. Focal river monitoring sites at baseflow facing upstream at (a) Changuinola River, (b) Changuinola Canal, (c) Black River, (d) Nigua River, (e) Oeste River, and (f) Pastores River. Photos taken by: V. Bravo (a,c), X. Boza (b,d,f), and C. César-Ávila (e).
In 1903 the Changuinola Canal (subsequently referred to as the Canal to avoid confusion with the Changuinola) was trenched parallel to the coast on the outer region of San San Pond Sak wetland to move bananas from the Changuinola plantations to Almirante Bay for export (Cramer, 2013). The monitoring site was near sea-level and located roughly halfway from either end of the canal (Figure 1; see Supplementary Table 2). The Canal catchment is dominated by swamp vegetation, with raphia palm and mixed flooded forest (Sjögersten et al., 2020) and is part of the San San Pond Sak wetland (Figure 2). We observed that the flow direction of the canal was variable and likely influenced by the tides, wind direction, and discharge from the Changuinola. Although the bulk of the Changuinola discharges into the ocean, some river water enters the Canal in the Changuinola floodplain (Figure 1). As such, the true contribution area is unknown, but the Canal has a minimum contribution area of 21.8 km2 (see Supplementary Table 2). To maintain position while sampling the river water, a rope was tied taut across the river, the motor was turned off, and the boat was kept in place using the rope (Figure 3b).
The “black” river appears to be unnamed on maps, but for ease of communication we refer to it as the Black River due to its dark color (subsequently referred to as Black). This river is distinct from the nearby Rio Negro, located west of the Changuinola floodplain (ANAM, 2013). The river monitoring site was near sea-level, 2.5 km from the river mouth and has a contributing area of ~46 km2 (see Supplementary Table 2). The Black catchment is part of San San Pond Sak wetland and drains into Almirante Bay (Figure 2). It has peat deposits up to 8 m thick and 4,000 years old (Phillips et al., 1997). The majority of this catchment is swampy, with flooded vegetation (stunted forest and sawgrass bog plain), mixed flooded forest, and raphia palm swamp (Troxler et al., 2012; Sjögersten et al., 2020). While most of this catchment is pristine, a small portion to the south west outside of the protected area has been converted to pasture (Figure 2). Despite our efforts to select a sampling site beyond estuarine influence, we found that during the dry season a saltwater wedge reached the site. Under non-storm conditions, the river velocity was very slow and often followed the ebb and flow of the tides (pers. obs.). The river was sampled following the same method used in the Canal (Figure 3c).
The Nigua River monitoring site was situated at ~25 masl, 2.2 km from the mouth, with a catchment contribution area of 13.4 km2 and a mean elevation of 128 masl (see Supplementary Table 2). The monitoring site was located under a small bridge accessible by a dirt road (Figure 3d). Most of the catchment land cover is secondary forest, with some scrub/bushes and pasture (Ministerio de Ambiente, 2012) (Figure 2). The monitoring site was upstream of the town of Almirante, with a population of 14,000 (Comité de Alto Nivel de Seguridad Hídrica, 2016), with most of the town located in the low-lying areas (Figure 1). There is a paved road in the catchment that runs alongside the river (Figure 1). There is a drinking water treatment facility with a processing capacity of 7,000 m3 d−1 (Comité de Alto Nivel de Seguridad Hídrica, 2016), ~600 m upstream of the river monitoring site.
The Oeste River monitoring site was situated at ~45 masl, 3.2 km from the mouth, has a contribution area of 14.7 km2 and mean elevation of 260 masl (Supplementary Table 2). The land cover in this small mountainous catchment is dominated by secondary forest (Figure 2). The river monitoring site was located under a tall bridge and was accessible by truck. River monitoring was carried out in the river at low flow and from the bridge at high flow (Figure 3e).
The Pastores River monitoring site was situated at ~35 masl and is ~1.6 km from the mouth (Supplementary Table 2). It is the smallest study catchment, with a contribution area of 6.3 km2 and a mean elevation of 248 masl (see Supplementary Table 2). The Pastores catchment land cover is dominated by secondary forest and scrub/bushes (Figure 2). There are mangrove forests along the coast (Figure 2). The river monitoring site was located near the intersection of the coastal road (Figure 1). River monitoring was carried out in the river on foot at low to medium flow, and from one riverbank at high flow (Figure 3f).
We took measurements at 50% of the river depth, in the middle of the river using a YSI Professional Pro Plus Multiparameter Instrument, to measure the following: temperature (°C); specific conductivity (mS/cm); salinity (ppt); pH; and dissolved oxygen (DO) (mg/L). Specific conductivity is often reported in published descriptions of river water (where salinity is not generally reported), and we report it here to aid comparisons with other studies. The YSI was calibrated following the protocols outlined in the manual (YSI Inc., 2009). The conductivity/temperature sensor (YSI 5560 Conductivity, Temperature Probe) was calibrated every 2 weeks for freshwater (YSI 3161 Conductivity Calibrator Solution, 1,000 μS/cm). The pH sensor (Model 1001 pH sensor for ProSeries) was calibrated once every 2 weeks with a neutral buffer (LabChem, buffer solution pH 7.0) and with a basic buffer (LabChem, buffer solution pH 10.0). Once a month the DO sensor (Model 2002 Galvanic DO Sensor, Pro Series) was cleaned to remove moisture and to replace the membrane (YSI 5913 membrane kit 1.25 mil polyethylene) and electrolyte solution (YSI Galvanic Oxygen Sensor, NaCl Electrolyte). The instrument was turned on at least 10 min prior to field measurements to ensure that the DO sensor was acclimatized. The YSI sensor was fixed to a 3 m pole or to a weighted rope and lowered into the water to take the measurement at the appropriate depth.
We monitored phosphates, ammonium, and nitrate + nitrite (total oxidized nitrogen; TON) concentrations. River water was collected at deeper sites with a van Dorn bottle at 50% depth along the vertical profile from the middle of the river (see Supplementary Table 1). A manual grab sample using a 500 ml collection bottle (Nalgene, HDPE) was collected at the shallower sites (<25 cm deep) (see Supplementary Table 1). In the preliminary month of the study, water samples were collected in the field, filtered in the laboratory with GF/F glass fiber membranes (25 mm, 0.7 μm, Whatman, Sigma-Aldrich; see Supplementary Table 1), stored in 60 ml Nalgene bottles, and kept frozen until analysis. For the remainder of the study, river water was syringe filtered in the field directly after collection, with a 0.45 or 0.22 μm (25 mm, Sterlitech) polyethersulfone (PES) membrane filter (see Supplementary Table 1). A new sterile 60 mL syringe (Henke Sass Wolk, silicone oil free) was rinsed three times with the sample. The syringe was filled with sample, the filter was attached and expressed with ~2 ml of the sample to rinse the syringe. Multiple filters were used for samples with high suspended load, where each new filter was rinsed before use. A 50 mL sample vial (Corning, polypropylene centrifuge tube) was rinsed out three times using approximately 3 ml of filtrate per rinse. The sample vial was filled two thirds with filtrate and stored on ice, transferred to a freezer, and stored frozen until analysis.
TON and ammonium were determined through flow injection analysis (FIA) on a Lachat Quikchem 8500 system (Hach Ltd, Loveland, CO) (White, 2003; Tucker, 2007, 2008) in the soils laboratory at Smithsonian Tropical Research Institute (STRI), Panama City, Panama. Glassware and Lachat tubes were cleaned, and acid washed with 10% HCl, rinsed twice with a small amount of defrosted sample which was discarded before adding 10 ml of sample to the tube. The detection limit for TON ranged from 0.005 to 0.01 mg N/L. When TON or ammonium river samples fell below the detection limit, we assigned the sample half of the value of the detection limit for statistical analysis. Filtered laboratory water samples from the Bocas station were run alongside the river samples as controls. The filtered laboratory water samples all had results below the detection threshold.
Orthophosphates () were determined through FIA, as described above until October 2019 (see Supplementary Table 1). The detection limit was 0.002 mg P/L, and none of the river samples fell below this limit. Because this approach can be subject to salt error or silicon interference (Murphy and Riley, 1962; Patey et al., 2008; Stetson et al., 2019), we changed from FIA to spectrophotometry when we observed occasional evidence of salt water interference in the brackish river water samples. Thus, from mid-October 2019 onwards phosphates were determined using a molybdenum blue method with absorbance measured on a spectrometer (Hach, DR 5000 Spectrophotometer) (Murphy and Riley, 1962) (see Supplementary Table 1) with a 5 cm quartz cell that was rinsed with sample before use. None of the river samples fell below the detection limit for phosphates, 0.0005 mg P/L. Some of the filtered laboratory water samples run alongside the river samples had values above the detection limit ranging from 0.003 to 0.008 mg P/L, an order of magnitude below the values recorded for the river water samples.
Statistical analyses were carried out on river samples that had been characterized for all eight physical and chemical parameters (see Supplementary Table 1). One-way ANOVAs were applied to each variable independently to determine if the temperature, salinity, conductivity, pH, DO, , TON, and differed significantly among the rivers. When the models were significant, post-hoc Tukey tests were applied to determine which rivers differed significantly from the others. Salinity and conductivity had highly skewed distributions and were therefore log-transformed prior to analysis so they would conform to the assumptions on parametric analyses. All statistical analyses were conducted in JMP 15.0.0.
To determine if temporal changes in water parameters were similar across the different catchments, we calculated the pairwise correlation between each pair of rivers for each variable for each of the fortnightly measurements. There were between 9 and 19 measurements per site that were used in the statistical analysis (see Supplementary Table 1). This approach is not corrected for potential temporal autocorrelation, as we had too few measurements to conduct time series analysis. We applied a Bonferroni correction to insure there was a multiple comparison correction of the p-values. In addition, preliminary data from rainfall gauges and preliminary continuous river level data indicated that, apart from the Changuinola, the flushing time from storm events was <2 weeks. This suggests that our fortnightly sampling rate should result in independent samples. Conductivity measurements were analyzed with non-parametric correlation coefficients due to the un-correctable skewed distribution of values resulting from saltwater intrusion during a few sampling days.
To determine if water from the six focal rivers can be distinguished statistically from each other based on the physical and chemical parameters, we applied a discriminant analysis (DA) using the quadratic difference covariance option in JMP, as some of our data failed to meet the homoscedasticity assumptions (Büyüköztürk and Çokluk-Bökeoglu, 2008). DA is a multivariate approach used to determine what linear combinations of variables most effectively sort observations into predefined groups (i.e., rivers). As we had numerous measurements of only six rivers, this approach focuses on the factors that explain the differences between the rivers (Lachenbruch and Goldstein, 1979). We also conducted a principal component analysis (PCA) to describe the overall patterns of correlation in physical and chemical parameters observed across the entire dataset, and used a PCA conducted on river means to compare with LULC (see below). Analyses were conducted on data from site-week combinations that had no missing data. This had the effect of eliminating the sampling dates where we detected particularly brackish or marine water at the Black site (see Supplementary Table 1).
In ArcMap (v 10.8) the hydrology toolset was used to delineate the catchment boundaries and the rivers in the study area (ESRI, 2016) based on the Shuttle Radar Topography Mission (SRTM) Digital Elevation Model (DEM) (CGIAR and NASA, 2019). The catchment boundaries were determined automatically using the following functions: Fill, Flow Direction, Flow Accumulation, and Basin. Then, the basins were converted from raster to polygons (ESRI, 2016). The Almirante Bay catchment (ABC) contained 1,278 polygons that were manually merged using the editing tool to 14 (Figure 1). The bulk of these automatically generated catchment polygons were very small and/or lined the waterfront. We merged the polygons using the editing feature grouping sub-catchments together based on similar outflow locations into Almirante Bay (Figure 1). Finally, the six focal catchment polygons were exported from the dataset and manually edited based on topography to include only the contribution area of the river monitoring sites (Figure 1).
Rivers were determined automatically from the Flow Direction output following a standard protocol (ESRI, 2016), where rivers were considered to occur where flow accumulation was >100 for 90 m by 90 m cells. The output was converted from raster to polyline (ESRI, 2016) and clipped for the Almirante Bay and Changuinola catchments. Using the editing feature, the river polygons were modified manually, so that Almirante Bay catchment rivers had only one to four rivers per catchment, with many of the small polylines along the coast removed (Figure 1). Some rivers were manually edited or added because the SRTM DEM had low resolution and did not pick up some of the low-lying flat coastal areas, such as Black and Canal. Using the editing feature, these river polylines were edited using our GPS field tracks, and/or using the high-resolution imagery basemap provided in ArcMap (ESRI, 2020) as a visual guide.
The land cover map produced for this study consists of two main datasets. The LULC for areas outside of San San Pond Sak were extracted from a country-wide digital LULC map from 2012 produced by the Ministry of Environment (MiAmbiente) of Panama within the framework of the ONUREDD program developed at the scale of 1:50,000 (Ministerio de Ambiente, 2012). Using the editing feature, we simplified the government generated LULC shapefile in ArcMap 10.8, merging several similar categories, and renamed the new groups to reflect the composition. The final categories based on the government LULC were mature broadleaf forest, secondary broadleaf forest, pasture, scrub/bushes, urban areas, banana plantations, mangroves, water bodies and sediment (Figure 2). Because more detailed land cover had been determined for the San San Pond Sak region, we manually edited the LULC shapefile, merging polygons and renaming them to reflect the vegetation map produced by Sjögersten et al. (2020) (Figure 2). The new “swampy” vegetation categories are flooded mixed forest, orey (Campnosperma panamense) dominated forest, raphia palm (Raphia taedigera) dominated, flooded vegetation (stunted forest and bog plain/saw grass), and mangroves (Phillips et al., 1997; Sjögersten et al., 2020). The “swampy” regions are located primarily within San San Pond Sak and along the coasts of Almirante Bay (Figure 2). The total area (km2) of each LULC type was calculated for the six focal catchments and the total Almirante Bay catchment (see Supplementary Table 3). LULC is unlikely to have changed significantly from 2013 to 2019 for the focal rivers and the Almirante Bay catchment, as minimal deforestation took place during this period (see Supplementary Table 4).
For statistical analysis, LULC categories were grouped into forest (mature and secondary forest), human impacted (pasture, scrub/bushes, urban areas, banana plantations), and swamp (flooded vegetation, mixed flooded forest, orey dominated forest, raphia palm dominated) (see Supplementary Table 5). Fluvial, which was not used in the land use statistical analysis, consisted of water bodies and sediment, and ranged from 0 to 1.5% of the total catchment area (see Supplementary Table 5). We used a partial least squares (PLS) analysis to determine which LULC types best explained the variation in each measured river constituent, since the river constituents are not independent (Carrascal et al., 2009). PLS analysis was implemented in JMP15, which uses minimization of root mean predicted sums of squares (PRESS) to identify the optimal number of factors (SAS Institute, 2019). Coefficients with a variable importance (VIP) >0.8 are considered important (SAS Institute, 2019). We examined linear regressions between each of the river water variables identified as important from the PLS analysis and percentage of each LULC type (forest, human influenced, or swamp). These models were used to predict the river physical and chemical characteristics for the entire Almirante Bay catchment based on LULC.
To understand how LULC has changed from 2000 to 2020, in ArcMap 10.8.1, we extracted the percentage of deforestation for the six focal catchments and the Almirante Bay catchment using a global dataset of forest deforestation (Hansen et al., 2013). We removed the pre-2000 banana plantation regions from our deforestation estimates as it was clear the changes were due solely to harvesting rather than deforestation.
Panama's Autoridad Nacional del Ambiente created a baseline dataset of river water quality through the establishment of a National River Monitoring Network (NRMN) (ANAM, 2013). Two hundred seventy-six sites in 100 rivers within 36 major catchments were measured once during the wet season and once during the dry season from 2009 to 2012 (ANAM, 2013). Ideally, there were three NRMN sites on each river, one at high altitude, a second in the middle course of the river, and third near the river mouth or near the confluence in the case of a tributary.
Measured parameters included conductivity, temperature, pH, DO, total dissolved solids, turbidity, biological oxygen demand, fecal coliforms, nitrates, and phosphates. pH was measured in situ with an electrometer, conductivity with a conductivity meter, temperature with a thermistor, and turbidity with a nephelometer. Other parameters were analyzed in the ANAM (now MiAm) Water Quality Laboratory, including dissolved oxygen by acid modification, and nitrates and phosphates with a spectrophotometer (ANAM, 2013).
We assessed which NRMN sites were likely influenced by coastal processes. Any NRMN site with mean conductivity >1,013 μS/cm (salinity >0.5 ppt) was classified as under coastal influence if the following criteria were met for the site: (1) was located near the coast on flat, low-lying land, and (2) had at least one individual river sample per site with a conductivity >3,796 μS/cm (>2 ppt, maximum recommended salinity for agricultural use). Twelve percent of the NRMN sites were classified as coastal (see Supplementary Table 6).
A water quality index (WQI) developed by the National Sanitation Foundation USA (Brown et al., 1970; Dinius, 1987) and modified for Panamanian rivers (ANAM, 2003), ranged from 0 to 100 based on a weighted combination of nine measured physical and chemical parameters (ANAM, 2013). DO and fecal coliform were the critical WQI parameters and were given the largest weights (ANAM, 2013). A modified formula was used if any parameter besides DO and fecal coliform was missing, otherwise the sample was excluded (ANAM, 2013). Each NRMN site was placed into one of five categories based on mean WQI: highly contaminated (0–25), contaminated (26–50), slightly contaminated (51–70), acceptable (71–90), and not contaminated (91–100). Overall, 67% of the NRMN sites had acceptable water quality, 26% of the sites had slightly contaminated water, and 7.3% of the sites had contaminated water (see Supplementary Table 6).
To place the six focal rivers into a broader context, we used a PCA to compare them to the NRMN sites. This analysis used the physical and chemical parameters that both datasets had in common: conductivity, temperature, pH, and DO, and . Since nitrite is a small fraction of TON, is comparable to TON (World Health Organization, 1978). For each river site we calculated the mean value for each variable for use in the PCA. One river site from the NRMN was not included in the PCA as it was an extreme outlier. The WQI for the NRMN was used to color code the points on a plot of PC1 vs. PC2 to show where in the multivariate space based on the subset of six variables, the sites with different quality fell.
The river water physical and chemical characteristics of the two swamp rivers were occasionally influenced by saltwater intrusions during the dry season (Feb-Mar; see below). The characteristics described below exclude this saltwater intrusion period. The median water temperature for each river ranged from 24.2 to 25.6°C (Table 1). The coldest (22.3°C) and warmest (28.5°C) reported temperatures were both recorded in Pastores (Table 1). The median specific conductivity for each river ranged from 58 μS/cm in Pastores to 565 μS/cm in the Canal with corresponding salinities of 0.03 ppt and 0.27 ppt, respectively (Table 1). The median pH for the rivers varied from 5.5 in Black to 7.6 in Changuinola (Table 1). The lowest pH recorded was 4.4 in Black and maximum pH was 8.4 in Pastores (Table 1; see Supplementary Figure 1C). The median values of DO for each river ranged from hypoxic at 2.2 mg/L in the swamp rivers, which never exceeded 4.8 mg/L, to a median of 9.2 mg/L in Changuinola (Table 1). Specific conductivity generally covaried temporally across the rivers, which included the seawater intrusion period (Table 2; see Supplementary Figure 1B) suggesting a regional driver. Temperature covaried temporally across all rivers, except when compared to Black, likely due to the seawater intrusion period (Table 2; see Supplementary Figure 1A). pH and DO values were temporally correlated only among some pairs of rivers supporting a role of more local or catchment-specific drivers (Table 2; see Supplementary Figures 1C,D). During the seawater intrusion at Black, the median specific conductivity was 44,095 μS/cm with corresponding salinity of 28.3 ppt (Table 1; see Supplementary Figure 1B). The lowest recorded DO concentrations occurred during the saltwater intrusions in Black where the median value was anoxic (0.05 mg/L) (Table 1; see Supplementary Figure 1D).
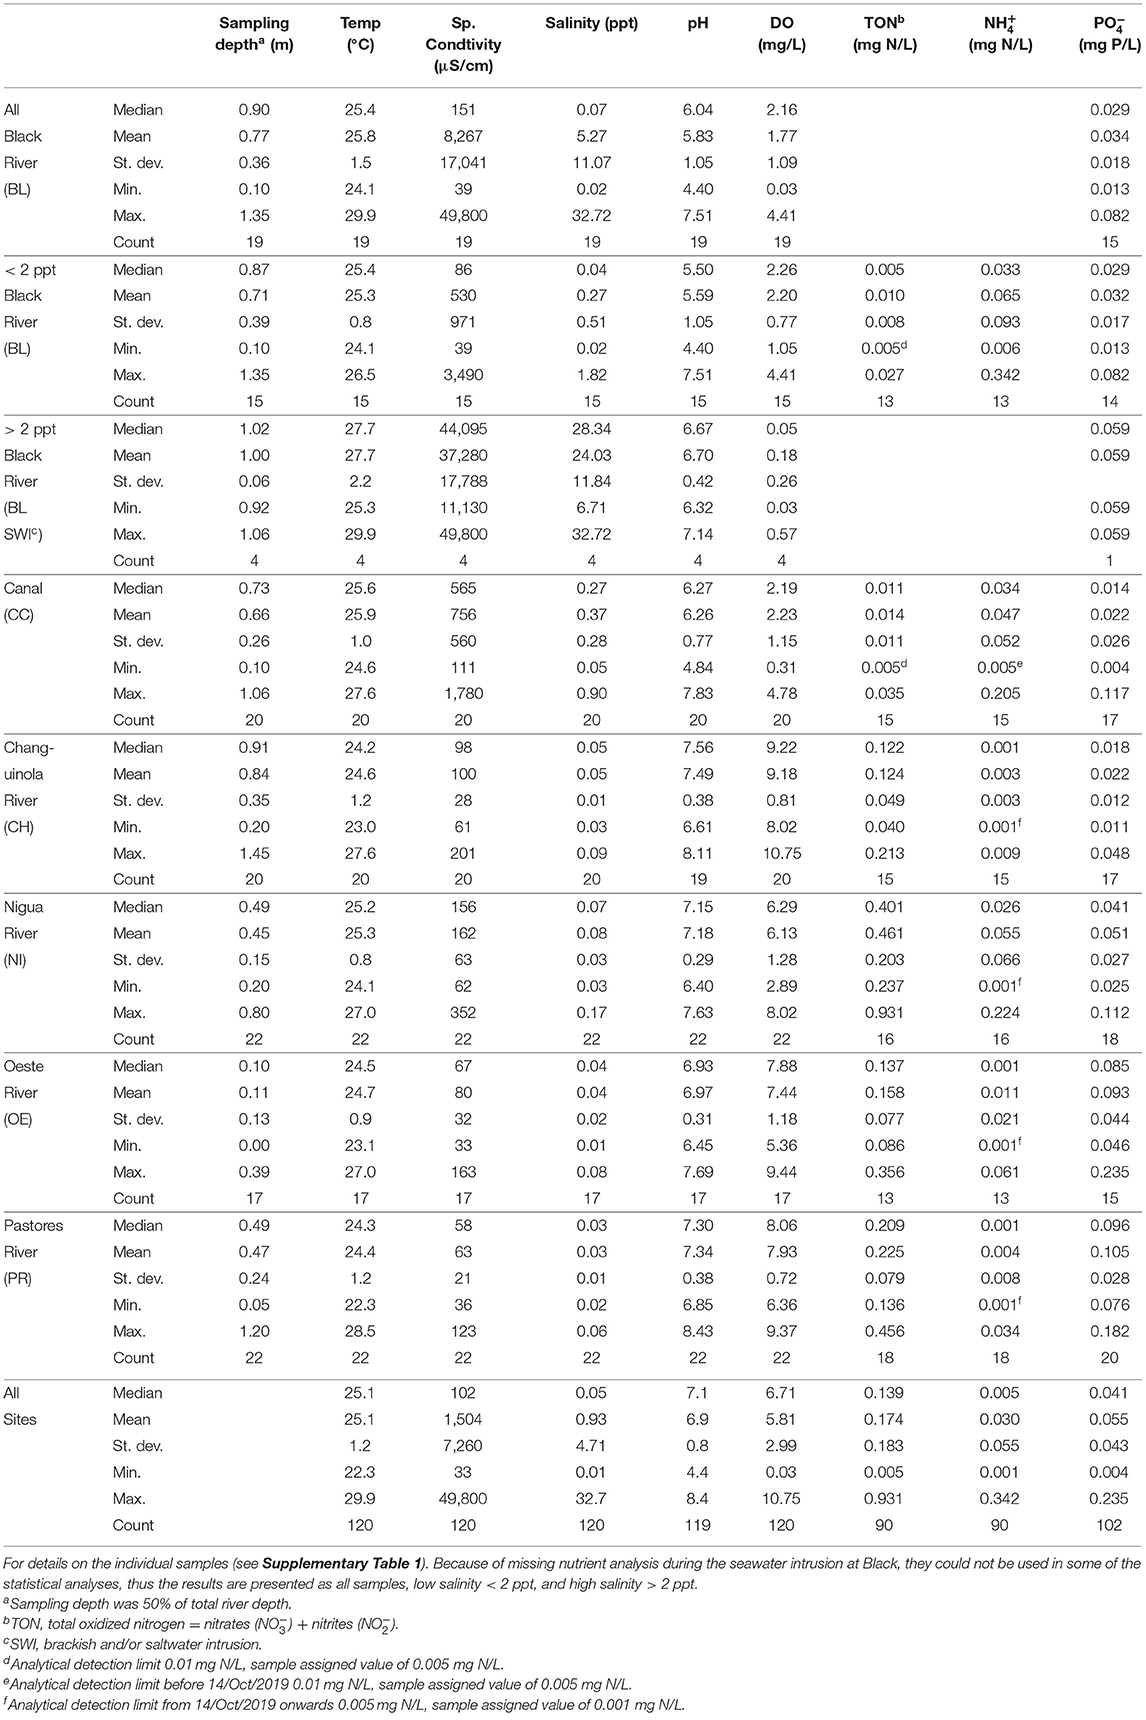
Table 1. Summary results from river water physical and chemical constituent monitoring from the six focal rivers, with median, mean, standard deviation, minimum, maximum, and count.

Table 2. Pairwise correlations (r) between the rivers across the fortnightly sampling of the six focal riversa.
The nutrient concentrations also varied between the rivers. The median TON concentrations had a large range, with the lowest values falling below the detection limit in Black to the highest value of 0.401 mg N/L in Nigua (Table 1). The median ammonium concentrations fell below the detection limit in Changuinola, Oeste, and Pastores and reached a maximum of 0.033 mg N/L in Black (Table 1). The median phosphate concentrations ranged from 0.014 mg P/L in the Canal to 0.096 mg P/L in Pastores (Table 1), with a maximum of 0.235 mg P/L in Oeste and a minimum of 0.004 mg P/L in the Canal (Table 1). TON, ammonium, and phosphate values were temporally correlated only among some pairs of rivers indicating a role of local or catchment-specific drivers (Table 2).
Analysis of variance showed significant differences between many of the rivers for most of the variables measured. The strongest effects included the following. The two swamp rivers had significantly lower pH, DO, TON, and higher specific conductivity than the other rivers (Tukey post-hoc tests p < 0.05; Figures 4B–D, 5A). Nigua had significantly higher TON than the other rivers (Figure 5A). Ammonium levels in Black were significantly higher than levels in the Changuinola and Pastores (Tukey post-hoc test p < 0.05; Figure 5B), while none of the others differed statistically from each other. Pastores and Oeste had significantly higher concentrations of phosphates than the other four rivers (Figure 5C).
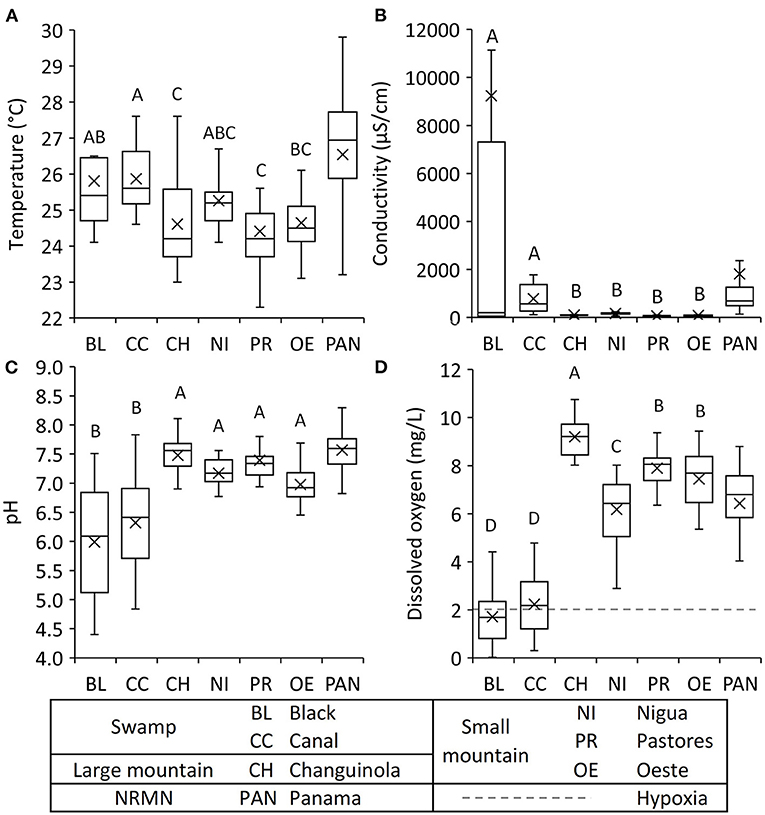
Figure 4. Box plots of river water constituents from the fortnightly dataset of the six focal rivers (see Supplementary Table 1) used in the statistical analyses for (A) temperature, (B) conductivity, (C) pH, and (D) dissolved oxygen. One-way ANOVA identified significant differences between the focal rivers (P < 0.001) (see Supplementary Table 8). Means with different letters are significantly different (P < 0.05) as per Tukey's post-hoc test. For comparison, data from the national river monitoring network (NRMN) in Panama (PAN) from 2009 to 2012 are included (ANAM, 2013). In the box plot the middle line is the median, and the box contains the interquartile range (50% of the data) and the whiskers extend to 25 and 75% of the data. X represents the mean.
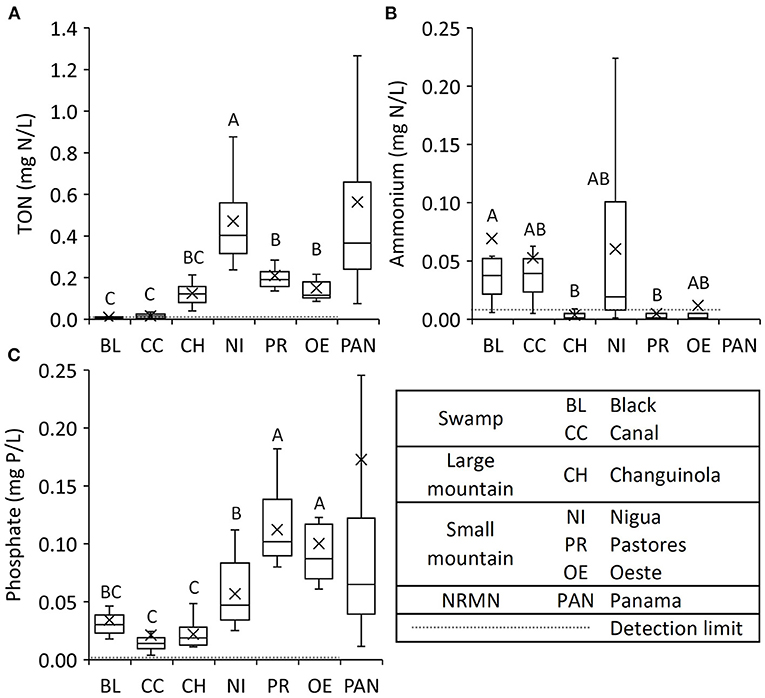
Figure 5. Box plots of nutrient river water constituents from the fortnightly dataset (see Supplementary Table 1) used in the statistical analyses for the six focal rivers for (A) total oxidized nitrogen (TON = + , B) ammonium, and (C) phosphate. One-way ANOVA identified significant differences between the focal rivers (P < 0.001) (see Supplementary Table 8). Means with different letters are significantly different (P < 0.05) as per Tukey's post-hoc test. For comparison, the mean nutrient concentrations from national river monitoring network (NRMN) in Panama (PAN) rivers were measured from 2009 to 2012 (ANAM, 2013).
Principal component analysis across our entire dataset shows that only 45.4% of the variation in the data can be described by the first two principal components (PC) (Figure 6A). DO, pH, TON and PO4 increase along PC1 to the right, while temperature, salinity and NH4 decrease in the same direction (Figure 6A). PC2 in contrast shows all factors other than DO, which contributes little to this axis, increase in the same direction. Visual inspection shows that the swamp rivers largely overlap each other, as do the mountainous rivers, but that the two groups can be largely distinguished along PC1 (Figure 6A).
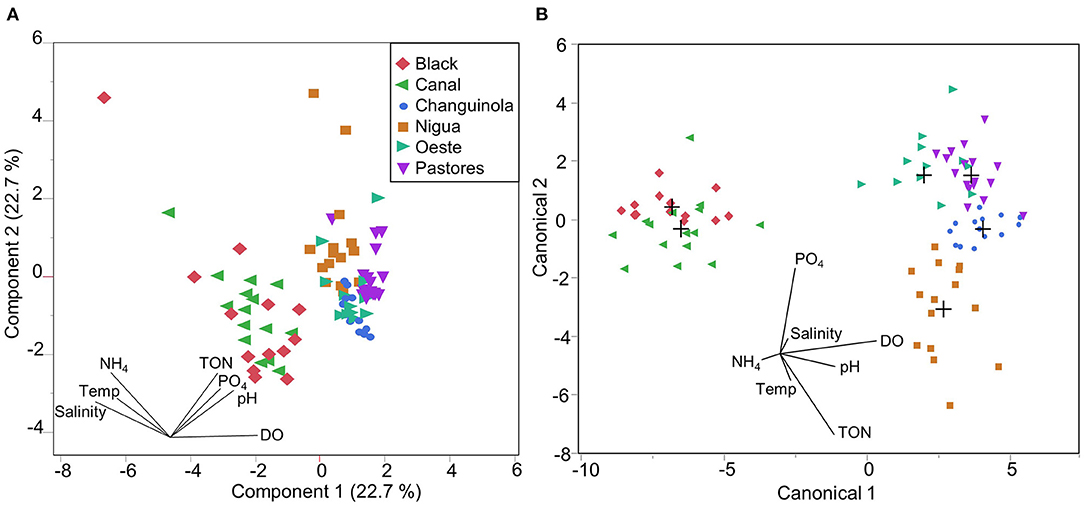
Figure 6. (A) Principal component analysis (PCA) for all the river constituents. Principal components (PC) 1 and 2, the orthogonal linear combinations of standardized variables that maximize the variance of the observations (SAS Institute, 2021). Each observation is placed in the multivariate space defined by PC1 and PC2. (B) Quadratic discriminant analysis (DA) for all the river constituents. The axes (canonical1 & canonical2) summarize the between-category variation, to provide the maximum separation between the groups (i.e., each river). The multivariate mean for each group is shown by a plus sign.
Discriminant analysis after stepwise removal of non-significant factors retained DO, TON, and pH. The results show that most of the rivers can be clearly distinguished (entropy R2 = 0.89; −2LogLikelihood = 33.84; N = 86) (Figure 6B). The samples were attributed to the correct river 90% of the time. Black and the Canal were occasionally confused with each other (with 6/28 incorrectly classified as the other river), but were clearly separated from the four mountainous rivers (see Supplementary Table 7). Amongst the four mountainous rivers, Changuinola, and Nigua were classified correctly 100% of the time, but two Pastores samples were misclassified (with 2/17 incorrectly classified as Oeste; see Supplementary Table 7). This shows that the river water characteristics are distinct, as they can be distinguished statistically.
LULC varied between the river catchments in our study. Changuinola had the highest forest land cover (90%). Pastores, Oeste, and Nigua had comparatively moderate forest cover and significant amounts of human-impacted land use (69:31, 64:36, and 54:45 forest: human-impacted, respectively; see Supplementary Table 5). The catchments of the Canal and Black (i.e., the swamp rivers), were almost entirely swamp (98 and 96%, respectively; see Supplementary Table 5).
The three main land cover types (forest, human impacted, and swamp) were good predictors of each of the river water characteristics in the partial least squares (PLS) analysis except for conductivity, for which a model with 0 factors was identified as minimization the root mean PRESS. This suggests that variation in conductivity/salinity measured in the swamp rivers is driven by factors other than land cover, most likely saltwater intrusion from the coast. For the remaining six characteristics, partial least squares models each resulted in the recovery of two land cover factors with VIP scores >0.8 (Figure 7), the threshold often used to determine which variables are important in explaining the data (Carrascal et al., 2009). Percent swamp cover was an important explanatory variable for all six characteristics, and percent forest cover was an important explanatory variable for four characteristics (temperature, pH, DO and ) (Figure 7). The percent of human influenced land cover was an important explanatory variable for TON and . PLS coefficients based on centered and scaled data show more swamp cover resulting in increases in temperature and and decreases in pH, DO, TON and (Figure 7). Higher forest cover acts in the opposite direction, with more forest cover resulting in decreases in temperature and and increases in pH and DO (Figure 7). More human-influenced land use resulted in an increase in TON and (Figure 7). The relationships between each water variable and each LULC type with VIP >0.8 are shown in Supplementary Figure 2. The relationship between each LULC type and the river constituent can also be illustrated in multivariate space using PCA analyses conducted on the average conditions in each river and one parameter of LULC (Figure 8).
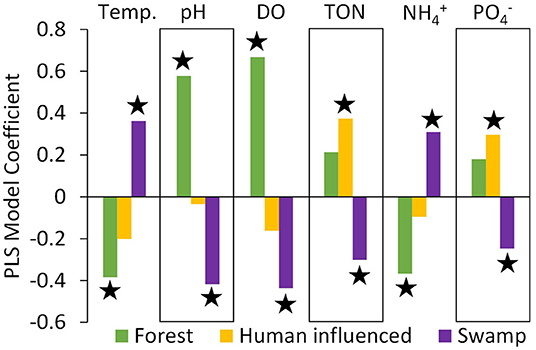
Figure 7. Partial least squares (PLS) model coefficients for centered and scaled data for LULC (forest, human impacted, and swamp) for mean temperature, pH, DO, TON, , and , measured in the focal rivers (n = 6). Starred bars have a variable importance for projection (VIP) score >0.8, indicating importance of each land cover type for predicting each river constituent value (SAS Institute, 2021).
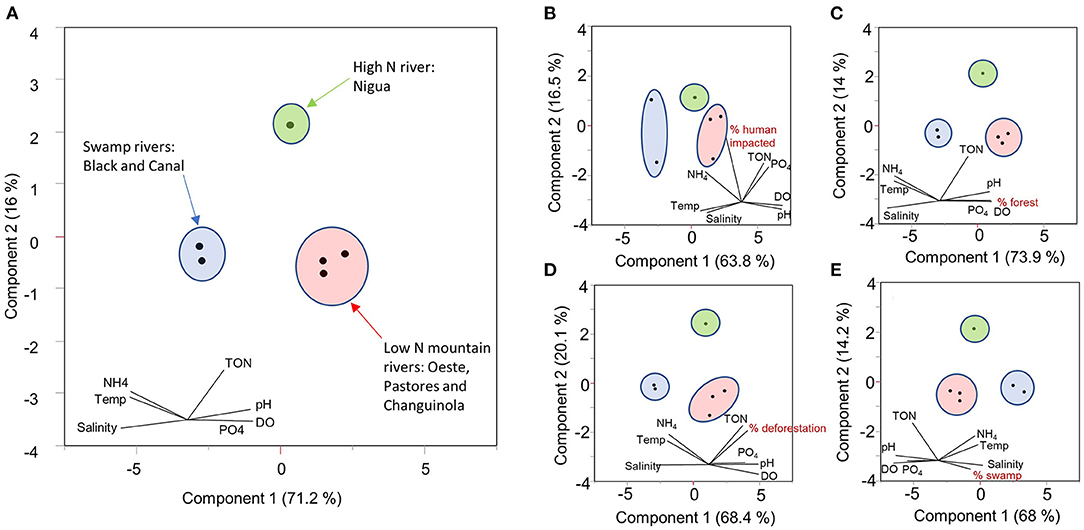
Figure 8. Principal component analysis (PCA) of the focal river means for seven water quality variables (A). The smaller panels include the seven water quality variables in the PCA, plus (B) percent human impacted cover, (C) percent forest cover, (D) percent deforestation in the last 20 years, and (E) percent swamp cover. The inset variable loadings are not to scale with the plot of points on the ordination axis, showing only relative magnitude and direction.
Although it was not possible to measure the river constituents for the contributing rivers of the entire Almirante Bay catchment (Figure 1), river water characteristics can be estimated based on the relationships between LULC and the mean values from of the six focal rivers (see Supplementary Figure 2). The LULC for the Almirante Bay catchment had 42.3% forest, 34.9% swamp, and 22.6% human influenced areas, and fell within the range of LULC encompassed by focal catchments (see Supplementary Table 5). Based on single variable regressions with LULC, the predicted mean physical and chemical characteristics for the entire Almirante Bay catchment are as follows: temperature at 25.2°C; pH at 6.8; DO at 5.4 mg/L; TON at 0.182 mg N/L; ammonium at 0.034 mg N/L; and phosphate at 0.059 mg P/L (see Supplementary Figure 2 and Supplementary Table 9).
Changes in LULC over the last 20 years have been low to moderate. From 2000 to 2020 there was 3.4% forest cover change (0.17%/year) in the entire Almirante Bay catchment (see Supplementary Table 4). Very little of this change occurred in the swamps, where there was <0.2% forest cover change in Black and the Canal, as they are within protected areas (Figure 2; see Supplementary Table 4). The bulk of this change occurred in the small mountainous catchments that drain directly into the Bay, with a decrease in forest cover by 9.0% in Nigua, 6.2% in Pastores, and 4.3% in Oeste (see Supplementary Table 4). Thus, in the past 20 years the physical and chemical characteristics of river water that contributes to Almirante Bay may have shifted slightly in response to these moderate land use changes.
Overall parameters for the focal rivers fell within the range of values reported for the NRMN dataset (Figures 4, 5). However, the median temperature for the focal rivers was 1.9°C cooler than the median temperature for NRMN sites (Table 1, Figure 4A; see Supplementary Table 6). There is the possibility that some of the differences between the two datasets (this study and the NRMN) stem from the two different monitoring protocols and from natural interannual variation. Black, which had saltwater intrusions, had similar conductivity to coastal NRMN sites (see Supplementary Figure 3B and Supplementary Table 6). The two focal swamp rivers had DO concentrations that were substantially lower than the coastal NRMN sites, but similar to contaminated NRMN sites (see Supplementary Figure 3D).
For the six focal rivers and the NRMN sites, the principal component 1(PC1) explained 49% of the variance (Figure 9). and were positively loaded and pH and DO were negatively loaded on PC1 (Figure 9). Generally, the acceptable water quality sites scored negatively, the slightly contaminated sites scored slightly positive, and the contaminated sites scored positively on PC1 (Figure 9). The PC2 explained 17% of the variance, where the positive loadings were related to high conductivity and warmer temperatures, including the coastal NRMN sites (Figure 9). There were three distinct NRMN site groups outside the central cluster of the PCA. They were as follows: (a) contaminated river sites which were almost universally located in Panama City with low pH, low DO and high nutrients (positive PC1 and negative PC2); (b) slightly contaminated coastal sites with high specific conductivity and high temperature (positive PC1 and positive PC2); and (c) acceptable sites located in the high mountains of Volcan Baru and Cerro Punto hillslopes with low temperature and high DO (negative PC1 and negative PC2; Figure 9). Four of the focal river sites were grouped in the central PCA cluster, with, Changuinola, Pastores, and Oeste, overlapping NRMN sites with acceptable water quality and the Nigua falling at the transition between acceptable and slightly contaminated water quality (Figure 9). The swamp rivers (Black and Canal) overlapped with category b above, consisting of slightly contaminated river sites with coastal influence (Figure 9).
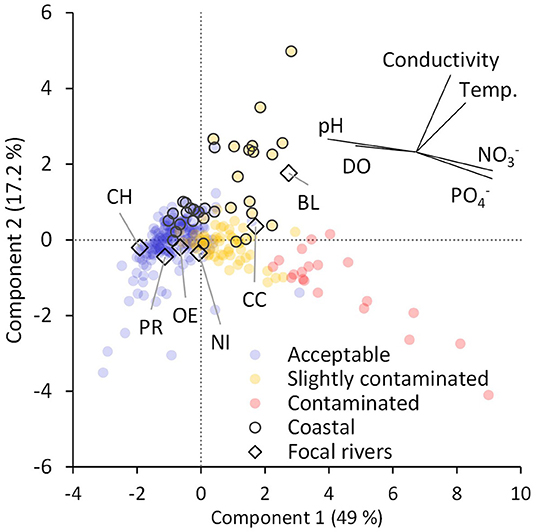
Figure 9. Principal component analysis (PCA) of mean river constituents for the six focal river monitoring sites and for 275 sites within the national river monitoring network (NRMN). Principle components (PC) 1 and 2, the orthogonal linear combinations of standardized variables that maximize the variance of the observations (SAS Institute, 2021). Each observation is placed in the multivariate space defined by PC1 and PC2. Rivers from the NRMN are colored based on water quality index. River stations with coastal influence and the focal rivers are outlined in black. The value in brackets is the percentage of the variation accounted for by the PC. The inset with rays stemming from point 0,0 and indicates the weight (length) and direction of each variable on the two PC axes.
Although the focal river sampling sites are situated within 30 km of each other, the water quality of the rivers we surveyed differed significantly from each other. Salinity/conductivity covaried over time across the rivers suggesting that variation in these characteristics was driven by region-wide factors and are not specific to the different catchments, with temporal variation in part due to precipitation and evaporation. With the exception of Black due to periods of seawater intrusion, it is likely that temporal covariance in temperature between the rivers was due regional climatological variations in solar radiation and air temperature. In the swamp rivers, pH covaried overtime, with a large range in values, indicating that this region has lower buffering capacity and is sensitive to changes in biogeochemical processes and climate. The factors that were most instrumental in distinguishing the water samples from the six focal rivers from each other were pH, DO, TON and phosphate. These four factors covaried temporally only among subsets of the rivers suggesting more local drivers that differed between the different LULC groupings. Among the six focal rivers low pH, low DO, low TON separated the swamp rivers from the others. The relative concentration of vs. TON effectively distinguished the mountainous rivers from each other.
Our multivariate analysis showed that four focal rivers have similar characteristics to NRMN sites, for which the WQI had been quantified. Our focal rivers had similar characteristics to NRMN sites with acceptable to slightly contaminated water quality. This is consistent with our observations of the local landscapes. Inferring from this relationship the focal rivers can be divided into four groups: swamp rivers with coastal influence and characteristics similar to rivers with slightly contaminated water quality (Black, and Canal); small mountainous rivers with characteristics similar to rivers with acceptable to slightly contaminated water quality (Nigua); small mountainous rivers with characteristics similar to rivers with acceptable water quality (Oeste and Pastores), and a large mountainous river with characteristics similar to rivers with acceptable water quality (Changuinola).
San San Pond Sak wetland, is a national protected area. Peat swamp rivers, like Black and the Canal, are unique ecosystems with distinct biogeochemical processes, yet they are understudied particularly in the Neotropics. One example of their unique characteristics is that the phosphate concentrations of the focal blackwater rivers are higher than the global average for natural rivers (Meybeck, 1982; Alkhatib et al., 2007). This phenomenon can be explained via the following mechanism. Anaerobic respiration causes denitrification, where river nitrates are reduced to N2 gas which is then lost to the atmosphere (Knowles, 1982). When DO, nitrates, and nitrites are depleted, iron (III) oxide bound phosphate is reduced in sediments by dissolved sulfide releasing phosphate into the water (Chambers and Odum, 1990; Parsons et al., 2017). The high levels of phosphates in Black are particularly interesting because this river's catchment consists of a 8 m thick deep peat dome (Phillips et al., 1997) which is thought to receive nutrients only from precipitation, resulting in phosphate limitation in the terrestrial ecosystem (Sjögersten et al., 2011; Cheesman et al., 2012). More research is needed to assess the biogeochemical dynamics of the San San Pond Sak peat swamp forest and connectivity to the rivers.
Our results demonstrate that the standard WQI approach is not ideal for assessing the natural water quality of coastal rivers and peat swamp rivers. The loadings on PC2 in the analysis of the river sites within the NRMN show that many coastal sites had water characterized as “slightly contaminated,” with higher conductivity and higher temperature. While many coastal rivers have pollution runoff from upstream reducing the WQI, higher conductivity and higher temperatures are also natural characteristics of coastal rivers. The Canal and Black align with the coastal NRMN group, suggesting that they are slightly contaminated. The two swamp rivers in our study, however, are natural and undisturbed, with >95% swamp vegetation. They are typical blackwater rivers with low pH, low DO, and variable concentrations of nutrients (Vegas-Vilarrúbia et al., 1988; Küchler et al., 2000; Alkhatib et al., 2007; Horbe and Santos, 2009; Rixen et al., 2010; Ríos-Villamizar et al., 2014). The two focal swamp rivers likely align with “slightly contaminated” NRMN sites because they have DO concentrations approaching hypoxia. DO has the largest weight in the WQI calculation (ANAM, 2013). We did not measure fecal coliforms in the focal rivers, which is the other highly weighted variable. It is important, that care be taken in interpreting the WQI when it is applied to these peat swamp rivers and other similar coastal rivers. If the water quality of such rivers is characterized as slightly contaminated under the WQI but the catchment is primarily swamp or fecal coliforms are low, then reduced water quality is likely due to natural sources and should not be considered polluted. As saltwater intrusions can also give confusing results with respect to conductivity, until a WQI metric specifically designed for use with such coastal rivers is developed, interpretation of water quality indices in coastal swamp rivers should be made with caution.
Our study focused on multiple catchments with varying LULC in the same geographical region in order to evaluate the relationship between catchment LULC and river water characteristics. We found results similar to published studies that have more frequently compared river chemistry before and after a change in LULC or upstream and downstream of a particular type of LULC (Brogna et al., 2017; Tanaka et al., 2021). For example, as the human influenced land use increased and forest cover decreased in the catchment, river nutrients increased and DO decreased. This was exemplified by the high TON in Nigua with a 54:45 forest:human-impacted land cover compared to the lower average TON in Oeste with 64:35 forest:human-impacted land cover. Previous work (Wickham et al., 2000; Wickham and Wade, 2002) has shown a non-linear effect of human impacted habitats on water quality, such that a small increase in urban areas can have a larger than expected overall impact on water quality. This may explain the seemingly disproportionately high levels of TON in the Nigua compared to the other mountainous rivers. This disproportionate effect may be due to the fact that urban areas, agricultural lands, and roads are often adjacent to waterways, as is the case in Nigua. A more extreme example is evident in the NRMN where river sites with the highest TON and and lowest DO were polluted rivers in Panama City.
Our results allow the use of LULC to predict water quality for the entire Almirante Bay catchment both past and present. The small changes in LULC suggest that over the past 20 years the physical and chemical characteristics that contribute to Almirante Bay may have shifted slightly. Deforestation, although moderate in the Almirante Bay catchment, may have increased the TON concentrations as TON was closely aligned with forest cover. Reduced forest LULC may have slightly increased the overall river water temperature, and ammonium levels, and slightly lowered the pH and DO. The peat swamp forests in San San Pond Sak are protected and little land cover change has occurred, thus it is likely that the contribution water to the Bay from the swamp is unchanged. The mountainous catchments, on the other hand, are likely to be important drivers of river water quality change in the Almirante Bay catchment. It has been suggested that land use change in the last 100 years has degraded estuarine water quality, as coral reef communities in Almirante Bay have declined (Cramer et al., 2012; Aronson et al., 2014).
River water quality impacts estuaries around the global (Eyre, 1994; Nagy et al., 2002; Costanzo et al., 2003; Burford et al., 2012; Fernandes et al., 2018; Howley et al., 2018) with nutrient runoff contributing to coastal hypoxia and eutrophication (Wiseman et al., 1997; Gray et al., 2002; Howarth et al., 2011). Hypoxia is well-documented in Almirante Bay (Adelson et al., in review; Altieri et al., 2017; Lucey N. et al., 2020; Lucey N. M. et al., 2020; Weinstock and Collin, 2021). Our focal rivers, however, did not carry particularly high levels of dissolved nutrients when they passed our monitoring sites, and further investigation is needed to evaluate river nutrient fluxes into the Bay and to evaluate whether these contributions could influence hypoxia and/or ecosystem degradation.
Nutrient content in “pristine” rivers or streams is generally low, but they vary naturally depending on catchment characteristics, atmospheric sources, and geology (Stallard and Murphy, 2012). Therefore, it is difficult to assess the background levels of nutrients prior to human impacts and harmful anthropogenic effects (Mainstone and Parr, 2002). It is also tricky to compare to regulatory baselines, as such regional regulatory and quality standards for nutrients in rivers vary or are absent. However, natural levels of nitrogen in world rivers are around 0.101 mg N/L TON and 0.015 mg N/L (Meybeck, 1982). The natural peat swamp rivers (Black and the Canal) have very low TON and double the ammonium compared to natural global rivers, but are typical of reducing and anaerobic environments (WHO, 2017). Nigua has around four times higher nitrate levels than those found in natural global rivers (Meybeck, 1982), potentially related to the amount of development in that catchment. However, overall, our rivers have much lower nitrate/nitrite concentrations than good/moderate (mean 2.5 mg N/L total) rivers in Europe (Poikane et al., 2019) and are much lower than drinking water limits at 11.9 mg N/L of TON (WHO, 2017).
Dissolved phosphorus is naturally present in rivers, with around 0.01 mg P/L (Meybeck, 1982). Like nitrate, phosphate concentrations can span an order of magnitude at a single monitoring station (Meybeck and Moatar, 2012; Stallard and Murphy, 2012). All the focal rivers have higher phosphates compared to the average for natural global rivers (Meybeck, 1982), and two agricultural rivers in Puerto Rico (Stallard and Murphy, 2012). Several of our focal rivers have moderate to high forest cover, suggesting that geology, especially underlying the Oeste and Pastores, may be enriching the phosphorus levels in these small mountainous catchments. The phosphate levels in our rivers have similar or lower concentrations than good/moderate (mean 0.1 mg P/L) rivers in Europe (Poikane et al., 2019) and there is no international standard set for phosphates in drinking water (WHO, 2017).
Concentrations of dissolved nutrients in some of the focal rivers are elevated compared to idealized “pristine” conditions, and they would likely contribute to nutrient cycling in the Bay. However, assessing the potential impacts caused by river dissolved nutrient fluxes in the marine environment is challenging without additional information. First, river flow rates are necessary to calculate nutrient fluxes. Secondly, both dissolved organic forms and particulate forms (not measured here) contribute significantly to nutrient fluxes to the world's oceans (Meybeck, 1982) and are integral components of marine biogeochemical cycles (Seitzinger and Sanders, 1997; Berman and Bronk, 2003; Karl and Björkman, 2015). Finally, evaluation of terrestrial contributions solely through monitoring rivers overlooks groundwater and coastal town effluent runoff into the Bay (Mainstone and Parr, 2002; Valiela and Bowen, 2002; Bowen et al., 2007). With respect to this last point, the town of Almirante which is situated at the mouth of the Nigua, is likely a major source of anthropogenic nutrient addition to the back of the Bay. The proximity of the town of Almirante to the area of the Bay that experiences the most extreme hypoxia and temperature inversions (Adelson et al., in review) suggests a possible contributing role from town runoff, which is not captured in this survey of river nutrients. There are other towns however, in Almirante Bay, such as Bocas del Toro on Colon Island, where wastewater enters the Bay. The coast of these towns likely experiences more water exchange than Almirante due to their proximity to the entrance of the Bay and the open ocean (Adelson et al., in review). This suggests that anthropogenic sources of nutrients into the Bay, such as from the town of Almirante, may have a substantial impact on marine ecosystem health. Determining the nutrient fluxes into the Bay and identifying the relative importance of rivers (Rabalais, 2002), coastal towns (Silva et al., 2013), and the open ocean (Davis et al., 2014) will be a crucial step in the assessment and understanding of ecosystem degradation, eutrophication, and hypoxia in Almirante Bay.
Overall, we found that six focal rivers around Almirante Bay, in Bocas del Toro Panama have significantly different river water physical and chemical characteristics that can be linked to catchment LULC. Our results suggest that the peat swamp rivers had water quality that could be classified as slightly contaminated due to low pH and DO, but that these characteristics are naturally occurring in blackwater rivers rather than from pollution. Using the relationship between our river point measurements of water characteristics and catchment LULC, we developed regressions to estimate river constituent characteristics for the entire Almirante Bay catchment. Deforestation rates although low to moderate in the Almirante Bay catchment in the last 20 years, may influence river water quality by increasing TON inputs from the mountainous catchments. This study shows that non-point source nutrient input, from wastewater and urban runoff from coastal towns, may have a greater impact on coastal hypoxia than river runoff.
The original contributions presented in the study are included in the article/Supplementary Material, further inquiries can be directed to the corresponding author/s.
KC and RC designed the study with input from SG, GP, KD, and MT. VB, XB, CC-Á, and KC collected the samples and data in the field with occasional help from AA. KC managed the data QA/AC, conducted the GIS analysis, and generated the maps. KC and RC analyzed the data and wrote the manuscript. SG, GP, KD, MT, and AA commented on the manuscript. All authors contributed to the article and approved the submitted version.
This work was supported by the following grants NSF: (OCE - 1924220 to RC), (OCE - 1924551 to GP, SG, and AA), and (OCE - 1924664 to KD). KC and AA were partially supported by fellowships from STRI.
The authors declare that the research was conducted in the absence of any commercial or financial relationships that could be construed as a potential conflict of interest.
All claims expressed in this article are solely those of the authors and do not necessarily represent those of their affiliated organizations, or those of the publisher, the editors and the reviewers. Any product that may be evaluated in this article, or claim that may be made by its manufacturer, is not guaranteed or endorsed by the publisher.
We are grateful to the Ministerio de Ambiente de Panama (MiAmbiente) for permission to work in Panama and for providing access to the national river monitoring network results. We thank T. Romero, A. Bielnicka, and the staff of the STRI soils laboratory for conducting the nutrient analysis, P. Góndola and the staff of the Bocas del Toro Research Station for logistical support, F. Bellido, E. Brown, D. González, and H. Arlauskas for assistance in the field, A. Ibáñez and E. Arauz for editing the Spanish-language abstract.
The Supplementary Material for this article can be found online at: https://www.frontiersin.org/articles/10.3389/frwa.2022.737920/full#supplementary-material
Alkhatib, M., Jennerjahn, T. C., and Samiaji, J. (2007). Biogeochemistry of the Dumai River estuary, Sumatra, Indonesia, a tropical black-water river. Limnol. Oceanogr. 52, 2410–2417. doi: 10.4319/lo.2007.52.6.2410
Altieri, A. H., Harrison, S. B., Seemann, J., Collin, R., Diaz, R. J., and Knowlton, N. (2017). Tropical dead zones and mass mortalities on coral reefs. Proc. Nat. Acad. Sci. U.S.A. 114, 3660–3665. doi: 10.1073/pnas.1621517114
Alves, G., Flores-Montes, M., Gaspar, F., Gomes, J., and Feitosa, F. (2013). Eutrophication and water quality in a tropical Brazilian estuary. J. Coastal Res. 2013, 7–12. doi: 10.2112/SI65-002.1
ANAM (2003). Primer Informe de Monitoreo de la Calidad del Agua en las Cuencas Hidrográficas de Panamá, Años 2002 - 2003. Autoridad Nacional del Ambiente, Panamá.
ANAM (2009). Informe de Monitoreo de la Calidad del Agua en las Cuencas Hidrográficas de Panamá. Compendio de Resultados, años 2002 - 2008. Autoridad Nacional del Ambiente, Panamá.
ANAM (2013). Informe de Monitoreo de la Calidad del Agua en las Cuencas Hidrográficas de Panamá. Compendio de Resultados, años 2009 - 2012. Autoridad Nacional del Ambiente, Panamá.
Aronson, R. B., Hilbun, N. L., Bianchi, T. S., Filley, T. R., and McKee, B. A. (2014). Land use, water quality, and the history of coral assemblages at Bocas del Toro, Panamá. Mar. Ecol. Prog. Ser. 504, 159–170. doi: 10.3354/meps10765
Bailey, A., Meyer, L., Pettingell, N., Macie, M., and Korstad, J. (2020). Agricultural Practices Contributing to Aquatic Dead Zones. Ecological and Practical Applications for Sustainable Agriculture. Springer. doi: 10.1007/978-981-15-3372-3_17
Berman, T., and Bronk, D. A. (2003). Dissolved organic nitrogen: a dynamic participant in aquatic ecosystems. Aquatic Microbial. Ecol. 31, 279–305. doi: 10.3354/ame031279
Bowen, J. L., Kroeger, K. D., Tomasky, G., Pabich, W. J., Cole, M. L., Carmichael, R. H., et al. (2007). A review of land–sea coupling by groundwater discharge of nitrogen to New England estuaries: Mechanisms and effects. Appl. Geochem. 22, 175–191. doi: 10.1016/j.apgeochem.2006.09.002
Brogna, D., Michez, A., Jacobs, S., Dufrêne, M., Vincke, C., and Dendoncker, N. (2017). Linking forest cover to water quality: a multivariate analysis of large monitoring datasets. Water 9:176. doi: 10.3390/w9030176
Brown, R. M., McClelland, N. I., Deininger, R. A., and Tozer, R. G. (1970). A water quality index-do we dare. Water Sewage Works 1970:117.
Bruland, K., and Lohan, M. (2006). Controls of trace metals in seawater. Oceans Marine Geochem. 6, 23–47. doi: 10.1016/B0-08-043751-6/06105-3
Burford, M. A., Webster, I. T., Revill, A. T., Kenyon, R. A., Whittle, M., and Curwen, G. (2012). Controls on phytoplankton productivity in a wet–dry tropical estuary. Estuar. Coast. Shelf Sci. 113, 141–151. doi: 10.1016/j.ecss.2012.07.017
Büyüköztürk, S., and Çokluk-Bökeoglu, Ö. (2008). Discriminant function analysis: concept and application. Eur. J. Educ. Res. 2008, 73–92.
Carpenter, S. R., Fisher, S. G., Grimm, N. B., and Kitchell, J. F. (1992). Global change and freshwater ecosystems. Annu. Rev. Ecol. Syst. 23, 119–139. doi: 10.1146/annurev.es.23.110192.001003
Carrascal, L. M., Galván, I., and Gordo, O. (2009). Partial least squares regression as an alternative to current regression methods used in ecology. Oikos 118, 681–690. doi: 10.1111/j.1600-0706.2008.16881.x
CGIAR NASA (2019). Shuttle Radar Topography Mission (SRTM) Data V4. NASA, CGIAR Consortium for Spatial Information. Available online at: http://srtm.csi.cgiar.org/srtmdata/ (accessed January 20, 2020).
Chambers, R. M., and Odum, W. E. (1990). Porewater oxidation, dissolved phosphate and the iron curtain. Biogeochemistry 10, 37–52. doi: 10.1007/BF00000891
Cheesman, A. W., Turner, B. L., and Ramesh Reddy, K. (2012). Soil phosphorus forms along a strong nutrient gradient in a tropical ombrotrophic wetland. Soil Sci. Soc. Am. J. 76, 1496–1506. doi: 10.2136/sssaj2011.0365
Chollett, I., Collin, R., Bastidas, C., Cróquer, A., Gayle, P. M. H., Jordán-Dahlgren, E., et al. (2017). Widespread local chronic stressors in Caribbean coastal habitats. PLoS ONE 12, e0188564. doi: 10.1371/journal.pone.0188564
Comité de Alto Nivel de Seguridad Hídrica (2016). Plan nacional de seguridad hídrica: 2015-2050 Agua Para Todos. Panamá, Republica de Panamá.
Costanzo, S. D., O'Donohue, M. J., and Dennison, W. C. (2003). Assessing the seasonal influence of sewage and agricultural nutrient inputs in a subtropical river estuary. Estuaries 26, 857–865. doi: 10.1007/BF02803344
Cramer, K. L. (2013). History of human occupation and environmental change in western and central Caribbean Panama. Bull. Mar. Sci. 89, 955–982. doi: 10.5343/bms.2012.1028
Cramer, K. L., Jackson, J. B. C., Angioletti, C. V., Leonard-Pingel, J., and Guilderson, T. P. (2012). Anthropogenic mortality on coral reefs in Caribbean Panama predates coral disease and bleaching. Ecol. Lett. 15, 561–567. doi: 10.1111/j.1461-0248.2012.01768.x
Davis, K. A., Banas, N. S., Giddings, S. N., Siedlecki, S. A., MacCready, P., Lessard, E. J., et al. (2014). Estuary-enhanced upwelling of marine nutrients fuels coastal productivity in the U.S. Pacific Northwest. J. Geophys. Res. 119, 8778–8799. doi: 10.1002/2014JC010248
de Oliveira, L. M., Maillard, P., and de Andrade Pinto, J. É. (2016). Modeling the effect of land use/land cover on nitrogen, phosphorous and dissolved oxygen loads in the Velhas River using the concept of exclusive contribution area. Environ. Monit. Assess. 188:333. doi: 10.1007/s10661-016-5323-2
Deegan, L. A., Neill, C., Haupert, C. L., Ballester, M. V. R., Krusche, A. V., Victoria, R. L., et al. (2011). Amazon deforestation alters small stream structure, nitrogen biogeochemistry and connectivity to larger rivers. Biogeochemistry 105, 53–74. doi: 10.1007/s10533-010-9540-4
Dinius, S. H. (1987). Design of an index of water quality. JAWRA 23, 833–843. doi: 10.1111/j.1752-1688.1987.tb02959.x
Dumago, S. W. L., Puno, G. R., and Ingotan, S. S. (2018). Water quality assessment in various land use and land cover of Muleta watershed Bukidnon, Philippines. J. Biol. Environ. Sci. 12, 201–209. Available online at: https://innspub.net/jbes/water-quality-assessment-various-land-use-land-cover-muleta-watershed-bukidnon-philippines/
ESRI (2016). An Overview of the Hydrology Toolset. Hydrology Toolset, ESRI. Available online at: https://desktop.arcgis.com/en/arcmap/10.3/tools/spatial-analyst-toolbox/an-overview-of-the-hydrology-tools.htm (accessed January 19, 2020).
Eyre, B. (1994). Nutrient biogeochemistry in the tropical moresby river estuary system north Queensland, Australia. Estuar. Coast. Shelf Sci. 39, 15–31. doi: 10.1006/ecss.1994.1046
Fekete, B. M., Vörösmarty, C. J., and Grabs, W. (2002). High-resolution fields of global runoff combining observed river discharge and simulated water balances. Global Biogeochem. Cycles 16, 15-11–15-10. doi: 10.1029/1999GB001254
Fernandes, L. L., Kessarkar, P. M., Suja, S., Ray, D., and Bhat, M. (2018). Seasonal variations in the water quality of six tropical micro- and meso-tidal estuaries along the central west coast of India. Marine Freshwater Res. 69, 1418–1431. doi: 10.1071/MF17181
Gallo, E. L., Meixner, T., Aoubid, H., Lohse, K. A., and Brooks, P. D. (2015). Combined impact of catchment size, land cover, and precipitation on streamflow and total dissolved nitrogen: A global comparative analysis. Global Biogeochem. Cycles 29, 1109–1121. doi: 10.1002/2015GB005154
Garnier, J., Beusen, A., Thieu, V., Billen, G., and Bouwman, L. (2010). N:P:Si nutrient export ratios and ecological consequences in coastal seas evaluated by the ICEP approach. Global Biogeochem. Cycles 24:3583. doi: 10.1029/2009GB003583
Gray, J. S., Wu, S.-S., and Or, Y. Y. (2002). Effects of hypoxia and organic enrichment on the coastal marine environment. Mar. Ecol. Prog. Ser. 238, 249–279. doi: 10.3354/meps238249
Hallock, P. (1988). “Interoceanic differences in foraminifera with symbiotic algae: A result of nutrient supplies?” in Proceedings of the 6th International Coral Reef Symposium, Australia (Townsville, QLD).
Hansen, M. C., Potapov, P. V., Moore, R., Hancher, M., Turubanova, S. A., Tyukavina, A., et al. (2013). High-resolution global maps of 21st-century forest cover change. Science 342:850. doi: 10.1126/science.1244693
Horbe, A. M. C., and Santos, A. G. D. S. (2009). Chemical composition of black-watered rivers in the western Amazon Region (Brazil). J. Braz. Chem. Soc. 20, 1119–1126. doi: 10.1590/S0103-50532009000600018
Howarth, R., Chan, F., Conley, D. J., Garnier, J., Doney, S. C., Marino, R., et al. (2011). Coupled biogeochemical cycles: eutrophication and hypoxia in temperate estuaries and coastal marine ecosystems. Front. Ecol. Environ. 9, 18–26. doi: 10.1890/100008
Howley, C., Devlin, M., and Burford, M. (2018). Assessment of water quality from the Normanby River catchment to coastal flood plumes on the northern Great Barrier Reef, Australia. Marine Freshwater Res. 69, 859–873. doi: 10.1071/MF17009
Intergovernmental Panel on Climate Change (2014). Climate Change 2014: Synthesis Report. Contribution of Working Groups I, II and III to the Fifth Assessment Report of the Intergovernmental Panel on Climate Change. Geneva.
Karl, D. M., and Björkman, K. M. (2015). “Dynamics of dissolved organic phosphorus,” in Biogeochemistry of Marine Dissolved Organic Matter (Second Edition), eds D. A. Hansell and C. A. Carlson (Boston, MA: Academic Press). doi: 10.1016/B978-0-12-405940-5.00005-4
Kebede, W., Tefera, M., Habitamu, T., and Alemayehu, T. (2014). Impact of land cover change on water quality and stream flow in Lake Hawassa watershed of Ethiopia. Agri. Sci. 5:13. doi: 10.4236/as.2014.58068
Keys, E., and McConnell, W. J. (2005). Global change and the intensification of agriculture in the tropics. Global Environ. Change 15, 320–337. doi: 10.1016/j.gloenvcha.2005.04.004
Küchler, I. L., Miekeley, N., and Forsberg, B. R. (2000). A contribution to the chemical characterization of rivers in the Rio Negro Basin, Brazil. J. Braz. Chem. Soc. 11, 286–292. doi: 10.1590/S0103-50532000000300015
Lachenbruch, P. A., and Goldstein, M. (1979). Discriminant analysis. Biometrics 35, 69–85. doi: 10.2307/2529937
Łaszewski, M., Fedorczyk, M, Gołaszewska, S., Kieliszek, Z., Maciejewska, P., Miksa, J., and Zacharkiewicz, W. (2021). Land cover effects on selected nutrient compounds in small lowland agricultural catchments. Land 10:182. doi: 10.3390/land10020182
Laurance, W. F., Sayer, J., and Cassman, K. G. (2014). Agricultural expansion and its impacts on tropical nature. Trends Ecol. Evol. 29, 107–116. doi: 10.1016/j.tree.2013.12.001
Ling, T.-Y., Soo, C.-L., Sivalingam, J.-R., Nyanti, L., Sim, S.-F., and Grinang, J. (2016). Assessment of the water and sediment quality of tropical forest streams in upper reaches of the Baleh River, Sarawak, Malaysia, Subjected to logging activities. J. Chem. 2016:8503931. doi: 10.1155/2016/8503931
Lucey, N., Haskett, E., and Collin, R. (2020). Multi-stressor extremes found on a tropical coral reef impair performance. Front. Marine Sci. 7, e588764. doi: 10.3389/fmars.2020.588764
Lucey, N. M., Collins, M., and Collin, R. (2020). Oxygen-mediated plasticity confers hypoxia tolerance in a corallivorous polychaete. Ecol. Evol. 10, 1145–1157. doi: 10.1002/ece3.5929
Mainstone, C. P., and Parr, W. (2002). Phosphorus in rivers — ecology and management. Sci. Total Environ. 282–283, 25–47. doi: 10.1016/S0048-9697(01)00937-8
Malhi, Y. (2012). The productivity, metabolism and carbon cycle of tropical forest vegetation. J. Ecol. 100, 65–75. doi: 10.1111/j.1365-2745.2011.01916.x
Meybeck, M. (1982). Carbon, nitrogen, and phosphorus transport by world rivers. Am. J. Sci. 282, 401–450. doi: 10.2475/ajs.282.4.401
Meybeck, M., and Moatar, F. (2012). Daily variability of river concentrations and fluxes: indicators based on the segmentation of the rating curve. Hydrol. Process. 26, 1188–1207. doi: 10.1002/hyp.8211
Ministerio de Ambiente (2012). Cobertura Boscosa y uso del suelo Panamá, año 2012 (1:50 000). MiAmbiente, ONUREDD, FAO. https://www.sinia.gob.pa/index.php/datos-abiertos-y-geoservicios
Morel, F. M. M., and Price, N. M. (2003). The biogeochemical cycles of trace metals in the oceans. Science 300, 944–947. doi: 10.1126/science.1083545
Muehlbauer, J. D., Larsen, S., Jonsson, M., and Emilson, E. J. S. (2020). “Variables affecting resource subsidies from streams and rivers to land and their susceptibility to global change stressors,” in Contaminants and Ecological Subsidies: The Land-Water Interface, eds J. M. Kraus, D. M. Walters, and M. A. Mills (Cham: Springer International Publishing). doi: 10.1007/978-3-030-49480-3_7
Murphy, J., and Riley, J. P. (1962). A modified single solution method for the determination of phosphate in natural waters. Anal. Chim. Acta 27, 31–36. doi: 10.1016/S0003-2670(00)88444-5
Nagy, G. J., Gómez-Erache, M., López, C. H., and Perdomo, A. C. (2002). “Distribution patterns of nutrients and symptoms of eutrophication in the Rio de la Plata River Estuary System,” in Nutrients and Eutrophication in Estuaries and Coastal Waters: Proceedings of the 31st Symposium of the Estuarine and Coastal Sciences Association (ECSA), held in Bilbao, Spain, eds E. Orive, M. Elliott, and N V. de Jonge (Dordrecht: Springer Netherlands). doi: 10.1007/978-94-017-2464-7_10
Neal, B., Condit, C., Liu, G., dos Santos, S., Kahru, M., Mitchell, B., et al. (2014). When depth is no refuge: cumulative thermal stress increases with depth in Bocas del Toro, Panama. Coral Reefs 33, 193–205. doi: 10.1007/s00338-013-1081-6
Ngoye, E., and Machiwa, J. F. (2004). The influence of land-use patterns in the Ruvu river watershed on water quality in the river system. Phys. Chem. Earth 29, 1161–1166. doi: 10.1016/j.pce.2004.09.002
Parsons, C. T., Rezanezhad, F., O'Connell, D. W., and Van Cappellen, P. (2017). Sediment phosphorus speciation and mobility under dynamic redox conditions. Biogeosciences 14, 3585–3602. doi: 10.5194/bg-14-3585-2017
Patey, M. D., Rijkenberg, M. J. A., Statham, P. J., Stinchcombe, M. C., Achterberg, E. P., and Mowlem, M. (2008). Determination of nitrate and phosphate in seawater at nanomolar concentrations. TrAC Trends Analy. Chem. 27, 169–182. doi: 10.1016/j.trac.2007.12.006
Phillips, S., Rouse, G. E., and Bustin, R. M. (1997). Vegetation zones and diagnostic pollen profiles of a coastal peat swamp, Bocas del Toro, Panama. Palaeogeogr. Palaeoclimatol. Palaeoecol. 128, 301–338. doi: 10.1016/S0031-0182(97)81129-7
Poikane, S., Kelly, M. G., Salas Herrero, F., Pitt, J.-A., Jarvie, H. P., Claussen, U., et al. (2019). Nutrient criteria for surface waters under the European Water Framework Directive: Current state-of-the-art, challenges and future outlook. Sci. Total Environ. 695:133888. doi: 10.1016/j.scitotenv.2019.133888
Poloczanska, E. S., Brown, C. J., Sydeman, W. J., Kiessling, W., Schoeman, D. S., Moore, P. J., et al. (2013). Global imprint of climate change on marine life. Nat. Clim. Chang. 3, 919–925. doi: 10.1038/nclimate1958
Poulton, S., and Raiswell, R. (2002). The low-temperature geochemical cycle of iron: from continental fluxes to marine sediment deposition. Am. J. Sci. 302, 774–805. doi: 10.2475/ajs.302.9.774
Rabalais, N. N. (2002). Nitrogen in aquatic ecosystems. Ambio 31, 102–112. doi: 10.1579/0044-7447-31.2.102
Rabalais, N. N., Turner, R. E., Díaz, R. J., and Justić, D. (2009). Global change and eutrophication of coastal waters. ICES J. Mar. Sci. 66, 1528–1537. doi: 10.1093/icesjms/fsp047
Ramsar (2016). An Introduction to the Ramsar Convention on Wetlands, 5th ed. (previously The Ramsar Convention Manual). Gland.
Ramsar (2020). Ramsar Sites Information Service: San San - Pond Sak. Available online at: https://rsis.ramsar.org/ris/611?language=en (accessed October 25, 2020).
Ríos-Villamizar, E., Piedade, M., Da Costa, J., Adeney, J., and Junk, W. (2014). Chemistry of Different Amazonian Water Types for River Classification: A Preliminary Review. Water and Society II. WIT Transactions on Ecology and The Environment. Boston, MA: Southampton. doi: 10.2495/WS130021
Ríos-Villamizar, E. A., Piedade, M. T. F., Junk, W. J., and Waichman, A. V. (2017). Surface water quality and deforestation of the Purus river basin, Brazilian Amazon. Int. Aquatic Res. 9, 81–88. doi: 10.1007/s40071-016-0150-1
Riskin, S. H., Neill, C., Jankowski, K., Krusche, A. V., McHorney, R., Elsenbeer, H., et al. (2017). Solute and sediment export from Amazon forest and soybean headwater streams. Ecol. App. 27, 193–207. doi: 10.1002/eap.1428
Rixen, T., Baum, A., Sepryani, H., Pohlmann, T., Jose, C., and Samiaji, J. (2010). Dissolved oxygen and its response to eutrophication in a tropical black water river. J. Environ. Manage. 91, 1730–1737. doi: 10.1016/j.jenvman.2010.03.009
Rosgen, D. L. (1994). A classification of natural rivers. CATENA 22, 169–199. doi: 10.1016/0341-8162(94)90001-9
Saatchi, S. S., Harris, N. L., Brown, S., Lefsky, M., Mitchard, E. T. A., Salas, W., et al. (2011). Benchmark map of forest carbon stocks in tropical regions across three continents. Proc. Nat. Acad. Sci. U.S.A. 108:9899. doi: 10.1073/pnas.1019576108
Salas, P. M., Sujatha, C. H., and Ratheesh Kumar, S. C. (2015). Fate and source distribution of organic constituents in a river-dominated tropical estuary. J. Earth Syst. Sci. 124, 1265–1279. doi: 10.1007/s12040-015-0598-1
Santos, D. A., and De Paula, F. C. F. (2019). Diel changes in aquatic biogeochemistry of a pristine stream receiving untreated urban sewage at Brazilian rainforest. Environ. Sci. Pollut. Res. 26, 12324–12334. doi: 10.1007/s11356-019-04386-w
SAS Institute (2021). JMP Documentation. Jmp Statistical Discovery From SAS, SAS Institute. Available online at: https://www.jmp.com/en_us/support/jmp-documentation.html (accessed July 4, 2021).
Schlesinger, W. H., Reckhow, K. H., and Bernhardt, E. S. (2006). Global change: The nitrogen cycle and rivers. Water Resour. Res. 42:4300. doi: 10.1029/2005WR004300
Seitzinger, S. P., and Sanders, R. W. (1997). Contribution of dissolved organic nitrogen from rivers to estuarine eutrophication. Mar. Ecol. Prog. Ser. 159, 1–12. doi: 10.3354/meps159001
Silva, M. A. M., Eça, G. F., Santos, D. F., Guimarães, A. G., Lima, M. C., and de Souza, L. M. F. (2013). Dissolved inorganic nutrients and chlorophyll a in an estuary receiving sewage treatment plant effluents: Cachoeira River estuary (NE Brazil). Environ. Monit. Assess. 185, 5387–5399. doi: 10.1007/s10661-012-2953-x
Sippo, J. Z., Lovelock, C. E., Santos, I. R., Sanders, C. J., and Maher, D. T. (2018). Mangrove mortality in a changing climate: An overview. Estuar. Coast. Shelf Sci. 215, 241–249. doi: 10.1016/j.ecss.2018.10.011
Sjögersten, S., Cheesman, A. W., Lopez, O., and Turner, B. L. (2011). Biogeochemical processes along a nutrient gradient in a tropical ombrotrophic peatland. Biogeochemistry 104, 147–163. doi: 10.1007/s10533-010-9493-7
Sjögersten, S., Siegenthaler, A., Lopez, O. R., Aplin, P., Turner, B., and Gauci, V. (2020). Methane emissions from tree stems in neotropical peatlands. New Phytol. 225, 769–781. doi: 10.1111/nph.16178
Slaughter, A. R., and Mantel, S. K. (2013). A simple and rapid method to relate land cover and river flow rate to river nutrient concentration. Phys. Chem. Earth 66, 131–138. doi: 10.1016/j.pce.2013.08.001
Smith, R. A., Schwarz, G. E., and Alexander, R. B. (1997). Regional interpretation of water-quality monitoring data. Water Resour. Res. 33, 2781–2798. doi: 10.1029/97WR02171
Smith, V. H. (2006). Responses of estuarine and coastal marine phytoplankton to nitrogen and phosphorus enrichment. Limnol. Oceanogr. 51, 377–384. doi: 10.4319/lo.2006.51.1_part_2.0377
Stallard, R. F., and Murphy, S. F. (2012). Water quality and mass transport in four watersheds in eastern Puerto Rico, Ch. E in. Water quality and landscape processes of Four Watersheds in Eastern Puerto Rico, eds. Murphy, S. F. and Stallard, R. F., Reston, VA: U.S. Geological Survey Professional Paper 1789, 113–151. doi: 10.3133/pp1789E
Stetson, S. J., Patton, C. J., Guaglione, N., and Chestnut, Z. (2019). Measurement of nutrients in saline and hypersaline waters by discrete analyzer colorimetry without matrix matched calibration standards. Talanta 203, 297–304. doi: 10.1016/j.talanta.2019.05.066
Stevenson, R. J., and Sabater, S. (2010). Understanding effects of global change on river ecosystems: science to support policy in a changing world. Hydrobiologia 657, 3–18. doi: 10.1007/s10750-010-0392-7
STRI GIS Laboratory (2011). Panama Road Network version 2011. - Feature Layer. Available online at: https://stridata-si.opendata.arcgis.com/pages/Our%20Data
Tanaka, Y., Minggat, E., and Roseli, W. (2021). The impact of tropical land-use change on downstream riverine and estuarine water properties and biogeochemical cycles: a review. Ecol. Proces. 10:40. doi: 10.1186/s13717-021-00315-3
Tejada, J. C. (1993). Apéndice 1: Coordenadas geográficas de la zona de San San. Programa de Humedales de la UICN para Panamá, Panamá.
Troxler, T. G., Ikenaga, M., Scinto, L., Boyer, J. N., Condit, R., Perez, R., et al. (2012). Patterns of soil bacteria and canopy community structure related to tropical peatland development. Wetlands 32, 769–782. doi: 10.1007/s13157-012-0310-z
Tucker, S. (2007). QuikChem Method 31-107-06-1-F Determination of ammonia brackish or seawater by flow injection analysis (phenate method) (citrate/tartrate buffer)(low flow method). Loveland, Colorado, USA.
Tucker, S. (2008). QuikChem Method 31-115-01-1-W Determination of orthophosphate by flow injection analysis, QC8500 only. Loveland, Colorado, USA.
Turner, R. E., and Rabalais, N. N. (1991). Changes in Mississippi river water quality this century. Bioscience 41, 140–147. doi: 10.2307/1311453
Valiela, I., Barth-Jensen, C., Stone, T., Crusius, J., Fox, S., and Bartholomew, M. (2013). Deforestation of watersheds of Panama: nutrient retention and export to streams. Biogeochemistry 115, 299–315. doi: 10.1007/s10533-013-9836-2
Valiela, I., Bartholomew, M., Giblin, A., Tucker, J., Harris, C., Martinetto, P., et al. (2014). Watershed deforestation and down-estuary transformations alter sources, transport, and export of suspended particles in Panamanian mangrove estuaries. Ecosystems 17, 96–111. doi: 10.1007/s10021-013-9709-5
Valiela, I., and Bowen, J. L. (2002). Nitrogen sources to watersheds and estuaries: role of land cover mosaics and losses within watersheds. Environ. Pollut. 118, 239–248. doi: 10.1016/S0269-7491(01)00316-5
Vegas-Vilarrúbia, T., Paolini, J. E., and Miragaya, J. G. (1988). Differentiation of some Venezuelan blackwater rivers based upon physico-chemical properties of their humic substances. Biogeochemistry 6, 59–77. doi: 10.1007/BF00002933
Vitousek, P. M. (1994). Beyond global warming: ecology and global change. Ecology 75, 1861–1876. doi: 10.2307/1941591
Waycott, M., Duarte, C. M., Carruthers, T. J. B., Orth, R. J., Dennison, W. C., Olyarnik, S., et al. (2009). Accelerating loss of seagrasses across the globe threatens coastal ecosystems. Proc. Nat. Acad. Sci. U.S.A. 106:12377. doi: 10.1073/pnas.0905620106
Weinstock, J. B., and Collin, R. (2021). Hypoxia and warming are associated with reductions in larval bivalve abundance in a tropical lagoon. Mar. Ecol. Prog. Ser. 662, 85–95. doi: 10.3354/meps13630
White, J. (2003). QuikChem Method 12-107-04-1-G Determination of Nitrate by Flow Injection Analysis. Loveland, Colorado, USA.
Wickham, J. D., Riitters, K. H., O'Neill, R. V., Reckhow, K. H., Wade, T. G., and Jones, K. B. (2000). Land cover as a framework for assessing risk of water pollution. JAWRA 36, 1417–1422. doi: 10.1111/j.1752-1688.2000.tb05736.x
Wickham, J. D., and Wade, T. G. (2002). Watershed level risk assessment of nitrogen and phosphorus export. Comp. Electr. Agri. 37, 15–24. doi: 10.1016/S0168-1699(02)00117-5
Wiseman, W. J., Rabalais, N., Turner, R., Dinnel, S., and MacNaughton, A. (1997). Seasonal and interannual variability within the Louisiana coastal current: stratification and hypoxia. J. Marine Syst. 12, 237–248. doi: 10.1016/S0924-7963(96)00100-5
World Health Organization (1978). Nitrates, Nitrites, and N-Nitroso Compounds-Environmental Health Criteria 5. Geneva: United Nations Environment Programme, World Health Organization.
Young, R. G., Quarterman, A. J., Eyles, R. F., Smith, R. A., and Bowden, W. B. (2005). Water quality and thermal regime of the Motueka River: Influences of land cover, geology and position in the catchment. N. Z. J. Mar. Freshwater Res. 39, 803–825. doi: 10.1080/00288330.2005.9517354
YSI Inc. (2009). Professional Plus User Manual. https://www.ysi.com/File%20Library/Documents/Manuals/605596-YSI-ProPlus-User-Manual-RevD.pdf
Keywords: river physical-chemical condition, river nutrients, peat swamp, land-ocean interface, Caribbean Panamá, land use and land cover (LULC), tropical estuary, hypoxia
Citation: Clark KE, Bravo VD, Giddings SN, Davis KA, Pawlak G, Torres MA, Adelson AE, César-Ávila CI, Boza X and Collin R (2022) Land Use and Land Cover Shape River Water Quality at a Continental Caribbean Land-Ocean Interface. Front. Water 4:737920. doi: 10.3389/frwa.2022.737920
Received: 07 July 2021; Accepted: 03 February 2022;
Published: 11 March 2022.
Edited by:
Karsten Rinke, Helmholtz Association of German Research Centres (HZ), GermanyReviewed by:
Anna Lintern, Monash University, AustraliaCopyright © 2022 Clark, Bravo, Giddings, Davis, Pawlak, Torres, Adelson, César-Ávila, Boza and Collin. This is an open-access article distributed under the terms of the Creative Commons Attribution License (CC BY). The use, distribution or reproduction in other forums is permitted, provided the original author(s) and the copyright owner(s) are credited and that the original publication in this journal is cited, in accordance with accepted academic practice. No use, distribution or reproduction is permitted which does not comply with these terms.
*Correspondence: Kasey E. Clark, a2FzZXkuY2xhcmtAbGl2ZXJwb29sLmFjLnVr
†Present address: Kasey E. Clark, Department of Geography and Planning, University of Liverpool, Liverpool, United Kingdom
Disclaimer: All claims expressed in this article are solely those of the authors and do not necessarily represent those of their affiliated organizations, or those of the publisher, the editors and the reviewers. Any product that may be evaluated in this article or claim that may be made by its manufacturer is not guaranteed or endorsed by the publisher.
Research integrity at Frontiers
Learn more about the work of our research integrity team to safeguard the quality of each article we publish.