
95% of researchers rate our articles as excellent or good
Learn more about the work of our research integrity team to safeguard the quality of each article we publish.
Find out more
ORIGINAL RESEARCH article
Front. Water , 19 January 2023
Sec. Environmental Water Quality
Volume 4 - 2022 | https://doi.org/10.3389/frwa.2022.1085285
This article is part of the Research Topic Plastics Pollution in Water Environments: Occurrence, Transport, Fate, and Behaviour View all 3 articles
 Sjoukje I. de Lange1*
 Yvette Mellink1
 Paul Vriend2
 Paolo F. Tasseron1
 Finn Begemann1
 Rahel Hauk1Heleen Aalderink1
 Eric Hamers3Peter Jansson1Nonna Joosse1Ansje J. Löhr4
 Romi Lotcheris1
 Louise Schreyers1Vivien Vos1
 Tim H. M. van Emmerik1
Anthropogenic litter is omnipresent in terrestrial and freshwater systems, and can have major economic and ecological impacts. Monitoring and modeling of anthropogenic litter comes with large uncertainties due to the wide variety of litter characteristics, including size, mass, and item type. It is unclear as to what the effect of sample set size is on the reliability and representativeness of litter item statistics. Reliable item statistics are needed to (1) improve monitoring strategies, (2) parameterize litter in transport models, and (3) convert litter counts to mass for stock and flux calculations. In this paper, we quantify sample set size requirement for riverbank litter characterization, using a database of more than 14,000 macrolitter items (>0.5 cm), sampled for 1 year at eight riverbank locations along the Dutch Rhine, IJssel, and Meuse rivers. We use this database to perform a Monte Carlo based bootstrap analysis on the item statistics, to determine the relation between sample size and variability in the mean and median values. Based on this, we present sample set size requirements, corresponding to selected uncertainty and confidence levels. Optima between sampling effort and information gain is suggested (depending on the acceptable uncertainty level), which is a function of litter type heterogeneity. We found that the heterogeneity of the characteristics of litter items varies between different litter categories, and demonstrate that the minimum required sample set size depends on the heterogeneity of the litter category. This implies that more items of heterogeneous litter categories need to be sampled than of heterogeneous item categories to reach the same uncertainty level in item statistics. For example, to describe the mean mass the heterogeneous category soft fragments (>2.5 cm) with 90% confidence, 990 items were needed, while only 39 items were needed for the uniform category metal bottle caps. Finally, we use the heterogeneity within litter categories to assess the sample size requirements for each river system. All data collected for this study are freely available, and may form the basis of an open access global database which can be used by scientists, practitioners, and policymakers to improve future monitoring strategies and modeling efforts.
Anthropogenic litter (hereinafter called litter) is omnipresent in the natural environment and has major economic consequences such as damage to vessels, and ecological impacts including ingestion and entanglement (Lau et al., 2020; van Emmerik and Schwarz, 2020). Litter is defined as any solid manufactured waste item that enters the environment through intentional or unintentional improper disposal (McCormick and Hoellein, 2016). In response to these threats many efforts have been made to reduce the amount of litter in the natural environment. Understanding and quantifying litter sources, transport, and accumulation processes may increase the efficacy of prevention and reduction efforts. Previous studies have demonstrated that the transport and accumulation of litter in water, both in the vertical and horizontal dimension, strongly depends on the interaction between the fluid dynamics and the characteristics of the litter (Morales-Caselles et al., 2021; Kuizenga et al., 2022). For example, the settling rate and transport of litter in water is affected by the density, surface area, and size of the litter (Kukulka et al., 2012; Chubarenko et al., 2016; Kowalski et al., 2016; Schwarz et al., 2019). Pedrotti et al. (2016) observed that in the Mediterranean Sea the abundance of high-density polymers decreased when moving away from the coast. Furthermore, wind driven transport of litter on land strongly depends on the density, shape, and size of litter items as well (Garello et al., 2021; Mellink et al., 2022a,b). Finally, the retention of litter in (riparian) vegetation depends on the size and shape of the litter (Cesarini and Scalici, 2022). To improve our understanding of the behavior of litter in the natural environment, such as litter transport pathways and fate, and to improve litter monitoring and modeling, it is therefore essential to identify the variability litter characteristic and the corresponding statistics, and the implications of this variability for sampling efforts.
Litter is a heterogeneous entity (Roebroek et al., 2021), as it comes in many shapes (Ballerini et al., 2022), varying in size, mass, density, and the rate at which it degrades over time (Delorme et al., 2021). Uncertainty arises when a generalized value, such as an average, is used to represent a heterogeneous variable like litter (Schwarz et al., 2019). However, it is unclear what the relation is between sample set size and reliability and representativeness of the statistics. Reliable item statistics are needed to improve monitoring efficiency, when determining how many items need to be sampled to characterize a system. Furthermore, transport models should be parameterized with reliable item category statistics, since litter transport and retention dynamics strongly depend on the material characteristics. Roebroek et al. (2022) show that litter transport model uncertainty decreases with several orders of magnitude with increasing availability of litter data. Consequently, litter transport models that do not accurately capture litter heterogeneity, inevitably feature a greater level of uncertainty. Furthermore, litter heterogeneity introduces additional uncertainties in the conversion of litter amounts (and fluxes) to mass (per unit time), and vice versa (Van Calcar and van Emmerik, 2019). Such conversions often rely on generalized litter masses to convert the observed number of items to a total mass (Vriend et al., 2020b). For specific rivers the uncertainty can be several orders of magnitude (Roebroek et al., 2022). Due to the heterogeneous nature of litter, a generalized conversion factor based on generalized litter masses, induces higher uncertainty, and consequently a representative value per litter type is ideally needed.
To obtain a representative value per litter type, a representative sample size is needed. Many scientific disciplines notice the relation between sample size and some sort of measurement of error (e.g., Lamé and Defize, 1993; Cardini and Elton, 2007; Hennig and Cooper, 2011; Maggio and Franklin, 2020) and sample size determination is considered an important step in protocol design (Lenth, 2001). Where undersized studies produce useless results, oversized studies use more resources than necessary (Lenth, 2001). Especially in the highly dynamic riverine environment, uncertainty can increase if the sample size is not large enough, while resource investments are limited (Droppo and Jaskot, 1995; Bartsch et al., 1998). Additionally, potential measurement errors increase the need for a larger sample size (Freedman et al., 1990). In litter studies this could include errors such as misinterpretation or misclassification of an object by the observer. All studies notice a decrease in error or uncertainty when sample size increases, and most studies advocate for a larger sample size. Deciding the trade-offs between sample size and required statistical certainty, requires technical, statistical, and scientific knowledge (Lenth, 2001). Therefore, a way to describe minimal required sample size is needed. A way to assess this, would be comparing the “true value” of the desired parameter, to a subset of the sample and study the resulting deviation in parameter value (Cardini and Elton, 2007), which could be investigated using a Monte Carlo Bootstrap analysis (e.g., Bauer, 1958; Kim, 2012; Constantin et al., 2021). However, such an analysis has never been done for litter studies, and suggestions for the sample size have not been made. This study presents an approach to determine what sample size is needed for representative and reliable litter statistics, based on a Monte Carlo Bootstrap analysis. This analysis is based on a dataset containing the characteristics (item category, length, width, and mass) of more than 14,000 riverbank litter items. We found that increasing the sample set size decreases the uncertainty in the sampled litter statistics. However, it was found that reducing uncertainty through increasing sample set size, levels off beyond a certain sample set size. We also found that the heterogeneity of the characteristics of litter items varies between different litter categories and demonstrate that the minimum required sample set size depends on the heterogeneity of the litter category. With the dataset and analysis presented in this study we aim to contribute to improving the efficiency of litter monitoring strategies, the accuracy of litter transport models, and the conversion of litter item counts to litter masses for stock and flux calculations.
The catchments of the studied rivers Rhine, IJssel, and Meuse (Figure 1), are heavily industrialized and densely populated (~300 inhabitants/km2) (van der Wal et al., 2013). The river Rhine (Bovenrijn) enters the Netherlands at Spijk, 161 km from the river mouth. At 147 km the Rhine bifurcates into the Waal (67% of the discharge), Nederrijn (22%), and IJssel (11%) (Schielen et al., 2007). The Waal and Nederrijn then converge at 42 km from the river mouth. The river Meuse enters the Netherlands at Eijsden, 250 km from the river mouth, and discharges 10% of the mean discharge of the Rhine-system (230 and 2,200 m3/s, respectively). Near the coast (~80 km from the sea), the branches of the Rhine and Meuse systems converge and intertwine. Ultimately, the Rhine-Meuse system drains into the North Sea, while the river IJssel drains into lake IJssel after 125 km.

Figure 1. The study area (A) with the sample areas (Google Earth; Landsat and Copernicus). (B) The white line has a length of 100 m. Supplementary material B provides more detailed information on the riverbanks. Sampling locations are chosen at the upstream and downstream end of the Dutch part of the river Rhine (R), Meuse (M), and IJssel (IJ). The river Meuse has an additional midpoint measurement, and the river Rhine has an additional sampling area beyond the first major bifurcation. The sampling areas at Nijmegen (R1; sandy; 130 km from the mouth), Arnhem (R2; sandy; 130 km from the mouth), and Rotterdam (R3; stones; 30 km from the mouth) characterize the river Rhine, Arnhem (IJ1; sandy; 125 km from the mouth) and Kampen (IJ2; vegetated; 16 km from the mouth) characterize the river IJssel, and the river Meuse was sampled at a location in Maastricht (M1; vegetated; 250 km from the mouth), Ravenstein (M2; vegetated; 138 km from the mouth), and Moerdijk (M3; vegetated; 56 km from the mouth).
Sampling locations were chosen to be at the upstream and downstream end of the Dutch section of the rivers Rhine (R), Meuse (M), and IJssel (IJ) (Figure 1). Supplementary material A provides a detailed description of the sampling areas. The sampling areas at Nijmegen (R1) and Rotterdam (R3) are located along the river Rhine, while Arnhem (R2) is located at the Nederrijn beyond the first major bifurcation of the Rhine. Arnhem (IJ1) and Kampen (IJ2) are situated on the river IJssel, while the river Meuse was sampled at locations in Maastricht (M1), Ravenstein (M2), and Moerdijk (M3). Location M3 is located beyond the point where the rivers Rhine and Meuse merge, and is therefore affected by both river systems. Location M3 and R3 are in the tidal zone, and can therefore be subject to bidirectional currents.
Riverbank macrolitter was collected once per month between January and December 2021 at eight riverbank sites. Location R2 was sampled only in January and December, and location M1 was not sampled in January due to limited sample collection and processing capacity. The width of the sampling area was defined as the distance from the waterline to the high waterline, having a maximum value of 25 m (van Emmerik et al., 2020). The waterline is defined here as the interface between the river and the riverbank. The high waterline can be identified in the field by the fact that a proportion of the organic matter floating at the river surface is deposited at this elevation along the water margin once the peak flow begins to recede. Sampling was carried out until one of the following criteria was met: (1) coverage of 100 m length, (2) collection of material equaling 80 L, or (3) a sampling time exceeding 90 min. These limits were set based upon the availability of surveyors for the sample collection, the state of the riverbank (the required sampling time can be considerably higher if there is dense vegetation), and available capacity for subsequent laboratory analysis of the sampled material. The width of the sampled locations varied between 1 and 10 m and the length between 10 and 100 m. It should be noted that riverbank sampling is biased toward larger items, since smaller items are more difficult to identify by eye (Hanke et al., 2019), hence statistics for the smaller macrolitter items (<1 cm) should be taken with caution.
Collected samples were analyzed in the Laboratory for Water and Sediment Dynamics at Wageningen University. First, the items were manually and superficially cleaned of sediment and organic debris to preserve the state in which they were sampled. Items may have fragmented during transport, which may have led to more litter items being analyzed in the laboratory than originally sampled. Second, the items were categorized using the River-OSPAR protocol (Supplementary material B), developed by the North Sea Foundation (van Emmerik et al., 2020). This protocol is based on the OSPAR guidelines for beach litter monitoring (OSPAR Commission, 2010), with adjusted categories to better account for items frequently found in (Dutch) rivers. The protocol includes 111 specific item categories, divided over nine parent categories (i.e., plastic, rubber, textile, paper, wood, metal, glass, sanitary, and medical items). The River-OSPAR categorization system gives a detailed overview of the abundance of various types of litter. To facilitate direct comparison with other categorization methods in future research efforts, we included a “conversion table” (Supplementary material F) for rapid re-categorization in one of the other published categorization methods (Nally et al., 2017; Kiessling et al., 2019; Schwarz et al., 2019; Vriend et al., 2020a; Fleet et al., 2021).
Finally, we determined the mass, length, and width of the 14,052 items sampled between January and May, and in the months of August and November. Due to limited resources, items were not analyzed in the other months. The mass was weighed on a scale (0.01 g accuracy). In case individual items did not reach the minimum detectable mass, multiple items of the same category were weighed collectively, and a mean value assigned to each. For item length and width, the two longest axes were measured with 0.1 cm accuracy.
Category heterogeneity Ψ [–] was used to assess item category variability. This represents the normalized standard deviation (also known as coefficient of variation) and is defined as
in which σ is the standard deviation and μ is the mean of a certain category parameter, such as item length or mass.
The number of items needed to accurately represent category statistics depends on the category heterogeneity. We studied the relation between statistical uncertainty and sample size, which can be used to determine how many items are required for a representative and reliable value of the mean item mass across all riverbanks (sample set size requirement, SSR). A representative value means that the subset of the population accurately reflects the characteristics of the full population, while a reliable value means that the method to determine this value consistently has the same outcome. To this end, we randomly drew a subset from the total set and calculated the mean mass. The size of the subset ranged from one item to all items in the total set. Next, a Monte Carlo based bootstrap analysis was performed 10,000 times for each subset size to determine the deviation of the subset from the dataset mean. From these runs, we calculated the 50, 75, 90, and 95% confidence intervals. These simulations were run using all litter categories lumped together, and for each single item category with more than 10 sampled items (59 out of 111 item categories, representing 89% of the total number of items). In this way, the number of items needed to give a representative estimate (within a certain confidence interval) of the mean mass of an item category could be determined. A deviation of 5, 10, or 20% of the actual mean value (the mean mass based on the whole category) is given. All subsequent analysis was performed for the 90% confidence interval with a 10% deviation from mean, and the results might change for different combinations of those. Finally, the same analysis was carried out to calculate the values for median mass and mean length for all items, and as an example for two item categories (soft fragments >2.5 cm and metal bottle caps). This analysis could be performed for other item variables (e.g., length, width) and statistics (median) as well, but was considered out of scope for the present study.
The concept of litter heterogeneity and SSRs per item category can be upscaled to a riverbank location or even a whole river-system, to allow for characterization of heterogeneity at various scales. The heterogeneity of a location or a river system is based on the items found in this system, and the corresponding SSRs. Based on the SSR for a 90% confidence interval and a deviation of 10% from the mean, an item category is defined as homogeneous, heterogeneous, or mixed based on the median SSR, the median SSR, and mean SSR of all categories:
in which μ is the mean and η the median of SSRi. SSRi is the sample set size requirement for item category i, while SSRall represents the SSRs of the whole population.
Finally, if less than 10 items were collected, no SSR was calculated, and the item heterogeneity was left undefined. All items found within a system were classified this way, and subsequently the ratio between homogeneous, mixed, heterogeneous, and undefined items were determined on multiple scales. This allowed for comparison between the riverbank locations, and between the Meuse, Rhine, and IJssel river systems.
In total 16,488 items (184 kg) were collected and categorized from eight riverbanks over 12 months, of which 14,052 (85%) were measured and weighed. For a detailed description of the length distribution of the items, see Supplementary material E. The majority of items were plastics (70% of item count, 33% of total mass) and mainly composed of unidentifiable plastic fragments (50% of all items) (Table 1). This result is in line with the findings of van Emmerik et al. (2020), who found 55.8% of riverbank litter items to be fragments along the Dutch Rhine-Meuse system. Although plastic dominates the collected item count (Table 1), local spatial variations exist (Figure 2). This can mainly be contributed to the type and use of riverbank (Supplementary material A), which play a role in which items are trapped and retained (Liro et al., 2022). For example, recreational areas, such as R1, show a lower percentage of plastic items (for example only 15% of item counts for R1) and are dominated by consumer items such as cigarette filters, metal bottle caps, and glass bottles.
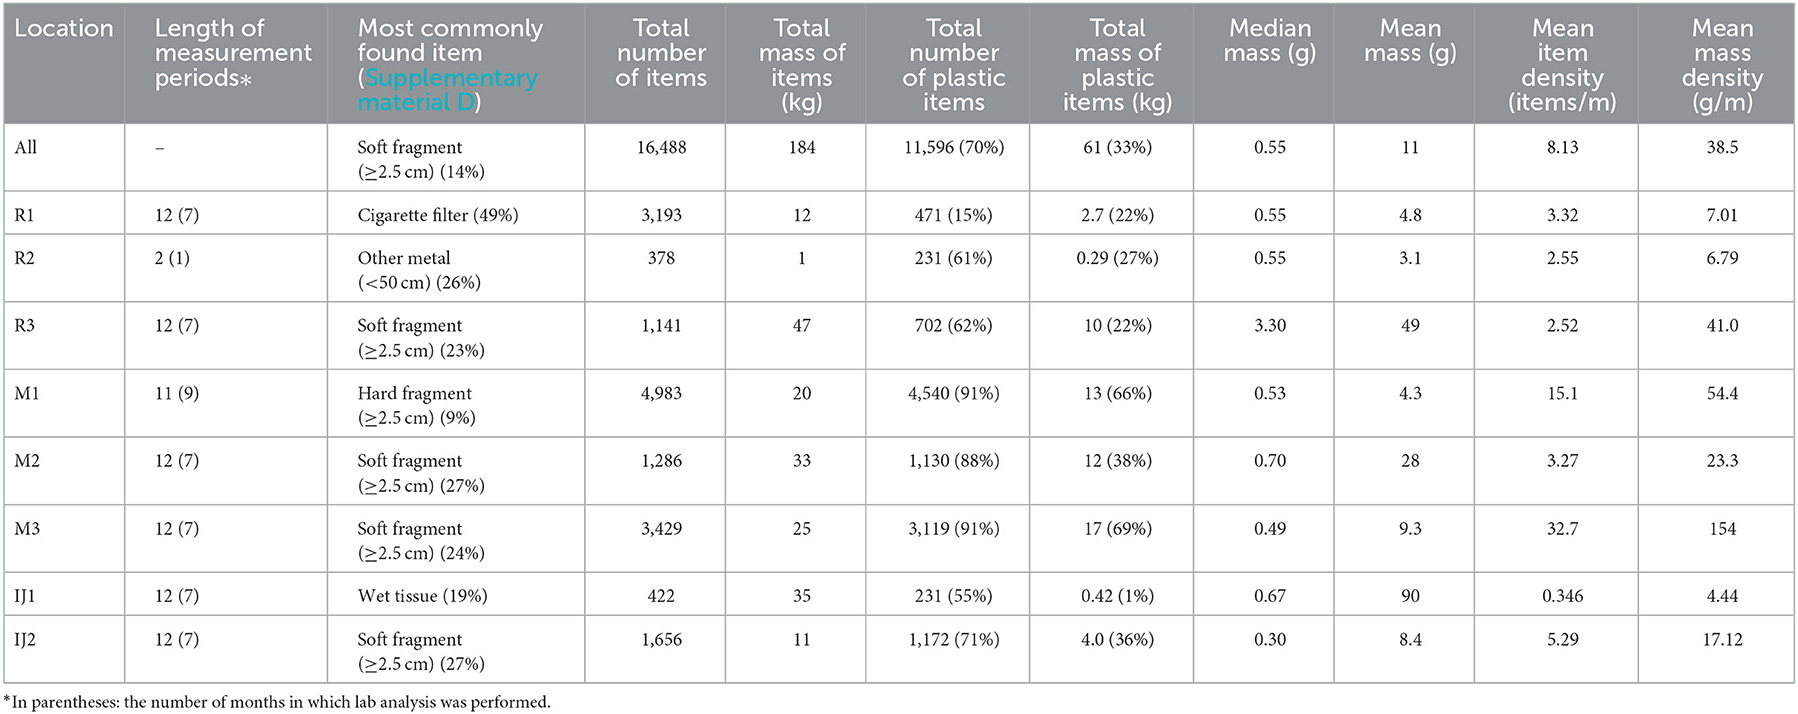
Table 1. Statistics of all the collected litter.
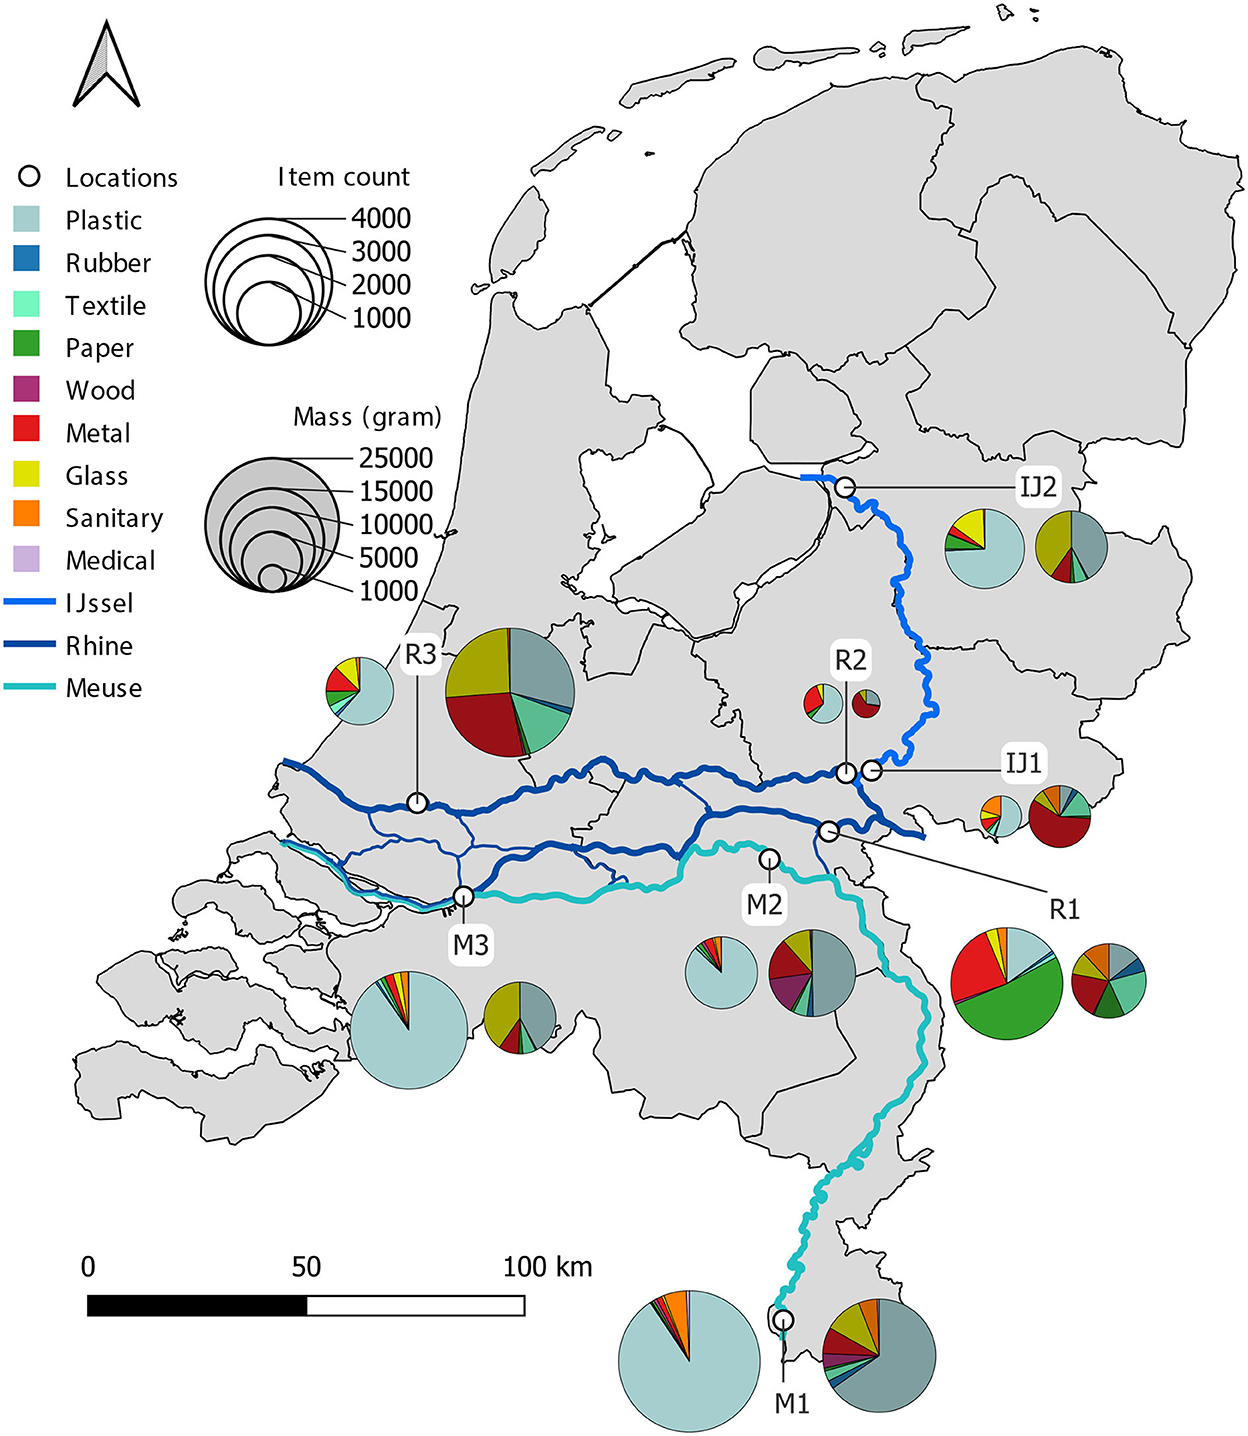
Figure 2. Map showing the eight riverbank locations along the Dutch Rhine (R1, R2, and R3), Meuse (M1 and M2), and IJssel (IJ1 and IJ2) rivers. For each location, the total number of litter items (left pie chart) and the total mass of litter items (right pie chart) found for the nine parent litter categories (plastic, rubber, textile, paper, wood, metal, glass, sanitary, and medical) is shown. The diameters of the pie charts indicate the total amount and mass of the items.
The average item mass was 11.1 g (6.1 g for plastics), and the median mass was 0.55 g (0.53 g for plastics) (Table 1). The summarizing statistics per item category can be found in Supplementary material C. The difference between the mean and median mass indicated a highly positively skewed distribution with many light items and relatively few heavy outliers. The large number of fragments (for example soft fragments, hard fragments, foam fragments) are responsible for this skewedness (Figure 3A). Heavy outliers include items of scrap metal such as bikes, and metal pipes (Figure 3B). The skewed distribution may have far reaching consequences for setting up a mass-balance using only summarizing statistics. For example, estimates of floating plastic flux, based upon items per hour (which is subsequently converted to mass per year), can differ by an order of magnitude when using either the mean or the median mass for this conversion (van Emmerik et al., 2022).
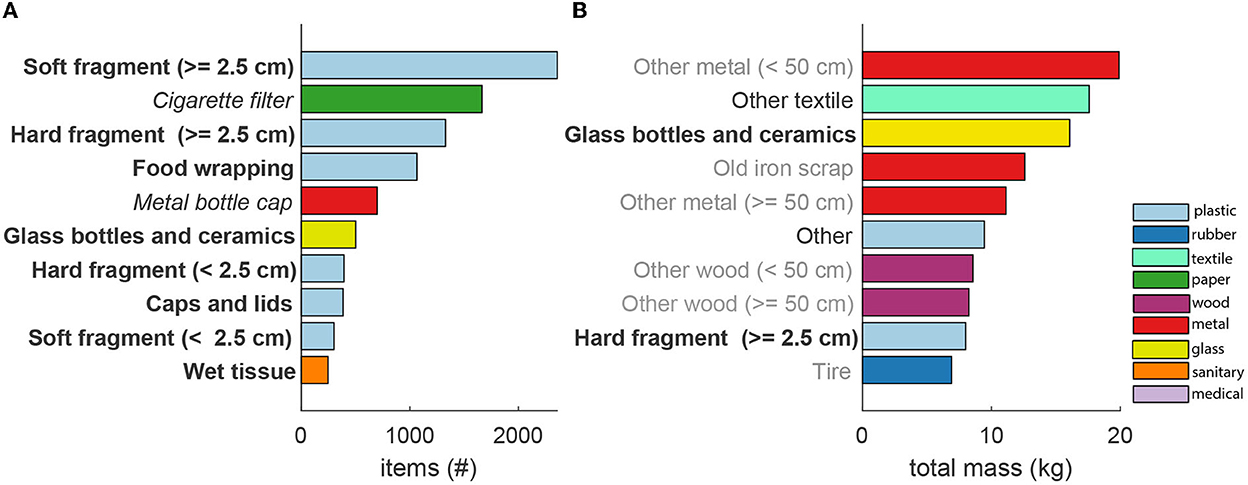
Figure 3. List of the top 10 most frequently found items based upon (A) item amount and (B) mass. Item categories are defined as homogeneous (italic), heterogeneous (bold), mixed (normal), or undefined (gray) based on the analysis below.
The 10 most frequently found items (Figure 3) represent 56% of the total amount of items and 65% of the total mass. The 20 most abundant items represent 66% of the total item count and 87% of the total mass, respectively. The top 10 items vary strongly when considering the item count or mass as demonstrated in Figure 3. In terms of frequency, plastic fragments, food packaging, and items related to consumables and cigarette filters are the most abundant categories (Figure 3A). In terms of mass, the top 10 items mainly consist of higher-density items such as metal (mean mass 41 g), wood (mean mass 176 g), and glass (mean mass 27 g) (Figure 3B). This discrepancy between abundance in count and mass emphasizes the importance of mass statistics for reliable estimates of litter mass balances. Although accumulated material on riverbanks is often expressed in item count per surface area, item mass per surface area is more relevant for closing the mass balance. Considering that items will likely increase over time due to fragmentation, we consider item mass per surface area a more appropriate indicator for riverbank litter accumulation.
Item characteristics in the dataset can vary significantly within and between litter categories. To be able to give an accurate measure of mean, median, and standard deviation of litter item categories (Supplementary material C), the sample size must be large enough to capture the mass and length variability within a category. The number of items needed to accurately represent category statistics (within a certain uncertainty level), depends on the heterogeneity of the category. Aggregated categories in the River-OSPAR system (e.g., soft fragments larger than 2.5 cm), may have large variability in item mass and size. For categories consisting of relatively uniform items (e.g., cigarette filters) this may be the opposite. The variability within a category can be characterized by a category heterogeneity Ψ (Equation 1) and is presented as histograms of length and mass (Figure 4). Wider distributions, such as that of soft and hard fragments, belong to more heterogeneous item categories, which is reflected in Ψ (1.03 and 0.92 for item length, respectively). Note the axis scale break in the x-axes of Figures 4F–J, which indicate a wider histogram than inferred from the visible histogram. Narrower distributions, such as cigarette filters and metal bottle caps are described by a lower category heterogeneity (Ψ = 0.08 and Ψ = 0.14 for item length, respectively). Item heterogeneity is one of the most important factors that determines how many items should be sampled to obtain representative item statistics and these SSRs are discussed below.
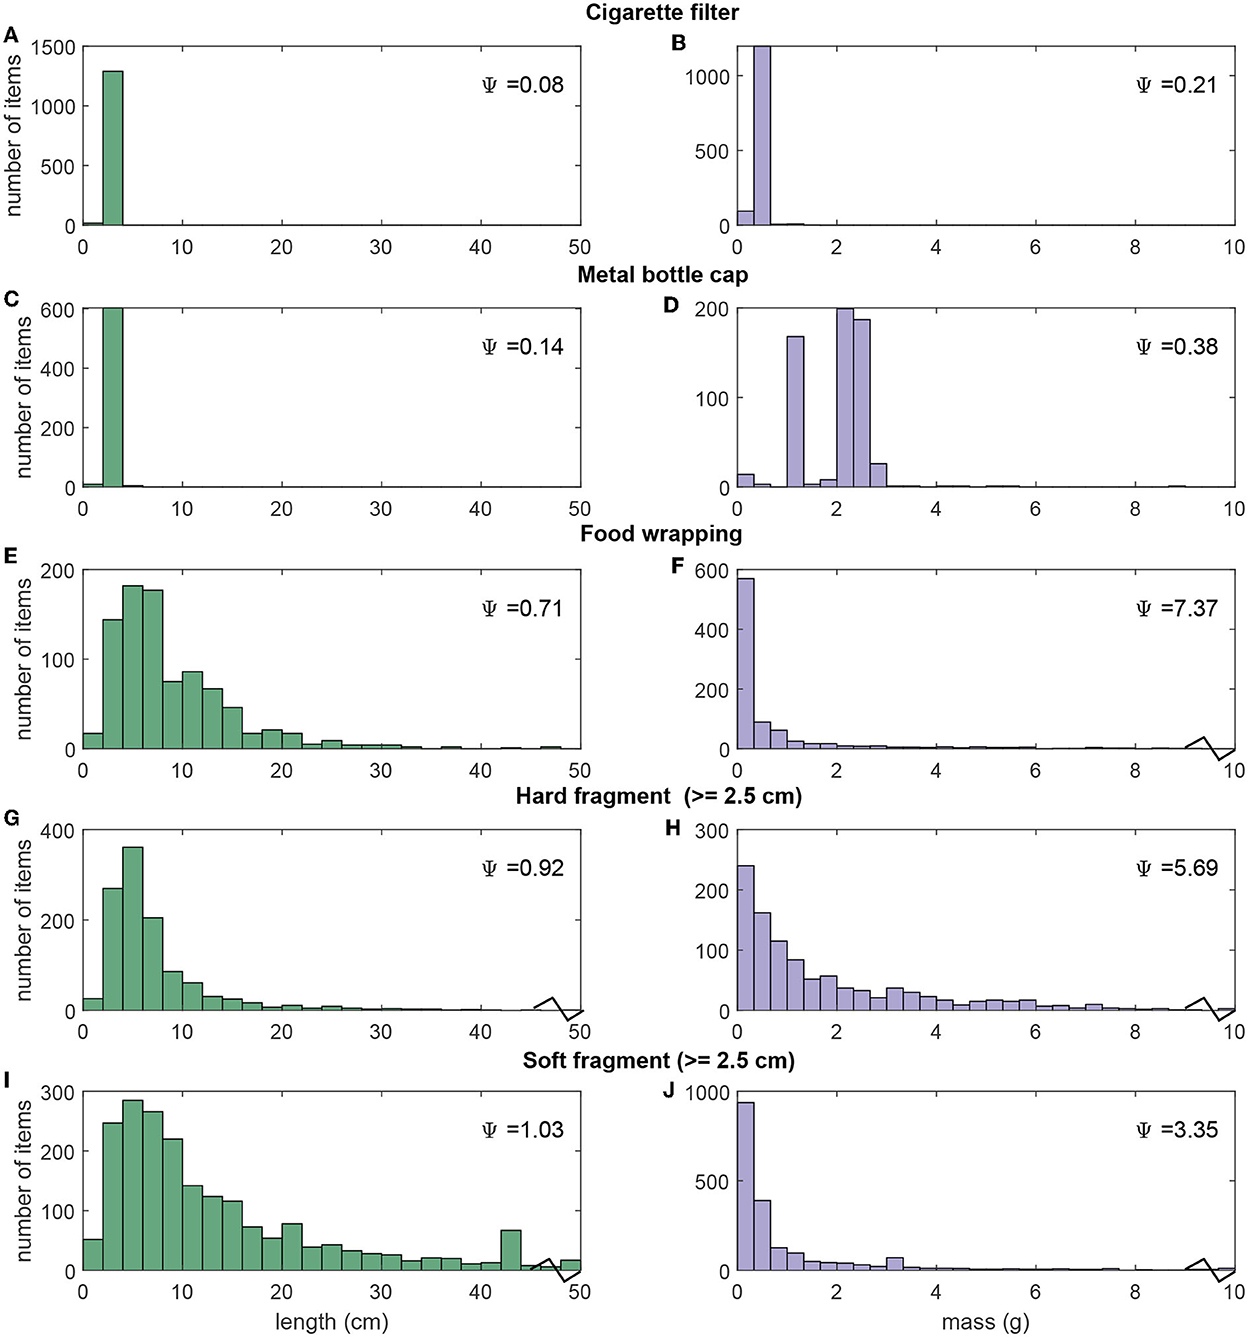
Figure 4. (A–J) Length (left column, green) and mass (right column, purple) distribution of the five most commonly found items, and their corresponding category heterogeneity Ψ. The scale break in the x-axis of panels indicate a wider histogram than inferred from the visible histogram.
By collecting more litter items, the item statistics (such as median and mean mass or length for example) become less uncertain, and this is especially relevant for heterogeneous litter categories. The amount of statistical uncertainty decreases with increasing sample size, meaning that the possible range of outcomes of the mean or median from the subset, differs increasingly less from the total population. However, uncertainty shows an inverse exponential decrease with sample size. Larger sample sizes only reduce statical uncertainty to a minor extent after a certain threshold. This threshold represents the minimum number of item samples that is required in order to obtain a representative number (within certain confidence bounds) of mass and length statistics.
To describe the mean mass of all litter at the sample locations with a maximum deviation of 10% of the mean based upon the total population with 90% confidence, at least 8,900 items need to be sampled and measured (63% of the total amount of weighed items). To capture the representative mean length 1,200 items (9%) need to be collected, while only 173 items (1%) are needed to describe the median mass (Figures 5A–D). The more heterogeneous an item category, the more samples need to be collected to obtain representative mass and length statistics. An example for the SSR of a homogeneous and a heterogeneous subclass is presented for the heterogeneous category “soft fragments larger than 2.5 cm,” 990 items (42% of full sample) are needed to find a mean mass (within 10% of the mean mass based on the full population) with 90% confidence (Figures 5E–H). When determining the mean mass of homogeneous item categories such as “metal bottle caps” (Figures 5I–L), only 38 (6% of full sample) items suffice.
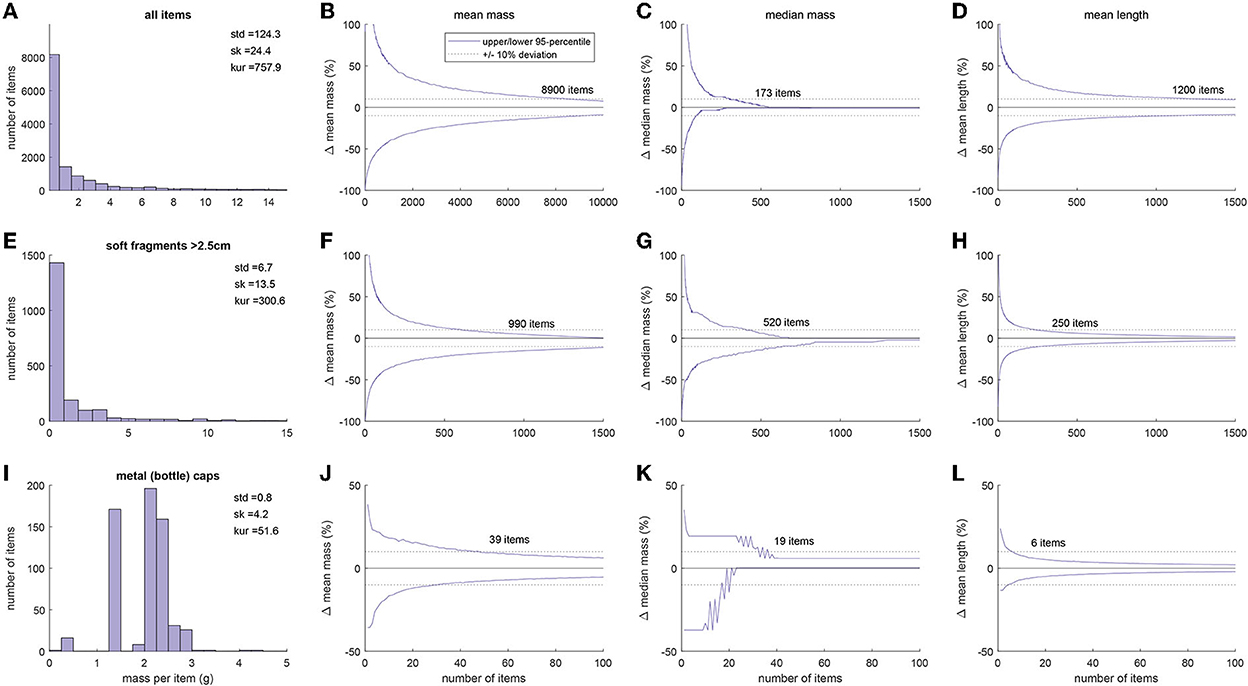
Figure 5. Examples of the sampling size requirement based on all items (A–D), soft fragments >2.5 cm (E–H), and bottle caps (I–L). The sampling size requirement is shown for an accurate representation of mean mass (B, F, J), median mass (C, G, K), and mean length (D, H, L), based on a 95% confidence interval, represented as a deviation from the value based on the complete dataset. The dashed horizontal lines indicate ±10%. In (A, E, I) the distribution of the items is shown, including the standard deviation (std), skewness (sk), and kurtosis (kur), indicating item class homogeneity.
The number of samples to be collected and measured depends on the acceptable confidence boundary and a maximum level of deviation from the mean of the total population. In the aforementioned examples, a maximum deviation of 10% was allowed and estimated with 90% confidence. With these conditions, an accurate representation of the mean mass of food packaging is reached when 150 items are measured. However, if a deviation of ±20% is permitted, only 110 items are needed to reach the uncertainty required. Similarly, if a confidence boundary of 50% is permitted, only 95 items are required to represent the mean mass (±10%). The level of confidence and maximum level of deviation allowed therefore impact the SSR.
We show the SSR of 59 item categories with more than 10 items in Table 2, which may be used in to find a balance between statistical uncertainty and sampling effort in future monitoring efforts. These 59 item categories make up 89% of total amount of collected items. The mean SSR equals 158 items, while the median equals 40 items. Our dataset does not include sufficient samples for all categories to provide an estimate of the mean mass within the selected confidence boundaries and deviations of the mean in this study. When the number of items needed to represent the mean mass is equal to the total number of items collected (indicated by the red shade in Table 2), or when a level of uncertainty (confidence boundary and deviation from the mean) is never reached (represented by N/A in Table 2), it is not possible to provide a SSR. For the highest confidence boundary (95%) and lowest deviation from mean (5%), this is the case for 37 items categories. Table 2 also shows the category heterogeneity for each item category, calculated based upon the available dataset, even if it was not sufficiently large enough to determine SSRs. As demonstrated in the aforementioned examples, to obtain the same uncertainty levels in the mass-size statistics of riverbank litter, the SSRs of heterogeneous item categories are higher than of homogeneous item categories. This is underlined by the correlation (R-squared) between SSR and category heterogeneity for these 59 item categories, which is on average 0.45, but varies between 0.12 and 0.60.
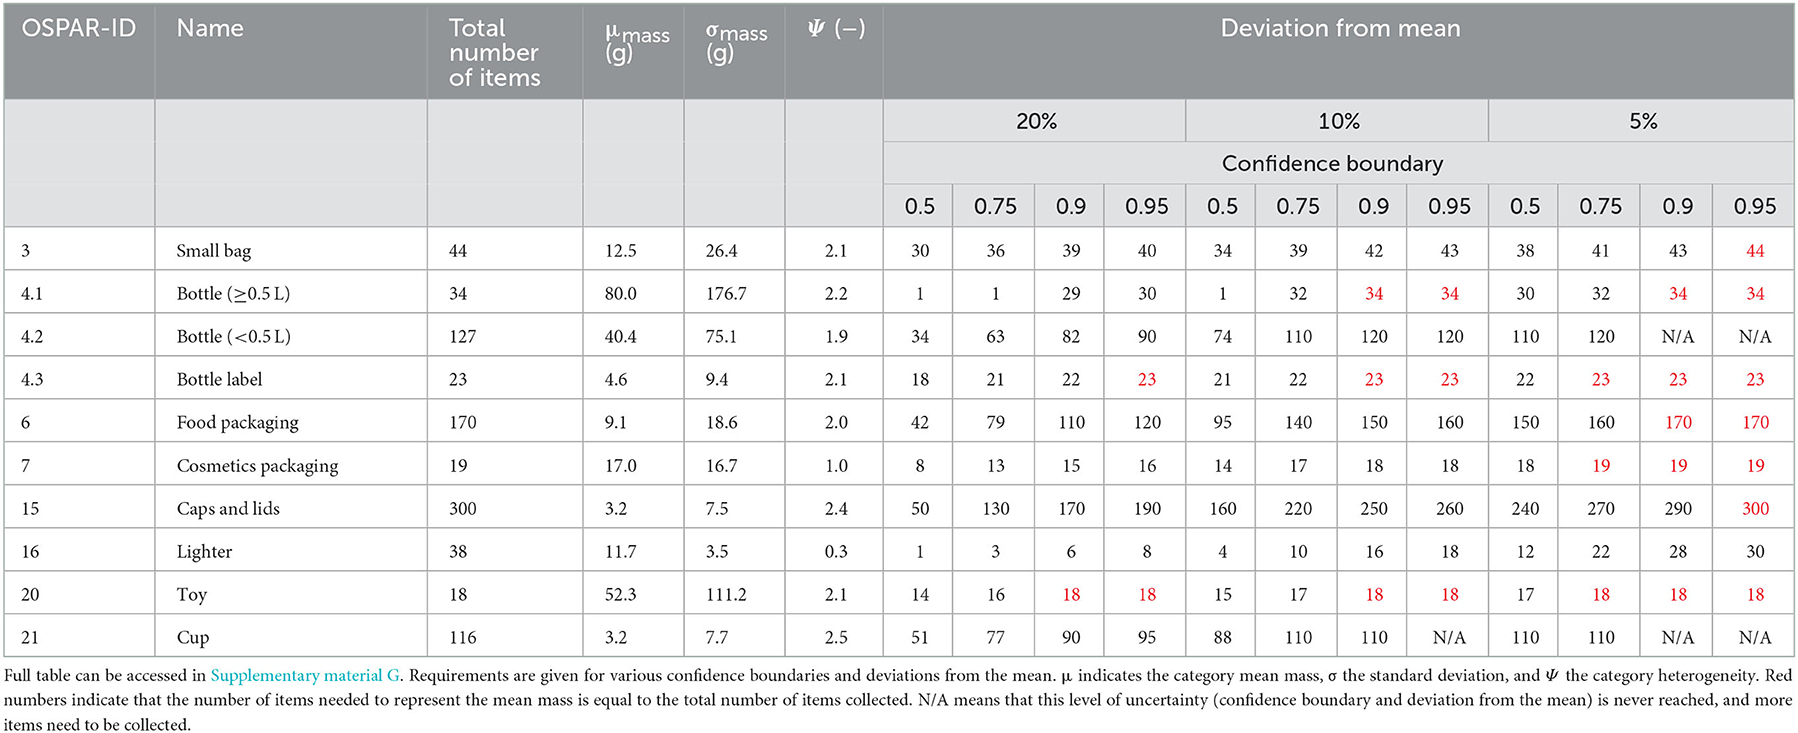
Table 2. Sample set size requirements (number of items) based on mean mass for a selection of categories in the study database with more than 10 items.
The SSRs can be the baseline for monitoring protocol design and serve as a rule of thumb or indication when making an initial design. If required, the SSR analysis can be expanded to calculate SSR based on median mass, mean, or median length and mean or median width, based on this dataset. Since the SSR analysis depends on the used item categorization method, we included a “conversion table” (Supplementary material F) for rapid re-categorization in one of the other published litter categorization methods (Nally et al., 2017; Kiessling et al., 2019; Schwarz et al., 2019; Vriend et al., 2020a; Fleet et al., 2021).
The SSRs of the litter items can be used to assess the heterogeneity of specific locations or entire rivers. This application is shown in Figure 6, which displays the litter heterogeneity based upon item count in the Rhine (R1, R2, R3), Meuse (M1, M2, M3), and IJssel (IJ1, IJ2) rivers, assuming a 90% confidence interval with maximum deviation of 10%. The litter on the riverbanks of the river Meuse and IJssel belong mainly to heterogeneous categories such as the large amount of hard and soft plastic fragments >2.5 cm (SSR 1,300 and 1,000, respectively). Contrastingly the river Rhine riverbanks encompass mostly homogeneous categories. When zooming to location-level heterogeneity (Table 3), it is clear that location R1 accounts for this. Location R1 can largely be described as a homogeneous sampling location, which contributes to the large number of homogeneous items in location R1 (Table 3), such as cigarette filters (SSR 11) and metal bottle caps (SSR 38) (Supplementary material D). The heterogeneity of each sampling location (assuming a 90% confidence interval with maximum deviation of 10%) as shown in Table 3 strongly corresponds to the heterogeneity of its top 10 items (Supplementary material D).
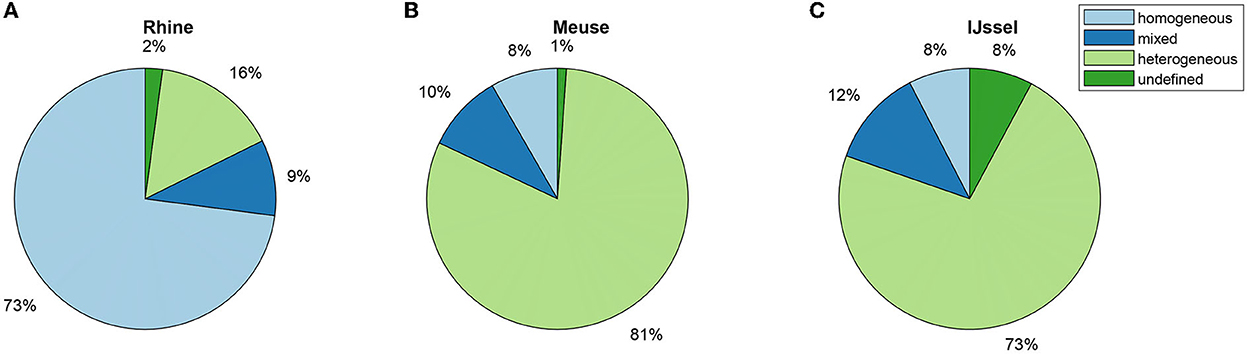
Figure 6. River system heterogeneity based on a 90% confidence boundary and 10% deviation from the mean, in the river Rhine (R1, R2, R3) (A), Meuse (M1, M2, M3) (B), and IJssel (IJ1, IJ2) (C). Homogeneous: SSRcategory ≤ median SSRall (40 items). Heterogeneous; SSRcategory ≥ mean SSRall (158 items). Mixed: median SSRall < SSRcategory < mean SSRall. Undefined: SSR could not be determined.

Table 3. Litter heterogeneity per sample site, based on mean mass with a 90% confidence boundary and 10% deviation from the mean, in the river Rhine (R1, R2, R3), Meuse (M1, M2, M3), and IJssel (IJ1, IJ2).
Heterogeneity and SSRs vary considerably within and between rivers, which emphasizes the need for river and site-specific data collection. For example, more data should be collected for heterogeneous systems. Therefore, identifying litter heterogeneity per system can give an indication as to the resource investment required to accurately capture the systems' riverbank litter. When performing a Monte Carlo bootstrap analysis on all items found within a river system, with a 90% confidence boundary and a deviation of 10%, the river Rhine can be sampled by measuring 3,000 items (78% of all items found along the river Rhine). Similarly, 6,900 items (71%) are needed for the river Meuse, and 2,000 (96%) for the river IJssel. These items would give enough data to derive representative mean mass statistics, but it does not provide any spatiotemporal information. The SSR of river IJssel comprise of almost all items in our database, and more items should be collected to confirm the calculated SSR. The smaller SSR for river Rhine indicates its homogeneous character, while the larger SSR for river Meuse again confirms its more heterogeneous character. Furthermore, due to the intrinsic uncertainty within heterogeneous items, the uncertainty in litter statistics will always be larger for heterogeneous systems than for more homogeneous systems.
This study quantifies the sample size requirements of anthropogenic litter items and assesses their heterogeneity, based upon more than 14,000 riverbank items. Our results show that statistical uncertainties decrease with increasing sample set size, as might be expected, but the amount information gain gradually diminishes when increasing the sample size. Therefore, determining the appropriate sample size requires finding an optimum between the acceptable uncertainty and the requisite sampling effort. In addition, the results demonstrate that heterogeneous litter item categories require larger sample set sizes than homogeneous categories in order to obtain similar uncertainty levels in the size and mass statistics.
The determination of litter heterogeneity and the derived required sample set sizes are crucial for optimizing the efficiency of litter monitoring protocols. Sample set size requirements can make data collection more efficient, as it is known for what item categories more and less items need to be collected and analyzed. The SSR can serve as a limit on data collection to avoid wasting resources on collecting data with uncertainty levels beyond the scope of the research question for which the data are used. This study provides a method to estimate SSR, and gives a first indication of the order of magnitude of the number of items that should be sampled for certain uncertainty levels for specific litter items. The approach taken in this research can be transferred to other systems, and the findings can be used as a starting point for studies in other river systems. For example, collecting homogeneous item categories can be performed in less detail than measuring heterogeneous categories in future monitoring campaigns. Furthermore, the analysis needed to optimize monitoring in these different systems can be adopted from this study. By starting with collecting very detailed data, subsequent sample collection can be downscaled to ensure more efficient monitoring. This can take the form of an iterative process, during which, at any point in the study, the data needs can be reassessed by performing a Monte Carlo based bootstrap analysis.
Litter transport and fate models can benefit from including litter statistics generated in this study. For example, models used to study the transport behavior of litter could include the mass and size of specific item categories. These parameters affect litter behavior associated with buoyancy or wind sensitivity (Kuizenga et al., 2022; Mellink et al., 2022a). Including such parameters will therefore help to account for the fundamental transport and retention behavior of different litter categories in river systems, and potentially improve model results.
Similarly, the data presented in this study can be used to improve models used to estimate the mass transport of litter in rivers (see for example Meijer et al., 2021). Recent insights gained by Roebroek et al. (2022) indicate that item-mass conversion is a significant contributor to model uncertainty in this type of model. Our dataset on items-specific mass-statistics can thus be used to more accurately perform this conversion, decreasing uncertainty in model results. The mass statistics of litter categories can further be used to improve item count-to-mass conversion in studies that currently do not include mass. Including mass in these datasets allows for data on environmental litter pollution to be compared with litter production, leakage, and transport, since all data are then expressed in the same units (mass per unit time). This allows for the study of the relation between these fluxes. For example, our litter-statistics can be used to include mass in datasets that were previously collected in item-count based studies (e.g., Crosti et al., 2018; González-Fernández et al., 2021; Morales-Caselles et al., 2021). This can now be directly compared with data from mass-based studies on, for example waste production and plastic transport (e.g., Lebreton and Andrady, 2019; Borrelle et al., 2020; Meijer et al., 2021). Including the mass statistics from our study may also reduce the uncertainty in studies that perform item-to-mass conversion using limited data (e.g., van Emmerik et al., 2018; Vriend et al., 2020b).
Several steps can be taken to assess and improve the applicability of the data presented in this study. First, it should be explored as to whether the SSR determined from the current data are river-system specific or whether relevant parameters such as item-specific mass of SSRs are transferable between river systems. Our findings will most likely be applicable to riverine systems with similar climatological characteristics and similar industrial and consumption patterns. Differences in consumption, activities (Nelms et al., 2021), waste management, riverbank morphologies, and vegetation (Liro et al., 2022) might lead to other types of litter being present and different size and mass statistics in other river environments. By applying our methodology to existing litter datasets (e.g., Tramoy et al., 2019) or by collecting a new dataset in a different type of river system, the universality of our SSRs can be assessed. If the results are comparable between different types of river system, the sample size requirements presented in this study could act as guidelines for future research thus guiding the scale of future sampling efforts.
Second, the dataset presented in this study could form the basis for an open-access global database. This is essential for improving litter monitoring and modeling efforts. Although global modeling studies are extremely relevant to understand litter fluxes, litter data varies locally (Schwarz et al., 2019), and local data are necessary to reduce the uncertainty in results. This local data can in turn be upscaled to regional or global domains. The suggested open-access database can be used by scientists, policymakers, and stakeholders to improve future monitoring, policymaking, and solution designs.
We present a method to determine the sample size requirements for specific item categories and for river systems. These may be used to optimize data collection efforts, by prioritizing the collection and analysis of items that have a larger heterogeneity. The same size requirements vary considerably between item categories and river systems. For a heterogeneous item class such as soft fragments larger than 2.5 cm, 990 items were needed to describe the mean mass with 90% confidence, and when determining the mean mass of uniform items, such as metal bottle caps, only 39 items were necessary. At least 8,900 items had to be sampled in order to describe the mean mass of all litter items on all locations with a confidence level of 90% and a maximum of 10% deviation from the mean. For representative aggregated statistics on the river basin scale, 1,645, 2,065, 2,033 items have to be sampled for the Rhine, Meuse, and IJssel, respectively. All collected data are openly available, and can be used to optimize future monitoring efforts, and constrain model parameters. Future monitoring strategies can benefit from this work, by applying a similar strategy in which a detailed data collection and a subsequent bootstrap analysis, can lead to the downscaling of subsequent sample collection. An example could be reducing the sampling effort for homogeneous categories. With this paper we aim to contribute to reducing uncertainties in litter monitoring and modeling, to better understand and quantify litter abundance, transport, fate, and impacts.
All data are openly available through the https://doi.org/10.4121/19188131 at the 4TU repository.
TvE and SL: conceptualization, methodology, and funding acquisition. SL: formal analysis and investigation. SL and PT: visualization. SL, YM, and PV: writing—original draft. TvE: project administration. SL, YM, PV, PT, TvE, FB, RH, VV, EH, NJ, and LS: writing—review and editing. All authors: data collection. All authors contributed to the article and approved the submitted version.
This research was partly funded by the Netherlands Ministry of Infrastructure and Water Management, Directorate-General for Public Works and Water Management (Rijkswaterstaat). The work of TvE is supported by the Veni Research Program, The River Plastic Monitoring Project with project number 18211, which is (partly) funded by the Dutch Research Council (NWO). YM received funding from The Ocean Cleanup.
The authors thank all the volunteers who helped with the fieldwork and laboratory measurements: Aline Looijen, Anna Schwarz, Belle Holthuis, Berte Mekonen, Boaz Kuizenga, Dana Kelder, Evelien Castrop, Gijs Roosen, Joël Kampen, Joshua Leusink, Khoa Thi, Kryss Waldschläger, Laura Wilson, Lianita Suryawinata, Lisanne Middelbeek, Lone Pollet, Maartje Wadman, Niels Janssens, Olga Dondoli, Roy Frings, RL, Roos Kolkman, Rosalie Mussert, Rose Pinto, Siebolt Folkertsma, Tijme Rijkers, Tim van der Kuijl, Titus Kruijssen, Tom Barendse, Wessel van der Meer, and Zhang Jiaheng. The authors thank Paul Torfs for the statistical advice and Nick Wallenstein for providing feedback on an earlier version of the manuscript. Additionally, we thank all reviewers. This paper is partly based on the technical report Pilot monitoring drijvend zwerfafval en macroplastics in rivieren: Jaarmeting 2021 (https://doi.org/10.18174/566475).
The authors declare that the research was conducted in the absence of any commercial or financial relationships that could be construed as a potential conflict of interest.
All claims expressed in this article are solely those of the authors and do not necessarily represent those of their affiliated organizations, or those of the publisher, the editors and the reviewers. Any product that may be evaluated in this article, or claim that may be made by its manufacturer, is not guaranteed or endorsed by the publisher.
The Supplementary Material for this article can be found online at: https://www.frontiersin.org/articles/10.3389/frwa.2022.1085285/full#supplementary-material
Ballerini, T., Chaudon, N., Fournier, M., Coulomb, J., Dumontet, B., Matuszak, E., et al. (2022). Plastic pollution on Durance riverbank: First quantification and possible environmental measures to reduce it. Front. Sustain. Sec. Waste Manage. 3, 866982. doi: 10.3389/frsus.2022.866982
Bartsch, L. A., Richardson, W. B., and Naimo, T. J. (1998). Sampling benthic macroinvertebrates in a large flood-plain river: Considerations of study design, sample size, and cost. Environ. Monit. Assess. 52, 425–439. doi: 10.1023/A:1005802715051
Bauer, W. F. (1958). The Monte Carlo method. J. Soc. Indust. Appl. Math. 6, 438–451. doi: 10.1137/0106028
Borrelle, S. B., Ringma, J., Law, K. L., Monnahan, C. C., Lebreton, L., McGivern, A., et al. (2020). Predicted growth in plastic waste exceeds efforts to mitigate plastic pollution. Science 369, 1515–1518. doi: 10.1126/science.aba3656
Cardini, A., and Elton, S. (2007). Sample size and sampling error in geometric morphometric studies of size and shape. Zoomorphology 126, 121–134. doi: 10.1007/s00435-007-0036-2
Cesarini, G., and Scalici, M. (2022). Riparian vegetation as a trap for plastic litter. Environ. Pollut. 292, 118410. doi: 10.1016/j.envpol.2021.118410
Chubarenko, I., Bagaev, A., Zobkov, M., and Esiukova, E. (2016). On some physical and dynamical properties of microplastic particles in marine environment. Mar. Pollut. Bull. 108, 105–112. doi: 10.1016/j.marpolbul.2016.04.048
Constantin, M. A., Schuurman, N. K., and Vermunt, J. (2021). A general Monte Carlo method for sample size analysis in the context of network models. PsyArXiv. doi: 10.31234/osf.io/j5v7u
Crosti, R., Arcangeli, A., Campana, I., Paraboschi, M., and González-Fernández, D. (2018). ‘Down to the river’: amount, composition, and economic sector of litter entering the marine compartment, through the Tiber river in the Western Mediterranean Sea. Rend. Fis. Acc. Lincei. 29, 859–866. doi: 10.1007/s12210-018-0747-y
Delorme, A. E., Koumba, G. B., Roussel, E., Delor-Jestin, F., Peiry, J., Voldoire, O., et al. (2021). The life of a plastic butter tub in riverine environments. Environ. Pollut. 287, 117656. doi: 10.1016/j.envpol.2021.117656
Droppo, I. G., and Jaskot, C. (1995). Impact of river transport characteristics on contaminant sampling error and design. Environ. Sci. Technol. 29, 161–170. doi: 10.1021/es00001a021
Fleet, D., Vlachogianni, T., and Hanke, G. (2021). A Joint List of Litter Categories for Marine Macrolitter Monitoring. EUR 30348 EN, Publications Office of the European Union, Luxembourg.
Freedman, L. S., Schatzkin, A., and Wax, Y. (1990). The impact of dietary measurement error on planning sample size required in a cohort study. Am. J. Epidemiol. 132, 1185–1195. doi: 10.1093/oxfordjournals.aje.a115762
Garello, N., Blettler, M. C. M., Espínola, L. A., Wantzen, K. M., González-Fernández, D., and Rodrigues, S. (2021). The role of hydrodynamic fluctuations and wind intensity on the distribution of plastic debris on the sandy beaches of Paraná River, Argentina. Environ. Pollut. 291, 118168. doi: 10.1016/j.envpol.2021.118168
González-Fernández, D., Cózar, A., Hanke, G., et al. (2021). Floating macrolitter leaked from Europe into the ocean. Nat. Sustain. 4, 474–483. doi: 10.1038/s41893-021-00722-6
Hanke, G., Walvoort, D., van Loon, W., Addamo, A. M., Brosich, A., del Mar Chaves Montero, M., et al. (2019). EU Marine Beach Litter Baselines. European Commission.
Hennig, C., and Cooper, D. (2011), Brief communication: The relation between standard error of the estimate sample size of histomorphometric aging methods. Am. J. Phys. Anthropol. 145, 658–664. doi: 10.1002/ajpa.21540
Kiessling, T., Knickmeier, K., Kruse, K., Brennecke, D., Nauendorf, A., and Thiel, M. (2019). Plastic Pirates sample litter at rivers in Germany–Riverside litter and litter sources estimated by schoolchildren. Environ. Pollut. 245, 545–557. doi: 10.1016/j.envpol.2018.11.025
Kim, S. Y. (2012). Sample size requirements in single-and multiphase growth mixture models: a Monte Carlo simulation study. Struct. Equat. Model. 19, 457–476. doi: 10.1080/10705511.2012.687672
Kowalski, N., Reichardt, A. M., and Waniek, J. J. (2016). Sinking rates of microplastics and potential implications of their alteration by physical, biological, and chemical factors. Mar. Pollut. Bull. 109, 310–319. doi: 10.1016/j.marpolbul.2016.05.064
Kuizenga, B., van Emmerik, T., Waldschläger, K., and Kooi, M. (2022). Will it float? Rising and settling velocities of common macroplastic foils. ACS ES T Water 2, 975–981. doi: 10.1021/acsestwater.1c00467
Kukulka, T., Proskurowski, G., Morét-Ferguson, S., Meyer, D. W., and Law, K. L. (2012). The effect of wind mixing on the vertical distribution of buoyant plastic debris. Geophys. Res. Lett. 39, 7601. doi: 10.1029/2012GL051116
Lamé, F. P. J., and Defize, P. R. (1993). Sampling of contaminated soil: Sampling error in relation to sample size and segregation. Environ. Sci. Technol. 27, 2035–2044. doi: 10.1021/es00047a008
Lau, W. W. Y., Shiran, Y., Baily, R. M., Cook, E., Stuchtey, M. R., Koskella, J., et al. (2020). Evaluating scenarios toward zero plastic pollution. Science 369, 1455–1461. doi: 10.1126/science.aba9475
Lebreton, L., and Andrady, A. (2019). Future scenarios of global plastic waste generation and disposal. Palgrave Commun. 5, 1–11. doi: 10.1057/s41599-018-0212-7
Lenth, R. (2001). Some practical guidelines for effective sample size determination. Am. Stat. 55, 187–193. doi: 10.1198/000313001317098149
Liro, M., Mikuś, P., and Wyzga, B. (2022). First insight into the macroplastic storage in a mountain river: The role of in-river vegetation cover, wood jams and channel morphology. Sci. Total Environ. 838(Pt 3), 156354. doi: 10.1016/j.scitotenv.2022.156354
Maggio, A., and Franklin, D. (2020). Femoral histomorphometric age-at-death studies: The issue of sample size and standard error. Med. Sci. Law 60, 257–265. doi: 10.1177/0025802420945939
McCormick, A. R., and Hoellein, T. J. (2016). Anthropogenic litter is abundant, diverse, and mobile in urban rivers: Insights from cross-ecosystem analyses using ecosystem and community ecology tools. Limnol. Oceanogr. 61, 1718–1734. doi: 10.1002/lno.10328
Meijer, L. J., van Emmerik, T., van der Ent, R., Schmidt, C., and Lebreton, L. (2021). More than 1000 rivers account for 80% of global riverine plastic emissions into the ocean. Sci. Adv. 7, eaaz5803. doi: 10.1126/sciadv.aaz5803
Mellink, Y., van Emmerik, T., Kooi, M., Laufkötter, C., and Niemann, H. (2022a). The plastic pathfinder: A macroplastic transport and fate model for terrestrial environments. Front. Environ. Sci. 10, 979685. doi: 10.3389/fenvs.2022.979685
Mellink, Y., van Emmerik, T., and Mani, T. (2022b). “How gravity, wind, rain and surface runoff drive plastic transport on land,” in EGU General Assembly 2022 (Vienna). doi: 10.5194/egusphere-egu22-12028
Morales-Caselles, C., Viejo, J., Martí, E., González-Fernández, D., Pragnell-Raasch, H., González-Gordillo, J. I., et al. (2021). An inshore–offshore sorting system revealed from global classification of ocean litter. Nat. Sustain. 4, 484–493. doi: 10.1038/s41893-021-00720-8
Nally, A., Lippiatt, S., Nachbar, S., and Pollack, N. (2017). Marine Debris Toolkit for Educators. NOAA Marine Debris Program NOAA Office of National Marine Sanctuaries.
Nelms, S. E., Duncan, E. M., Patel, S., Badola, R., Bhola, S., and Chakma, S. (2021). Riverine plastic pollution from fisheries: Insights from the Ganges River system. Sci. Total Environ. 756, 143305. doi: 10.1016/j.scitotenv.2020.143305
OSPAR Commission. (2010). Guideline for Monitoring Marine Litter on the Beaches in the OSPAR Maritime Area. London: OSPAR Commission.
Pedrotti, M. L., Petit, S., Elineau, A., Bruzaud, S., Crebassa, J. C., Dumontet, B., et al. (2016). Changes in the floating plastic pollution of the Mediterranean Sea in relation to the distance to land. PLoS ONE 11, e0161581. doi: 10.1371/journal.pone.0161581
Roebroek, C. T., Hut, R., Vriend, P., De Winter, W., Boonstra, M., and Van Emmerik, T. H. (2021). Disentangling variability in riverbank macrolitter observations. Environ. Sci. Technol. 55, 4932–4942. doi: 10.1021/acs.est.0c08094
Roebroek, C. T., Laufkötter, C., González-Fernández, D., and Emmerik, T. (2022). The quest for the missing plastics: Large uncertainties in river plastic export into the sea. Environ. Pollut. 312, 119948. doi: 10.1016/j.envpol.2022.119948
Schielen, R., Jesse, P., and Botwidt, L. (2007). On the use of flexible spillways to control the discharge ratio of the Rhine in the Netherlands: Hydraulic and morphological observations. Geol. Mijnb. 86, 77–88. doi: 10.1017/S0016774600021338
Schwarz, A. E., Ligthart, T. N., Boukris, E., and Van Harmelen, T. (2019). Sources, transport, and accumulation of different types of plastic litter in aquatic environments: a review study. Mar. Pollut. Bull. 143, 92–100. doi: 10.1016/j.marpolbul.2019.04.029
Tramoy, R., Colasse, L., Gasperi, J., and Tassin, B. (2019). Plastic debris dataset on the Seine river banks: Plastic pellets, unidentified plastic fragments and plastic sticks are the Top 3 items in a historical accumulation of plastics. Data Brief 23, 103697. doi: 10.1016/j.dib.2019.01.045
Van Calcar, C. J., and van Emmerik, T. H. M. (2019). Abundance of plastic debris across European and Asian rivers. Environ. Res. Lett. 14, 124051. doi: 10.1088/1748-9326/ab5468
van der Wal, M., van der Meulen, M., Roex, E., Wolthous, Y., Tweehuijsen, G., and Vethaak, D. (2013). Plastic Litter in the Rivers Rhine, Meuse and Scheldt. Contribution to Plastic Waste in the North Sea. Delft: Deltares.
van Emmerik, T., de Lange, S., Frings, R., Schreyers, L., Aalderink, H., Leusink, J., et al. (2022). Hydrology as a driver of floating river plastic transport. Earths Fut. 10, e2022EF002811. doi: 10.1029/2022EF002811
van Emmerik, T., Kieu-Le, T., Loozen, M., van Oeveren, K., Strady, E., Bui, X., et al. (2018). A methodology to characterize riverine macroplastic emission into the ocean. Front. Mar. Sci. 5, 372. doi: 10.3389/fmars.2018.00372
van Emmerik, T., Roebroek, C., De Winter, W., Vriend, P., Boonstra, M., and Hougee, M. (2020). Riverbank macrolitter in the Dutch Rhine–Meuse delta. Environ. Res. Lett. 15, 104087. doi: 10.1088/1748-9326/abb2c6
van Emmerik, T., and Schwarz, A. (2020). Plastic debris in rivers. Wiley Interdiscipl. Rev. Water 7, e1398. doi: 10.1002/wat2.1398
Vriend, P., Roebroek, C. T., and van Emmerik, T. (2020a). Same but different: a framework to design and compare riverbank plastic monitoring strategies. Front. Water 2, 31. doi: 10.3389/frwa.2020.563791
Keywords: macroplastic, sampling, Rhine, Meuse, heterogeneity, sample set size requirements, anthropogenic litter, database
Citation: de Lange SI, Mellink Y, Vriend P, Tasseron PF, Begemann F, Hauk R, Aalderink H, Hamers E, Jansson P, Joosse N, Löhr AJ, Lotcheris R, Schreyers L, Vos V and van Emmerik THM (2023) Sample size requirements for riverbank macrolitter characterization. Front. Water 4:1085285. doi: 10.3389/frwa.2022.1085285
Received: 31 October 2022; Accepted: 19 December 2022;
Published: 19 January 2023.
Edited by:
Banu Ormeci, Carleton University, CanadaReviewed by:
Venkatramanan Senapathi, Alagappa University, IndiaCopyright © 2023 de Lange, Mellink, Vriend, Tasseron, Begemann, Hauk, Aalderink, Hamers, Jansson, Joosse, Löhr, Lotcheris, Schreyers, Vos and van Emmerik. This is an open-access article distributed under the terms of the Creative Commons Attribution License (CC BY). The use, distribution or reproduction in other forums is permitted, provided the original author(s) and the copyright owner(s) are credited and that the original publication in this journal is cited, in accordance with accepted academic practice. No use, distribution or reproduction is permitted which does not comply with these terms.
*Correspondence: Sjoukje I. de Lange,  c2pvdWtqZS5kZWxhbmdlQHd1ci5ubA==
Disclaimer: All claims expressed in this article are solely those of the authors and do not necessarily represent those of their affiliated organizations, or those of the publisher, the editors and the reviewers. Any product that may be evaluated in this article or claim that may be made by its manufacturer is not guaranteed or endorsed by the publisher.
Research integrity at Frontiers
Learn more about the work of our research integrity team to safeguard the quality of each article we publish.