 Alicia M. Wilson
 Meghan Shanahan
 Erik M. Smith
- 1School of the Earth, Ocean and Environment, University of South Carolina, Columbia, SC, United States
- 2North Inlet-Winyah Bay National Estuarine Research Reserve and the Belle W. Baruch Institute for Marine and Coastal Sciences, University of South Carolina, Georgetown, SC, United States
Salt marshes serve as zones of intense groundwater mixing and reaction between freshwater uplands and estuaries. This raises the question of whether the impacts of upland development on nutrient and carbon species can be transmitted through salt marshes via groundwater, or whether salt marshes can buffer estuarine waters from coastal development. We sampled groundwater from fifteen tidal creek basins in South Carolina to test for compositional differences associated with development and marsh width. Groundwater samples from near creekbanks and below freshwater uplands were analyzed for salinity, total dissolved nitrogen and phosphorus, and dissolved organic carbon. Analyses revealed significantly higher TDN and TDP concentrations in creekbank samples from developed watersheds, independent of the season. Analyses of upland samples revealed significantly lower DOC concentrations in developed uplands, again independent of season. These results support the hypothesis that development can affect groundwater compositions in coastal groundwater and therefore may affect coastal nutrient and carbon fluxes. However, results also revealed significant linear correlations between marsh width, salinity, and nutrient concentrations in some marshes. These results suggest that salt marshes can act as buffers for development, and specifically suggests that the buffering capacity of salt marshes increases with width. Narrow or trenched salt marshes are far less likely to be effective buffers.
Introduction
Tidal salt marshes lie at the intersection of land and coastal surface waters. As coastal populations rise (NOAA, 2013), the location of salt marshes at the land-sea interface raises important questions about how salt marsh basins are affected by coastal development. Prior studies show that surface water quality and other ecosystem parameters in tidal creeks differ between developed and undeveloped watersheds in the Southeastern U.S. (Sanger et al., 1999a,b, 2015; Lerberg et al., 2000; Verity, 2002; Holland et al., 2004; DiDonato et al., 2009). Tidal creeks in watersheds with higher fractions of impervious surfaces showed, among other indicators, higher nutrient concentrations and larger ranges in salinity (Holland et al., 2004; Sanger et al., 2015). These findings are consistent with increased nutrient inputs and increases in the ratio of runoff to infiltration in developed watersheds. As is well documented in freshwater watersheds, these increases logically affect groundwater as well as surface water (Hutchins et al., 2014). Groundwater flow through salt marshes supplies significant nutrients and carbon to coastal surface waters even in undeveloped sites (Krest et al., 2000; Charette et al., 2003; Wilson and Morris, 2012), and changes in the concentrations of those constituents in salt marsh groundwaters have the potential to propagate to coastal surface waters. It remains unclear, however, whether groundwater composition actually differs between developed and undeveloped salt marsh basins.
There are two reasons that development might not cause detectable differences in groundwater composition below salt marshes. The first relates to broad conceptualizations of wetlands as “the kidneys of the Earth” (Mitch and Gosselink, 2015). In this model, salt marshes and other intertidal wetlands could act as buffers for development. Salt marshes are prominent examples of the “subterranean estuary,” a key zone of mixing and reaction at the freshwater-saltwater interface in the subsurface (Moore, 1999), and this level of mixing and reaction could mitigate the impacts of development on groundwater composition. The second possibility is that the range of natural variation among salt marshes is so large that it obscures any impact of development. Even in systems with similar temperatures and rainfall patterns, salt marshes are characterized by wide ranges in salinity, marsh width, fresh groundwater inputs from uplands, sediment composition, tidal range, and ecological productivity.
This work was designed to test three competing hypotheses: (1) development affects the composition of groundwater throughout salt marsh basins; (2) development affects groundwater composition below uplands, but these effects are mitigated by mixing and reaction within salt marshes; and (3) development does not cause detectable differences in groundwater composition within salt marsh basins. We tested these hypotheses by analyzing groundwater samples from creekbanks and below uplands from a total of 15 tidal creeks distributed along the coastline of South Carolina.
Conceptual Model for Groundwater Flow and Composition in Salt Marshes
Groundwater flow through salt marshes is controlled by tidal fluctuations, precipitation, evapotranspiration, and inputs of fresh groundwater from adjacent freshwater ecosystems, hereafter referred to as uplands (Figure 1). Salt marshes in the Southeastern U.S. and other locations around the globe are commonly characterized by a surficial mud layer overlying a sandy aquifer (Weigert and Freeman, 1990; Hughes et al., 1998; Gardner and Porter, 2001; Grewell et al., 2007), although there is certainly wide variation even in regions where this stratigraphy is common. Fresh groundwater discharging from the upland travels through the sandy aquifer toward the creek bank, mixing along the way with water that infiltrates the marsh surface when the marsh is inundated. The salinity of the infiltrating creekwater can vary widely depending on the local rainfall history and the position of the marsh relative to the mouth of the estuary. Within salt marsh sediments, temporal variations in salinity in the root zone tend to damp out with depth (Hughes et al., 2012). Within sandy sub-marsh aquifers, field observations suggest that salinity tends to vary laterally, i.e. with distance from the upland, rather than vertically (Carter et al., 2008). In general, the salinity of the sub-marsh aquifer is a good indication of the degree of mixing between discharging fresh groundwater and infiltrating saline water.
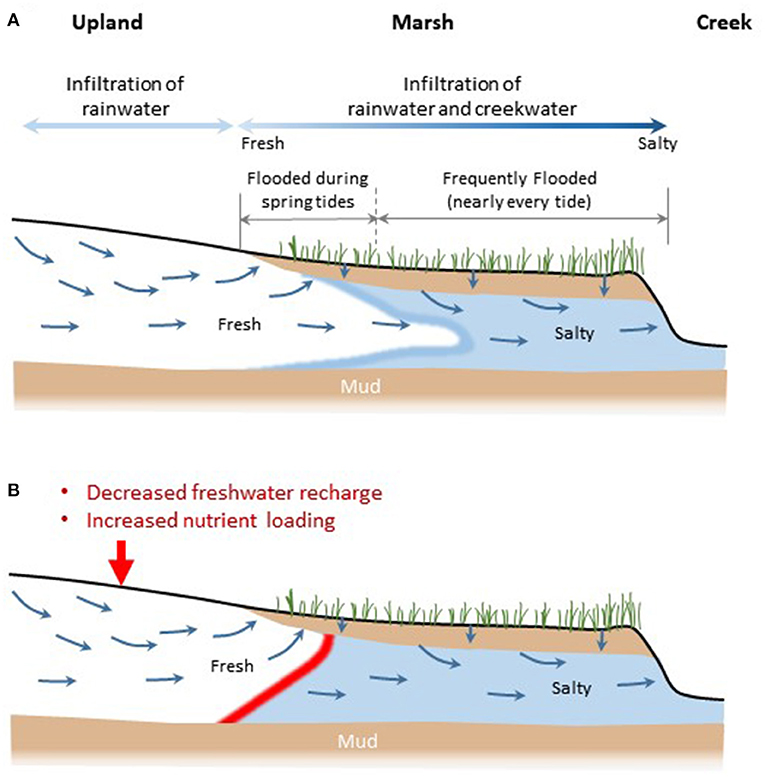
Figure 1. Conceptual model for groundwater flow through a salt marsh, averaged over multiple tidal cycles. (A). Undisturbed system. (B). Hypothesized changes ensuing from development of the upland. Red arrow indicates changes in the volume and composition of recharge. Red line illustrates possible migration of the freshwater-saltwater interface.
The transport and speciation of nutrients and carbon also differs between fresh upland groundwater and saline groundwater below salt marshes. Nitrogen is likely to appear as nitrate or nitrite below freshwater uplands, whereas ammonium is the dominant form of nitrogen in reducing salt marsh environments (Hopkinson and Giblin, 2008). Phosphorus sorbs to iron oxide grain coatings in oxic environments, while phosphorus is released by dissolution of iron oxides in reducing salt marsh sediments (Sundareshwar and Morris, 1999). Shallow fresh groundwater below uplands is highly enriched in dissolved organic carbon compared to deeper fresh groundwater and compared to groundwater in salt marsh sediments (Goñi and Gardner, 2003).
In our conceptual model, development would affect groundwater composition in two ways. First, fertilizers or wastewater sources would increase nutrient concentrations in the upland, and this increase could, depending on the degree of mixing and reaction in the sub-marsh aquifer, increase nutrient discharge to the estuary. Second, increases in the area of impervious surfaces covering the uplands would decrease the volume of fresh rainwater that infiltrates into the subsurface, which could in turn increase the salinity of groundwater discharging to the estuary.
Many factors in addition to development can influence the composition of groundwater discharging from salt marshes to estuaries. These factors include biogeochemical cycling within salt marsh sediments (Valiela and Teal, 1979; Slomp and Van Cappellen, 2004; Santos et al., 2008; Rodellas et al., 2018), groundwater salinity (Moore, 1999), tidal range, the volume of fresh groundwater inputs from uplands, sediment composition, and marsh width. In this work, as a first attempt to characterize a complicated system, we focused on the two most easily-measurable physical parameters as measures of salt marsh variability: (1) the salinity of groundwater in the sub-marsh aquifer at the creekbank and (2) marsh width. We have already described the importance of salinity as a measure of the degree of mixing between fresh and saline groundwater below the marsh. We propose marsh width as an additional proxy for mixing and reaction in the submarsh aquifer. In our conceptual model, narrow or non-existent salt marshes would have very little capacity to moderate inflow of contaminated fresh groundwater, and groundwater discharging to the estuary would be relatively fresh. In contrast, wider salt marshes should have a greater capacity to mitigate contamination through dilution (mixing) and reaction, and the discharging groundwater would be more saline.
We also note that salt marshes export significant nutrients and carbon even in undeveloped regions with very minor inputs of fresh surface or groundwater (Valiela and Teal, 1979; Nixon, 1980; Wolaver et al., 1988; Childers et al., 2000; Krest et al., 2000). This large export raises a final possibility, which is that natural nutrient fluxes from salt marshes may dwarf any increase in nutrient fluxes from developed uplands.
In summary, our conceptual model assumes that development affects the composition of fresh groundwater below uplands, and our basic hypothesis is that compositional changes in the fresh groundwater propagate through the system to affect the composition of groundwater that discharges to the creekbank. Our counter-hypothesis is that salt marshes act as buffers, so that relatively wide marshes have the capacity to render the impact of development undetectable through natural mixing and reaction in the sub-marsh aquifer. The final (null) hypothesis is that variability between and within salt marsh basins allows us to detect neither development-related differences in salt marsh groundwater composition nor evidence for buffering by salt marshes. These hypotheses were tested by collecting groundwater samples from creekbank and upland sites in coastal South Carolina.
Methods
Field Sampling Strategy
We sampled groundwater from 15 representative tidal creek basins in South Carolina (Figure 2; Table 1). These creeks represent a subset of more than 25 tidal creeks and their surrounding watersheds previously described in studies of development and surface water quality [Sanger et al., 1999b, 2015; personal communication]. The 15 basins studied here were chosen in consultation with watershed managers and other stakeholders via a workshop held in 2016. Land-use and impervious cover for each watershed were previously determined (DiDonato et al., 2009; Sanger et al., 2015) based on National Land Cover Database, using data from 2001. Marsh widths were measured using ARCGIS 10. Distances from the creek bank to the forest-marsh boundary ranged from 0–124 m. The tidal creeks were initially grouped by level of development and characterized as forested (<10% impervious cover), suburban (10–35% impervious cover), and urban (>35% impervious cover).
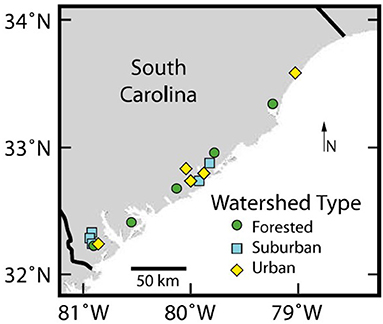
Figure 2. Locations and classifications of tidal creeks chosen for this study.
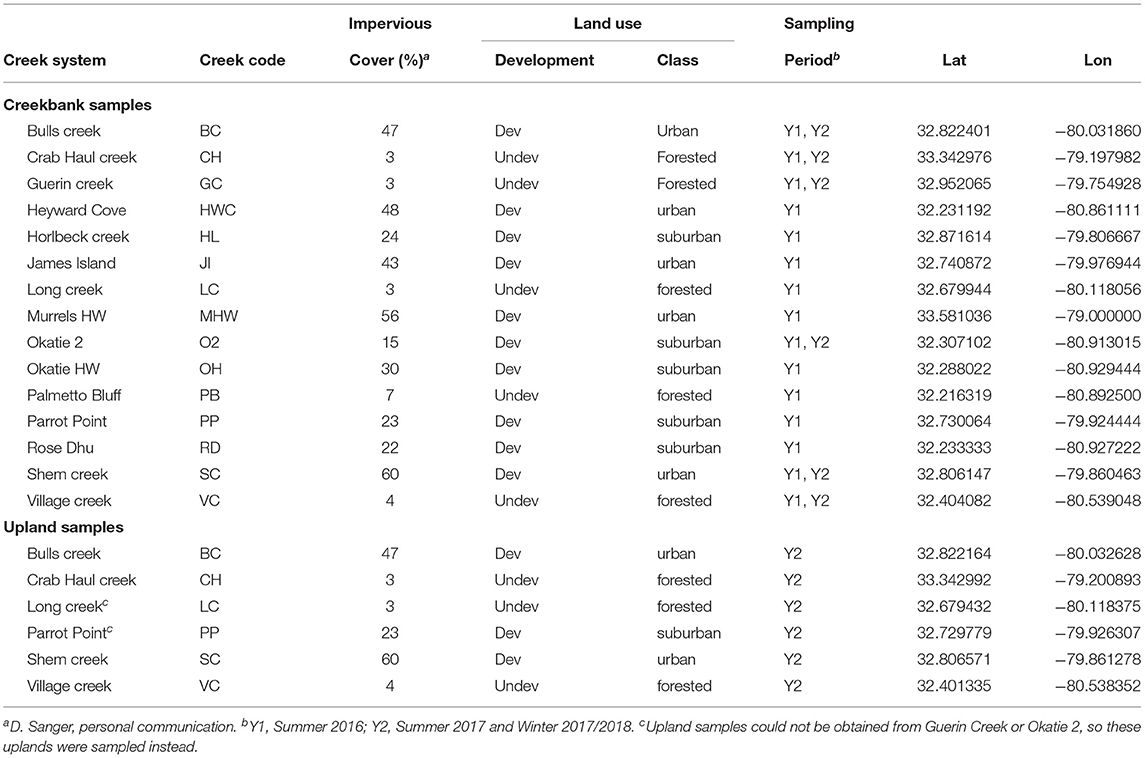
Table 1. Location, impervious cover, land use classifications, and sampling period for tidal creeks sampled in this study.
Six sample sites were chosen along the creekbank of each creek for sampling in the summer of 2016, the first year of the project. Sites were chosen with dual goals of sampling a large stretch of each creek and sampling a wide range of marsh widths. When this sampling strategy was implemented, it revealed three significant drawbacks. First, several of the creeks were logistically difficult to access, which in some cases resulted in sampling as few as four sites along the creek. Second, intensive sampling at fifteen creeks did not allow time to sample adjacent uplands. Third, our analyses revealed far larger along-creek variability than had been anticipated. We revised our sampling strategy for 2017 to address these issues.
In 2017 we refocused our sampling plan on a subset of six creek basins (Table 1). We repositioned the six creekbank sampling points in each basin to span a much shorter reach of each creek (Supplementary Figure 1; Shanahan, 2018), to target the effects of variations in marsh width while limiting other sources of spatial variation. We also reclassified our land use categories, to ensure that we had enough samples from each category to conduct useful statistical analyses. The six basins sampled in 2017 were reclassified as undeveloped (0–10% impervious cover) and developed (>10% impervious cover), based on prior observations that streams and rivers begin to become seriously degraded when more than 10% of a watershed is covered in impervious cover (Beach, 2002; Holland et al., 2004; Larson and Belovsky, 2013; Hutchins et al., 2014; Sanger et al., 2015). We emphasize that the sample size of only six creeks is small, so the results should be viewed as preliminary. As described below, however, this strategy revealed important patterns that are worthy of future investigation.
In 2017 we collected samples of fresh groundwater below the uplands nearest to our creek sites, to directly test the hypothesis that fresh groundwater compositions differ between developed and undeveloped watersheds. That winter we resampled the same creekbank and upland sites to test for seasonal differences. Upland samples could not be obtained from Guerin Creek (undeveloped), or Okatie 2 (developed) because of difficulties inserting the pushpoint sampler. Upland samples were obtained from Long Creek and Parrot Point Creek, which had similar levels of impervious cover (Table 1).
Groundwater Sampling
Groundwater samples were collected using a peristaltic pump via a stainless steel push-point sampler (M.H.E. Products). At the creekbank sites, the sampler was inserted to a target depth of 1–1.5 m below the sediment-water interface at the base of the creekbank, in an effort to reach the submarsh aquifer beyond the zone of the most intense tidal mixing. Stratigraphic variation (i.e. a thicker or thinner overlying mud layer) led to variations in sampling depths. Sampling depths ranged from 0.5–1.8 m, with an average depth of 1.3 m. Sampling during the first year typically began near low tide, but with delays it sometimes began nearer to rising mid tide. In the second year, sampling was restricted to begin within 30 min of low tide, when groundwater discharge is highest (Whiting and Childers, 1989; Wilson and Morris, 2012), and when the thickness of the tidal mixing zone below the sediment-water interface should be thinnest. Sampling took an average of 2–3 h.
Upland samples were collected at 10 m intervals along a 50 m transect landward of and parallel to the upper margin of the Juncus roemerianus zone. Upland sampling took an average of 20 min. Points were sampled at an average depth of approximately 1.6 m. The tidal stage was not a factor in upland sampling.
Samples were field-filtered using EMD Millipore 0.45 GF/F in-line filter cartridges and transported on ice in the dark and either refrigerated at 4 °C (salinity), acidified (DOC), or frozen at −80 °C (nutrients) until analysis.
Analytical Methods
Salinity was measured using a handheld conductivity probe (Mettler Toledo Seven2Go pro). Total dissolved nitrogen (TDN) was measured using a Technicon II autoanalyzer following persulfate oxidation (Gilbert and Loder, 1977). Total dissolved phosphorus (TDP) was quantified using the high temperature combustion method of Monaghan and Ruttenberg (1999). Total organic carbon (DOC) samples were collected in aliquots of 15 mL, which were immediately acidified to pH <2 with 10% HCL and stored in the dark at 4 °C until analyzed via a Shimadzu TOC-VCPN organic carbon analyzer (Benner and Strom, 1993). For TDN and TDP analyses, quality control checks and matrix spikes (of glutamic acid in the case of TDN and adenosine triphosphate in the case of TDP) accompanied each run to serve as a measure of method accuracy. Spike recoveries were within ±15% of expected concentrations for TDN and within ±10% for TDP. Accuracy of DOC measurements was based on the analysis a Consensus Reference Material (CRM; University of Miami, FL USA) and results were within ±10% of published concentrations. Approximately 10% of samples were run in duplicate for each analysis with a mean precision <8% for all analyses.
Statistical Analysis
One-way ANOVAs, Mann-Whitney U tests, and linear regressions were performed to analyze differences in groundwater quality due to watershed type, marsh width, and seasonal variability. Statistical significance was defined as p < 0.05 for all statistical analysis.
One-way ANOVAs were used to analyze differences in average concentrations of water quality parameters (salinity, TDN, TDP, DOC) between land-use classes for the samples from 2016, which consisted of creekbank samples only. Land-use class factors were forested (F), suburban (S) and urban (U). Parameters were either inverse- (salinity, TDN) or ln-transformed (DOC, TDP) to satisfy normality assumptions. Transformations for TDP improved, but did not satisfy normality. Post-hoc multiple comparisons were performed using least squared means (Bonferroni Test).
The 2017 samples were analyzed using Mann-Whitney U tests and linear regressions. The reduction to only two land classes (undeveloped, developed) prevented the use of one-way ANOVAs. Therefore Mann-Whitney U tests were used to examine differences in average concentrations of water quality parameters between land-use classes for the samples from 2017. Independent sample t-tests were not used because transformations of the 2017–2018 data often improved, but did not satisfy, assumptions of normality.
Linear regression analyses were performed to determine if there was a significant linear relationship between the independent variable (marsh width, salinity) and the dependent variable (salinity, TDN, TDP, DOC) in groundwater samples taken from creekbank sites.
Results
Summer 2016 Results
Samples from 2016 generated a large new database of creekbank groundwater nutrient compositions (Figure 3, Supplementary Table 1) but revealed few significant differences related to marsh width or the degree of upland development (Supplementary Table 2). Sampling locations are shown in Shanahan (2018), see Appendix C. No statistically significant differences were apparent between the three land use categories. When the suburban and urban categories were grouped together into a single “developed” category (>10% impervious cover), TDP was significantly higher in developed creek basins than in undeveloped basins (Figure 3). There were no significant differences between land use categories with respect to average concentrations of TDN, DOC, or mean salinity.
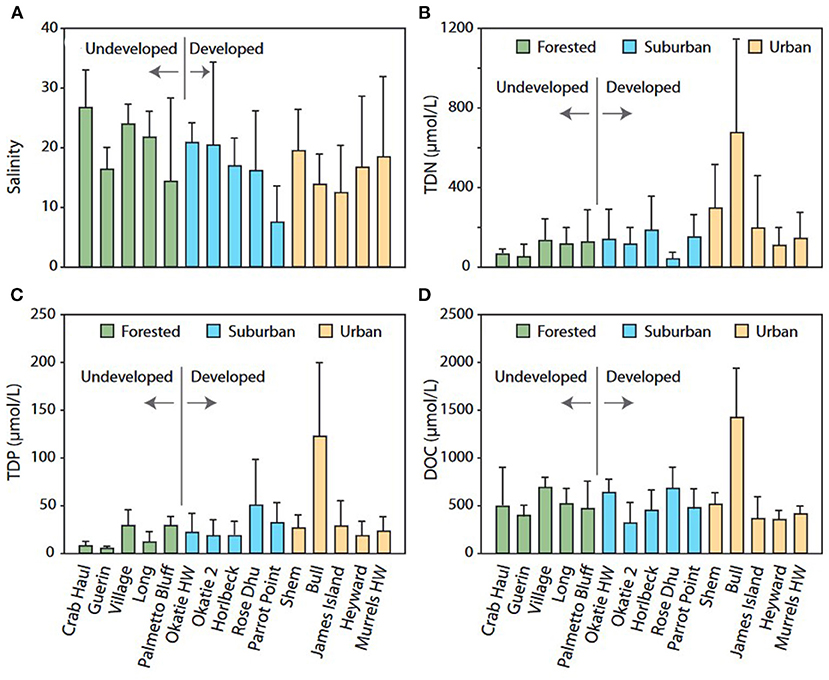
Figure 3. Groundwater compositions in creekbank samples from 2016, averaged for each creek. (A) Salinity. (B) TDN. (C) TDP. (D) DOC. Error bars indicate standard deviation.
Closer examination of results from individual creeks revealed much larger along-creek variability than we had anticipated. For example, in some cases the salinity of creekbank groundwater samples increased from headwaters to the mouth of the creeks (Figure 4), which obscured possible relationships between marsh width and salinity. Our revised sampling plan for 2017, which focused on short reaches of each creek, allowed us to reduce the impact of along-creek variability.
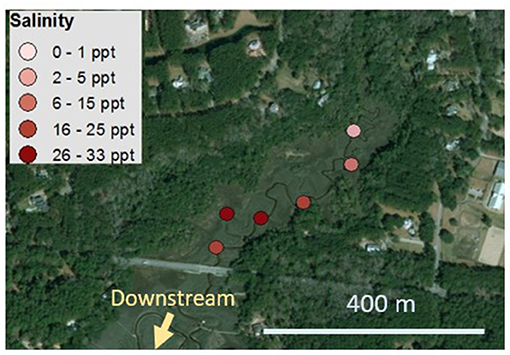
Figure 4. Locations and salinities for creekbank groundwater samples at Rose Dhu Creek, Bluffton, South Carolina, from 2016.
Summer 2017 Results
The smaller number of creeks sampled in the summer of 2017 (Supplementary Tables 3, 4) reduced our ability to make broad generalizations about developed vs. undeveloped watersheds, but samples from creekbanks in this set of creeks generally showed significantly higher concentrations of TDN and TDP in developed watersheds than undeveloped watersheds (Figures 5D–I; Supplementary Table 5). Uplands in developed watersheds also showed higher TDP than undeveloped watersheds, but it should be noted that the salinity of samples from the undeveloped uplands was significantly higher than the salinity of upland samples from developed watersheds. This means that the difference in TDP could be related to redox state or other unmeasured parameters rather than development. The average concentration of DOC was significantly higher in undeveloped uplands than in developed uplands (Figure 5K, Supplementary Table 5). Concentrations of DOC in creekbank samples showed no difference between developed and undeveloped watersheds (Supplementary Table 5).
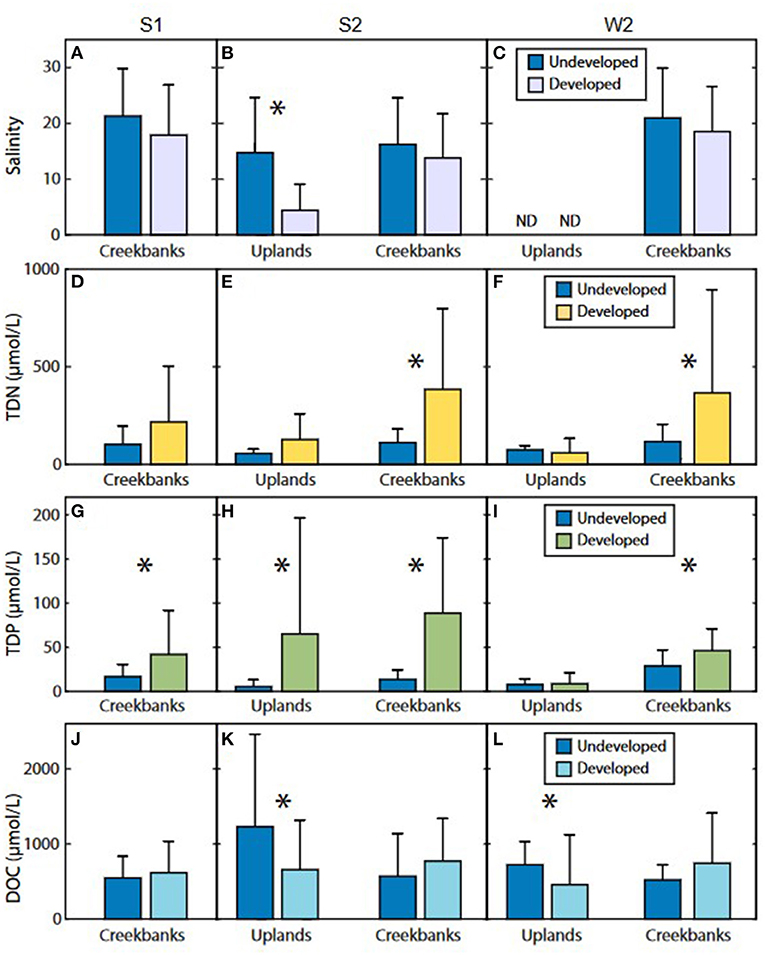
Figure 5. Average salinity (A–C) and concentrations of TDN (D–F), TDP (G–I), and DOC (J–L) species for upland and creekbank samples. S1 indicates samples collected during summer 2016 (left column); S2 indicates summer 2017 (center column), and W2 indicates winter 2017–2018. * indicates a statistically significant difference between developed and undeveloped pairs.
The value of the more targeted 2017 summer sampling plan was that it revealed new statistically significant linear correlations between marsh width, salinity, and nutrient concentrations (Supplementary Table 6). In the undeveloped creeks, salinity increased with marsh width (Figure 6). This is consistent with our conceptual model, in which wider marshes accommodate greater mixing and reaction with tidal surface waters. This correlation is driven strongly by Crab Haul Creek, which is the only one of the three undeveloped creeks to show a statistically significant correlation between salinity and marsh width when considered individually. The r2 for this relationship increased from 0.31 for the aggregate data to 0.63 for Crab Haul Creek, indicating a much better correlation for Crab Haul Creek. Crab Haul Creek also showed significant positive linear correlations between marsh width and phosphorous species (Supplementary Table 6). We note that among the undeveloped creeks there were also significant positive correlations between groundwater salinity and nutrient concentrations (Figure 7). This suggests that the correlation between marsh width and phosphorus species was strongly influenced by desorption at higher salinities.
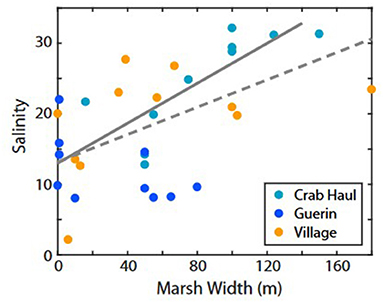
Figure 6. Groundwater salinity measured at the creekbank vs. marsh width in the three undeveloped creeks from summer 2016 and 2017. Dashed gray line is the linear regression line for all samples (r2 = 0.31; p = 0.001). Solid gray line is for Crab Haul Creek (r2 = 0.63; p = 0.006).
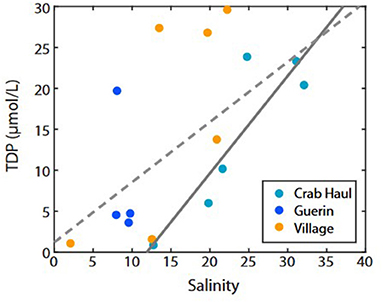
Figure 7. TDP vs. salinity for creekbank groundwater samples from undeveloped creeks in summer 2017. Dashed gray line is the linear regression line for all samples (r2 = 0.35). Solid gray line is for Crab Haul Creek (r2 = 0.79).
Two of the developed creeks showed very little variation in salinity (8–10), which allowed us to explore the possibility that nutrient concentrations might vary with marsh width in the absence of variations in salinity. We found that TDN and TDP both increased with marsh width (Figure 8), indicating that increases in nutrient concentrations with marsh width are not solely a function of desorption. Only one of the developed creeks showed a significant linear correlation between marsh width and creekbank groundwater composition, and this correlation was negative. At Okatie 2, TDN and TDP decreased with marsh width (Supplementary Table 6).
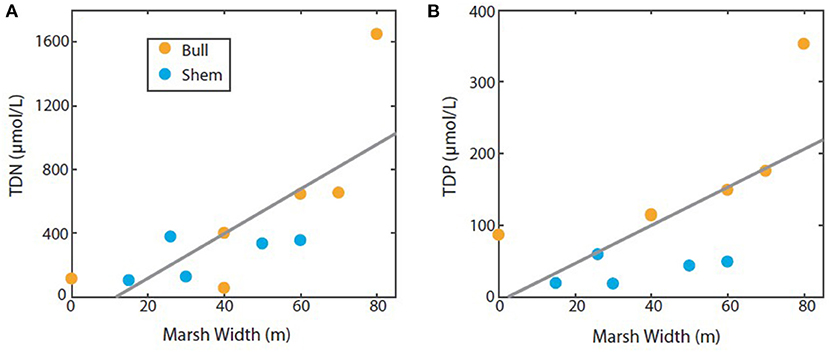
Figure 8. Nutrient concentrations in creekbank groundwater samples as a function of marsh width for two developed creeks where groundwater salinities were only 8–10. (A) TDN (r2 = 0.56). (B) TDP (r2 = 0.44). Data from summer 2017. Gray line indicates regression line for all samples.
Winter 2017 Results
Samples from the winter of 2017–2018 (Figure 5, Supplementary Tables 7, 8) revealed seasonal differences in groundwater composition and revealed a pattern of statistically significant differences between developed and undeveloped systems that was generally consistent with the summer 2017 samples. In the uplands, DOC concentrations were higher in undeveloped watersheds than developed watersheds in both seasons (summer p = 0.02; winter p = 0.002). At the creekbanks, there was no significant difference in DOC concentration between developed and undeveloped sites. No significant differences were observed in upland samples in TDN or TDP concentrations. In creekbank samples, TDN and TDP concentrations were significantly higher in developed watersheds than undeveloped watersheds (TDN p = 0.001; TDP p = 0.04).
The significant linear correlations that were found between marsh width and groundwater composition during the summer failed to appear in the winter.
Seasonal Differences From 2017 Results
We also compared groundwater composition between summer and winter. In the uplands, average DOC concentrations were significantly lower in winter than in the summer (p = 0.02), contrary to previous studies (Goñi and Gardner, 2003; Oh et al., 2017; Wang et al., 2018). This was driven by a decline in DOC in undeveloped systems during the winter (p = 0.005; Figures 5K,L). No other significant seasonal differences were apparent.
Discussion
Hypothesis Testing
Results confirmed all three of our hypotheses to some extent. Our first hypothesis was that development affects the composition of groundwater in salt marsh watersheds, and indeed we found statistically significant differences between groundwater samples from developed and undeveloped watersheds, in uplands and at creekbanks (Figures 3, 5). Two significant differences were observed in more than one sampling campaign: higher TDP in developed creekbanks (summers of 2016 and 2017); and lower DOC in developed uplands (summer of 2017 and winter of 2017–18). These results are consistent with the main hypothesis that development affects groundwater composition, but they do not necessarily support the subhypothesis that compositional changes in developed uplands propagate through the marsh to the creekbank. The higher TDP concentrations in developed uplands in summer 2017 suggest that phosphorus could propagate from uplands through the marsh, although this could be an unrelated correlation in these complex systems. The higher DOC concentrations in undeveloped uplands was consistent across seasons, but this difference did not appear in creekbank samples.
The fact that we detected differences between developed and undeveloped systems appears to contradict our third (null) hypothesis, which was that differences between developed and undeveloped watershed would be undetectable owing to natural variability among watersheds. However, the results from 2016 support this hypothesis. The broad sampling scheme used in the first year revealed far fewer significant differences between developed and undeveloped creeks than later sampling. This raises the question of whether the differences found in the second year are more an indication of the small sample size (only six creeks), rather than the success of a more targeted sampling scheme. It is clear that further sampling will be needed to better define the association between groundwater composition and development.
Our remaining hypothesis was that salt marshes can act as buffers for development via mixing and reaction within salt marshes, with the sub-hypothesis that groundwater composition would vary depending on the width of the marsh. The focused sampling in 2017 supported this hypothesis (Figures 6, 8). Results from some creeks suggested that salinity-dependent desorption can explain part of the increase in nutrient concentrations with marsh width (Figure 7), but we also found evidence that nutrient concentrations increase with marsh width in relatively low-salinity marshes where salinity did not vary with marsh width (Figure 8). Concentrations of TDN in groundwater of the low salinity tidal creeks were remarkably high (ranging from 26 to 1650 μmol N/L with a mean of 441 μmol N/L), relative to previous observations for surface waters in these same creeks. For example, Sanger et al. (2015), in a broad survey of tidal creeks in the Southeastern USA over multiple years, found that surface water TDN concentrations in Bulls and Shem creek never exceeded 110 μmol N/L and averaged just 53 μmol N/L (Sanger, pers. comm.). These dramatic differences in dissolved N concentrations, although not sampled concurrently, are consistent with the notion of marshes as exporters of nutrients to surface waters (Krest et al., 2000) and that internal processes (both biotic and abiotic) are the major drivers of nutrient cycling and marsh export (Porubsky et al., 2014).
Seasonal Differences
After finding linear relationships between marsh width and groundwater composition in the data from summer 2017, the lack of those relationships in the winter data was unexpected. We speculate that different rainfall patterns or seasonal declines in mean water level, which reach 25–50 cm in winter in the southeastern U.S. (Morris, 2000; Wilson et al., 2015a), caused the influence of tidally-driven mixing to decline. Lower mean water levels mean that the marsh is inundated less frequently (Hughes et al., 2012). The area of the marsh that is inundated also declines, as does the volume of groundwater that circulates through the marsh sediments (Morris, 2000; Wilson et al., 2015a). These hydrologic changes likely explain the loss of the relationship between marsh width and salinity.
Additional factors could contribute to the loss of relationships between marsh width and nutrient concentrations. Long-term observations from North Inlet, SC, show that groundwater nutrient concentrations decline in the winter (Morris, 2000). These seasonal variations were attributed to seasonal variations in the balance between remineralization and consumption (Morris, 2000), both of which are in turn influenced by winter declines in temperature and plant productivity. More intensive sampling (either over a longer part of winter, or over multiple years) will be required to discern the relative impacts of recent rainfall and seasonal variations in sea level, temperature and plant productivity.
Marshes as Buffers for Development
With regard to the hypothesis that marshes act as buffers to development, our results raised two new questions. The first is, if marshes can act as buffers, how wide must they be to be effective? At Village Creek, the salinity reached nearly 30 in marshes of 40–50 m width (Figure 6). At Crab Haul Creek, similar salinities did not appear until nearly 100 m width (Figure 6). In Bull Creek (Figure 8), increasing mixing occurs over at least 60–80 m. The width required to buffer development almost certainly depends on the volume of fresh groundwater discharging from the upland. Resistivity surveys collected from a transect near the head of Crab Haul Creek suggested that the distance that fresh groundwater reaches into the marsh from the uplands can vary by 5–10 m over the course of a year (Carter et al., 2008). The distance that freshwater reaches must vary even more between sites, depending on the width of the upland and the stratigraphy of the marsh.
The second question raised by the linear regression results is why creekbank groundwater composition varied with marsh width in some creeks but not in others. One strong possibility is that some marshes do not fit the conceptual model (Figure 1) in which a sandy sub-marsh aquifer is confined by an overlying mud layer. In this conceptual model, the sub-marsh aquifer creates a key hydraulic connection between the upland and the creekbank (Wilson et al., 2015a,b). In marshes composed primarily of fine-grained sediments, transport and mixing below the marsh surface will be greatly reduced (Wilson and Gardner, 2006; Wilson and Morris, 2012), and fresh groundwater could seep out through relatively sandy sediments near the forest-marsh boundary rather than traveling below the marsh toward the tidal creek. Groundwater at the creekbank would be hydraulically isolated from the upland, and the composition of this groundwater would be dominated by transport of creekwater through the marsh sediments, regardless of marsh width. Groundwater below creekbanks in marshes that are primarily sandy may also be dominated by water sourced from the creek, due to much greater infiltration of creek water into the permeable marsh sediments during inundating tides (see simulations in Wilson and Gardner, 2006). Enhanced mixing in very sandy marshes means that the marsh could still act as a buffer for development, but the unconfined system would not show the wide linear mixing zone that is characteristic of our conceptual model. We also note that the fine-grained “mud” in the root zone may in fact be fine silica silt rather than clay particles (Das et al., 2013). In marshes with significant clay fractions, the sorption properties of the sediments may also affect groundwater composition.
Another way to test the hypothesis that marshes can act as buffers for development would be to test for variations in groundwater composition as a function of distance from the upland rather than testing for variations in groundwater composition as a function of total marsh width, as we did in the current study. It would be very resource-intensive to collect groundwater samples in transects reaching from the upland to the creekbank at multiple sites, but this would allow sampling of the stratigraphy as well as avoiding questions related to mixing with new tidal creek water near the creekbank.
Sources of Uncertainty
In addition to uncertainty related to the relatively small number of creek systems that we were able to sample, errors in estimating the extent of the zone of rapid tidal mixing in the subsurface could have affected our results. Samples pulled from the hypokymatic zone (Wilson et al., 2016; analogous to the hyporheic zone in freshwater streams) could reflect significant mixing with relatively unmodified creek water that enters the subsurface directly through the creekbank during high tides. (We note that the entire marsh is influenced by tidal creek water, because creek water enters the marsh surface during high tide and later returns to the creek, but we are concerned here with the exchange as it impacts our sampling at the creekbank.) We planned to avoid the hypokymatic zone by sampling from a sandy layer at least 1 m below the sediment-water interface, based on our conceptual model, but variations in stratigraphy meant that the depth of sampling varied, and the size of the hypokymatic zone is poorly known in salt marshes in any case. The size also undoubtedly varies between sites.
Our results showed significant relationships between groundwater composition, development and marsh width, but multiple other factors may also contribute to variations in groundwater composition along individual creeks as well as between different creeks. As previously described, these factors include variations the salinity of the surface water from the headwaters to the mouth of the creek or between creeks; differences in the rate of fresh groundwater discharge from uplands; differences in stratigraphy and sediment composition; and variations in biogeochemical cycling in areas of differing ecological productivity or plant zonation. Spatial and temporal variations in tidal amplitude and in the elevation of the marsh relative to sea level also strongly affect the volume of groundwater exchange (Wilson et al., 2015a) and the ecological productivity (Morris, 2000) of salt marshes, which in turn should to influence groundwater composition. We speculate that, after marsh width and development, the two most influential abiotic factors are likely to be stratigraphy and marsh elevation. Overall, however, the next most important step may be expanding this kind of investigation to other geographic regions.
Conclusion
This study, although small, revealed statistically significant differences between groundwater composition in developed and undeveloped salt marsh systems in the southeastern United States. Results suggest that development is associated with lower average concentrations of DOC in fresh groundwater below uplands. Development was also associated with higher average concentrations of TDP in creekbank groundwater samples throughout the study. Higher concentrations of TDN were documented in creekbank groundwater samples during the second year of the study, when samples were collected from only six creek systems.
Results support the role of salt marshes as buffers for development. Wider marshes showed evidence of enhanced mixing and reaction, at least during the summer. This was particularly clear in creeks where wider marshes correlated with higher creekbank salinities, but it also included two marshes in which nutrient concentrations measured at the creekbank increased with marsh width despite nearly constant salinity. Thus, also though salinity is clearly an important control on nutrient concentrations via its influence on sorption, nutrient concentrations are a complex function of salinity and other ecosystem processes. Preliminary evidence from three marshes that showed relatively clear mixing trends suggests that marshes 50–100 m wide can act as effective buffers.
The small sample size in this work, as well as additional sources of variability that remained unquantified in this work, mean that our hypotheses and conclusions will require further testing. The additional sources of variability, which range from differences in stratigraphy and plant communities to seasonal variations in temperature and hydrology, mean that the patterns we seek may be difficult to detect. However, the fact that we detected any patterns at all in these highly diverse and heterogeneous systems suggests that patterns do indeed exist.
Data Availability Statement
The original contributions presented in the study are included in the article/Supplementary Material. Further inquiries can be directed to the corresponding author/s.
Author Contributions
MS collected all of the field data for the project, analyzed many samples in the lab, and conducted all of the statistical analyses as part of her M.S. thesis. AW was MS's thesis advisor and lead PI on the grant that supported the project. ES supervised MS's field work, supervised chemical analyses, and was a co-PI on the grant. AW rewrote MS's thesis and redrafted all of the figures for submission to Frontiers in Water, in collaboration with ES.
Conflict of Interest
The authors declare that the research was conducted in the absence of any commercial or financial relationships that could be construed as a potential conflict of interest.
Publisher's Note
All claims expressed in this article are solely those of the authors and do not necessarily represent those of their affiliated organizations, or those of the publisher, the editors and the reviewers. Any product that may be evaluated in this article, or claim that may be made by its manufacturer, is not guaranteed or endorsed by the publisher.
Acknowledgments
In memory of L. Robert (Bob) Gardner. This is number 1901 in Contributions of the Belle W. Baruch Institute for Marine and Coastal Sciences. This paper benefitted from discussions with Billy Moore, Jim Morris, and Claudia Benitez-Nelson. We thank Black Water Outdoors for generously lending us a canoe. We thank field assistants John Baker Stevens, Allison Davis, and Parker Whitley, as well as Susan Denham for laboratory assistance. Data from the National Land Cover Database can be accessed at https://www.mrlc.gov/national-land-cover-database-nlcd-2016. This paper was prepared as a result of work sponsored by the S.C. Sea Grant Consortium with NOAA financial assistance number NA14OAR4170088. The statements, findings, conclusions, and recommendations are those of the author(s) and do not necessarily reflect the views of the South Carolina Sea Grant Consortium or NOAA. Additionally, South Carolina Sea Grant Consortium and NOAA may copyright any work that is subject to copyright and was developed, or for which ownership was purchased, under financial assistance number NA14OAR4170088. The South Carolina Sea Grant Consortium and NOAA reserve a royalty-free, nonexclusive and irrevocable right to reproduce, publish, or otherwise use the work for Federal purposes, and to authorize others to do so.
Supplementary Material
The Supplementary Material for this article can be found online at: https://www.frontiersin.org/articles/10.3389/frwa.2021.770819/full#supplementary-material
References
Beach, D.. (2002). Coastal Sprawl: The effects of urban design on aquatic ecosystems in the United States. Pew Ocean Commission. (Arlington, VA: Pew Charitable Trust), 403–480.
Benner, R., and Strom, M. (1993). A critical evaluation of the analytical blank associated with DOC measurements by high-temperature catalytic oxidation. Marine Chem. 41, 153–160. doi: 10.1016/0304-4203(93)90113-3
Carter, E. S., White, S. M., and Wilson, A. M. (2008). Variation in groundwater salinity in a tidal salt marsh basin, North Inlet Estuary, South Carolina. Estuar. Coast. Shelf Sci. 76, 543–552. doi: 10.1016/j.ecss.2007.07.049
Charette, M. A., Splivallo, R., Herbold, C., Bollinger, M. S., and Moore, W. S. (2003). Salt marsh submarine groundwater discharge as traced by radium isotopes. Marine Chem. 84, 113–121. doi: 10.1016/j.marchem.2003.07.001
Childers, D. L., Day, J. W., and McKellar, H. N. (2000). Twenty more years of marsh and estuarine flux studies: revisiting nixon (1980). In: Weinstein, M. P., and Kreeger, D. A. (eds). Concepts and Controversies in Tidal Marsh Ecology. Kluwer Academic Publishers. p. 391–423. doi: 10.1007/0-306-47534-0_18
Das, R., Bizimis, M., and Wilson, A. M. (2013). Tracing mercury seawater vs. atmospheric inputs in a pristine SE USA salt marsh system: Mercury isotope evidence. Chem. Geol. 336, 50–61. doi: 10.1016/j.chemgeo.2012.04.035
DiDonato, G.T., Stewart, J.R., Sanger, D.M., Robinson, B.J., Thompson, B.C., Holland, A.F., and Van Dolah, R.F. (2009). Effects of changing land use on the microbial water quality of tidal creeks. Marine Pollut. Bull. 58, 97–106. doi: 10.1016/j.marpolbul.2008.08.019
Gardner, L. R., and Porter, D. E. (2001). Stratigraphy and geologic history of a southeastern salt marsh basin, North Inlet, South Carolina, USA. Wetlands Ecol. Manage. 9, 371–385. doi: 10.1023/A:1012060408387
Gilbert, P., and Loder, T. (1977). Automated analysis of nutrients in seawater. Technical Report WHOI- 1-41. Woods Hole Oceanography Institute, Woods Hole, MA, USA.
Goñi, M. A., and Gardner, I. R. (2003). Seasonal dynamics in dissolved organic carbon concentrations in a coastal water-table aquifer at the forest-marsh interface. Aquatic Geochem. 9, 209–232. doi: 10.1023/B:AQUA.0000022955.82700.ed
Grewell, B. J., Callaway, J. C., Ferren, J., and Wayne, R. (2007). Estuarine Wetlands. In: Barbour, M. (eds). Terrestrial Vegetation of California, 3rd Ed. University of California Press, Los Angeles, CA, CA. p. 124–154. doi: 10.1525/california/9780520249554.003.0005
Holland, A. F., Sanger, D. M., Gawle, C. P., Lerberg, S. B., Santiago, M. S., Riekerk, et al. (2004). Linkages between tidal creek ecosystems and the landscape and demographic attributes of their watersheds. J. Exper. Marine Biol. Ecol. 298, 151–178. doi: 10.1016/S0022-0981(03)00357-5
Hopkinson, C. S., and Giblin, A. (2008). Nitrogen dynamics of coastal salt marshes. In: Bronk, D. (eds). Nitrogen in the Marine Environment. Elsevier. p. 991–1037. doi: 10.1016/B978-0-12-372522-6.00022-0
Hughes, A. L. H., Wilson, A. M., and Morris, J. T. (2012). Hydrologic variability in a salt marsh: assessing the links between drought and acute marsh dieback. Estuar. Coast. Shelf Sci. 111, 95–106. doi: 10.1016/j.ecss.2012.06.016
Hughes, C. E., Binning, P., and Willgoose, G. R. (1998). Characterisation of the hydrology of an estuarine wetland. J. Hydrol. 11, 34–49. doi: 10.1016/S0022-1694(98)00194-2
Hutchins, P. R., Smith, E. M., Koepfler, E. T., Viso, R. F., and Peterson, R. N.. (2014). Metabolic responses of estuarine microbial communities to discharge of surface runoff and groundwater from contrasting landscapes. Estuaries Coast. 37, 736–750.
Krest, J. M., Moore, W. S., Gardner, L. R., and Morris, J. T. (2000). Marsh nutrient export supplied by groundwater discharge: evidence from radium measurements. Global Biogeochem. Cycle. 14, 167–176. doi: 10.1029/1999GB001197
Larson, C., and Belovsky, G. (2013). Salinity and nutrients influence species richness and evenness of phytoplankton communities in microcosm experiments from Great Salt Lake, Utah, USA. J. Plankton Res. 35, 1154–1166.
Lerberg, S. B., Holland, A. F., and Sanger, D. M. (2000). Responses of tidal creek macrobenthic communities to the effects of watershed development. Estuaries 23, 838. doi: 10.2307/1353001
Mitch, W. J., and Gosselink, J. G. (2015). Wetlands. 5th ed. John Wiley and Sons, Inc., Hoboken, New Jersey.
Monaghan, E. J., and Ruttenberg, K. C. (1999) Dissolved organic phosphorus in the coastal ocean: Reassessment of available methods and seasonal phosphorus profiles from the Eel River Shelf. Limnol. Oceanogr. 44, 1702–1714.
Moore, W. S.. (1999). The subterranean estuary: a reaction zone of ground water and sea water. Marine Chem. 65, 111–125. doi: 10.1016/S0304-4203(99)00014-6
Morris, J. T.. (2000). Effects of sea-level anomalies on estuarine processes. In: Hobbie, J. (eds). Estuarine Science: A Synthetic Approach to Research and Practice. Island Press, Washington, D.C.
Nixon, S.. (1980). Between coastal marshes and coastal waters - A review of twenty years of speculation and research on the role of salt marshes in estuarine productivity and water chemistry. In: Hamilton, P., and Macdonald, K. (eds). Estuarine and Wetland Processes, with Emphasis on Modeling. Marine Sci. Springer Science+Business Media, New York. p. 437–526. doi: 10.1007/978-1-4757-5177-2_20
NOAA (2013). National Coastal Population Report: Population Trends from 1970 to 2020. Available online at: stateofthecoast.noaa.gov.
Oh, Y. H., Lee, Y-. W., Park, S. R., and Kim, T-, H. (2017). Importance of dissolved organic carbon flux through submarine groundwater discharge to the coastal ocean: Results from Masan Bay, the southern coast of Korea. J. Marine Syst. 173, 43–48. doi: 10.1016/j.jmarsys.2017.03.013
Porubsky, W. P., Weston, N. B., Moore, W. S., Ruppel, C., and Joye, S. B. (2014). Dynamics of submarine groundwater discharge and associated fluxes of dissolved nutrients, carbon, and trace gases to the coastal zone (Okatee River estuary, South Carolina). Geochim. Cosmochim. Acta. 131, 81–97. doi: 10.1016/j.gca.2013.12.030
Rodellas, V., Stieglitz, T. C., Andrisoa, A., Cook, P. G., Raimbault, P., Tamborski, J. J., et al. (2018). Groundwater-driven nutrient inputs to coastal lagoons: The relevance of lagoon water recirculation as a conveyor of dissolved nutrients. Sci. Total Environ. 642, 764–780. doi: 10.1016/j.scitotenv.2018.06.095
Sanger, D., Blair, A., DiDonato, G., Washburn, T., Jones, S., Riekerk, G., Wirth, E., and Stewart, J. (2015). Impacts of coastal development on the ecology of tidal creek ecosystems of the US southeast including consequences to humans. Estuar. Coast. 38, 1–18. doi: 10.1007/s12237-013-9635-y
Sanger, D. M., Holland, A. F., and Scott, G. I. (1999b). Environmental contamination and toxicology tidal creek and salt marsh sediments in south carolina coastal estuaries : I. distribution of trace metals. Arch. Environ. Contamin. Toxicol. 37, 445–457. doi: 10.1007/s002449900539
Sanger, D. M., Holland, A. F. D., and Scott, G. I. (1999a). Tidal creek and salt marsh sediments in south carolina coastal estuaries: II. distribution of organic contaminants. Arch. Environ. Contamin. Toxicol. 37, 458–471. doi: 10.1007/s002449900540
Santos, I. R., Burnett, W. C., Chanton, J., Mwashote, B., Suryaputra, A., Dittmar, T., et al. (2008). Nutrient in a Gulf of Mexico subterranean and groundwater- estuary biogeochemistry derived fluxes to the coastal ocean. Limnol. Oceanography 53, 705–718. doi: 10.4319/lo.2008.53.2.0705
Shanahan, M.. (2018). The impact of upland development and marsh width on groundwater composition in estuarine tidal creeks in the southeastern coastal United States. University of South Carolina. Available online at: https://scholarcommons.sc.edu/etd/4790/.
Slomp, C. P., and Van Cappellen, P. (2004). Nutrient inputs to the coastal ocean through submarine groundwater discharge: controls and potential impact. J. Hydrol. 295, 64–86. doi: 10.1016/j.jhydrol.2004.02.018
Sundareshwar, P., and Morris, J. T. (1999). Phosphorus sorption characteristics of intertidal marsh sediments along an estuarine salinity gradient. Oceanography 44, 1693–1701. doi: 10.4319/lo.1999.44.7.1693
Valiela, I., and Teal, J. M. (1979). The nitrogen budget of a salt marsh ecosystem. Nature 280, 652–656. doi: 10.1038/280652a0
Verity, P. G.. (2002). A decade of change in the skidaway river estuary: I. hydrography and nutrients. Estuaries 25, 944–960. doi: 10.1007/BF02691343
Wang, G., Han, A., Chen, L., Tan, E., and Lin, H. (2018). Fluxes of dissolved organic carbon and nutrients via submarine groundwater discharge into subtropical Sansha Bay, China. Estuar. Coast. Shelf Sci. 207, 269–282. doi: 10.1016/j.ecss.2018.04.018
Weigert, R. G., and Freeman, B. J. (1990). Tidal Salt Marshes of the Southeast Atlantic Coast: A Community Profile. Biological Report 85(7, 29.). U.S. Fish and Wildlife Service, Washington, D.C. doi: 10.2172/5032823
Whiting, G. J., and Childers, D. L. (1989). Subtidal advective water flux as a potentially important nutrient input to Southeastern USA Saltmarsh Estuaries. Estuaries Coast. Shelf Sci. 28, 417–431.
Wilson, A. M., Evans, T., Moore, W., Schutte, C. a, and Joye, S. B. (2015b). Groundwater controls ecological zonation of salt marsh macrophytes. Ecology 96, 840–849. doi: 10.1890/13-2183.1
Wilson, A. M., Evans, T. B., Moore, W. S., Schutte, C. A., and Joye, S. B. (2015a). What time scales are important for monitoring tidally influenced submarine groundwater discharge? Insights from a salt marsh. Water Resour. Res. 51, 4198–4207. doi: 10.1002/2014WR015984
Wilson, A. M., and Gardner, L. R. (2006). Tidally driven groundwater flow and solute exchange in a marsh: Numerical simulations. Water Resour. Res. 42, W01405. doi: 10.1029/2005WR004302
Wilson, A. M., and Morris, J. T. (2012). The influence of tidal forcing on groundwater flow and nutrient exchange in a salt marsh-dominated estuary. Biogeochemistry 108, 27–38. doi: 10.1007/s10533-010-9570-y
Wilson, A. M., Woodward, G. L., and Savidge, W. B. (2016). Using heat as a tracer to estimate the depth of rapid porewater advection below the sediment-water interface. J. Hydrol. 538, 743–753. doi: 10.1016/j.jhydrol.2016.04.047
Keywords: salt marsh, groundwater, nutrients, organic carbon, coastal development, salinity
Citation: Wilson AM, Shanahan M and Smith EM (2021) Salt Marshes as Groundwater Buffers for Development: A Survey of South Carolina Salt Marsh Basins. Front. Water 3:770819. doi: 10.3389/frwa.2021.770819
Received: 05 September 2021; Accepted: 22 November 2021;
Published: 17 December 2021.
Edited by:
Yan Zhang, China University of Geosciences, ChinaReviewed by:
Kai Xiao, Southern University of Science and Technology, ChinaYi Liu, The University of Hong Kong, Hong Kong SAR, China
Copyright © 2021 Wilson, Shanahan and Smith. This is an open-access article distributed under the terms of the Creative Commons Attribution License (CC BY). The use, distribution or reproduction in other forums is permitted, provided the original author(s) and the copyright owner(s) are credited and that the original publication in this journal is cited, in accordance with accepted academic practice. No use, distribution or reproduction is permitted which does not comply with these terms.
*Correspondence: Alicia M. Wilson, YXdpbHNvbkBzZW9lLnNjLmVkdQ==