
94% of researchers rate our articles as excellent or good
Learn more about the work of our research integrity team to safeguard the quality of each article we publish.
Find out more
ORIGINAL RESEARCH article
Front. Water, 22 October 2021
Sec. Water Resource Management
Volume 3 - 2021 | https://doi.org/10.3389/frwa.2021.749507
 Renato Oliveira da Silva-Júnior1*
 Pedro Walfir Martins e Souza-Filho1
 Gabriel Negreiros Salomão1Alexandra Lima Tavares2Jorge Filipe dos Santos1
 Diogo Corrêa Santos1Luanna Costa Dias3Marcio Sousa da Silva1Adayana Maria Queiroz de Melo1Carlos Eduardo Aguiar de Souza Costa1Edson José Paulino da Rocha4
Impacts on global water resources may be intensifying due to the growing and differentiated forms of land use and occupation, which influence the water cycle and thus the maintenance of life. In the Amazon, the effect may be even worse, as it is one of the world's most vulnerable regions to these changes. This work aimed to analyze the response of the components of the water balance to changes in land use and cover in the Eastern Amazon over three decades (1980–2013). First, soil texture maps were prepared. These combined with the classes of use in each decade let us estimate the values of storage and variation in storage (ΔS) of water in the soil. The behavior of the components of the water balance [precipitation, potential evapotranspiration, actual evapotranspiration (E), and ΔS] were analyzed according to the Budyko model on the annual scale as a function of the aridity and evaporative indices. For the seasonal scale, a new parameter (y0) was introduced to explicitly represent the additional water available for E, in addition to instantaneous precipitation. The seasonality of the rains and the seasonal dynamics of storage were directly incorporated into the model developed, which allowed us to understand what the dominant control factors of water balance are. In the decade from 2000 to 2009, the remaining forest cover is only 48.91%, while the cover formed by pasture is 50.47%, meaning the water storage capacity in the soil decreased 8.1%. In the 1990s, to 1999, precipitation shows a reduction, probably as a reflection of the very strong events of La Niña and El Niño (1988–1989 and 1997–1998). Observing the sum of the surface area of water bodies in the region and the relationship of forest vs. pasture, it is possible to infer that the elevation in evapotranspiration is more related to the increase in evaporation due to the increase in the pasture area than to the reduction transpiration due to forest loss, reinforcing the hypothesis that evapotranspiration increases with pasture area.
Anthropogenic activities alter the landscape, vegetation, climate, and atmospheric composition, resulting in changes in the terrestrial water balance, water resources, and ecohydrological patterns (Van der Velde et al., 2014; Wang et al., 2016). The effects of changes in hydrology show strong spatial and temporal variations due to variability in climatic factors such as precipitation and watershed heterogeneity. An rising trend in air temperatures and a falling trend in potential evaporation have been reported in many parts of the world (Golubev et al., 2001; Hobbins et al., 2004; Roderick and Farquhar, 2004; Souza-Filho et al., 2016).
Research on the hydrological role of vegetation has been conducted over several decades (Horton, 1919; Wicht, 1941; Penman, 1963; Bosch and Hewlett, 1982; Turner, 1991). Experimental results show that reductions in forested areas produce increases in streamflow, although the magnitudes of these increases may be different (Bosch and Hewlett, 1982; Bruijnzeel, 1990). Large watersheds, with an area greater than 10,000 km2, tend to show a mosaic of uses and practices, with heterogeneities in geology, topography, and soil. This factor, added to the spatial and temporal variability in climate, causes the hydrological responses in large and small watersheds to be different (Wilk et al., 2001).
Forests and cerrado vegetation have given way to pasture, agricultural cultivation, economic development, expansion of cities and mining enterprises, etc. In Brazil, forest has been widely replaced by pasture, which covers large-scale watersheds, but there are still few studies on the impacts of land-use changes in these watersheds, and there is a lack of a common method for such investigations (Bayer, 2014; Lucas-Borja et al., 2020). In the Amazon basin, one of the most important watersheds in the world, territorial planning and water management are critical, as nearly 370,000 km2 of the native vegetation has been cleared since 1990 (Pailler, 2018).
Characterizing the water balance behavior at various time scales (especially in the Amazon region) remains an important but challenging research task because the factors controlling precipitation partitioning vary with the time scale, such as rainfall intensity, vegetation cover type, and topography, and are fundamental to all types of runoff (Dunne and Black, 1970; Beven and Kirkby, 1979; Rizzo et al., 2020; Moniruzzaman et al., 2021). The regional water yield at a mesoscale can be estimated as the difference between input (precipitation) and output (evapotranspiration). Evapotranspiration (evaporation + transpiration) is an important flow term in the water cycle and a key variable for understanding the complex interactions between climate, vegetation, and soil (Dooge, 1992; Zhang et al., 2001; Donohue et al., 2007; Huo et al., 2013; Wang et al., 2016). Evapotranspiration is also used to diagnose changes in hydrological processes at the watershed scale (Liu and Yang, 2010).
Budyko (1958, 1974) created a widely used system to investigate energy and water flows in watersheds. It considers that the available energy (expressed as potential evapotranspiration, ETo) and water supply (expressed as precipitation, P) control the current long-term mean evapotranspiration and runoff rates on a regional or watershed scale. The Budyko model results from the coevolution of vegetation, soil, and geomorphology with climate and explains hydrology as a system without focusing on physical processes in isolation (Gentine et al., 2012; Troch et al., 2013; Wang and Wu, 2013; Harman and Troch, 2014; Wang and Tang, 2014; Wang et al., 2016).
Therefore, understanding and quantifying the impacts of land use and land cover variation on hydrological responses is important for devising strategies to manage water resources and land use and resolve conflicts over the use of water resources, especially in areas where the water supply is limited during the dry season (Kumar et al., 2019). This assertion establishes a hydrological paradox associated with the paradigm that in the Amazonian environment, one of the largest water sources on the planet, despite the high precipitation rates, many rivers and water bodies, such as the Itacaiúnas River Watershed (IRW), have intermittent regimes, reduced water storage capacity, and lack of watershed regulation (Iriondo and Latrubesse, 1994; Alves and Beserra Neta, 2018; Salomão et al., 2019).
The IRW is located in the Amazonian deforestation arc, where 50% of the area was deforested between the 1970s and 2010s (Pontes et al., 2019). Changes in land use in the IRW (Souza-Filho et al., 2015, 2016, 2018; Silva Júnior et al., 2017a) associated with the development of agriculture, which has been replacing forest with pastures, together with the increase in agricultural area, have caused an imbalance in the hydrological regime, leading to increased soil and water degradation in recent decades. To investigate this further, this study quantified the response of long-term (annual) and seasonal (monthly) water balance components to changes in land use and vegetation cover from 1980 to 2013 in the IRW, Eastern Amazon.
The IRW, included in the Tocantins–Araguaia hydrographic region (Brazil., 2003), drains an area of ~42,000 km2. In the relief, the Serra dos Carajás mountain range stands out, with altitudes ranging from 400 to 900 m, in contrast to the adjacent areas of 80-300 m altitude. Two types of land cover predominate, tropical forest and montane savanna, and the land use is dominated by extensive pasturelands surrounding a mosaic of forest remnants composed of indigenous lands and conservation units, which occupy 11,700 km2 (Figure 1), or approximately a quarter of the watershed area (Souza-Filho et al., 2016; Silva Júnior et al., 2017b).
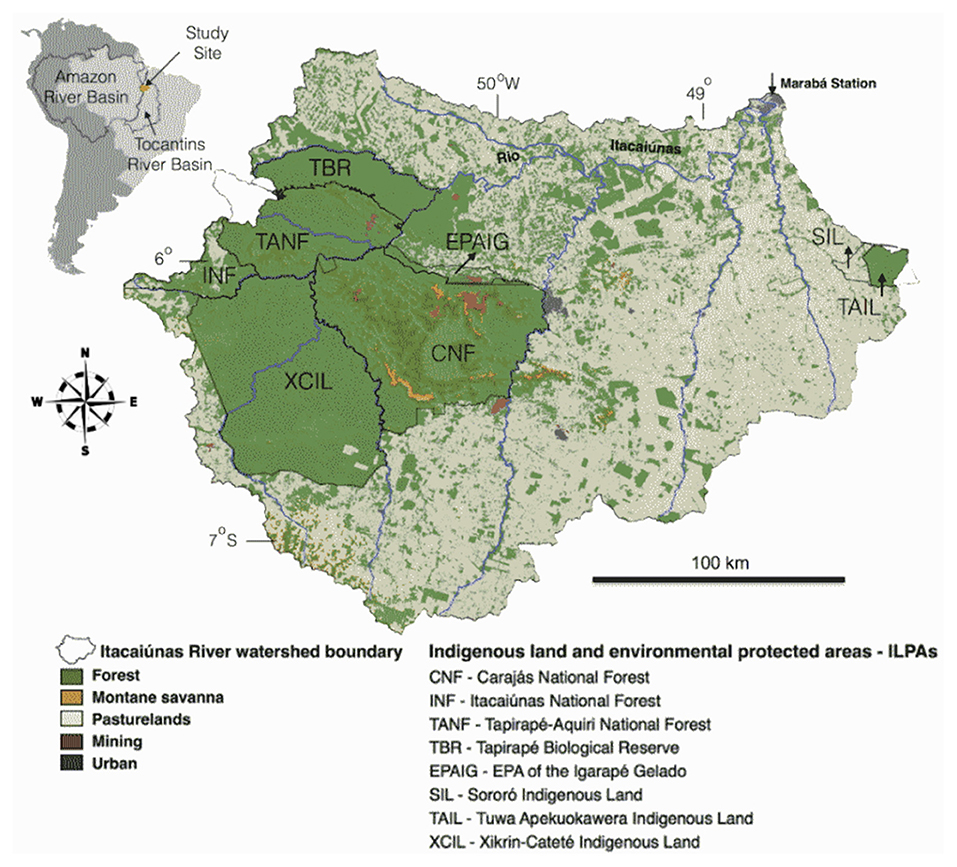
Figure 1. Temporal and spatial variation in land cover and land use in the IRW in 2013. Polygons define the boundaries of indigenous lands and conservation units. The Marabá station is located in the extreme northeast. Source: Adapted from Souza-Filho et al. (2016).
Thin soils with low water storage capacity, predominantly dystrophic red-yellow argisols, are located in the less sloping regions and are made mostly of mineral material with a low degree of saturation (<50%). The two other soil classes are dystrophic red-yellow latosols and dystrophic litholic neosols (according to the Brazilian Soil Classification System). Latosols are mainly present in land units in the Southern Amazon Residual Plateaus (Carajás Mountains and plateaus) and in hills with medium slopes. Latosols vary from strongly to well drained, and moderately or imperfectly drained soils also occur (Embrapa, 2006). Neosols are usually present in areas with more undulating relief.
Alvares et al. (2013) define the climate of the region as typical tropical monsoon (Am). According to the Brazilian National Institute of Meteorology (INMET, 1992), the mean air temperature is above 26°C, with a mean value recorded for the watershed region of 27.2°C and a relative air humidity of ~80%. The wet (November to May) and dry seasons (June to October) are well-defined, with total annual precipitation indices ranging from 1,420 to 2,159 mm, including a mean annual total of ~1,452 mm in the wet season and 236 mm in the dry season. The highest rainfall indices are concentrated between December and May, reaching between 71 and 84% of the mean annual rainfall, while the driest period runs from June to August, with a mean of 2.4 to 5.5% of the total annual rainfall recorded (Silva Júnior et al., 2017b).
The water balance concept, expressed in Equation (1), is useful to evaluate how changes in catchment conditions can alter the partitioning of rainfall into different components (Zhang et al., 2001):
where P is precipitation, ET is evapotranspiration, Q is the sum of surface and subsurface runoff measured as streamflow, and ΔS is the variation in soil water storage. Precipitation is the largest term in the equation and varies temporally and spatially. In most hydrological applications, it is appropriate to assume that precipitation is independent of vegetation type (Calder, 1998). However, on the continental scale, some studies using general circulation models suggest that vegetation type can affect precipitation regime (Rowntree, 1988; Gash et al., 1994; Xue, 1997; Gandu et al., 2004; Coe et al., 2009). Evapotranspiration is the second-largest term in the equation and is directly linked to vegetation characteristics. In arid and semiarid regions, evapotranspiration is almost always equal to precipitation, and in humid areas, it is limited by the available energy. Runoff is affected by vegetation structure, interception, and transpiration (Zhang et al., 2001). In annual terms, surface runoff generally has a good correlation with rainfall, particularly in areas where potential evaporation and precipitation are out of phase (Budyko, 1974). The last term in the equation corresponds to the change in soil water storage. In a long-term estimate (5–10 years), it is reasonable to assume that the changes in soil water storage are negligible compared to the mean annual precipitation intensity. Available energy is represented by potential evaporation and water availability by precipitation. However, water storage dynamics are significant at the monthly and seasonal scales and therefore should be considered when calculating available water supply (Chen et al., 2013). Recharge, the smallest term in the equation, is usually inferred from precipitation and evapotranspiration measurements.
Budyko (1958, 1974) postulates the following relationships as valid under very dry conditions:
where Q is runoff, P is precipitation, ET is evapotranspiration, and Rn is the net radiation. Under very wet conditions, the relationships are as follows:
The rational function that satisfies the conditions presented in Equations (2, 3) is:
where w is the plant-available water coefficient and represents the relative difference in the way the plants use soil water for transpiration.
It is important to emphasize that there was no measurement of groundwater recharge, so it could not be considered in the calculations developed. Because IRW is located in the Carajás Mineral Province, the largest mining district in Brazil with active mines of iron, copper, nickel and manganese, the soil in the region is mostly crystalline, very fractured, which makes storage difficult. large amounts of water that may make some difference in our study (Sahoo et al., 2019; Salomão et al., 2020).
Evapotranspiration is a complex process that is affected by precipitation interception, net radiation, advection, turbulent transport, canopy resistance, leaf area, and plant-available water (McNaughton and Jarvis, 1983; Zhang et al., 1999, 2001). Under arid conditions, the main factors controlling evapotranspiration are water and canopy resistance, and under humid conditions, advection, net radiation, leaf area, and turbulent transport.
For this study, ETo was taken from Silva Júnior et al. (2017a), who calculated it by eight empirical methods [Penman-Monteith (PM), Priestley-Taylor, Hargreaves-Samani, Camargo, Thornthwaite, Hamon, Kharrufa, and Turc (TC)], among which TC showed the best statistical fit and was used to estimate the potential evapotranspiration (Doorenbos and Pruitt, 1977; Pereira et al., 1997) of the IRW. The input variables in the period from 1980 to 2013 were obtained from data provided by Xavier et al. (2015).
The long-term (annual) ET was calculated by four methods: Schreiber (1904), Pike (1964), Budyko (1974), and Fu (1981), as described in Table 1.
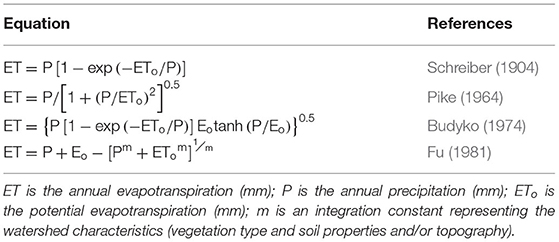
Table 1. Equations used to estimate actual annual evapotranspiration.
Taking as a conceptual basis the applications performed by Wang (2012), Chen et al. (2013), and Wu et al. (2017), the concept of effective precipitation was adopted to define the monthly and seasonal climatic aridity indices and evaporation rates.
Water storage dynamics are significant on a monthly and seasonal scale and therefore should be considered for calculating available water supply, which in dry months includes not only precipitation but also the depletion of stored water in the watershed soil, while watershed storage is replenished by the portion of infiltrated rainwater during wet months. Therefore, the increase in storage should be subtracted from the amount of precipitation (Chen et al., 2013).
According to Wang (2012) and Chen et al. (2013), the effective precipitation (Pm-ΔSm) represents the water availability; thus, the monthly aridity index (Am) and mean monthly aridity index () are defined by the relationship between the available energy and water (Equations 5, 6):
and
where EPm and Pm are the monthly potential evaporation and precipitation, respectively, and ΔSm is the monthly change in soil water storage.
The dry and wet months were defined according to their Am values: wet months had Am <1 and dry months had Am ≥ 1. This limit may not be valid for all years since the definition of dry and wet months is based on (Equation 6). If the monthly aridity index of a year (AI) significantly deviates from its mean value, it is possible that the seasonal aridity indices are greater than 1 in the wet season (or <1 in the dry season).
After the constantly wet and dry months were identified (Equation 6), the aggregate monthly values for the intensities of P, ETo, Q, and ΔS were calculated for each year from 1980 to 2013. For example, the precipitation intensity in the wet (Pw) and dry seasons (Pd) was calculated by Equations (7a,b):
and
where nw and nd are the numbers of wet and dry months in a year (considered constant for the IRW). Similarly, the seasonal EPw and EPd, Qw and Qd, and ΔSw and ΔSd values were calculated from the monthly values of the defined wet and dry seasons, respectively.
The evaporation rate is defined as the ratio between actual evaporation and water supply. It is represented by the effective seasonal precipitation, and the evaporation rates of the wet and dry seasons were calculated by Equations (8a,b):
and
where Aw and Ad are the seasonal AIs for the wet and dry seasons, respectively. Thus, the climatic seasonality of the IRW was modeled using the seasonal AI, whose P intensities and potential evaporation are included in Aw and Ad.
Budyko (1958, 1974) established that the mean long-term (annual) ratio between mean evapotranspiration and mean precipitation (ET/P) is mainly controlled by the water–energy balance in a watershed, being a function (F) of the AI (ϕ = ETo/P, where ETo is the potential evapotranspiration), i.e., E/P = F(ϕ). For a watershed under humid conditions (ϕ < 1), the energy supply controls evapotranspiration, while under arid conditions (ϕ > 1) the water supply is the limiting factor. The limit of F approaches 0 when ϕ tends to 0 under a humid climate and approaches 1 when ϕ tends to infinity (∞) under an arid climate (Zhang et al., 2001; Yang et al., 2014; Gao et al., 2016; Wang et al., 2016). However, the Budyko structure is limited to stable conditions, assuming as a premise an insignificant change in soil water storage. That is, it does not consider processes that promote changes in this storage at any spatial and/or temporal scale.
The equations of Fu (1981) and Choudhury (1999), which consider climate and a specific watershed parameter, have received more attention and applications (Zhang et al., 2004; Zhou et al., 2015; Gao et al., 2016). In the present study, the functional analytical derivation between E/P and Φ = Ep/P (Equation 9) was used at mean annual scales based on simple physical assumptions introduced by Fu (1981) and Zhang et al. (2004):
where ω is a free model parameter. The original formulation introduced by Budyko (1958, 1974) is best represented by setting ω = 2.6 (Zhang et al., 2004). These authors suggested that for a given potential evaporation, the rate of change in evapotranspiration as a function of the rate of change in precipitation (∂E/(∂P) increases with the residual potential evaporation (Ep–E) and decreases with precipitation.
On monthly time scales, changes in water storage (due to changes in storage components, e.g., soil moisture, groundwater, topography, vegetation cover) potentially play an important role in E and Q and are not negligible. These changes may represent a significant source of additional available water (in addition to P) for E. Therefore, the analytically derived modification (Equation 10) proposed by Greve et al. (2016) explicitly represents the additional water available for E, in addition to instantaneous precipitation. The modified structure shows that this additional parameter can represent the conditions in which E monthly or annually exceeds the monthly or annual precipitation, respectively.
This derivation (Equation 10) is similar to the classic solution (Equation 9) but includes y0 as a new parameter. If y0 = 0 (being the original limit condition), the response obtained corresponds to the structure of the steady state of Fu (1981) and Zhang et al. (2004). If y0 > 0, the supply limit is systematically exceeded. The exceedance of the supply limit increases with y0. If y0 = 1, the curve follows the demand limit. All curves are continuous and strictly increasing. The y0 parameter explicitly explains the maximum value of additional water (in addition to the water provided by P) at a given location and within a given time that is available for E.
Although the curve number (CN) theoretically varies from 0 to 100, in practice the validated values (Mishra and Singh, 2003) are in the 40–98 range. The higher the CN value is, the greater the runoff potential in the watershed. The CN values calculated for the IRW are always above 70 (Table 2). The results obtained for storage indicate an 8.1% decrease in the water retention capacity of the watershed soil. The CN values represent the potential water losses of a watershed. As the CN value increases, the initial storage of a watershed decreases, increasing the likelihood of runoff (Tyagi et al., 2008).

Table 2. Evolution of totals (%) corresponding to land use and vegetation cover and the respective curve number and water storage calculated for the IRW over the decades.
Cavalcante et al. (2019) studied the effects of climate variability and human activity on the annual water balance in the IRW and found that the mean annual runoff coefficient underwent major changes between the 1973–1984 period and the 1985–1994 period. Even with the continuous reduction in the forested area in the last two decades (1994–2004 and 2003–2016), the changes in the mean annual runoff coefficient were relatively small, probably due to the intensity of the cutting and burning activities and vegetation regeneration. Figure 2 shows the evolution of the conversion of forest to pasture over the decades along with the soil textures identified in the IRW.
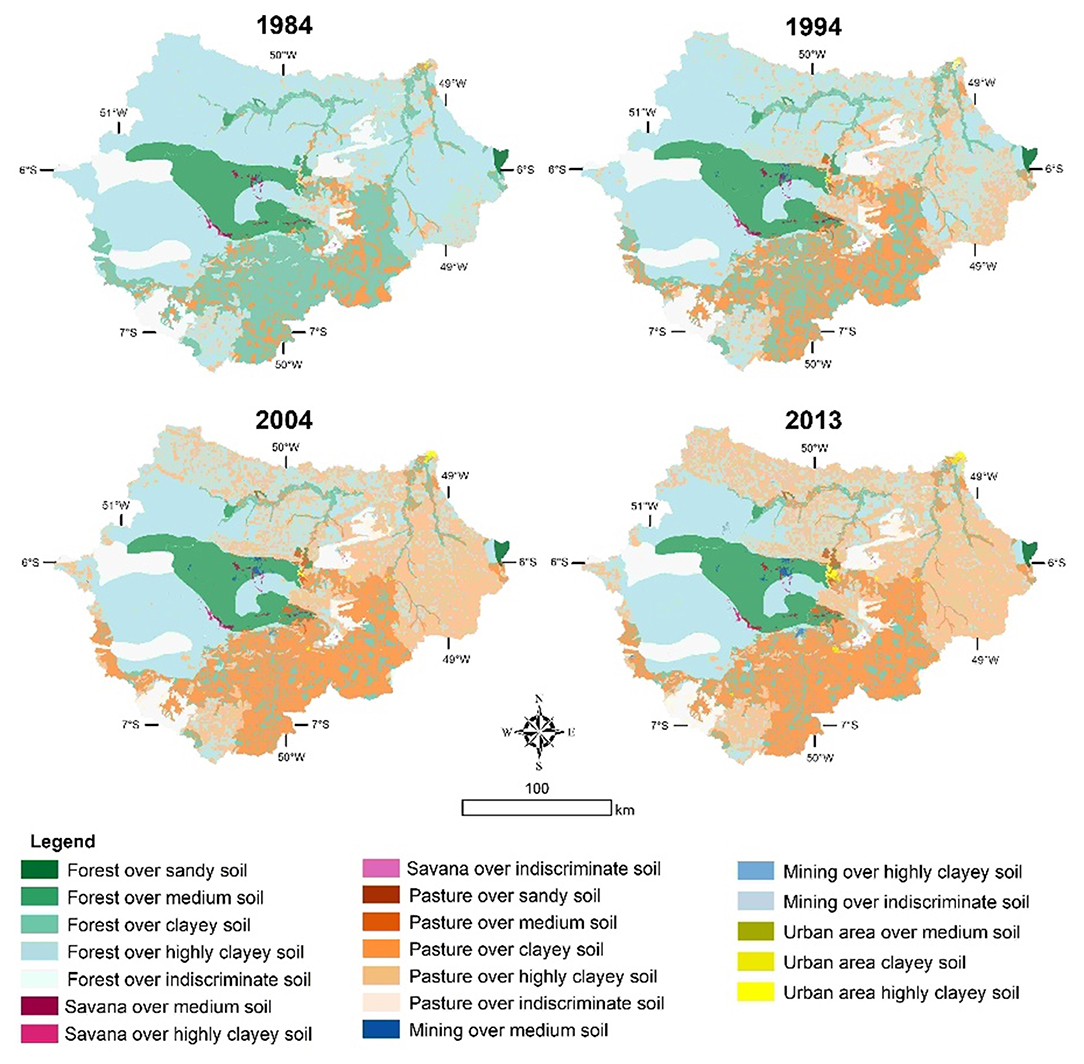
Figure 2. Evolution of the conversion from forest to pasture over the decades along with the soil textures identified in the IRW (1984–2013). Source: Silva Júnior et al. (2017a).
In the 1980s (1980–1989), vegetation cover consisted of forest (89.85%) and pasture (10.07%) (Silva Júnior et al., 2017a). In the following decade (1990–1999), the conversion process increased, forest cover decreased (71.73%), and pasture increased (28.07%) (Souza-Filho et al., 2016). In the last analyzed period (2000–2013), this trend intensified, resulting in the predominance of pasture (50.47%) over primary forest cover (48.91%). Variables such as albedo, temperature, and net radiation (Rn) are directly affected by these changes, especially when they occur on a large scale (Pavão et al., 2017).
Removal of the forest results in less absorption of global solar radiation by the surface and in greater re-emission of longwave radiation from the surface; consequently, the Rn is lower over the deforested area (Andrade et al., 2014). The reduction in the roughness length in deforested area can affect the turbulent transport of heat and water vapor near the surface (Eltahir and Bras, 1994). The higher albedo and surface temperature and lower Rn in deforested areas result in lower evapotranspiration in these locations, thus reducing the available energy for convection and precipitation (Santos et al., 2014).
The annual and seasonal variability in ETo in the IRW and at the Marabá weather station is shown in Figures 3a,b in terms of the mean values calculated by the TC and PM methods. Between 1980 and 1992, the ET shows a trend toward maintenance of the mean values. From 1992 to 2004, there was an increasing trend in the mean annual rates of ET. In this period, the forest cover (53%) is still higher than the pasture cover (46%), and the expected behavior of ET in this period would be a reduction in the mean evapotranspiration values (Wohl et al., 2012). However, there is an increase, which may be associated with the intensification of land use and occupation and the decrease in vegetation cover (Silva Júnior et al., 2017a).
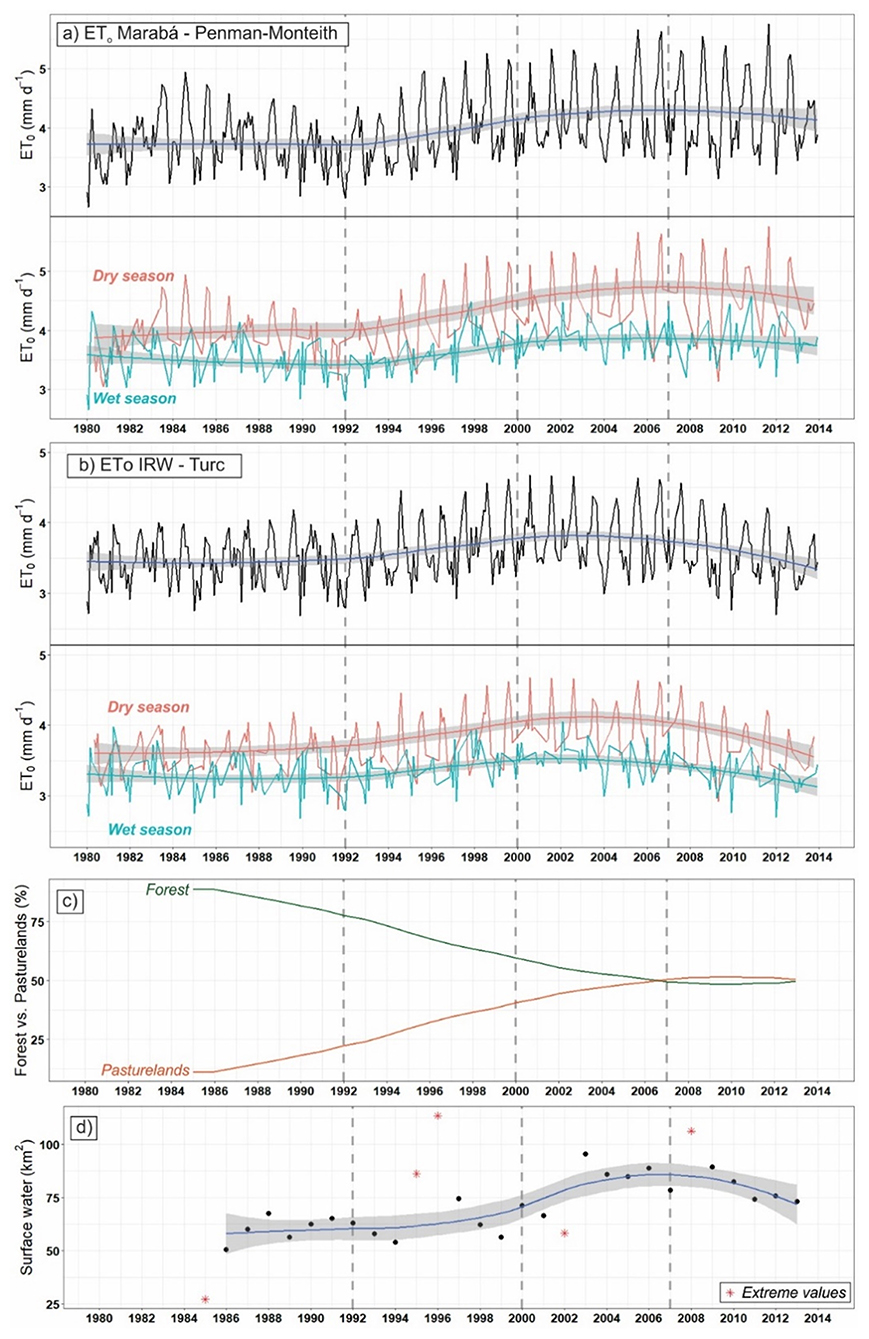
Figure 3. Annual and seasonal variability in ETo by the (a) Penman-Monteith method for Marabá station and (b) the Turc method for the IRW (1980–2013). In (c,d), the evolution of forest conversion into pasture and the sum of the surface area of water bodies in each year from 1985 to 2013 are shown, respectively. Source: ETo data from Silva Júnior et al. (2017a) and land use and cover and water body data from the (Project MapBiomas Alerta, 2017) (https://mapbiomas.org/).
Recent simulations of hydroclimate-related models (Khanna et al., 2017) have shown that horizontal variations in surface roughness between aerodynamically smooth pasture and rugged forests may represent a spatial redistribution of precipitation not explained only by thermal processes. The results indicate a transition from the thermal convective regime to a dynamically dominated one associated with increasing deforestation scales. The direct influence of this transition is a substantial humidification of the downwind sectors of the deforested areas and a similar dryness of the downwind sectors. This contrasts with a thermally dominated convective regime, which resulted in most of the non-precipitating cloudiness and, therefore, may be consequential to ecosystem adaptation in regions deforested downwind. This general behavior may perhaps explain the maintenance of high ETo rates in the IRW, especially between 1990 and 2006, as shown in Figure 3.
A greater pasture area causes greater surface exposure of water bodies (Figures 3c,d), higher albedo, and consequently a higher evaporation rate. The analysis of evapotranspiration (transpiration + evaporation) together with the sum of the surface area of the water bodies and the forest-vs.-pasture relationship suggests that the increase in evapotranspiration is more closely related to the increase in evaporation as a function of the increase in pasture area than to the reduction in transpiration due to forest loss, reinforcing the hypothesis that evapotranspiration increases with pasture area.
Starting in 2004, there is a reversal in the increasing trend in the annual and seasonal mean ETo values, whose decrease is in accordance with the expected behavior (Von Randow et al., 2004; Da Rocha et al., 2009) since the decrease in the area of native vegetation reduces local ET due to the decrease in water demand by plants.
Table 3 and Figure 4 show the temporal variability in precipitation, E, and ET calculated by the methods of Schreiber (1904), Pike (1964), and Budyko (1974), in addition to the annual aridity index (AI).
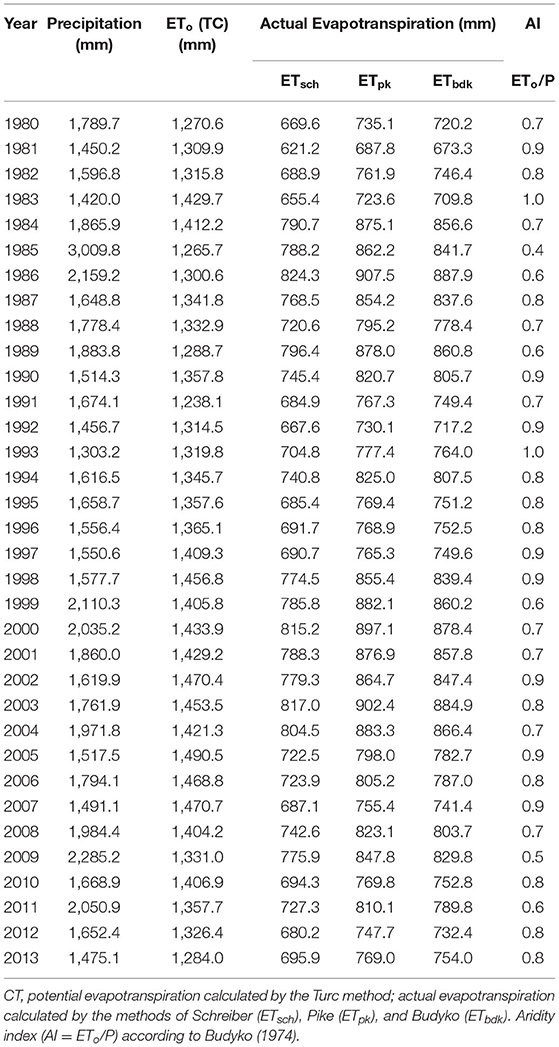
Table 3. Annual observed and calculated data for the IRW in the 1980–2013 period.
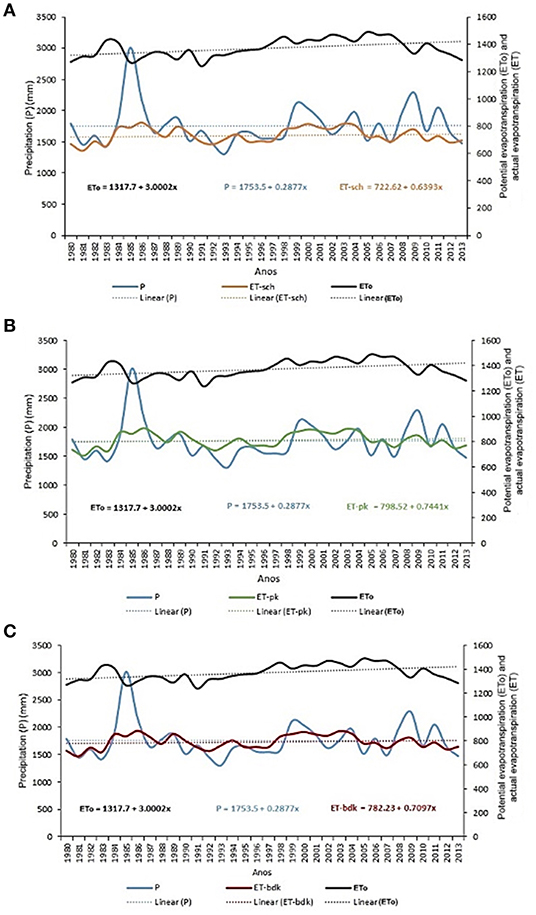
Figure 4. Long-term (annual) behavior of precipitation (P), potential evapotranspiration (ETo), and actual evapotranspiration (ET) estimated by the equations of (A) Schreiber (1904), (B) Pike (1964), and (C) Budyko (1974). The dotted lines represent the trends for each parameter.
ETo shows an upward trend throughout the period, and the annual mean values for 1980–1989 and 1990–1999 were 1,326.8–1,357.0 mm, whose increase represents a rate of 2.0 mm·y−1 in the first period and 5.3 mm·y−1 in the second (Figure 4). However, there was a decrease of 2.7 mm·y−1 in ETo for 2000–2013. Overall, ET shows a decreasing trend by the three methods throughout the study period, though different behaviors are observed: between 1980 and 1986, there is an upward trend; between 1987 and 1997, there is a decreasing trend; between 1998 and 2004, there is an increasing trend; and last, after 2005, there is a decreasing trend in the annual mean values. The highest values were estimated by the Pike equation, with an annual mean of 815.0 mm·y−1, and the lowest by the Schreiber equation (737.0 mm·y−1), while the Budyko equation resulted in an intermediate value of 798.1 mm·y−1.
Table 4 shows the estimated monthly seasonal values of the water balance components. The seasonality of rainfall and the seasonal dynamics of soil water storage are directly incorporated into the seasonal model derived, revealing the dominant control factors in the water balance. For each component, for example, Pu or Ps, and so for the others, the value in the table represents the cumulative number of months identified as wet (Pw) or dry (Pd) within each year. The values of ΔSu and ΔSs for the years 2009 and 2012 showed outlier behavior, without any known explanation, so they were excluded from the analysis.
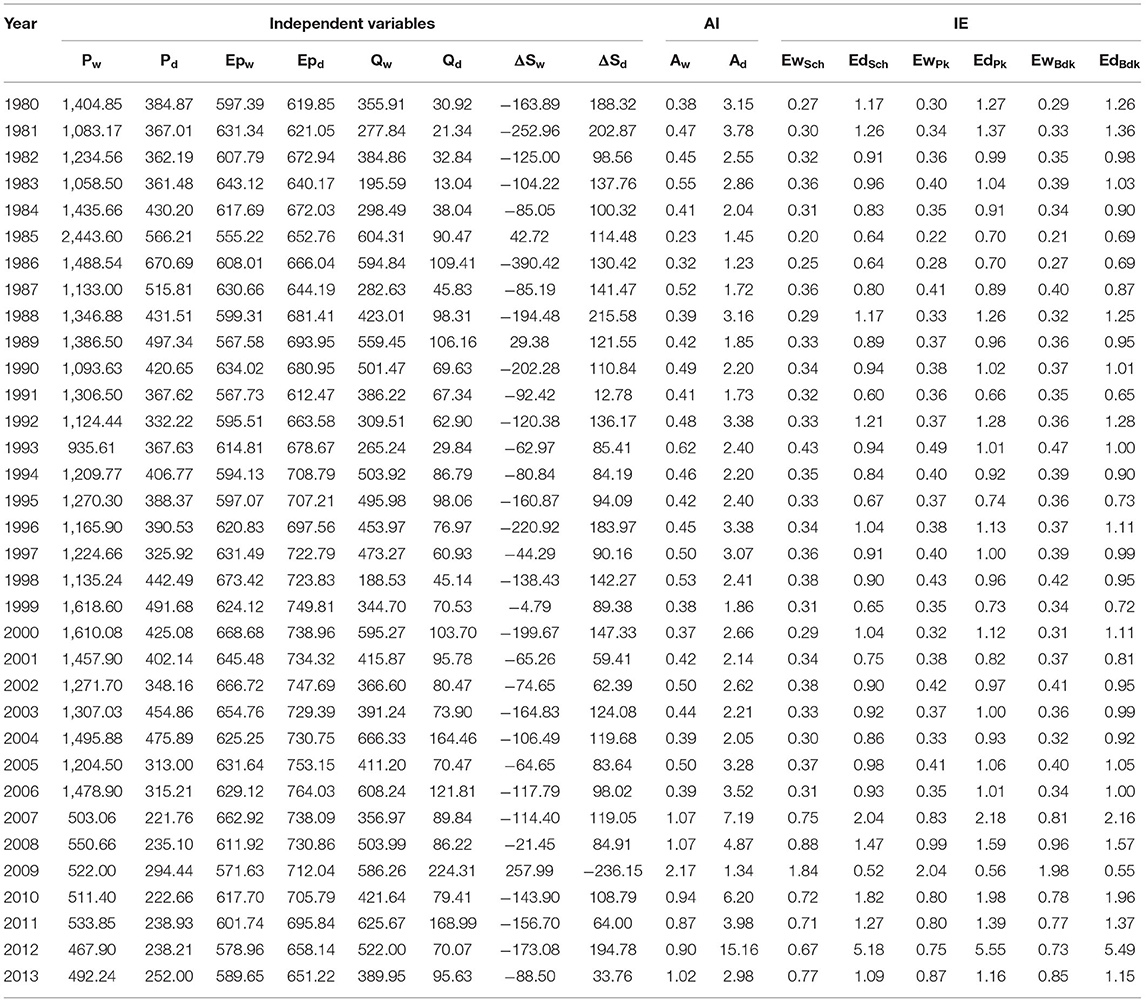
Table 4. Response of the water balance components from 1980 to 2013 in the IRW according to the wet (w) and dry (d) periods, along with the aridity (AI) and evaporative (EI) indices for the IRW.
The Budyko model is based on the water “supply–demand” concept and addresses two extreme conditions: very dry and very wet. The results for the IRW fall within the relatively wet condition. On the annual scale (Figures 5a–c), there is an increasing trend in all three methods, both for EI (ET/P) and AI (ETo/P), whose data set meets the criterion ET/P <1 and has available energy as the factor controlling ET. However, when considering the amount of plant-available water (w), all points are below the 0.5 line, and more than half of them are below the 0.1 line, i.e., for the IRW, these points are located near the lower water limit. Cavalcante et al. (2019) concluded that the IRW shows a greater variation in the AI than in the EI, suggesting that it has a high elasticity related to climatic changes.
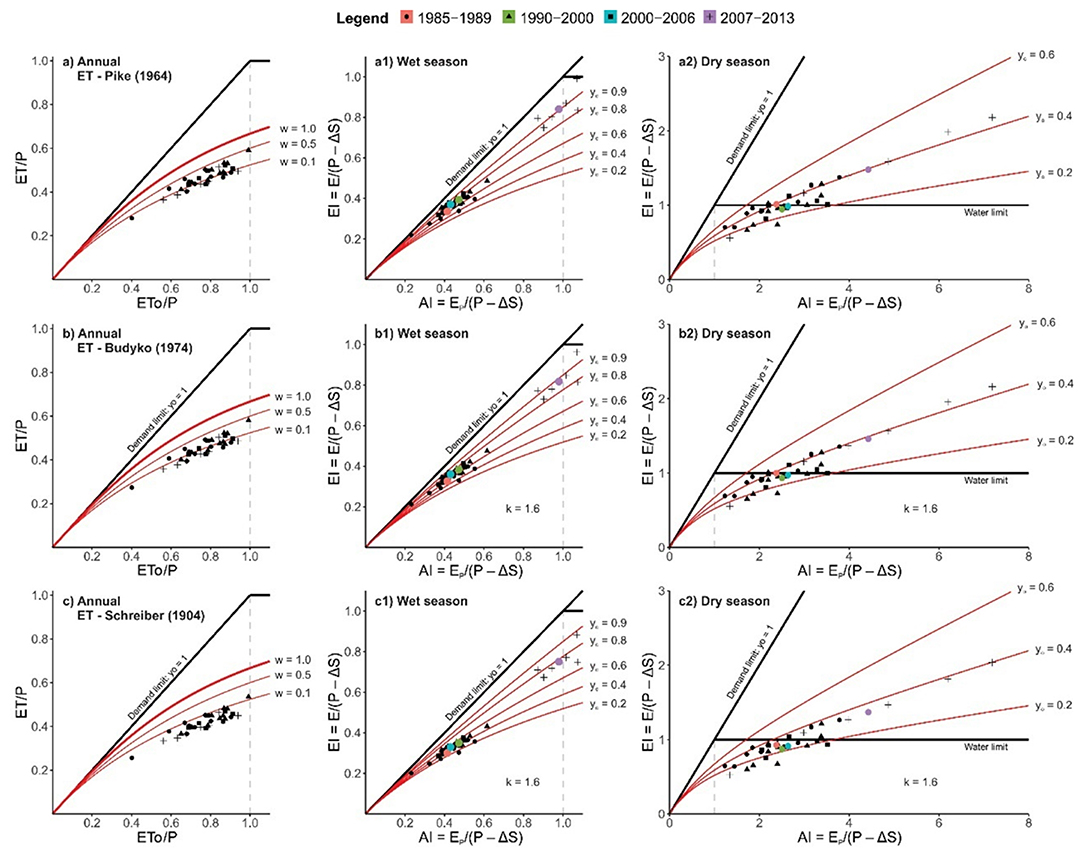
Figure 5. Left, relationship of AI (ETo/P) vs. EI (ET/P) on the annual scale for different w values, according to Pike (A), Budyko (B), and Schreiber (C) for the IRW (1980–2013). ET is the actual evapotranspiration, P is the precipitation, and Ep equals potential evapotranspiration (ETo). In the center and to the right, the seasonal behavior of AI [E P/(P–ΔS)] vs. IE [E/(P–ΔS)] is analytically derived (Greve et al., 2016), introducing a new parameter (y0) that represents the additional water available for E, in addition to P. The colored circles represent the mean values of the 1985–1989, 1990–2000, 2000–2006, and 2007–2013 data sets.
Figures 5a1-c2 shows, on the seasonal scale, the behavior of the new parameter (y0) introduced by Greve et al. (2016), which explicitly represents the additional water available for E, in addition to instantaneous precipitation. The separation between the wet and dry seasons is clear. In the wet season, under all three models, the set of points does not exceed the limits (demand and energy). In the Pike and Budyko methods (Figures 5a1,b1), the behavior is very similar, and most of the points are between y0 = 0.6 and 0.8, unlike the Schreiber method (Figure 5c1), whose points concentrate between y0 = 0.4 and 0.6. For the most recent period (2007–2013), a different behavior is observed under all models (Figures 5a1,b1,c1). Table 4 shows AI > 0 for all the dry seasons analyzed. In Figures 5a2,b2,c2, the exceedance of the water supply limit in the IRW increases with the increase in y0, suggesting that this additional parameter can represent the conditions in which E monthly or annually exceeds the monthly or annual precipitation, respectively. With the Pike and Budyko methods (Figures 5a2,b2), the behavior is very similar, and most points exceed the curve y0 = 0.4 to 0.2, unlike with the Schreiber method (Figure 5c2), in which the points concentrate below y0 = 0.4 to y0 > 0. This result suggests that water storage plays a significant role in maintaining evaporation, especially during years with aridity indices >1.
The mean monthly variations in soil water storage estimated for the IRW as residuals of the water balance closure, using the available data for P, ET, and Q (Figure 6), were compared with the El Niño/South Oscillation (ENSO) extremes analyzed by Kayano et al. (2016) for the last three decades (1986–2015), whose types and intensities were determined by the sea-surface temperature anomaly index. The most intense El Niño (EN) events ever recorded (1997–1998 and 2015–2016) occurred in this period, along with two strong La Niña (LN) events (1988–1989 and 1998–2001) of long duration. The EN of 1997–1998 was the one with the most marked climatic impacts around the globe, and it developed rapidly and decayed abruptly (McPhaden, 1999). The 2015–2016 EN presented sea-surface temperature indices much higher than those of previous events, with strong influences on the Amazon, especially in the eastern part (Costa and Blanco, 2018; Tavares et al., 2018). The two LN events overall had point impacts throughout the Amazon region (Aguiar et al., 2019; Coutinho et al., 2019).
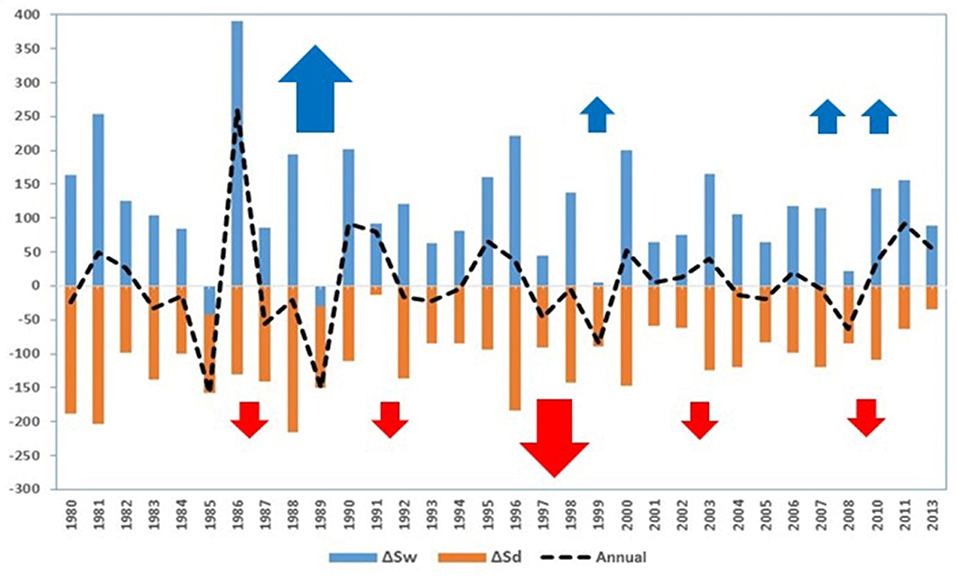
Figure 6. Monthly variations in soil water storage for the wet (ΔSw) and dry months (ΔSd) in the IRW, in mm. The dashed line (black) represents the mean annual variation. Arrows: red = strong or moderate El Niño; blue = strong or moderate La Niña.
The mean annual variation in soil water storage shows different behavior in the analyzed periods. The first period (1980–1990) has higher amplitudes in the variation in storage between the wet and dry seasons than the following periods. This behavior probably reflects the occurrence of the strong LN event (1988–1989), followed by the very strong EN event (1997–1998), in addition to the occurrences of moderate EN and LN events throughout the analyzed period, considering that in the Amazon, EN causes a decrease in rainfall and LN does the inverse (Moura et al., 2019).
In a study by Moura et al. (2019), it was observed that the studied variables, among them evapotranspiration, was severely affected in the rainiest months, the La Niña phenomenon, and in the less rainy months, El Niño. The variation in evapotranspiration showed that the lowest values were associated with LN. The months with the lowest rainfall were those with the highest average evapotranspiration, showing the influence of EN on the increase in values. The region that has lower anthropogenic pressures and has denser vegetation cover, therefore, has a higher incidence of solar radiation, increasing vegetative transpiration and evaporation of water bodies, consequently, conditioning an increase in evapotranspiration. This is different from what happens in the rainiest periods, where the presence of greater cloud cover inhibits the incidence of solar radiation, decreasing the temperature and consequently reducing evapotranspiration (Flantua et al., 2016).
Likewise, Jiménez-Muñoz et al. (2016), calculated the self-calibrating Palmer Drought Severity Index (scPDSI)19 during the course of the El Niño 2015–2016 event in the Amazon rainforest. Among the parameters used for its calculation, potential evapotranspiration, corresponding to moisture demand, was abnormally high during the period, with record warming at the end of 2015. The authors concluded that this scenario suggested that warming is responsible for about a fifth of the abnormally high area under extreme drought severity observed during 2015/2016.
At the beginning of the first period, the forest cover represented 70%, and the pasture cover represented ~30%; that is, the starting decade was marked by a strong LN event, resulting in higher rainfall over the region, which still had a vegetation cover that allowed higher levels of soil water storage capacity. In the second (1990–1999) and third (2000–2013) periods, there was occurrence of a very strong EN event associated with the marked advance of the conversion of forest into pasture, whose direct consequence was a reduction in water infiltration and retention capacity. This finding corroborates the study by Coutinho et al. (2019), who concluded that there is a positive trend toward evaporation in the Amazon, confirmed by the deforestation in the region, and this impacts storage. In addition, in view of the more frequent occurrence of climatic phenomena, it is necessary to pay greater attention to the IRW because deforestation in the watershed intensifies water flows, and the consequences can lead to increased flooding in flat areas (Pontes et al., 2019).
Its consideration of subannual or interannual changes in water storage in a watershed as insignificant is a major limitation of the original Budyko structure. Additional water can also be introduced by changes in the landscape (Jaramillo and Destouni, 2015) and human interventions (Milly et al., 2008), for example, increased pasture area causing greater surface exposure of water bodies (Figures 3c,d), increasing the albedo, and thereby increasing the evaporation rate or causing phase changes in the water in the system or the water provided by precipitation (Berghuijs et al., 2014; Jaramillo and Destouni, 2015). Long-term changes in soil moisture can also result from transient climatic changes (Wang et al., 2005; Orlowsky and Seneviratne, 2013). In summary and corroborating the study by Cavalcante et al. (2019), further research in the IRW needs to analyze water storage and the dependence of the rainfall–runoff relationship on climate and its main drivers, looking more closely at the relationship between the transpiration and evaporation components, in order to better manage the area and to avoid the impacts of extreme events, like droughts or floods (Kumar et al., 2019).
From 1980 to 2013, there were marked changes in the vegetation cover of the IRW, mainly due to the conversion of the forest into pasture. Before, it was a trend; in the last decade, it has become a fact: the forest remnant covers only 48.91% of the area, whereas pasturelands cover 50.47%. As a consequence, the water storage capacity of the soil has decrease (8.1%) continuously. Although, the IRW does not have low water availability, its pedological characteristics indicate an increasing trend in runoff rates (CN > 72).
The behavior of the water balance components (P, ETo, E, and ΔS) was evaluated on annual and seasonal (monthly) scales. ETo and E showed an upward trend over the decades. The analysis of evapotranspiration together with the sum of the surface area of the water bodies and the forest-vs.-pasture relationship suggests that the increase in evapotranspiration is more closely related to the increase in evaporation as a function of the increasing pasture area than to the reduction in transpiration due to forest loss, reinforcing the hypothesis that evapotranspiration increases with pasture area. Precipitation in 1990–1999 shows a reduction, possibly associated with the very strong La Niña (1988–1989) and El Niño (1997–1998) events, whose rainfall indices were below normal over much of the region.
Therefore, subannual or interannual changes in soil water storage in a watershed need to be considered in the analysis of water balance. Additional water may be introduced due to changes in the landscape or human interventions, such as increases in pasture area, causing greater surface exposure of water bodies and elevation of the local albedo, the consequence of which is an increase in the evaporation rate or water phase changes in the system. Last, further research is needed in the IRW to analyze water storage and its dependence on the rainfall–runoff relationship and climate drivers, looking more closely at the relationship between the transpiration and evaporation components in the local and regional hydrological cycle.
The raw data supporting the conclusions of this article will be made available by the authors, without undue reservation.
All authors listed have made a substantial, direct and intellectual contribution to the work, and approved it for publication.
The authors declare that the research was conducted in the absence of any commercial or financial relationships that could be construed as a potential conflict of interest.
All claims expressed in this article are solely those of the authors and do not necessarily represent those of their affiliated organizations, or those of the publisher, the editors and the reviewers. Any product that may be evaluated in this article, or claim that may be made by its manufacturer, is not guaranteed or endorsed by the publisher.
Aguiar, R. S., Rocha, E. J. P., Souza Júnior, J. A., dos Santos, J. T. S., and dos Santos, J. S. (2019). Análise de componente do regime hidrológico da bacia do rio amazonas em anos de eventos climáticos. Rev. Bras. Geogr. Física 12, 988–1002. doi: 10.26848/rbgf.v12.3.p988-1002
Alvares, C. A., Stape, J. L., Sentelhas, P. C., Gonçalves, J. D. M., and Sparovek, G. (2013). Köppen's climate classification map for Brazil. Meteorol. Z. 22, 711–728. doi: 10.1127/0941-2948/2013/0507
Alves, R. A., and Beserra Neta, L. C. (2018). Compartimentação Geomorfológica e Classificação Morfológica dos Ambientes Lacustres nas Savanas da Região Nordeste de Roraima. Acta Geogr. 12, 1–18. doi: 10.5654/acta.v12i29.3669
Andrade, A. M. D. D., Moura, M. A. L., Santos, A. B. D., Carneiro, R. G., and Silva Junior, R. S. D. (2014). Radiação fotossinteticamente ativa incidente e refletida acima e abaixo do dossel de floresta de mata atlântica em Coruripe, Alagoas. Rev. Bras. Meteorol. 29, 68–79. doi: 10.1590/S0102-77862014000100007
Bayer, D. M. (2014). Effects of Land Use Changes on the Hydrological Regime of Large-Scale Basins. Thesis (Doctorate). Institute for Hydraulic Research of the Federal University of Rio Grande do Sul (IPH-UFRGS), 156.
Berghuijs, W. R., Woods, R. A., and Hrachowitz, M. (2014). A precipitation shift from snow towards rain leads to a decrease in streamflow. Nat. Clim. Change 4, 583–586. doi: 10.1038/nclimate2246
Beven, K. J., and Kirkby, M. J. (1979). A physically based, variable contributing area model of basin hydrology/Un modèle à base physique de zone d'appel variable de l'hydrologie du bassin versant. Hydrol. Sci. J. 24, 43–69. doi: 10.1080/02626667909491834
Bosch, J. M., and Hewlett, J. D. (1982). A review of catchment experiments to determine the effect of vegetation changes on water yield and evapotranspiration. J. Hydrol. 55, 3–23. doi: 10.1016/0022-1694(82)90117-2
Brazil. (2003). National Water Resources Council. Water Resources Secretariat, Resolution No. 32. Available online at: http://www.cnrh.gov.br (accessed July 2, 2019).
Bruijnzeel, L. A. (1990). Hydrology of Moist Tropical Forests and Effects of Conversion: A State of Knowledge Review. USESCO International Hydrological Programme.
Budyko, M. I. (1958). The Heat Balance of the Earth's Surface, Translated from Russian by N. A. Stepanova, US Department of Commerce. Washington, DC: Weather Bureau, 259.
Calder, I. R. (1998). Water-Resource and Land-Use Issues. Colombo: International Water Management Institute (IWMI).
Cavalcante, R. B. L., Pontes, P. R. M., Souza-Filho, P. W. M., and de Souza, E. B. (2019). Opposite effects of climate and land use changes on the annual water balance in the amazon arc of deforestation. Water Resour. Res. 55, 3092–3106. doi: 10.1029/2019WR025083
Chen, X., Alimohammadi, N., and Wang, D. (2013). Modeling interannual variability of seasonal evaporation and storage change based on the extended Budyko framework. Water Resour. Res. 49, 6067–6078. doi: 10.1002/wrcr.20493
Choudhury, B. (1999). Evaluation of an empirical equation for annual evaporation using field observations and results from a biophysical model. J. Hydrol. 216, 99–110. doi: 10.1016/S0022-1694(98)00293-5
Coe, M. T., Costa, M. H., and Soares-Filho, B. S. (2009). The influence of historical and potential future deforestation on the stream flow of the Amazon River-Land surface processes and atmospheric feedbacks. J. Hydrol. 369, 165–174. doi: 10.1016/j.jhydrol.2009.02.043
Costa, C. E. A. D. S., and Blanco, C. J. C. (2018). Influência da variabilidade climática sobre a erosividade em Belém (PA). Rev. Bras. Meteorol. 33, 509–520. doi: 10.1590/0102-7786333010
Coutinho, E. C., Rocha, E. J. P., Lima, A. M. M., Ribeiro, H. M. C., Gutierrez, L. A. C. L., Barbosa, A. J. S., et al. (2019). Balanço Hídrico na Bacia Amazônica Brasileira. Rev. Bras. Geogr. Física 11, 1926–1940. doi: 10.26848/rbgf.v11.6.p1926-1940
Da Rocha, H. R., Manzi, A. O., Cabral, O. M., Miller, S. D., Goulden, M. L., Saleska, S. R., et al. (2009). Patterns of water and heat flux across a biome gradient from tropical forest to savanna in Brazil. J. Geophys. Res. 114:G00B12. doi: 10.1029/2007JG000640
Donohue, R. J., Roderick, M. L., and McVicar, T. R. (2007). On the importance of including vegetation dynamics in Budyko's hydrological model. Hydrol. Earth Syst. Sci. 11, 983–995. doi: 10.5194/hess-11-983-2007
Dooge, J. C. (1992). Sensitivity of runoff to climate change: a Hortonian approach. Bull. Am. Meteorol. Soc. 73, 2013–2024. doi: 10.1175/1520-0477(1992)073<2013:SORTCC>2.0.CO;2
Doorenbos, J., and Pruitt, W. O. (1977). Crop Water Requirements. FAO Irrigation and Drainage Paper No. 24. Rome: FAO.
Dunne, T., and Black, R. D. (1970). Partial area contributions to storm runoff in a small New England watershed. Water Resour. Res. 6, 1296–1311. doi: 10.1029/WR006i005p01296
Eltahir, E. A., and Bras, R. L. (1994). Sensitivity of regional climate to deforestation in the Amazon basin. Adv. Water Resour. 17, 101–115. doi: 10.1016/0309-1708(94)90027-2
Flantua, S. G., Hooghiemstra, H., Vuille, M., Behling, H., Carson, J. F., Gosling, W. D., et al. (2016). Climate variability and human impact in South America during the last 2000 years: synthesis and perspectives from pollen records. Clim. Past 12, 483–523. doi: 10.5194/cp-12-483-2016
Fu, B. P. (1981). On the calculation of the evaporation from land surface. Sci. Atmos. Sin 5, 23–31.
Gandu, A. W., Cohen, J. C. P., and De Souza, J. R. S. (2004). Simulation of deforestation in eastern Amazonia using a high-resolution model. Theor. Appl. Climatol. 78, 123–135. doi: 10.1007/s00704-004-0048-5
Gao, G., Fu, B., Wang, S., Liang, W., and Jiang, X. (2016). Determining the hydrological responses to climate variability and land use/cover change in the Loess Plateau with the Budyko framework. Sci. Total Environ. 557, 331–342. doi: 10.1016/j.scitotenv.2016.03.019
Gash, J. H. C., Nobre, C. A., Roberts, J. M., and Victoria, R. L. (1994). Amazonian Rainforest and Climate. New York, NY: John Wiley, 576.
Gentine, P., D'Odorico, P., Lintner, B. R., Sivandran, G., and Salvucci, G. (2012). Interdependence of climate, soil, and vegetation as constrained by the Budyko curve. Geophys. Res. Lett. 39:L19404. doi: 10.1029/2012GL053492
Golubev, V. S., Lawrimore, J. H., Groisman, P. Y., Speranskaya, N. A., Zhuravin, S. A., Menne, M. J., et al. (2001). Evaporation changes over the contiguous United States and the former USSR: a reassessment. Geophys. Res. Lett. 28, 2665–2668. doi: 10.1029/2000GL012851
Greve, P., Gudmundsson, L., Orlowsky, B., and Seneviratne, S. I. (2016). A two-parameter Budyko function to represent conditions under which evapotranspiration exceeds precipitation. Hydrol. Earth Syst. Sci. 20, 2195–2205. doi: 10.5194/hess-20-2195-2016
Harman, C., and Troch, P. A. (2014). What makes Darwinian hydrology “Darwinian”? Asking a different kind of question about landscapes. Hydrol. Earth Syst. Sci. 18, 417–433. doi: 10.5194/hess-18-417-2014
Hobbins, M. T., Ramírez, J. A., and Brown, T. C. (2004). Trends in pan evaporation and actual evapotranspiration across the conterminous US: Paradoxical or complementary?. Geophys. Res. Lett. 31:L13503. doi: 10.1029/2004GL019846
Horton, R. E. (1919). Rainfall interception. Month. Weather Rev. 47, 603–623. doi: 10.1175/1520-0493(1919)47<603:RI>2.0.CO;2
Huo, Z., Dai, X., Feng, S., Kang, S., and Huang, G. (2013). Effect of climate change on reference evapotranspiration and aridity index in arid region of China. J. Hydrol. 492, 24–34. doi: 10.1016/j.jhydrol.2013.04.011
Iriondo, M., and Latrubesse, E. M. (1994). A probable scenario for a dry climate in central Amazonia during the late Quaternary. Q. Int. 21, 121–128. doi: 10.1016/1040-6182(94)90026-4
Jaramillo, F., and Destouni, G. (2015). Developing water change spectra and distinguishing change drivers worldwide. Geophys. Res. Lett. 41, 8377–8386. doi: 10.1002/2014GL061848
Jiménez-Muñoz, J. C., Mattar, C., Barichivich, J., Santamaría-Artigas, A., Takahashi, K., Malhi, Y., et al. (2016). Record-breaking warming and extreme drought in the Amazon rainforest during the course of El Niño 2015-2016. Sci. Rep. 6, 1–7. doi: 10.1038/srep33130
Kayano, M. T., Andreoli, R. V., Souza, R. A. F., Garcia, S. R., and Calheiros, A. J. P. (2016). El Niño e La Niña dos últimos 30 anos: diferentes tipos. Rev. Bras. Meteorol. 30, 7–12. doi: 10.1590/0102-77863220011
Khanna, J., Medvigy, D., Fueglistaler, S., and Walko, R. (2017). Regional dry-season climate changes due to three decades of Amazonian deforestation. Nat. Clim. Chang. 7, 200–204. doi: 10.1038/nclimate3226
Kumar, M. D., Batchelor, C., and James, A. J. (2019). Catchment management to basin management: international perspectives and overview of global experience. Curr. Dir. Water Scar. Res. 1, 21–54. doi: 10.1016/B978-0-12-814851-8.00002-1
Liu, Q., and Yang, Z. (2010). Quantitative estimation of the impact of climate change on actual evapotranspiration in the Yellow River Basin, China. J. Hydrol. 395, 226–234. doi: 10.1016/j.jhydrol.2010.10.031
Lucas-Borja, M. E., Carrà, B. G., Nunes, J. P., Bernard-Jannin, L., Zema, D. A., and Zimbone, S. M. (2020). Impacts of land-use and climate changes on surface runoff in a tropical forest watershed (Brazil). Hydrol. Sci. J. 65, 1956–1973. doi: 10.1080/02626667.2020.1787417
McNaughton, K. G., and Jarvis, P. G. (1983). Predicting effects of vegetation changes on transpiration and evaporation. Water Deficits plant Growth 7, 1–47. doi: 10.1016/B978-0-12-424157-2.50007-0
McPhaden, M. J. (1999). Genesis and evolution of the 1997-98 El Niño. Science 283, 950–954. doi: 10.1126/science.283.5404.950
Milly, P. C. D., Betancourt, J., Falkenmark, M., Hirsch, R. M., Kundzewicz, Z. W., Lettenmaier, D. P., et al. (2008). Stationarity is dead: whither water management?. Earth 4:20. doi: 10.1126/science.1151915
Mishra, S. K., and Singh, V. P. (2003). Soil Conservation Service Curve Number (SCS-CN) Methodology. Dordrecht: Kluwer Academic Publishers. ISBN 1-4020-1132-6.
Moniruzzaman, M., Thakur, P. K., Kumar, P., Alam, A., Garg, V., Rousta, I., et al. (2021). Decadal urban land use/land cover changes and its impact on surface runoff potential for the Dhaka City and surroundings using remote sensing. Remote Sens. 13:83. doi: 10.3390/rs13010083
Moura, M. M., Dos Santos, A. R., Pezzopane, J. E. M., Alexandre, R. S., da Silva, S. F., Pimentel, S. M., et al. (2019). Relation of El Niño and La Niña phenomena to precipitation, evapotranspiration and temperature in the Amazon basin. Sci. Total Environ. 651, 1639–1651. doi: 10.1016/j.scitotenv.2018.09.242
Orlowsky, B., and Seneviratne, S. I. (2013). Elusive drought: uncertainty in observed trends and short-and long-term CMIP5 projections. Hydrol. Earth Syst. Sci. 17, 1765–1781. doi: 10.5194/hess-17-1765-2013
Pailler, S. (2018). Re-election incentives and deforestation cycles in the Brazilian Amazon. J. Environ. Econ. Manage. 88, 345–365. doi: 10.1016/j.jeem.2018.01.008
Pavão, V. M., Nassarden, D. C. S., Pavão, L. L., Machado, N. G., and Biudes, M. S. (2017). Impact of the conversion of natural coverage in pasture and urban area on biophysical variables in the Southern Amazonas. Rev. Bras. Meteorol. 32, 343–351. doi: 10.1590/0102-77863230002
Penman, H. L. (1963). Vegetation and Hydrology. Technical Communication 53. Harpenden: Commonwealth Bureau of Soils, 124.
Pereira, A. R., Villa Nova, N. A., and Sediyama, G. C. (1997). Evapo(transpi)ração. Piracicaba: Fealq, 183.
Pike, J. G. (1964). The estimation of annual run-off from meteorological data in a tropical climate. J. Hydrol. 2, 116–123. doi: 10.1016/0022-1694(64)90022-8
Pontes, P. R., Cavalcante, R. B., Sahoo, P. K., da Silva Júnior, R. O., da Silva, M. S., Dall'Agnol, R., et al. (2019). The role of protected and deforested areas in the hydrological processes of Itacaiúnas River Basin, eastern Amazonia. J. Environ. Manage. 235, 489–499. doi: 10.1016/j.jenvman.2019.01.090
Project MapBiomas Alerta (v. 1.3.4). (2017). System for Validation and Refinement of Deforestation Alerts with High Resolution Images. Available online at: https://mapbiomas.org/ (accessed November 20, 2019).
Rizzo, R., Garcia, A. S., Vilela, V. M. D. F., Ballester, M. V. R., Neill, C., Victoria, D. C., et al. (2020). Land use changes in Southeastern Amazon and trends in rainfall and water yield of the Xingu River during 1976-2015. Clim. Change 162, 1419–1436. doi: 10.1007/s10584-020-02736-z
Roderick, M. L., and Farquhar, G. D. (2004). Changes in Australian pan evaporation from 1970 to 2002. Int. J. Climat. 24, 1077–1090. doi: 10.1002/joc.1061
Rowntree, P. R. (1988). Review of General Circulation Models as a Basis for Predicting the Effects of Vegetation Change on Climate. NRTS-United Nations University (UNU).
Sahoo, P. K., Dall'Agnol, R., Salomão, G. N., Junior, J. D. S. F., Silva, M. S., e Souza Filho, P. W. M., et al. (2019). High resolution hydrogeochemical survey and estimation of baseline concentrations of trace elements in surface water of the Itacaiúnas River Basin, southeastern Amazonia: implication for environmental studies. J. Geochem. Explor. 205:106321. doi: 10.1016/j.gexplo.2019.06.003
Salomão, G. N., Dall'Agnol, R., Sahoo, P. K., Angélica, R. S., de Medeiros Filho, C. A., Júnior, J. D. S. F., et al. (2020). Geochemical mapping in stream sediments of the Carajás Mineral Province: Background values for the Itacaiúnas River watershed, Brazil. Appl. Geochem. 118:104608. doi: 10.1016/j.apgeochem.2020.104608
Salomão, G. N., Dall'Agnol, R., Sahoo, P. K., Júnior, J. D. S. F., da Silva, M. S., Sousa-Filho, P. W. M. E., et al. (2019). Geochemical distribution and threshold values determination of heavy metals in stream water in the sub-basins of Vermelho and Sororó rivers, Itacaiúnas River watershed, Eastern Amazon, Brazil. Geochim. Bras. 32, 180–198. doi: 10.21715/GB2358-2812.2018322180
Santos, C. A. C. D., Wanderley, R. L. N., Araújo, A. L., and Bezerra, B. G. (2014). Obtenção do saldo de radiação em áreas de pastagem e floresta na Amazônia (estação seca) através do sensor MODIS. Rev. Bras. Meteorol. 29, 420–432. doi: 10.1590/0102-778620130591
Schreiber, P. (1904). Über die Beziehungen zwischen dem Niederschlag und der Wasserführung der Flüsse in Mitteleuropa. Z. Meteorol. 21, 441–452.
Silva Júnior, R. O., Queiroz, J. C. B., Ferreira, D. B. S., Tavares, A. L., Souza-Filho, P. W. M., Guimaraes, J. T. F., et al. (2017b). Estimativa de precipitação e vazões médias para a bacia hidrográfica do rio Itacaiúnas (BHRI), Amazônia Oriental, Brasil. Rev. Bras. Geogr. Física 10, 1638–1654. doi: 10.26848/rbgf.v.10.5.p1638-1654
Silva Júnior, R. O., Souza, E. B., Tavares, A. L., Mota, J. A., Ferreira, D., Souza-Filho, P. W., et al. (2017a). Three decades of reference evapotranspiration estimates for a tropical watershed in the eastern Amazon. An. Acad. Bras. Cienc. 89, 1985–2002. doi: 10.1590/0001-3765201720170147
Souza-Filho, P. W. M., de Souza, E. B., Júnior, R. O. S., Nascimento, W. R. Jr., de Mendonça, B. R. V., Guimarães, J. T. F., et al. (2016). Four decades of land-cover, land-use and hydroclimatology changes in the Itacaiúnas River watershed, southeastern Amazon. J. Environ. Manage. 167, 175–184. doi: 10.1016/j.jenvman.2015.11.039
Souza-Filho, P. W. M., Nascimento, W. R. Jr, de Mendonça, B. V., Silva, R. O. Jr, Guimarães, J. T. F., Dall'Agnol, R., et al. (2015). Changes in the land cover and land use of the Itacaiunas River watershed, arc of deforestation, Carajas, southeastern Amazon. Int. Arch. Photogram. Remote Sens. Spatial Inf. Sci. 40:1491. doi: 10.5194/isprsarchives-XL-7-W3-1491-2015
Souza-Filho, P. W. M., Nascimento, W. R., Santos, D. C., Weber, E. J., Silva, R. O., and Siqueira, J. O. (2018). A GEOBIA approach for multitemporal land-cover and land-use change analysis in a tropical watershed in the southeastern Amazon. Remote Sens. 10:1683. doi: 10.3390/rs10111683
Tavares, A. L., do Carmo, A. M. C., da Silva Júnior, R. O., Martins, P. W., da Silva, M. S., da Silva Ferreira, D. B., et al. (2018). Climate indicators for a watershed in the Eastern Amazon. Rev. Bras. Climatol. 23, 389–410. doi: 10.5380/abclima.v23i0.61160
Troch, P. A., Carrillo, G., Sivapalan, M., Wagener, T., and Sawicz, K. (2013). Climate-vegetation-soil interactions and long-term hydrologic partitioning: signatures of catchment co-evolution. Hydrol. Earth Syst. Sci. 17, 2209–2217. doi: 10.5194/hess-17-2209-2013
Turner, K. M. (1991). Annual evapotranspiration of Natwe vegetation in a Mediterranean-type climate 1. J. Am. Water Resour. Assoc. 27, 1–6. doi: 10.1111/j.1752-1688.1991.tb03107.x
Tyagi, J. V., Mishra, S. K., Singh, R., and Singh, V. P. (2008). SCS-CN based time-distributed sediment yield model. J. Hydrol. 352, 388–403. doi: 10.1016/j.jhydrol.2008.01.025
Van der Velde, Y., Vercauteren, N., Jaramillo, F., Dekker, S. C., Destouni, G., and Lyon, S. W. (2014). Exploring hydroclimatic change disparity via the Budyko framework. Hydrol. Process. 28, 4110–4118. doi: 10.1002/hyp.9949
Von Randow, C., Manzi, A. O., Kruijt, B., De Oliveira, P. J., Zanchi, F. B., Silva, R. D., et al. (2004). Comparative measurements and seasonal variations in energy and carbon exchange over forest and pasture in South West Amazonia. Theor. Appl. Climatol. 78, 5–26. doi: 10.1007/s00704-004-0041-z
Wang, C., Wang, S., Fu, B., and Zhang, L. (2016). Advances in hydrological modelling with the Budyko framework: a review. Prog. Phys. Geogr. 40, 409–430. doi: 10.1177/0309133315620997
Wang, D. (2012). Evaluating interannual water storage changes at watersheds in Illinois based on long-term soil moisture and groundwater level data. Water Resour. Res. 48:W03502. doi: 10.1029/2011WR010759
Wang, D., and Tang, Y. (2014). A one-parameter Budyko model for water balance captures emergent behavior in Darwinian hydrologic models. Geophys. Res. Lett. 41, 4569–4577. doi: 10.1002/2014GL060509
Wang, D., and Wu, L. (2013). Similarity of climate control on base flow and perennial stream density in the Budyko framework. Hydrol. Earth Syst. Sci. 17, 315–324. doi: 10.5194/hess-17-315-2013
Wang, Y., Jiang, T., Xu, C., and Shi, Y. (2005). Trends of evapotranspiration in the Yangtze River basin in 1961-2000 [J]. Adv. Clim. Chang. Res. 3, 99–105.
Wicht, C. L. (1941). Diurnal fluctuations in Jonkershoek streams due to evaporation and transpiration. J. S. Afr. For. Assoc. 7, 34–49. doi: 10.1080/03759873.1941.9631119
Wilk, J., Andersson, L., and Plermkamon, V. (2001). Hydrological impacts of forest conversion to agriculture in a large river basin in northeast Thailand. Hydrol. Process. 15, 2729–2748. doi: 10.1002/hyp.229
Wohl, E., Barros, A., Brunsell, N., Chappell, N. A., Coe, M., Giambelluca, T., et al. (2012). The hydrology of the humid tropics. Nat. Clim. Chang. 2, 655–662. doi: 10.1038/nclimate1556
Wu, C., Hu, B. X., Huang, G., and Zhang, H. (2017). Effects of climate and terrestrial storage on temporal variability of actual evapotranspiration. J. Hydrol. 549, 388–403. doi: 10.1016/j.jhydrol.2017.04.012
Xavier, A. C., King, C. W., and Scanlon, B. R. (2015). Daily gridded meteorological variables in Brazil (1980-2013). Int. J. Climatol. 36, 2644–2659. doi: 10.1002/joc.4518
Xue, Y. (1997). Biosphere feedback on regional climate in tropical North Africa. Q. J. R. Meteorol. Soc. 123, 1483–1515. doi: 10.1002/qj.49712354203
Yang, H., Qi, J., Xu, X., Yang, D., and Lv, H. (2014). The regional variation in climate elasticity and climate contribution to runoff across China. J. Hydrol. 517, 607–616. doi: 10.1016/j.jhydrol.2014.05.062
Zhang, L., Dawes, W. R., and Walker, G. R. (2001). Response of mean annual evapotranspiration to vegetation changes at catchment scale. Water Resour. Res. 37, 701–708. doi: 10.1029/2000WR900325
Zhang, L., Hickel, K., Dawes, W. R., Chiew, F. H., Western, A. W., and Briggs, P. R. (2004). A rational function approach for estimating mean annual evapotranspiration. Water Resour. Res. 40:W02502. doi: 10.1029/2003WR002710
Zhang, L., Walker, G. R., and Dawes, W. (1999). Predicting the Effect of Vegetation Changes on Catchment Average Water Balance. Technical Report 99/12.
Keywords: hydrological response, Budyko model, water resources management, soil degradation, evapotranspiration
Citation: Silva-Júnior ROd, Souza-Filho PWMe, Salomão GN, Tavares AL, Santos JFd, Santos DC, Dias LC, Silva MSd, Melo AMQd, Costa CEAdS and Rocha EJPd (2021) Response of Water Balance Components to Changes in Soil Use and Vegetation Cover Over Three Decades in the Eastern Amazon. Front. Water 3:749507. doi: 10.3389/frwa.2021.749507
Received: 16 August 2021; Accepted: 23 September 2021;
Published: 22 October 2021.
Edited by:
Nikola Kranjčić, University of Zagreb, CroatiaReviewed by:
Suraj Kumar Singh, Gyan Vihar University, IndiaCopyright © 2021 Silva-Júnior, Souza-Filho, Salomão, Tavares, Santos, Santos, Dias, Silva, Melo, Costa and Rocha. This is an open-access article distributed under the terms of the Creative Commons Attribution License (CC BY). The use, distribution or reproduction in other forums is permitted, provided the original author(s) and the copyright owner(s) are credited and that the original publication in this journal is cited, in accordance with accepted academic practice. No use, distribution or reproduction is permitted which does not comply with these terms.
*Correspondence: Renato Oliveira da Silva-Júnior, cmVuYXRvLnNpbHZhLmp1bmlvckBpdHYub3Jn
Disclaimer: All claims expressed in this article are solely those of the authors and do not necessarily represent those of their affiliated organizations, or those of the publisher, the editors and the reviewers. Any product that may be evaluated in this article or claim that may be made by its manufacturer is not guaranteed or endorsed by the publisher.
Research integrity at Frontiers
Learn more about the work of our research integrity team to safeguard the quality of each article we publish.