 Lei Meng
 Bandhan Dutta Ayon
- Department of Geography, Environment, and Tourism, Western Michigan University, Kalamazoo, MI, United States
Winter snowfall, particularly lake-contributed snowfall, has a significant impact on the society and environment in the Great Lakes regions including transportation, tourism, agriculture, and ecosystem. Understanding the inter-annual variability of snowfall will provide sound basis for local community safety management and reduce its environmental impacts on agriculture and ecosystems. This study attempts to understand the trend and inter-annual variability in snowfall in the Lower Peninsula of Michigan (LPM) using statistical analysis based on snowfall measurements from eight weather stations. Our study demonstrates that snowfall has significantly increased from 1932 to 2015. Correlation analysis suggests that regional average air temperatures have a strong negative relationship with snowfall in the LPM. On average, approximately 27% of inter-annual variability in snowfall can be explained by regional average air temperatures. ENSO events are also negatively related to snowfall in the LPM and can explain ~8% of inter-annual variability. The North Atlantic Oscillation (NAO) does not have strong influence on snowfall. Composite analysis demonstrates that on an annual basis, more snowfall occurs during the years with higher maximum ice cover (MIC) than during the years with lower MIC in Lake Michigan. Higher MIC is often associated with lower air temperatures which are negatively related to snowfall. This study could provide insight on future snow related climate model improvement and weather forecasting.
Introduction
Winter snowfall, particularly lake-contributed snowfall, has a significant impact on the society and environment in the Great Lakes regions including transportation, tourism, agriculture, and ecosystem (Norton and Bolsenga, 1993; Schmidlan, 1993). The Lower Peninsula of Michigan (LPM) experiences significant amounts of snowfall each year due to its geographic location east of Lake Michigan. In the winter season, the LPM is affected by both mid-latitude cyclones and lake-induced winter storms (Pettersen et al., 2020). Mid-latitude cyclones are often associated with low-pressure centers such as the Colorado Low or Gulf Low that follow the jet stream. The movement of mid-latitude cyclones over the LPM brings abundant moisture and snowfall to this region. In addition to these synoptic low-pressure systems, Lake Michigan drives meso-beta scale (20–200 km) convective lake-effect snowfall when cold-air moves over the relatively warm lake surface. Due to the localized convection, lake-effect snowfall distribution is spatially variable and is limited to the downwind shores of the Great Lakes. For instance, Scott and Huff (1996) defined an 80-km wide band around Lake Michigan as the area with significant lake effects while Braham and Dungey (1984) used a 40 km wide band for the lake effect region.
Contribution of lake-effect snowfall to seasonal snowfall totals could vary from region to region and from season to season. Scott and Huff (1996) suggested ~35% increase in snowfall in southwestern lower Michigan due to lake effects. Changnon (1968) calculated a 30% increase for the same region and a much higher increase (~50%) for northwestern Michigan. Hartnett (2020) classified snowstorms affecting central New York into non-direct cyclonic storms and direct cyclonic storms and found that lake effect storms contributed to ~39.4% of total snowfall for the period of 1985–2015. Hartnett (2020) also suggested that heavy snow storms (>25.4 cm) contributed to more than 50% of total snowfall for every type of snowstorms. Suriano et al. (2019a) examined the contribution of snowfall from diverse synoptic conditions in south-central New York and found that lake effect snowfall accounted for 38% of season totals for the period of 1960–2009. Meng and Ma (2021) calculated the percentage of annual snowfall totals that can be classified as lake-effect snowfall in the LPM and found that it varied significantly from 63 to 7% with a long-term average of 39% for the period of 1933–2015.
Previous studies have suggested inconsistent trends in snowfall in the Laurentian Great Lakes depending on locations/time periods (Norton and Bolsenga, 1993; Kunkel et al., 2009; Clark et al., 2016, 2018). Kunkel et al. (2009) examined the trend in snowfall in the lake-effect snowbelts of the Laurentian Great Lakes using a quality-controlled dataset and found an upward trend for Lakes Superior and Michigan and no changes for Lakes Erie and Ontario. Hartnett et al. (2014) found an increase during the period 1931–1972 and a less decrease for 1972–2012 in total snowfall in central New York, similar to the trend found in Bard and Kristovich (2012). Suriano et al. (2019b) investigated the trend in snow depth using a 1-degree gridded snow depth dataset and found a significant decrease (25–30%) in average basin-wide snow depth for Lake Michigan. Clark et al. (2016) investigated the spatiotemporal trends in annual total snowfall in the Lake Michigan region and found no changes during the period of 1950–2013 based on station measurements. However, they found an increase in the fraction of snowfall that occurs from December to February. Their follow-up study in 2018 (Clark et al., 2018) suggested a decreasing trend in November and March snowfall in the same region. Baijnath-Rodino and Duguay (2018) found a significant decrease in total snowfall for the period of 1980 to 2015 along the Canadian leeward shores of Lakes Superior and Huron-Georgian Bay using the Daymet (version 3) gridded estimation. Our previous study (Meng and Ma, 2021) calculated the lake-effect snowfall (total snowfall minus non-lake effect snowfall) in the LPM from weather station measurements and found an overall increasing trend from 1933 to 2015. Within the overall increasing trend, there was a strong increase from 1933 to 1969 followed by a less change from 1970 to 2015.
Winkler et al. (2012) indicated that over 90% of the 21 General Circulation Models (GCMs) projected an increase in annual and wintertime precipitation by 2080–2099 for the LPM. Hayhoe et al. (2010) assessed the projected climate change in the U.S. Great Lake region under different greenhouse gas emissions scenarios and found that the projected change in precipitation ranges from decreases of a few percentages to increase of up to 7% from 2010 to 2039. By the end of twenty-first century, most models predict an increase in winter precipitation in the Great Lakes region and more precipitation falls as rain instead of snow due to the increase in winter temperatures.
Note that a large uncertainty remains in the future climate projection, particularly the precipitation projection (Winkler et al., 2011, 2012).
Two dominant factors that influence the intensity and frequency of U.S. winter storms are ENSO and the North Atlantic Oscillation (NAO) (Kunkel and Angel, 1999; Seager et al., 2010; Kunkel et al., 2013). Kunkel and Angel (1999) suggested a significant relationship between the frequency of cyclones and El Nino winters for the contiguous United States. Seager et al. (2010) found that snowfall anomalies during the winter season of 2009–2010 in the Northern Hemisphere can be attributed to the combination of a negative NAO and an El Nino event. Clark et al. (2016, 2018) also found that snowfall is very sensitive to the ENSO and NAO for the Lake Michigan region. Kluver and Leathers (2015) examined the factors that influence decadal-scale snowfall variations in the United States and found that both ENSO and NAO are useful predictors of snowfall for the period of 1930–2006. Smith and O'Brien (2001) found that snowfall decreased during both El Nino and La Nina years compared to ENSO neutral years in the Midwest and forecasting could be potentially improved with the inclusion of ENSO phases. Patten et al. (2003) investigated the impact of ENSO on snowfall frequencies in the United States and found that low and moderate snowfall frequencies increased during ENSO cold-phase winters relative to ENSO neutral winters. Coleman and Stefl (2016) examined the relationship between snowfall totals and three teleconnection patterns and found that NAO negative conditions are usually associated with higher snowfall totals in Eastern United States. Serreze et al. (1998) examined the relationships between snowfall and precipitation and the maximum temperature on precipitation days and found no consistent trends in snowfall and in the strength of the Pacific-North America (PNA), Tropical-Northern Hemisphere (TNH), and East Pacific (EP) teleconnection patterns.
In addition to the above teleconnection indices, local and regional environmental variables could also affect the intensity and distribution of snowfall. It has been suggested that winter maximum and minimum temperatures could influence snowfall trends over the Canadian Domain of the Great Lakes Basin (Baijnath-Rodino and Duguay, 2018). Suriano (2019) found that both lake-effect synoptic type circulation patterns and surface air temperatures contribute to the change in snowfall in the Great Lakes region. Model studies have suggested that both surface air temperature and lake ice cover influence the distribution and intensity of lake-effect snowfall (Notaro et al., 2013; Wright et al., 2013).
Given the complexity in factors that influence snowfall in the Great Lakes region, causes of inter-annual variability in snowfall are not satisfactorily understood. In this study, we will investigate the trends and inter-annual variability of seasonal snowfall in the LPM and their relationships with air temperature, ENSO, and NAO. Understanding of such statistical relationships will help future model development related to the mechanism of snowfall and improve prediction of snowfall intensity and distribution. The major difference between this study and Meng and Ma (2021) is that Meng and Ma (2021) focused on the calculated lake-effect snow (total snowfall minus non-lake effect snowfall) with an emphasize on regional average and this study investigates seasonal snowfall totals, which have been used in most of the previous studies. As mentioned in Meng and Ma (2021), the calculated lake-effect snow was not validated again observations due to the lack of direct lake-effect snowfall measurements. Use of seasonal snowfall totals will make this study directly comparable with similar studies for different parts of the Great Lakes region.
Data and Methods
Snowfall Data
Monthly snowfall data for the period of 1932–2015 is collected from the National Weather Service's Cooperative Observer Network (COOP) stations. Datasets obtained from the COOP stations have gone through a comprehensive set of fully automated quality assurance procedures to detect duplicate data, climatological outliers and various inconsistencies. Details on the quality control procedures can be found in Durre et al. (2010) and Lawrimore et al. (2020). Only eight COOP stations in the LPM are used (Figure 1). These eight stations were determined to be homogeneous through the expert quality assessment defined in Kunkel et al. (2009). Therefore, snowfall data from these eight stations is deemed appropriate for trend analysis and for studying the inter-annual variability of snowfall. Each snow year is defined as November-to-March. In this study, for instance, snow year 1950 refers to November and December in 1949 and January, February, and March in 1950. In the LPM, most of snowfall occurs between November and March (Figure 2). Due to the existence of missing data, the individual snow year will be excluded in our analysis if snowfall is missing from any month between November and March. The annual total snowfall in this analysis refers to the amount occurring between November and March and is represented as the sum of monthly snowfall between November and March. The statistics of annual total snowfall in the eight stations are listed in Table 1.
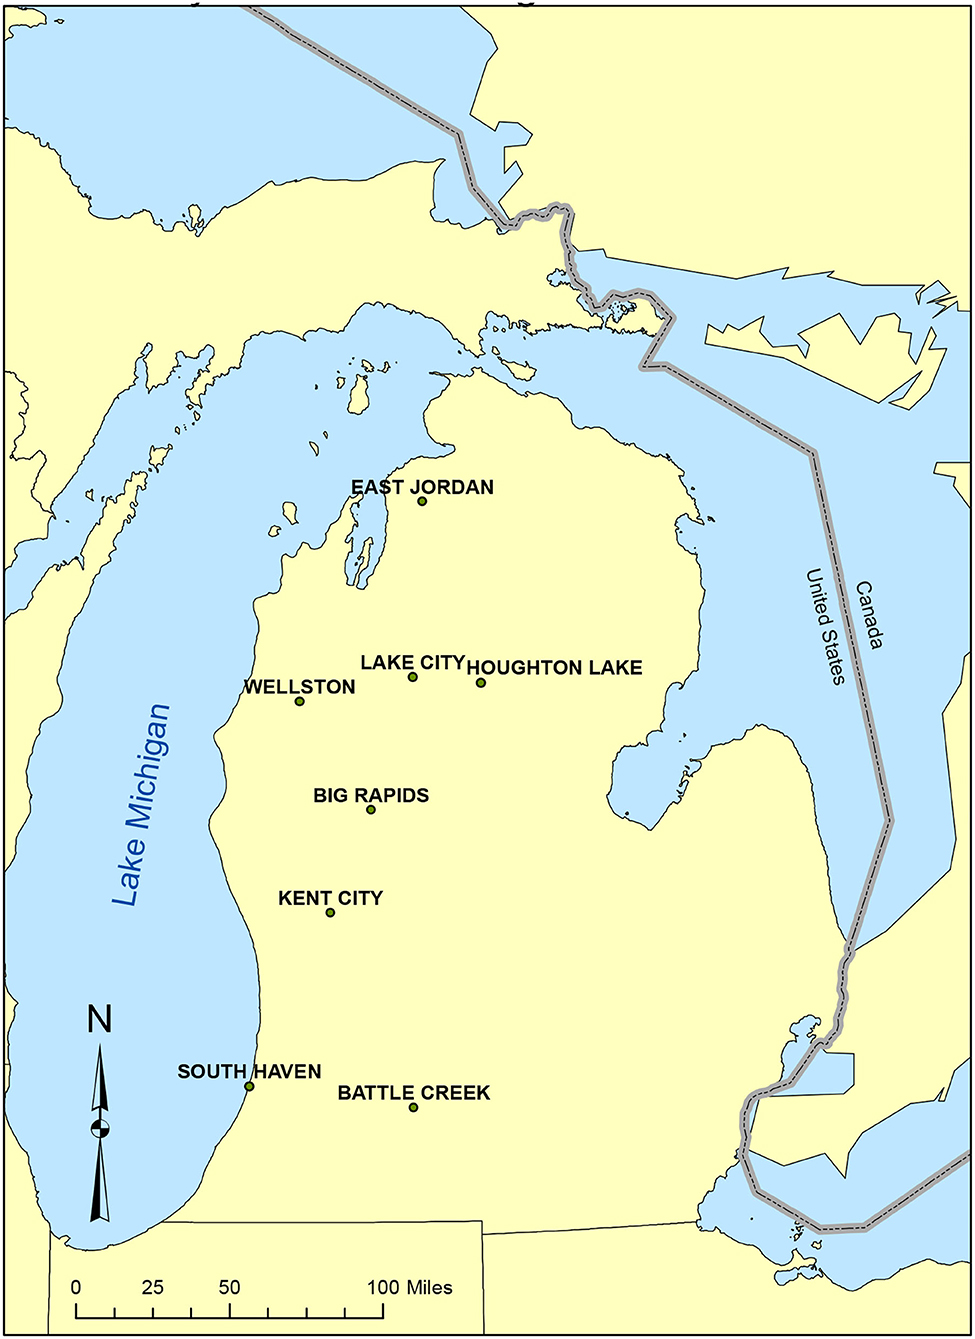
Figure 1. The study area and the location of the eight Cooperative Observer Network (COOP) weather stations. These eight COOP stations are temporally homogeneous stations defined based on the criteria used in Kunkel et al. (2009).
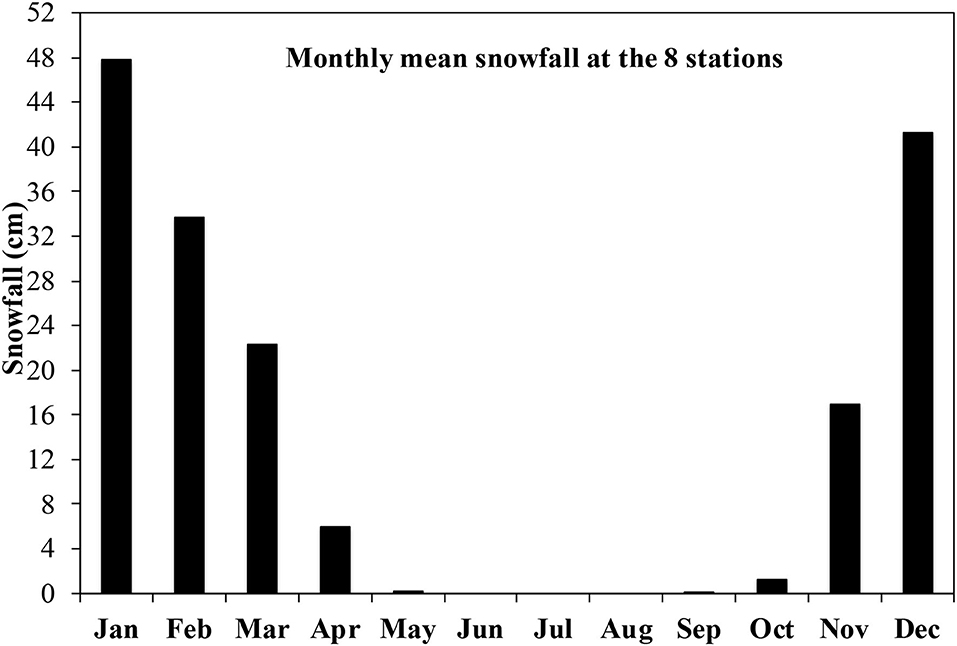
Figure 2. Climatology of monthly snowfall averaged over the eight stations (refer to Figure 1) used in this study for the period of 1932–2015.
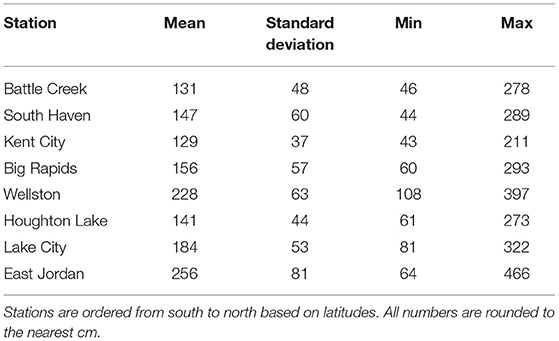
Table 1. Basic statistics of annual total snowfall (cm) at the stations for the period of 1932–2015.
Surface Air Temperature Data
Monthly surface air temperature data is obtained from the Parameter-elevation Relationship on Independent Slope Model (PRISM) working group at Oregon Station University (accessible at http://www.prism.oregonstate.edu/) (Daly et al., 2008). The PRISM data were produced from the combination of weather station datasets and digital elevation model (DEM) through a climate-elevation regression method (Daly et al., 2008). The PRISM provides consistent and long-term records of climatic variables including precipitation and temperatures. Winter season temperatures are represented as the average of monthly temperatures between November and March over the entire LPM.
SSTs and NAO Dataset
The Nino 3.4 sea surface temperature (SST34) index (1932–2015) obtained from the Earth System Research Laboratory (ESRL) of National Oceanic and Atmospheric Administration (NOAA) (http://www.esrl.noaa.gov/psd/gcos_wgsp/Timeseries/Nino34/) is used in this study to represent the El Niño Southern Oscillation (ENSO) phenomena. Average monthly SST34 anomalies between November and March (NDJFM) are used to represent winter season ENSO conditions. In this study, El Niño (La Niña) years are defined when SST34 anomalies are greater (smaller) than +0.5°C (−0.5°C).
The Hurrell NAO monthly index (station-based) (1932–2015) is used in this study (accessible at https://climatedataguide.ucar.edu/climate-data/hurrell-north-atlantic-oscillation-nao-index-station-based). November–March average NAO represents winter-season pressure conditions. The positive NAO index is often associated with stronger-than-average westerlies over the mid-latitudes (Hurrell, 1995). A winter with positive (negative) phase of the NAO is when the winter mean NAO value exceeds +0.5 (−0.5) standard deviation. The NAO-neutral phase is defined when the NAO index is between +0.5 standard deviation and −0.5 standard deviation. This method to define different NAO phases has been used in Bai et al. (2012).
Maximum Ice Cover in Lake Michigan
The maximum ice cover (MIC) dataset for Lake Michigan (1973–2015) is obtained from the NOAA Great Lakes Environmental Research Laboratory at http://www.glerl.noaa.gov/. An additional 10 years MIC data from 1963 to 1972 is digitized from Figure 2 in Bai et al. (2012). Therefore, the MIC dataset is available from 1963 to 2015. Our analysis related to the MIC dataset is restricted to the period of 1963–2015. This dataset has been used in Meng and Ma (2021).
Methods
The Mann-Kendall analysis will be used to identify the trend in snowfall at each station. In addition, sliding correlation analysis, linear regression, composite analysis, student t-test, and chi-square test will be used in this study to investigate the relationship between annual total snowfall and different climatic variables including surface air T, SST34, NAO, and MIC.
Results
Long-Term Trend in Annual Total Snowfall in the LPM
The Mann-Kendall test is used to investigate the trend in annual total snowfall in the eight stations. Our analysis indicates that the amount of snowfall has generally increased from 1932 to 2015 (Figure 3). The rate of increase ranges from 0.095 cm/year in Kent City to 2.483 cm/year in East Jordan with an average rate of 0.91 cm/year. The increasing trend is statistically significant at the 95% confidence level in all stations except Kent City and Wellston. There are large variations in the annual total snowfall during the period of 1932–2015. The minimum annual snowfall in the eight stations ranges from 43.43 to 108.2 cm with an average of 63.47 cm. The maximum annual snowfall in the eight stations ranges from 210.8 to 465.84 cm with an average of 315.98 cm. At each station, the maximum annual snowfall is at least four times of the minimum annual snowfall during the period of 1932 to 2015. Figure 3 also suggests that the maximum annual snowfall at these eight stations did not occur in the same year. Four of the eight stations had the maximum annual snowfall in 2008/09 winter season (Battle Creek, East Jordan, Lake City, and Wellston). Seven of the eight stations had their maximum annual snowfall in the most recent years after 1997 except Big Rapids, which had maximum annual snowfall in 1951/52. Kent City did not show significant increasing trend, largely due to its minimum annual snowfall (only 43.43 cm) in 2014 when other stations had at least 231.14 cm of snowfall.
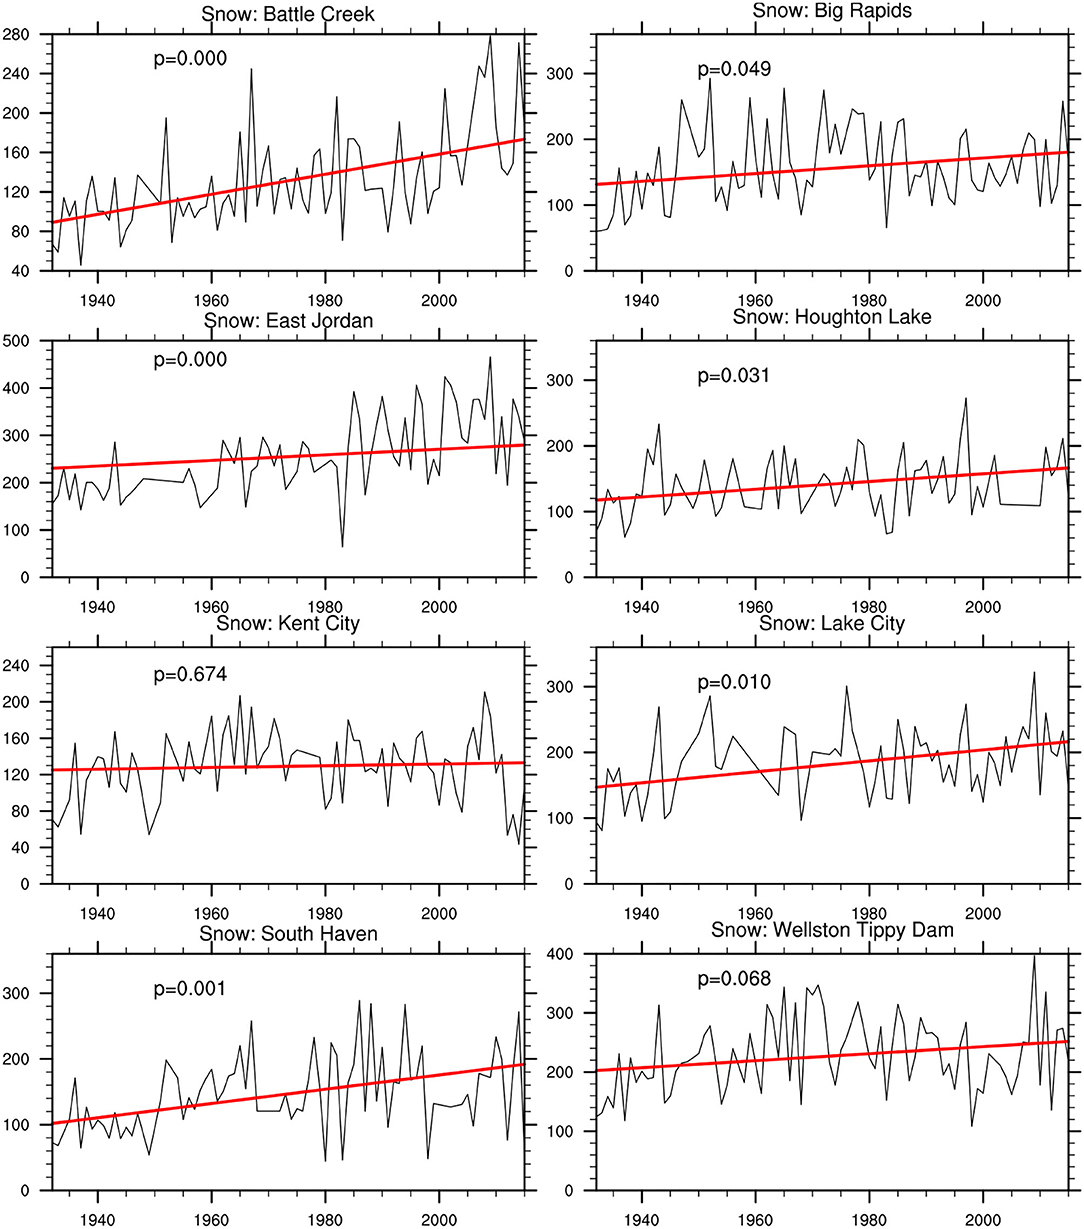
Figure 3. Trends in annual total snowfall (cm) at the eight stations (refer to Figure 1) for the period of 1932–2015. The trend analysis was conducted using the Mann-Kendall test.
Snowfall and Air T
Strong negative correlations (significant at 95% confidence level) exist between regionally average air temperatures and annual total snowfall in all of these eight stations for the period of 1932–2015. The correlation at each individual station varies from −0.25 in Lake City to −0.54 in Wellston (Table 2) with an average of −0.40. It is also found that regionally average snowfall over the eight stations is highly correlated with regionally average air temperature with a correlation of −0.52 (Figure 4), suggesting that air temperatures in the LPM can explain approximately 27% variability in snowfall. Our analysis demonstrates that both snowfall at individual stations and regionally average snowfall are highly related to air temperatures in the LPM.
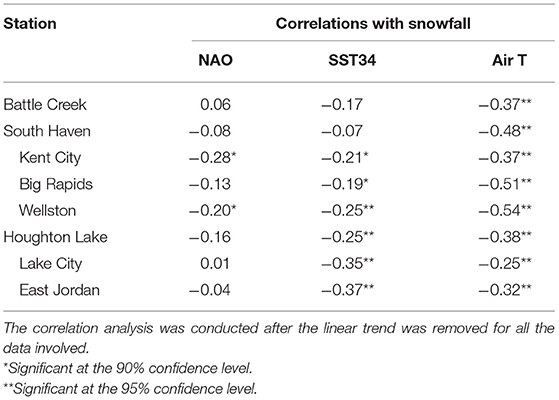
Table 2. Pearson correlation coefficients (r) between annual total snowfall and NAO/SST34/Air T for the whole study period (1932–2015) at the stations.
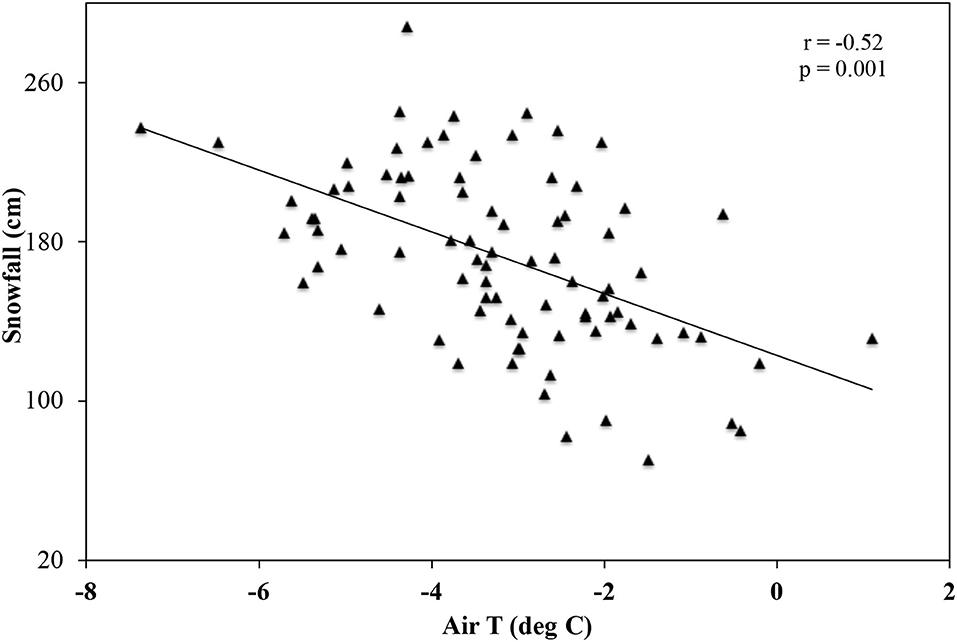
Figure 4. Scatter plot of average annual total snowfall over the eight stations vs. regional average air temperatures. A Pearson correlation coefficient (r) and p-value are shown on the figure.
Snowfall and ENSO
ENSO is considered to be one of the primary factors that influence stormy weather in eastern stations in the United States. In this study, SST anomalies in Nino 3.4 region (SST34) are used to indicate the ENSO events. Our study suggests negative correlations between SST34 and snowfall in the LPM (Table 2). The correlations vary from −0.07 to −0.37 and are significant at the 90% (95%) level in 6 (4) of the eight stations. We further divide the 84 years (from 1932 to 2015) into El Niño (SST34 ≥ 0.5°C), La Niña (SST ≤ −0.5°C), and neutral (between −0.5 and 0.5°C) years based on the SST anomalies. There are 18 and 26 La Niña years. The average mean snowfall over the eight stations is 157.99 and 190.75 cm during the El Niño and La Niña years, respectively (Table 4). This suggests that El Niño (La Niña) events tend to decrease (increase) snowfall in the LPM. In addition, the regionally average air temperatures are −2.96 and −3.26°C during the El Niño and La Niña years, respectively. This suggests that during the El Niño years the LPM is warmer than during the La Niña years. Such results are consistent with the negative relationship between air temperatures and snowfall as demonstrated in section Snowfall and Air T. On the regional scale, approximately 8% of inter-annual variability in snowfall can be explained by SST34 anomalies (Figure 5).
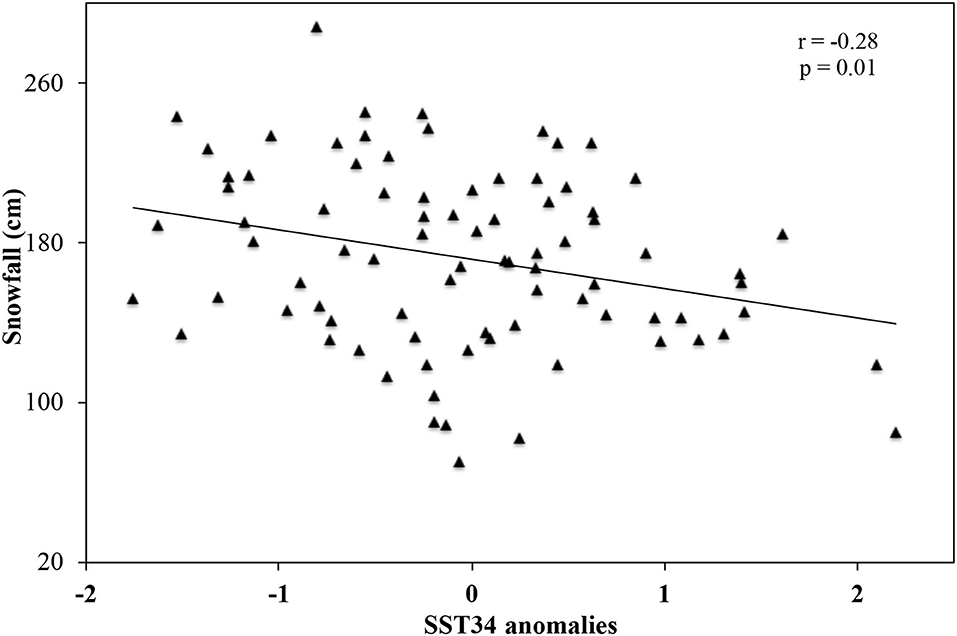
Figure 5. Scatter plot of average annual total snowfall over the eight stations vs. SST34 anomalies. A Pearson correlation coefficient (r) and p-value are shown on the figure.
A 21-year sliding correlation between SST34 and the annual snowfall averaged over the eight stations shows that a strong and significant (at the 95% confidence level) relationship only exists for the period of 1963–2015 (Figure 6). It is also found that the variation of SST34 is larger during the period of 1963–2015 than during the period of 1932–1962 (Figure 6). At each station, the correlation between SST34 and the annual snowfall is stronger for the period of 1963–2015 than the period of 1932–1962 (Table 3) for all the stations except East Jordan. This suggests that the increased variability of SST34 might contribute to the stronger correlations between SST34 and the annual snowfall. Further research is needed to validate this conclusion for other regions to determine whether it is unique to the LPM or it can be generally applied to other regions with similar climatological conditions.
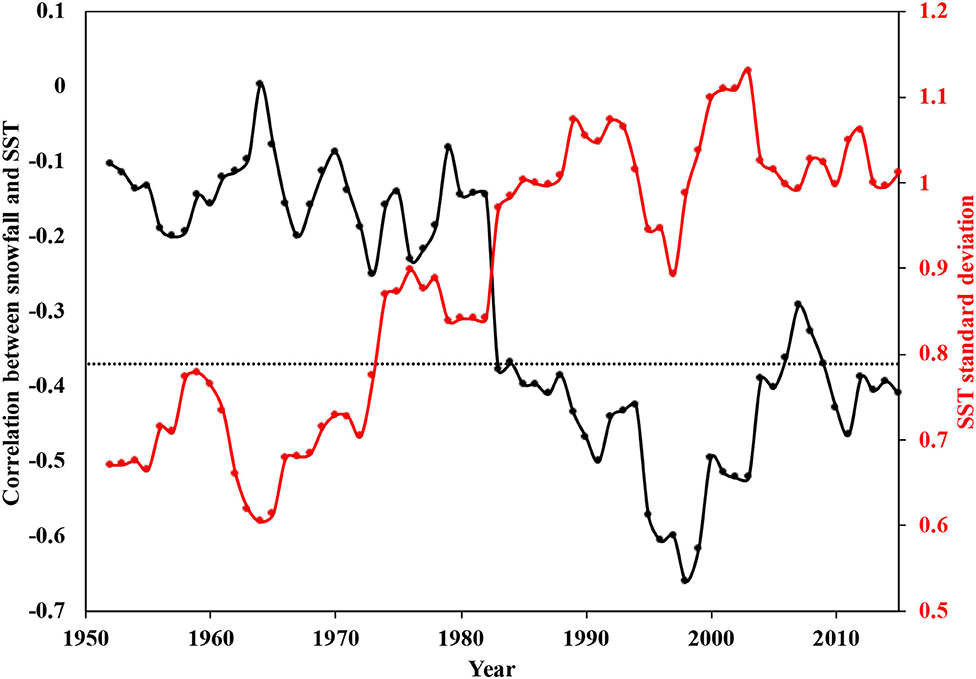
Figure 6. Temporal variation in the 21-year sliding correlation between SST34 and the average annual snowfall over the eight stations (the solid black line). For example, the correlation at 1983 is calculated using SST34 and snowfall over the period of 1963–1983. The dashed straight line indicates correlation significance at the 95% confidence level. Also shown in this figure is the standard deviation of the corresponding 21 years of SST34 (the red solid line).
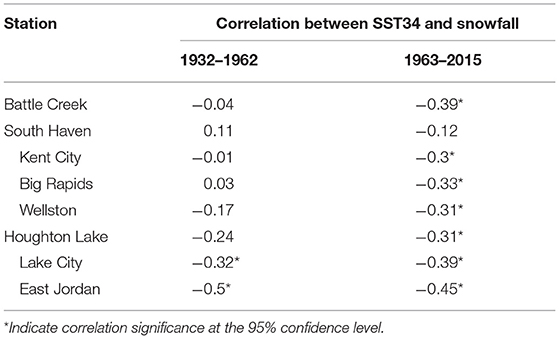
Table 3. Pearson's correlations coefficients (r) between SST34 and snowfall for the periods of 1932–1962 and 1963–2015 at the stations.
Snowfall and NAO
Overall, the NAO does not have strong influence on snowfall in the LPM. The correlation between the NAO and snowfall in the eight stations is negative in six of the eight stations and is not significant at the 90% confidence level (Table 2) in all eight stations. Composite analysis suggests that average snowfall (183.14 cm) in the defined 22 negative (–) NAO years is slightly higher than that (169.93 cm) in the defined 28 positive (+) NAO years. The average regional temperature in these –NAO and +NAO years is −3.96 and −2.89°C, respectively (Table 5). Further, the average snowfall over these eight stations is negatively related to the NAO and only ~2% of inter-annual variability can be explained by the NAO during the period of 1932–2015 (Figure 7).
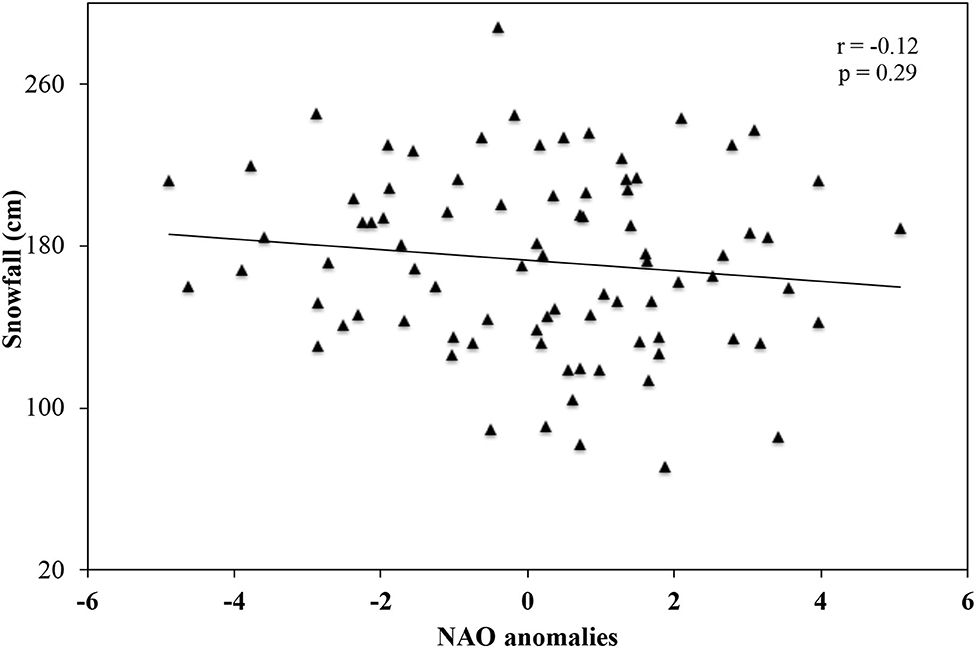
Figure 7. Scatter plot of average annual total snowfall over the eight stations vs. the NAO index. A Pearson correlation coefficient (r) and p-value are shown on this figure.
A 21-year sliding correlation between NAO and the annual snowfall averaged over the eight stations suggests that the correlation is not significant at the 95% confidence level over most of the time period (not shown).
Snowfall and Maximum Ice Cover
The MIC dataset is only available starting from 1963. Our analysis related to MIC is restricted to the period of 1963–2015. Overall, there is a significant positive correlation (0.35, significant at the 95% confidence level) between annual total snowfall and MIC for the period of 1963–2015. The top five MIC (1963, 1977, 1979, 1994, and 2014) and bottom five MIC years (1964, 1969, 1998, 2002, and 2006) are selected to further investigate the relationship between the MIC and snowfall. Our results suggest that annual total snowfall is approximately 24% higher during the top five MIC years than that during the bottom five MIC years over the eight stations except Kent City (Figure 8). Figure 9 indicates that the MIC has a strong negative correlation with air temperatures with a correlation coefficient of −0.76. Therefore, our relationship between the MIC and snowfall is in consistent with the negative air temperature-snowfall relationship. However, caution should be exercised here that the increase in snowfall during the top five MIC years compared to that during the bottom five MIC years is not statistically significant possibly due to the sample size.
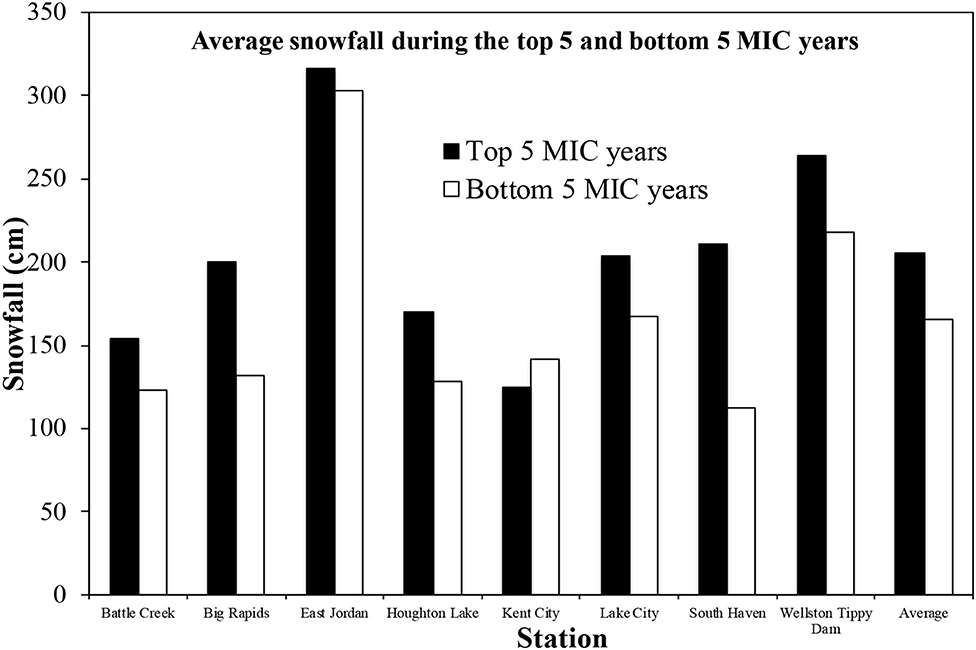
Figure 8. Comparison of average annual total snowfall during the top five and bottom five maximum ice cover (MIC) years at each station and averaged over all stations.
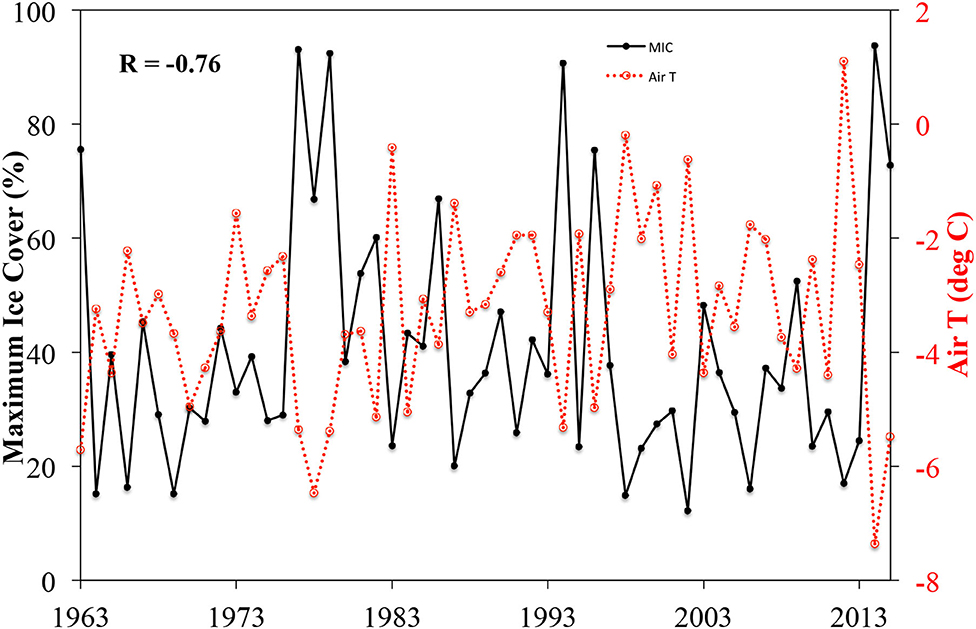
Figure 9. The temporal variation in the maximum ice cover (MIC) (%) (solid black line) and surface air T (°C) (dashed red line) in the Lower Peninsula of Michigan.
Discussions
Trend in Annual Total Snowfall in the LPM
This study indicates that annual total snowfall in the LPM has generally increased in all eight stations. This is consistent with the findings in Kunkel et al. (2009) who found an upward trend in snowfall in the Snowbelt area of Lake Michigan. The upward trend in snowfall in the LPM is accompanied by a decreasing trend (0.004°C/year, not significant at the 90% confidence level) in regional average winter T (not shown). The trend in regional average winter T in this study is different from those shown in Kunkel et al. (2009). Kunkel et al. (2009) found a slightly increasing trend in winter air temperatures averaged at the weather stations in the Michigan-Huron region used in their study. The differences between our study and Kunkel et al. (2009) are: (1) the period of study (1932–2015 in our study vs. 1900–1995 in Kunkel et al., 2009); (2) the domain size for average temperature (the whole LPM region in our study vs. several weather stations in Kunkel et al., 2009). These differences might contribute to the different trend in winter air temperatures. Please note that temperatures at individual weather station might be affected by local topography, land-water distributions, and nearby urban areas.
Another factor that might influence the measurement of snowfall and temperatures is the land cover and land use change (LCLUC). It was shown in Wolter et al. (2006) that 2.5% of the U.S. portion of the Great Lakes had experienced changes from 1992 to 2001. The change in the land cover and land use influences surface wind conditions, temperatures, and surface convergence/divergence due to wind/temperature changes (Mahmood et al., 2010; Szczypta et al., 2015). Although efforts have been introduced to minimize any changes with the selected weather stations (Kunkel et al., 2009), it is still possible that LCLUCs around these weather stations influence the snowfall measurement and identified trends. These weather stations used in this study have gone through a rigorous expert selection process (Kunkel et al., 2009). Therefore, the LCLUC should have limited impacts on the snowfall measurement.
Negative Correlation Between Air Temperature and Snowfall
This study demonstrates that a statistically significant negative correlation exists between regional average winter air temperatures and annual total snowfall in the LPM, suggesting that annual total snowfall will increase when winter air temperatures decrease. The regional average air temperature in the LPM is largely affected by cold and continental air masses (i.e., cP or cA air masses) that move southeastward from the Arctic basin and the interior of Canada (Hayhoe et al., 2010). In the meantime, movement of the cP/cA cold air mass over the relatively warm water surface of the Great Lakes leads to enhanced production of the lake-effect snowfall on the lee of Lake Michigan due to the strong contrast of water-air temperatures (Dockus, 1985). Therefore, the cP/cA cold air mass will produce abundant lake-effect snowfall and bring cold air to the LPM, resulting in a negative correlation of air temperature and snowfall. Such negative correlations have also been found in other regions. For instance, Blechman (1996) found a strong negative correlation in winter mean monthly temperature and snowfall in western and central New York and the lee of Lakes and Ontario and Erie.
Relationship Between MIC and Snowfall
Previous research has suggested that higher ice cover in the Great Lakes region will decrease lake-effect snowfall on the downwind side of the Great Lakes through the reduction of evaporation and lake-climate interactions (Gerbush et al., 2008; Brown and Duguay, 2010). However, our study indicates an increase in annual total snowfall during the years with higher MIC. This is not in contrast with the idea that higher ice cover tends to reduce lake-effect snowfall. Notaro et al. (2013) conducted a model simulation of heavy lake-effect snowstorms in RegCM4 and found that lake-effect snowfall is most frequent and intensive in December–January. In Lake Michigan, MIC typically occurs in February–March based on the results in Assel (2005) (see the Figure 3 in Assel, 2005). Figure 10 suggests that the amount of snowfall is comparable in November and December and almost doubled in January during the 5 years with highest MIC compared to those 5 years with lowest MIC in the LPM. As expected, snowfall has reduced in March after the ice cover has peaked in February in the years with higher MIC (Assel, 2005). The MIC and snowfall relationship is also consistent with the snowfall-air temperature relationship. Maximum ice cover and air temperatures have a strong negative relationship indicating that the winters with higher MIC are typically colder than those with lower MIC (Figure 9). This is consistent with our study on lake-effect snowfall (Meng and Ma, 2021).
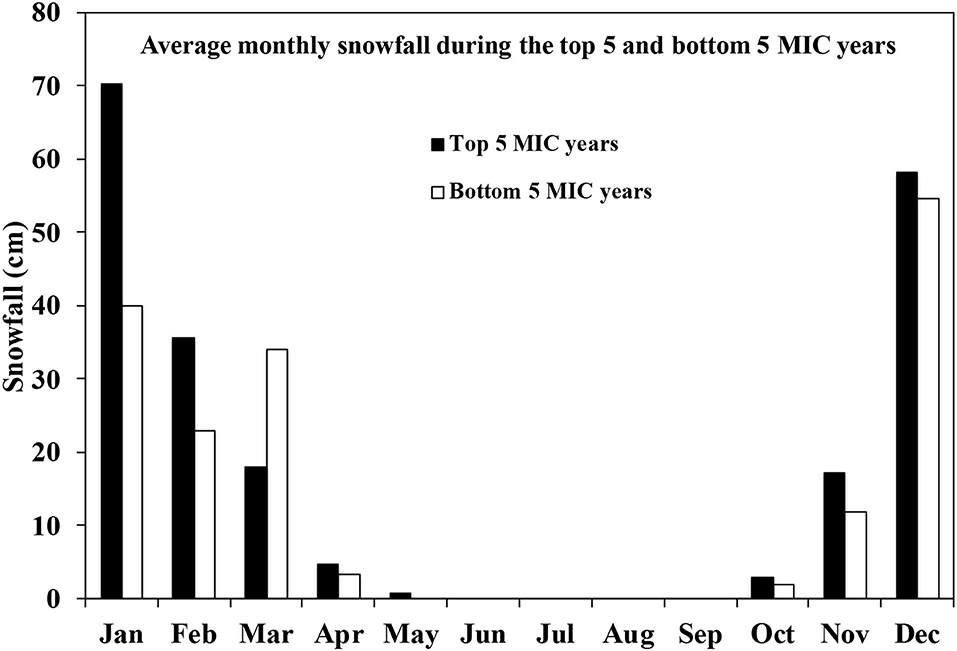
Figure 10. Comparison of snowfall averaged over all eight stations during the top five and bottom five MIC years.
Snowfall and ENSO/NAO
The SST34 has a stronger correlation with snowfall than the NAO (Table 2). The composite analysis suggests El Niño (or La Niña) events would likely decrease (or increase) snowfall in the LPM. The impact of different phases of ENSO on snowfall is significant at the 95% confidence level (Table 4). The different impact of El Niño and La Niña events on snowfall in the LPM might be due to different large-scale atmospheric circulations that affect the southeastward movement of cP and cA air masses. Smith and O'Brien (2001) found similar results and suggested that the decrease in snowfall during El Nino events might be associated with warmer surface temperatures and relative shift of jet stream locations to the south. Bai et al. (2012) found that El Niño events are associated with a unique atmospheric circulation pattern (a deep-than-normal trough over the Gulf of Alaska, a weaker-than-normal ridge over the west coast, and a weaker-than-normal Hudson Bay trough over eastern Canada) that prevent a cold Arctic air mass from intruding the Great Lakes region resulting in a decrease in snowfall and warm temperatures in the LPM. For the LPM, the average air temperature is −2.96 and −3.26°C during the defined El Niño and La Niña years (Table 4), respectively. This further confirms the negative correlations between air temperatures and snowfall.
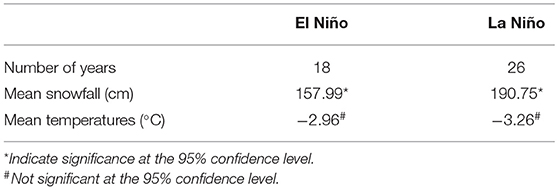
Table 4. Impact of the ENSO on annual total snowfall in the LPM.
Our study also demonstrates that the negative (positive) phase of NAO tends to increase (decrease) snowfall in the LPM (Table 5). This might be related to the impact of the NAO on the strength of polar vortex and westerly winds. During the years with negative NAO phases, a stronger-than-normal trough and ridge are developed near the Great Lakes and the U.S. west coast, respectively. The locations of the trough and ridge in North America favor the southward movement of an Arctic air mass over the Great Lakes and promote lake-effect snowfall and deliver cold air to the LPM (Bai et al., 2012). However, the impact of the NAO on snowfall in the LPM is not statistically significant (at the 90% confidence level) between the positive and negative phases of NAO. A weak correlation between snowfall and the NAO was also demonstrated in Clark et al. (2016, 2018) and in Gong and Ge (2009). The weak linkage between snowfall and the NAO might be due to the NAO's complicated interactions with the snow cover and the ENSO. Gong et al. (2002) investigated the impact of snow cover variations on NAO patterns and suggested that NAO patterns can be modulated by inter-annual snow variations. Previous studies also suggest complicated relationships between NAO-ENSO (Zhang et al., 2018, 2019; Mezzina et al., 2020). Such complicated relationships between NAO-ENSO might explain why snowfall-ENSO relationship is significant while snowfall-NAO relationship is not significant. Modeling studies will be needed to find the physical mechanism for the weak snowfall-NAO relationship.
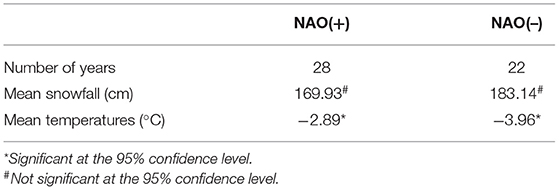
Table 5. Impact of the NAO on annual total snowfall in the LPM.
Conclusions
In this study, both the snowfall trend and the relationship between snowfall in the LPM and air temperature/ENSO/NAO/MIC are investigated using statistical analysis including Mann Kendall test, linear regression, and composite analysis. The eight stations with homogeneous time series dataset defined by Kunkel et al. (2009) are used. Our results indicate that snowfall has generally increased in the eight stations used in this study in the LPM during the period of 1932–2015 and the trend is statistically significant at the 95% confidence level in seven of the eight stations. The average rate of snowfall increase is 0.91 cm/year with a range of 0.094–2.48 cm/year.
Statistical analysis suggests that regional air temperatures in the LPM are the dominant factor influencing annual total snowfall, followed by the ENSO and NAO. Regional air temperatures have statistically significant (at the 95% confidence level) negative correlations with annual total snowfall in all stations used. Sea surface temperature anomalies in the Niño region 3.4 are significantly correlated with snowfall in the LPM in six of the eight stations (Table 2) for the period of 1932–2015. Sliding correlation analysis suggests that the average snowfall over the eight stations is significantly (at the 95% confidence level) correlated with the ENSO during the period of 1963–2015. It is demonstrated that the NAO is not significantly related to snowfall in the LPM. Our study also suggests that increased annual total snowfall occur in the years with higher MIC in Lake Michigan. Most of the increased snowfall occurs before the ice cover peaks in February/March. Regionally average air temperature has a strong correlation with MIC during the period of 1963–2015.
In summary, our study suggests that air temperature is highly correlated with annual snowfall in the LPM. During the period of 1932–2015, the winter air temperature averaged over the entire LPM has slightly decreased (not shown), which corresponds well with the increased trend in snowfall. Currently global mean temperature has continuously increased during the past decades. If the winter air temperature of the LPM follows the global trend, the annual total snowfall in the LPM might decrease in the future if the relationship persists. Additional data collection and further analysis are necessary to confirm the relationship between air temperatures and snowfall. Further, this study only used the dataset from those weather stations in the LPM that are homogeneous and appropriate for the long-term trend analysis based on Kunkel et al. (2009). Inclusion of additional weather stations might slightly affect the trend. Lastly, it should be noted that one of the caveats in this study is that statistical analysis can only refer the possible linkage between snowfall and several climatic variables. Modeling studies are required to provide the detailed mechanisms on how air temperatures/ENSO/NAO influence snowfall variability. This study on the trend of snowfall and its relationship with teleconnection patterns and regional temperatures/ice covers will provide scientific basis for policy makers on disaster clarification and severe winter storm policy and help local governments in preparation for winter seasons.
Data Availability Statement
The original contributions presented in the study are included in the article/supplementary material, further inquiries can be directed to the corresponding author/s.
Author Contributions
LM designed the study and performed the analysis with the assistance of BA and NK. LM wrote the manuscript in consultation with BA, NK, and KB. All authors discussed the results and commented on the manuscript.
Funding
The open access publication fees will be paid by Western Michigan University and W.E. Upjohn Center for the study of Geographical Change at WMU.
Conflict of Interest
The authors declare that the research was conducted in the absence of any commercial or financial relationships that could be construed as a potential conflict of interest.
Publisher's Note
All claims expressed in this article are solely those of the authors and do not necessarily represent those of their affiliated organizations, or those of the publisher, the editors and the reviewers. Any product that may be evaluated in this article, or claim that may be made by its manufacturer, is not guaranteed or endorsed by the publisher.
References
Assel, R. A. (2005). Classification of annual Great Lakes ice cycles: winters of 1973–2002. J. Clim. 18, 4895–4905. doi: 10.1175/JCLI3571.1
Bai, X. Z., Wang, J., Sellinger, C., Clites, A., and Assel, R. (2012). Interannual variability of Great Lakes ice cover and its relationship to NAO and ENSO. J. Geophys. Res. Oceans 117, C03002. doi: 10.1029/2010JC006932
Baijnath-Rodino, J. A., and Duguay, C. R. (2018). Historical spatiotemporal trends in snowfall extremes over the Canadian domain of the Great Lakes Basin. Adv. Meteorol. 2018, 1–20. doi: 10.1155/2018/5404123
Bard, L., and Kristovich, D. A. R. (2012). Trend reversal in Lake Michigan contribution to snowfall. J. Appl. Meteorol. Climatol. 51, 2038–2046. doi: 10.1175/JAMC-D-12-064.1
Blechman, J. B. (1996). A comparison between mean monthly temperature and mean monthly snowfall in New York State. Natl. Weather Dig. 20, 41–53.
Braham, R. R., and Dungey, M. J. (1984). Quantitative estimates of the effect of Lake-Michigan on snowfall. J. Clim. Appl. Meteorol. 23, 940–949. doi: 10.1175/1520-0450(1984)023<0940:QEOTEO>2.0.CO;2
Brown, L. C., and Duguay, C. R. (2010). The response and role of ice cover in lake-climate interactions. Prog. Phys. Geog. 34, 671–704. doi: 10.1177/0309133310375653
Changnon, S. A. (1968). Precipitation Climatology of Lake Michigan Basin. Illinois Water Survey Bulletin, Illinois State Water Survey, Urbana. p. 46.
Clark, C., Ganesh-Babu, B., Elless, T., Lyza, A., Koning, D. M., Carne, A. R., et al. (2018). Spatio-temporal November and March snowfall trends in the Lake Michigan region. Int. J. Climatol. 38, 3250–3263. doi: 10.1002/joc.5498
Clark, C. A., Elless, T. J., Lyza, A. W., Ganesh-Babu, B., Koning, D. M., Carne, A. R., et al. (2016). Spatiotemporal snowfall variability in the Lake Michigan region: how is warming affecting wintertime snowfall? J. Appl. Meteorol. Climatol. 55, 1813–1830. doi: 10.1175/JAMC-D-15-0285.1
Coleman, J. S. M., and Stefl, D. J. (2016). Eastern united states snowfall variability with three atmospheric teleconnections patterns. Int. J. Earth Atmos. Sci. 3, 17–23.
Daly, C., Halbleib, M., Smith, J. I., Gibson, W. P., Doggett, M. K., Taylor, G. H., et al. (2008). Physiographically sensitive mapping of climatological temperature and precipitation across the conterminous United States. Int. J. Climatol. 28, 2031–2064. doi: 10.1002/joc.1688
Dockus, D. A. (1985). Lake-effect snow forecasting in the computer age. Natl. Weather Dig. 10, 5–19.
Durre, I., Menne, M. J., Gleason, B. E., Houston, T. G., and Vose, R. S. (2010). Comprehensive automated quality assurance of daily surface observations. J. Appl. Meteorol. Climatol. 49, 1615–1633. doi: 10.1175/2010JAMC2375.1
Gerbush, M. R., Kristovich, D. A. R., and Laird, N. F. (2008). Mesoscale boundary layer and heat flux variations over pack ice-covered Lake Erie. J. Appl. Meteorol. Climatol. 47, 668–682. doi: 10.1175/2007JAMC1479.1
Gong, G., Entekhabi, D., and Cohen, J. (2002). A large-ensemble model study of the wintertime AO–NAO and the role of interannual snow perturbations. J. Clim. 15, 3488–3499. doi: 10.1175/1520-0442(2002)015<3488:ALEMSO>2.0.CO;2
Gong, G., and Ge, Y. (2009). North American snow depth and climate teleconnection patterns. J. Clim. 22, 217–233. doi: 10.1175/2008JCLI2124.1
Hartnett, J. J. (2020). A classification scheme for identifying snowstorms affecting central New York State. Int. J. Climatol. 41, 1712–1730. doi: 10.1002/joc.6922
Hartnett, J. J., Collins, J. M., Baxter, M. A., and Chambers, D. P. (2014). Spatiotemporal snowfall trends in Central New York. J. Appl. Meteorol. Climatol. 53, 2685–2697. doi: 10.1175/JAMC-D-14-0084.1
Hayhoe, K., VanDorn, J., Croley, T., Schlegal, N., and Wuebbles, D. (2010). Regional climate change projections for Chicago and the US Great Lakes. J. Great Lakes Res. 36, 7–21. doi: 10.1016/j.jglr.2010.03.012
Hurrell, J. W. (1995). Decadal trends in the North-Atlantic oscillation - regional temperatures and precipitation. Science 269, 676–679. doi: 10.1126/science.269.5224.676
Kluver, D. B., Leathers, D. J. (2015). Winter snowfall prediction in the United States using multiple discriminant analysis. Int. J. Climatol. 35, 2003–2018. doi: 10.1002/joc.4103
Kunkel, K. E., and Angel, J. R. (1999). Relationship of ENSO to snowfall and related cyclone activity in the contiguous United States. J. Geophys. Res. Atmos. 104, 19425–19434. doi: 10.1029/1999JD900010
Kunkel, K. E., Ensor, L., Palecki, M., Easterling, D., Robinson, D., Hubbard, K. G., et al. (2009). A new look at lake-effect snowfall trends in the Laurentian Great Lakes using a temporally homogeneous data set. J. Great Lakes Res. 35, 23–29. doi: 10.1016/j.jglr.2008.11.003
Kunkel, K. E., Karl, T. R., Brooks, H., Kossin, J., Lawrimore, J. H., Arndt, D., et al. (2013). Monitoring and understanding trends in extreme storms state of knowledge. Bull. Am. Meteorol. Soc. 94, 499–514. doi: 10.1175/BAMS-D-11-00262.1
Lawrimore, J. H., Wuertz, D., Wilson, A., Stevens, S., Menne, M., Korzeniewski, B., et al. (2020). Quality control and processing of cooperative observer program hourly precipitation data. J. Hydrometeorol. 21, 1811–1825. doi: 10.1175/JHM-D-19-0300.1
Mahmood, R., Pielke, R. A. Sr., Hubbard, K. G., Niyogi, D., Bonan, G., Lawrence, P., et al. (2010). Impacts of land use/land cover change on climate and future research priorities. Bull. Am. Meteorol. Soc. 91, 37–46. doi: 10.1175/2009BAMS2769.1
Meng, L., and Ma, Y. (2021). On the relationship of lake-effect snowfall and teleconnections in the Lower Peninsula of Michigan, USA. J. Great Lakes Res. 47, 134–144. doi: 10.1016/j.jglr.2020.11.013
Mezzina, B., García-Serrano, J., Bladé, I., and Kucharski, F. (2020). Dynamics of the ENSO teleconnection and NAO variability in the North Atlantic–European late winter. J. Clim. 33, 907–923. doi: 10.1175/JCLI-D-19-0192.1
Norton, D. C., and Bolsenga, S. J. (1993). Spatiotemporal trends in lake effect and continental snowfall in the Laurentian Great-Lakes, 1951–1980. J. Clim. 6, 1943–1956. doi: 10.1175/1520-0442(1993)006<1943:STILEA>2.0.CO;2
Notaro, M., Zarrin, A., Vavrus, S., and Bennington, V. (2013). Simulation of heavy lake-effect snowstorms across the Great Lakes Basin by RegCM4: synoptic climatology and variability. Month. Weather Rev. 141, 1990–2014. doi: 10.1175/MWR-D-11-00369.1
Patten, J. M., Smith, S. R., and O'Brien, J. (2003). Impacts of ENSO on snowfall frequencies in the United States. Weather Forecast 18, 965–980. doi: 10.1175/1520-0434(2003)018<0965:IOEOSF>2.0.CO;2
Pettersen, C., Kulie, M. S., Bliven, L. F., Merrelli, A. J., Petersen, W. A., Wagner, T. J., et al. (2020). A composite analysis of snowfall modes from four winter seasons in Marquette, Michigan. J. Appl. Meteorol. Climatol. 59, 103–124. doi: 10.1175/JAMC-D-19-0099.1
Schmidlan, T. W. (1993). Impacts of severe winter weather during December 1989 in the Lake Erie snowbelt. J. Climate 6, 759–767. doi: 10.1175/1520-0442(1993)006<0759:IOSWWD>2.0.CO;2
Scott, R. W., and Huff, F. A. (1996). Impacts of the Great lakes on regional climate conditions. J. Gt. Lakes Res. 22, 845–863. doi: 10.1016/S0380-1330(96)71006-7
Seager, R., Kushnir, Y., Nakamura, J., Ting, M., and Naik, N. (2010). Northern Hemisphere winter snow anomalies: ENSO, NAO and the winter of 2009/10. Geophys. Res. Lett. 37, 14703. doi: 10.1029/2010GL043830
Serreze, M. C., Clark, M. P., and McGinnis, D. L. (1998). Characteristics of snowfall over the Eastern Half of the United States and relationships with principal modes of low-frequency atmospheric variability. J. Clim. 11, 234–250. doi: 10.1175/1520-0442(1998)011<0234:COSOTE>2.0.CO;2
Smith, S. R., and O'Brien, J. J. (2001). Regional snowfall distributions associated with ENSO: implications for seasonal forecasting. B Am. Meteorol. Soc. 82, 1179–1191. doi: 10.1175/1520-0477(2001)082<1179:RSDAWE>2.3.CO;2
Suriano, Z. J. (2019). Changing intra-synoptic type characteristics and interannual frequencies of circulation patterns conducive to lake-effect snowfall. J. Appl. Meteorol. Climatol. 58, 2313–2328. doi: 10.1175/JAMC-D-19-0069.1
Suriano, Z. J., Leathers, D. J., Hall, D. K., and Frei, A. (2019a). Contribution of snowfall from diverse synoptic conditions in the Catskill/Delaware watershed of New York state. Int. J. Climatol. 39, 3608–3618. doi: 10.1002/joc.6043
Suriano, Z. J., Robinson, D. A., and Leathers, D. J. (2019b). Changing snow depth in the Great Lakes basin (USA): implications and trends. Anthropocene 26, 100208. doi: 10.1016/j.ancene.2019.100208
Szczypta, C., Gascoin, S., Houet, T., Hagolle, O., Dejoux, J.-F., Vigneau, C., et al. (2015). Impact of climate and land cover changes on snow cover in a small Pyrenean catchment. J. Hydrol. 521, 84–99. doi: 10.1016/j.jhydrol.2014.11.060
Winkler, J. A., Arritt, R. W., and Pryor, S. C. (2012). “Climate projections for the midwest: availability, interpretation and synthesis,” in U.S. National Climate Assessment Midwest Technical Input Report, eds J. Winkler, J. Andresen, J. Hatfield, D. Bidwell, and D. Brown, editors (Ann Arbor, MI: Great Lakes Integrated Sciences and Assessment (GLISA) Center). Available online at: https://glisa.umich.edu/media/files/NCA/MTIT_Future.pdf (accessed October 29, 2021).
Winkler, J. A., Guentchev, G. S., Liszewska, M., Perdinan and Tan, P. N. (2011). Climate scenario development and applications for local/regional climate change impact assessments: an overview for the non-climate scientist part II: considerations when using climate change scenarios. Geography Compass 5/6, 301–328. doi: 10.1111/j.1749-8198.2011.00426.x
Wolter, P. T., Johnston, C. A., and Niemi, G. J. (2006). Land use land cover change in the U.S. Great Lakes basin 1992–2001. J. Great Lakes Res. 32, 607–628. doi: 10.3394/0380-1330(2006)32[607:LULCCI]2.0.CO;2
Wright, D. M., Posselt, D. J., and Steiner, A. L. (2013). Sensitivity of lake-effect snowfall to lake ice cover and temperature in the Great Lakes Region. Month. Weather Rev. 141, 670–689. doi: 10.1175/MWR-D-12-00038.1
Zhang, W., Mei, X., Geng, X., Turner, A. G., and Jin, F.-F. (2019). A nonstationary ENSO–NAO relationship due to AMO modulation. J. Clim. 32, 33–43. doi: 10.1175/JCLI-D-18-0365.1
Keywords: snowfall, inter-annual variability, Lake Michigan, trend, maximum ice cover, ENSO
Citation: Meng L, Ayon BD, Koirala N and Baker KM (2021) Inter-annual Variability of Snowfall in the Lower Peninsula of Michigan. Front. Water 3:746354. doi: 10.3389/frwa.2021.746354
Received: 23 July 2021; Accepted: 11 October 2021;
Published: 03 November 2021.
Edited by:
Adam Burnett, Colgate University, United StatesReviewed by:
Satya Prakash, India Meteorological Department, IndiaAmalava Bhattcharyya, Birbal Sahni Institute of Palaeobotany, India
Jill Coleman, Ball State University, United States
Copyright © 2021 Meng, Ayon, Koirala and Baker. This is an open-access article distributed under the terms of the Creative Commons Attribution License (CC BY). The use, distribution or reproduction in other forums is permitted, provided the original author(s) and the copyright owner(s) are credited and that the original publication in this journal is cited, in accordance with accepted academic practice. No use, distribution or reproduction is permitted which does not comply with these terms.
*Correspondence: Lei Meng, bGVpLm1lbmdAd21pY2guZWR1