 Alfred P. Navato
 Amy V. Mueller
- 1Department of Civil and Environmental Engineering, Northeastern University, Boston, MA, United States
- 2Department of Marine and Environmental Sciences, Northeastern University, Boston, MA, United States
Wastewater treatment demands management of influent conditions to stabilize biological processes. Generally wastewater collection systems lack advance warning of approaching water parcels with anomalous characteristics, which could then be diverted for testing or pre-treatment. A major challenge in achieving this goal is identifying anomalies against the complex chemical background of wastewaters. This work evaluates unsupervised clustering methods to characterize “normal” wastewater characteristics, using >17 months of 10-min resolution absorbance spectrometry data collected at an operating wastewater treatment facility. Comparison of results using K-means, GMM, Hierarchical, and DBSCAN clustering shows minimal intra-cluster variability achieved using K-means. The four K-means clusters include three representing 99% of samples, with the remaining cluster (<0.3% of samples) representing atypical measurements, demonstrating utility in identifying both underlying modalities of wastewater characteristics and outliers. K-means clustering provides a better separation than grouping based on factors such as month, precipitation, or flow (with 25% overlap at 1-σ level, compared to 93, 93, and 83%, respectively) and enables identification of patterns that are not visible in factor-driven grouping, e.g., shows that summer and November months have a characteristic type of behavior. When evaluated with respect to wastewater influent changes occurring during the SARS-CoV-2 pandemic, the K-means approach shows a distinct change in strength of diurnal patterns when compared to non-pandemic periods during the same season. This method may therefore be useful both as a tool for fast anomaly detection in wastewaters, contributing to improved infrastructure resilience, as well for providing overall analysis of temporal patterns in wastewater characteristics.
1. Introduction
Municipal wastewater treatment and water resource recovery facilities leverage biological processes to remove carbon and nutrients, a critical aspect for meeting discharge permit limits that protect downstream ecosystems. While this is more cost effective and produces less hazardous waste then chemical treatment alone, it requires maintenance of the health of the microbial community to ensure proper results. Because re-establishing the process microbiome after a collapse is slow (up to ~weeks), there is interest in monitoring wastewater influent for anomalies that may indicate the presence of a toxic chemical or even a drastic change in influent character, to which the plant operator can respond, for example, by diverting flows to a holding basin while detailed chemical tests are conducted and/or adjustments (such as blending) are done before sending the wastewater to the treatment train. Yet “wastewater” is in reality a complex mixture of hundreds to thousands of different molecules, the concentrations of which can fluctuate based on community behaviors, industrial plant operations, precipitation (which can lead to dilution of wastewaters through stormwater infiltration), etc. (Thomas et al., 1999; Baurès et al., 2007; Tsoumanis et al., 2010; Schilperoort et al., 2012; Loos et al., 2013). Therefore, detecting an ability to properly detect anomalies is predicated on first being able to properly define the “normal” background against which to compare.
Initial approaches have worked toward this goal by detecting sudden changes in sensor measurements, with some robustness offered by using multi-wavelength spectrometer data [e.g., differential spectrum detection (Langergraber et al., 2003, 2006; Daniel et al., 2008), change detection using Autoregressive Integrated Moving Average (ARIMA) modeling (Daniel et al., 2008)]. However, sudden changes can occur due to non-problematic occurrences (e.g., operating hours of industrial or large office facilities). Therefore, a step toward defining “normal” has been to develop deterministic forecasting models based on external factors known to affect the chemical composition of wastewater, e.g.,time of day (Thomas, 2017), land use type (Lourenço et al., 2006; Baurès et al., 2007; Tsoumanis et al., 2010), and precipitation (Vaillant et al., 1999). Major limitations of such models are the complexity (i.e., relationship between factors and wastewater—for example, modeled behavior of citizens and businesses on a typical Monday must be differentiated from a holiday Monday, with numerous exceptional cases to be managed) and the need for data sources to ingest to drive the model.
Advances in pattern detection and recognition have resulted in new techniques for direct anomaly detection being applied to wastewater environments, e.g., anomaly detection through use of a deep autoencoder model on sewer flow data (Russo et al., 2020) and fault detection through application of a deep neural network to data from 12 chemical and operational sensors at an operating wastewater treatment plant (Mamandipoor et al., 2020). Related attempts on small datasets (months or less) have started to approach characterizing the complex background, e.g., clustering on 24-h of wastewater spectral data (Chow et al., 2018) and most recently, forecasting using various statistical and machine learning techniques on a few months of treatment train sensor data (flow, temperature, pH, and /) rather than external factors (as described above), with a neural network outperforming the other techniques in quantitatively predicting future sensor readings (Cicceri et al., 2021).
These recent approaches suggest promise in moving toward defining “normal” as a way to understand the natural variability in wastewater—thereby suggesting ways to assess anomalies by difference, which may provide more robustness in the long run given the challenges of tuning data-trained algorithms to detect rare occurrences. However, it is not yet clear how well existing approaches will generalize, particularly given the strong seasonal effects driving wastewater characteristics and short time frames of datasets used in most studies. Therefore, this paper explores the use of unsupervised clustering methods to define “normal” in a chemically complex system, taking wastewater as the test case given the strong motivation for anomaly detection in these collection and treatment systems, and leveraging a long-term dataset to assess the consistency (or variability) of wastewater over these operationally-relevant time scales. The results are compared to more typical factor-based approaches, such as those described above, for context and then evaluated under the very different operational conditions experienced during 2020 during the SARS-CoV-2 pandemic. The manuscript closes by providing an assessment of how this methodology may contribute to the overarching goal of providing resiliency to wastewater treatment facilities through a reliable method for characterizing conditions in wastewaters.
2. Methods
While a variety of sensing mechanisms can be used to assess water quality, absorbance spectrometry was selected for this study due to the wide range of chemicals that can be detected, the relevance of detectable analytes to wastewater, e.g., carbon oxygen demand (Gruber, 2006), nitrate and nitrite (Tsoumanis et al., 2010), and total suspended solids (Lepot et al., 2016), and the results of previous studies showing variability in wastewater character to be detectable using this method (Rieger et al., 2006; Lourenço et al., 2012; Carreres-Prieto et al., 2020). The approach described here has three key aspects: (1) multi-year field data collection, (2) use of typical and novel approaches to identifying underlying characteristics of the wastewater mixture, (3) evaluation of these approaches under a unique case study scenario, i.e., reconfiguration of societal behavior during the 2020 SARS-CoV-2 pandemic.
2.1. Data Collection, Pre-processing, and Normalization
An s::can spectro::lyser using a 5 mm path length was deployed at the Upper Blackstone Clean Water facility (UBCW) in the influent to the secondary treatment train (before the biological process but after removal of large solids), recording absorption at 208 wavelengths (220–737.5 nm, in steps of 2.5 nm) at 10-min intervals. UBCW has a capacity of 31 million gallons per day (MGD) and serves approximately 250,000 customers in the Worcester, MA area. Re-zeroing of the device (to Millipore Ultrapure water) and data download were performed approximately every 10 days. The dataset used for this work covers the period from January 7, 2020 to June 7, 2021 (total of 70,060 measurements, i.e., the complete dataset is a matrix of size 208 by 70,060).
Spectral data were pre-processed to compensate for lens fouling (i.e., buildup of material on the pathlength surfaces between cleanings) and to mitigate zeroing effects. Lens fouling is assumed to build up linearly; the offset between average signals within the 24 h after one cleaning and the 24 h immediately preceding the subsequent cleaning is linearly interpolated across the sampling period and subtracted from the sample data. As even small air bubbles can affect the zeroing of the device, essentially introducing an offset to subsequently measured spectra, spectral data are typically shifted by identifying one wavelength that has minimal and/or constant response to enable intercomparison between sampling periods. For this work the absorbance at the longest wavelength (least response in wastewater) was set to zero for all measurements. Finally, because the spectral shape, rather than intensity, was hypothesized to be important in identifying underlying “normal” modes, each spectrum was scaled such that the maximum absorption measurement was set to 1 after the adjustments made for lens fouling and zeroing described above [a normalization step previously shown to reduce impact of flowrate/dilution (Vaillant et al., 2002)]. The post-processed matrix (corrected for fouling and normalized using offset/scaling) of size 208 by 70,060 constituted the input to all algorithms described below.
To provide a comparison to existing methods leveraging known drivers of wastewater variability, auxiliary data were recorded for the following: facility inflow (provided by UBCW), precipitation [retrieved from the National Ocean Atmospheric Administration's Integrated Surface Data database (Smith et al., 2011), station ID 725100-94746-2021 at Worcester Regional Airport], and date/time (hour of day) of measurement.
2.2. Baseline Analysis
To provide a baseline for comparison, the spectral data were grouped based on known drivers (listed above), with the average and standard deviation of each group calculated. Binning within groups is as follows: date (binned by month), hour of day (3-h bins), flow (five bins each containing 20% of data, sorted from lowest to highest flow), and precipitation (dry weather, <0.75 in/h, and ≥ 0.75 in/h).
2.3. Data-Driven Group Identification
Many unsupervised clustering algorithms exist, each relying on different assumptions to represent the underlying structure of unlabeled data. Therefore, a comparative analysis of clustering models was performed, with the dual goals of producing clusters that were both distinct (low overlap between clusters) and tight (low within-cluster variability). Within-cluster variability was characterized by the sum of the squared Euclidean distances between each data point and the cluster centroid (Equation 1).
where (xi,...,xN) is the set of observations, K is the number of clusters, is the centroid of cluster Ck (coordinate-wise average of data points in Ck), and W is the sum of the within-cluster variabilities. Normalized xi were used to promote clustering based on spectral shape rather than absolute magnitude.
Four methods were selected, each summarized briefly here with citations to the methodologies provided: K-means (Likas et al., 2003), Gaussian Mixture Model (GMM) (Reynolds, 2009), Hierarchical (Johnson, 1967), and Density-Based Spatial Clustering of Applications with Noise (DBSCAN) clustering (Khan et al., 2014). K-means clustering groups data based on their proximity to centroids that are iteratively adjusted, with the K parameter identifying the number of centroids (i.e., number of clusters). GMM is similar to K-means but initializes, and then iteratively fits, K Gaussian distributions to the data and uses likelihood values to assign observations to clusters. Hierarchical clustering uses a similarity measurement (for this study, Euclidean distance) to group data into a linkage structure with a cutoff parameter determining the amount of similarity required to cluster measurements. DBSCAN clusters are identified based on the density of observations (the proximity of measurements to each other within the vector space), with the ϵ parameter establishing the maximum distance between observations allowed for clustering. The initial centroids for K-means and GMM were selected using the K++ algorithm. All clustering models were developed in Matlab R2021a (Mathworks, Natick, MA) using the Statistics and Machine Learning Toolbox.
Selecting the appropriate number of clusters was accomplished using the “Elbow method” (Yuan and Yang, 2019) with the number of clusters initially set to 1 and incremented until the point of diminishing returns (using W as the performance metric) was observed. The resulting trained classifier at the elbow point was used in this study for comparison with performance of the other classifiers, and relative performance of different classifiers was evaluated using W as the metric.
2.4. Case Study: 2020 SARS-CoV-2 Pandemic
As a case study, the selected best clustering algorithm was used to classify all collected data and specifically to evaluate the extent to which changes in patterns could be observed between days with no pandemic restrictions and days when pandemic restrictions were in place. In 2020, the SARS-CoV-2 pandemic caused major disruptions to societal behavior as local and federal governments imposed restrictions on business operations and movement of individuals. In Massachusetts the most severe restrictions were in place from March 17 to July 6, 2020. To minimize seasonal effects, this period was compared to March 17–June 7, 2021 during which time the restrictions were significantly loosened (approaching, though not yet at, “business as usual”).
3. Results
3.1. Wastewater Baselining
The mean and standard deviation (± 1σ) of the spectra grouped by known factors and their normalized transformations are shown in Figure 1. Typical relationships are visible in the data, e.g., higher flows tend to be more dilute (result in lower absorbance) than lower flows, and a similar effect is seen during storm events with intensity greater than 0.75 in/h. However, the clusters are neither tight nor distinct, with considerable overlap of the groups for all four factors considered. This level of residual uncertainty is typical and leads to similar uncertainty in associated forecasts which therein presents challenges for anomaly detection.
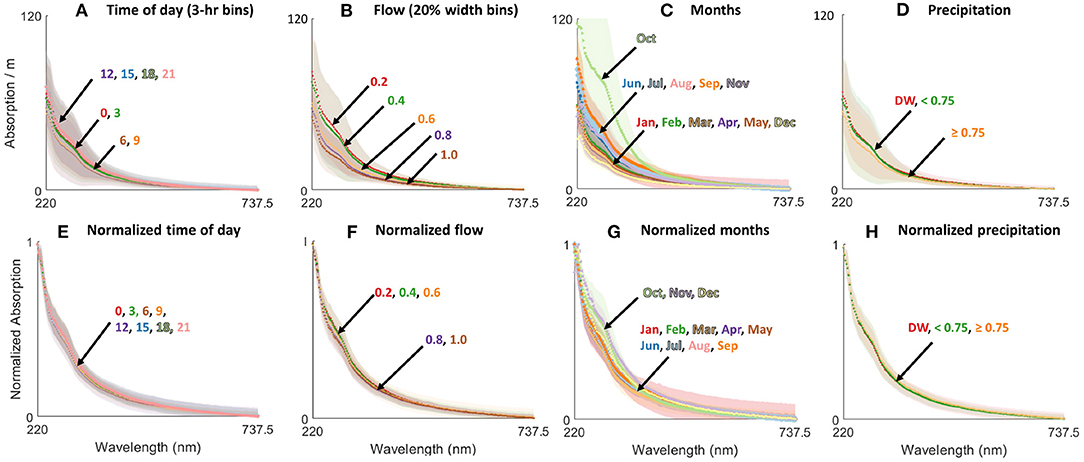
Figure 1. Average wastewater spectra categorized by the following factors; (A) time of day (3-h bins), (B) flow (20% width bins), (C) month, and (D) precipitation (DW is dry weather, numbers are in/h). Normalized spectra categorized by the following factors; (E) time of day, (F) flow, (G) month, and (H) precipitation with binning as for (A–D).
3.2. Unsupervised Clustering
The four utilized algorithms (K-means, GMM, Hierarchical, DBSCAN) identified different numbers of clusters (4, 4, 4+outliers, 2+outliers) and resulted in different W metrics (9.0 × 10³, 1.1 × 10⁴, 9.3 × 10³, 2.2 × 10⁴). For Hierarchical clustering, for computational tractability the number of clusters was iteratively increased by 1,000 to identify the elbow point at 6,000 measurements, however it should be noted that the four largest clusters comprise 89% of all measurements and most of the remaining 5,996 clusters consist of a single data point. Therefore, only the top four Hierarchical clusters were used in comparative analyses, with the remaining clusters treated as outliers. The K-means clustering trained classifier was selected as the optimal clustering method for this study, however results are reported both for this method and comparing generated clusters between methods.
Figures 2A,B show the K-means generated clusters, plotted, respectively, as normalized and unnormalized spectra. Two key observations follow. First, clusters 1–3 show similar characteristics, while cluster 4 has a very distinct shape, significantly greater standard deviation, and a minimal number of classified measurements. This implies this cluster represents atypical measurements, e.g., potentially requiring follow-up investigation by an operator to assess possible explanations (more discussion below). Second, when comparing the normalized K-means clusters (Figure 2B) to baseline groupings (Figures 1E–H), it is clear that the K-means cluster are more distinct: K-means clusters have only 25% overlap (at the 1-σ level), compared to 93, 99, 83, and 93% overlap for month-based, hour-based, flow-based, and precipitation-based groupings (number reported for normalized data). That is, for a new measurement, one may achieve a much higher level of confidence in assessing whether it is “normal” by comparing to these three clusters rather than requiring a deterministic model integrating effects of these multiple other factors (further implications discussed below).
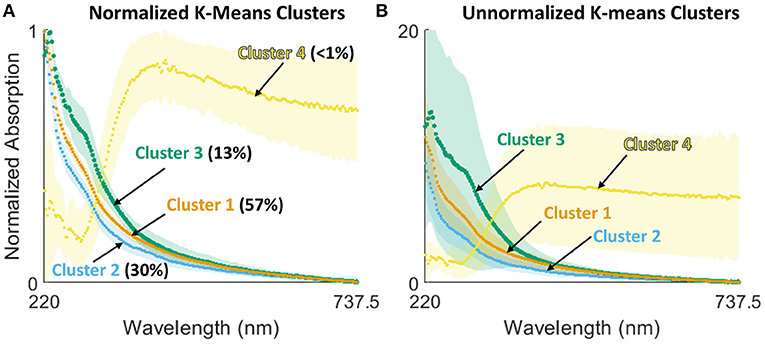
Figure 2. K-means cluster spectra mean and standard deviation as (A) normalized measurements (labeled with percentage of measurements within that cluster) and (B) unnormalized measurements.
To determine how “meaningful” the K-means identified clusters are, the similarity (or lack thereof) between clusters identified by different algorithms were compared. This was quantified by calculating the proportions of the K-means clusters within the clusters of each other technique (Figure 3, showing only top 4 clusters for Hierarchical which represent 94% of all measurements). K-means and GMM (similar techniques) result in very similarly defined clusters. Hierarchical clusters show substantial alignment with K-means clusters 2 and 3, with some movement of measurements to cluster 1. DBSCAN clustering appears to have been driven primarily by the atypical K-means cluster 4 data and are unlikely to be operationalizeable. In general, these results show consistency in the clustering where results are interpretable.
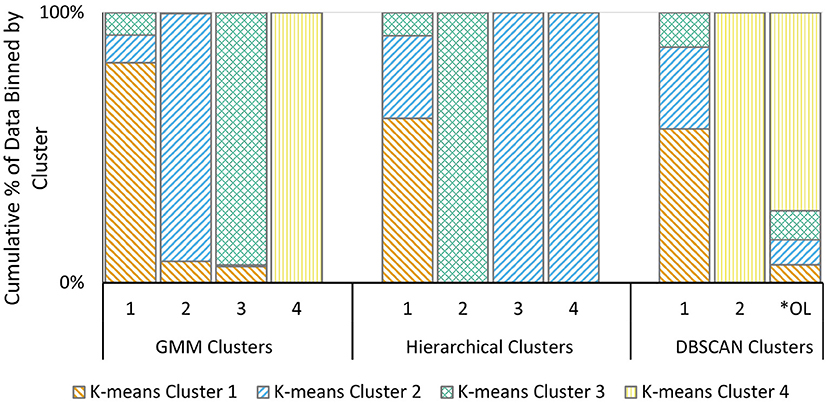
Figure 3. Proportion of K-means clusters assigned to clusters generated by alternative techniques: GMM clustering, Hierarchical clustering, and DBSCAN clustering. *OL, Outliers.
3.3. Clustering in Context of Known Factors and Case Study
To provide insight with respect to standard practice (Figure 1), K-means clusters are presented as a function of known factors in Figures 4A–D. Figure 4A shows that variability happens even at the scale of hours, with occurrence of the clusters roughly similar regardless of time of day. Figure 4D shows that the strong seasonal driver of wastewater is also visible in cluster proportional occurrence, although data from additional years would help clarify what fraction of this might be due to the exceptional conditions of 2020-21. These distinct seasonal patterns could help further refine anomaly detection, e.g., by weighting relative likelihoods of different clusters based on time of year.
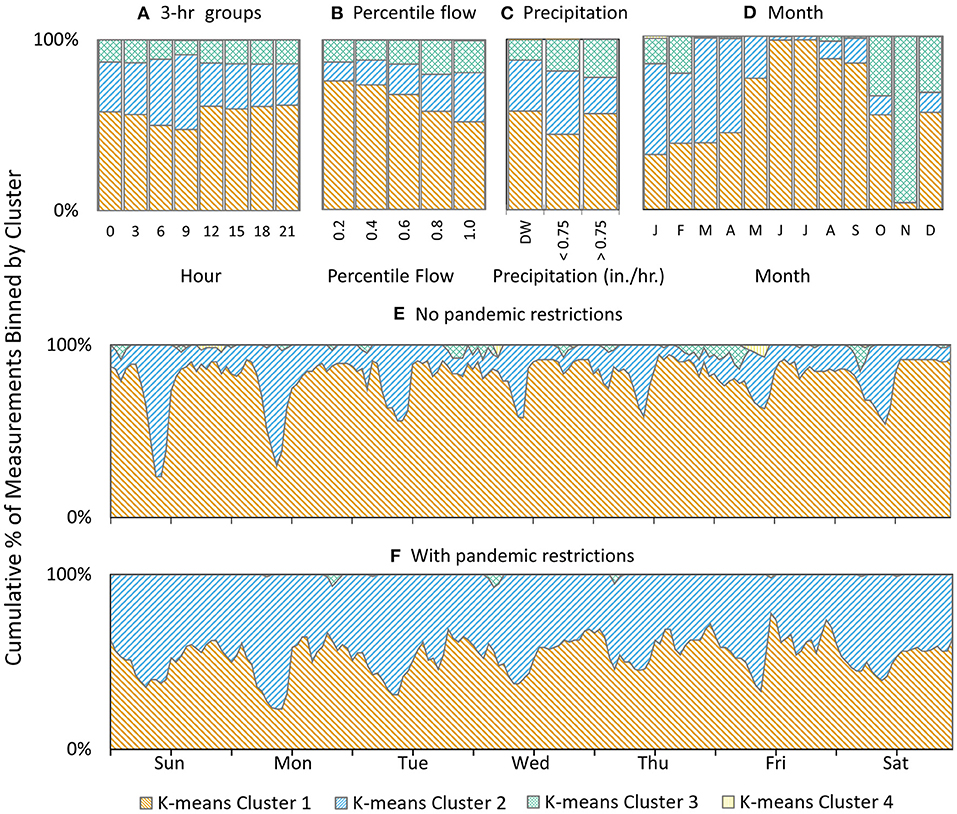
Figure 4. Distribution of K-means clusters categorized by known factors, (A) time of day (3-h bins), (B) flow (20% width bins), (C) precipitation, (D) months, (E) no pandemic restrictions (March 17–June 7, 2021), and (F) with pandemic restrictions (March 17–July 6 2020.
Figures 4E,F show, respectively, data separated by time where there were no restrictions and under pandemic restrictions. While these effects are also certainly visible as a function of flow or other measures, visualizing the wastewater characteristics in the framework of the (small number of) K-means clusters provides a very simple lens through which to visualize the drastic differences between the 2 years.
4. Discussion
The presented analysis can provide insight on several dimensions: on clustering techniques in comparison to current approaches, between different clustering approaches, and on use of K-means specifically for studying wastewater. On the first point, a major benefit of the clustering approach is decoupling the need to forecast multiple determining factors (e.g., precipitation, flow rates as driven by societal behavior) from an ability to set expectations for the “normal” compositional characteristics of wastewater inflow. This suggests a fast and simple method for development of an “early warning” system for anomalous inflows, i.e., simply by determining the likelihood that a given measurement falls within one of the 3 identified clusters. Operators then have an ability to set thresholds based on the risk tolerance of their facility, providing a balance between number of alerts (suggestions for further investigation of wastewater composition) and likelihood of detection of a potentially dangerous inflow condition.
Clustering of spectra can also be used to observe trends or patterns that may be difficult to visualize using other methods. For instance, some very strong patterns are observed in the monthly data (Figure 4D), with summer months consisting almost exclusively of K-means cluster 1 and November almost exclusively K-means cluster 3. This is in contrast with the “raw” month-based analysis (Figure 1C) where only October is clearly differentiable from the rest of the data. Further while it could be speculated that the patterns relating to summer months tie to precipitation patterns, the distribution of clusters as a function of flow and of precipitation both show only weak relationships. This suggests that the seasonal patterns are more complex than dilution alone. For instance, there may be different influences of business operational seasons, temperatures of water within wastewater collection systems, etc. that collectively drive a changing wastewater character. The patterns revealed in comparing spring seasons in 2020 (pandemic restrictions) and 2021 (relatively normal operations) also highlight a new way to visualize the complex impacts of the changes in societal behavior on wastewater composition. A major change during spring 2020 was the closing of a wide range of businesses and movement for individuals to work from home (a major effect for the urban population of Worcester, MA); this reflects in a lessening of the strength in diurnal patterns and a redistribution of different cluster frequencies despite similar inflow magnitudes.
The classification algorithm comparison (Figure 3) demonstrates that, while the underlying assumptions of each approach do affect the fine details of the developed clusters, all approaches achieve some level of agreement even in this unsupervised context. This provides some level of comfort that the groupings are “real,” i.e., that despite the fact that wastewater characteristics lie across a continuum, there are modalities which are statistically more common. The within-cluster variability also provides an ability to assess likelihood of a new sample matching each cluster, and therefore inversely, the likelihood of not belonging to any cluster, and use of these statistics from multiple dissimilar clustering approaches could therefore provide additional information to support anomaly detection. Finally, the results show that the distance-based approaches are strongly affected by outliers, which may prevent detection of nuanced patterns in the remaining data. For instance, in Hierarchical clustering 89% of observations are classified into the first cluster and in DBSCAN the largest cluster contains 99% of observations. Calibrating such approaches for wastewater applications may therefore require highly cleaned datasets or further research to evaluate applicability for anomaly detection.
Finally, K-means clustering specifically demonstrated utility in both clustering and anomaly detection in this application, identifying three relatively distinct modalities of wastewater (clusters 1–3) and relative outliers (cluster 4) (Figure 2). While the exact driver of the atypical points in cluster 4 has not been identified, the spectral shape does not resemble wastewater, and in fact the shape is more similar to readings taken when the sensor pathlength was not completely submerged in water – i.e., visual inspection confirms that these have been appropriately flagged as different from the three wastewater clusters. The K-means results are therefore appropriate to underpin a real-time alert system to assess the wastewater chemical characteristics and/or to verify sensor operations—a critically needed capability for managing wastewater treatment facilities.
In conclusion, this study developed a new approach to understanding modalities of “normal” in complex chemical mixtures by leveraging unsupervised clustering algorithms to identify underlying patterns, specifically building toward an online real-time approach for flagging chemical anomalies in wastewater systems. K-means clustering successfully identified relatively distinct and tight clusters in addition to a small fraction of atypical samples from approximately 1.5 years of data collected from an operating wastewater treatment facility. Visualizing the frequency of these clusters as a function of time and other variables, including societal behavior change driven by the SARS-CoV-2 pandemic, demonstrates a relatively simple approach to identifying patterns and changes in those patterns.
Moving forward, integration of data from other types of sensors could further refine the cluster definitions, and particularly could suggest cost-beneficial tradeoffs such as reducing the number of wavelengths that must be monitored to achieve classification in favor of less expensive hardware. Ultimately by achieving cost tradeoffs, it may be possible to distribute this type of sensor throughout the wastewater collection networks, therein providing operators with both longer lead times on anomaly warnings and more granular understanding of chemical changes throughout the system, ultimately providing more resiliency in operations of these critical infrastructure systems.
Data Availability Statement
The raw data supporting the conclusions of this article will be made available by the authors, without undue reservation.
Author Contributions
AN and AM conceptualized the research. AN performed data acquisition, data analysis, model development, and prepared the manuscript with contribution from all authors. AM supervised the project and reviewed and revised the manuscript. Both authors have read and approved the content of the manuscript.
Funding
This work was supported by Northeastern University Faculty startup funds.
Conflict of Interest
The authors declare that the research was conducted in the absence of any commercial or financial relationships that could be construed as a potential conflict of interest.
Publisher's Note
All claims expressed in this article are solely those of the authors and do not necessarily represent those of their affiliated organizations, or those of the publisher, the editors and the reviewers. Any product that may be evaluated in this article, or claim that may be made by its manufacturer, is not guaranteed or endorsed by the publisher.
Acknowledgments
The authors gratefully acknowledge the Upper Blackstone Clean Water facility and staff, especially Drs. Edris Taher and Ken Pousland. We would also like to thank Prof. Aron Stubbins at Northeastern University for use of the s::can instrumentation and Kevin Ryan for assistance in instrumentation operations.
References
Baurès, E., Hélias, E., Junqua, G., and Thomas, O. (2007). Fast characterization of non domestic load in urban wastewater networks by UV spectrophotometry. J. Environ. Monit. 9, 959. doi: 10.1039/b704061j
Carreres-Prieto, D., García, J. T., Cerdán-Cartagena, F., and Suardiaz-Muro, J. (2020). Wastewater quality estimation through spectrophotometry-based statistical models. Sensors 20:5631. doi: 10.3390/s20195631
Chow, C. W., Liu, J., Li, J., Swain, N., Reid, K., and Saint, C. P. (2018). Development of smart data analytics tools to support wastewater treatment plant operation. Chemom. Intell. Lab. Syst. 177, 140–150. doi: 10.1016/j.chemolab.2018.03.006
Cicceri, G., Maisano, R., Morey, N., and Distefano, S. (2021). A machine learning approach for anomaly detection in environmental iot-driven wastewater purification systems. Int. J. Environ. Ecol. Eng. 15, 123–130.
Daniel, O., Denieul, M.-P., and Lemoine, C. (2008). “Novel parametric and non-parametric approach for the online and real-time evaluation of the variability of an effluent (EVE),” in 18th European Symposium on Computer Aided Process Engineering (Lyon), 1–7.
Gruber, G.. (2006). Practical aspects, experiences and strategies by using UV/VIS sensors for long-term sewer monitoring. Water Pract. Technol. 1, 21–26. doi: 10.2166/wpt.2006020
Johnson, S. C.. (1967). Hierarchical clustering schemes. Psychometrika 32, 241–254. doi: 10.1007/BF02289588
Khan, K., Rehman, S. U., Aziz, K., Fong, S., Sarasvady, S., and Vishwa, A. (2014). “DBSCAN: past, present and future,” in 5th International Conference on the Applications of Digital Information and Web Technologies, ICADIWT 2014 (Bangalore: IEEE), 232–238.
Langergraber, G., Broeke, J. V. D., Lettl, W., and Weingartner, A. (2006). Real-time detection of possible harmful events using UV/vis spectrometry. Spectroscopy Eur. 18, 4–7.
Langergraber, G., Fleischmann, N., Hofstaedter, F., Weingartner, A., and Lettle, W. (2003). Detection of (unusual) changes in wastewater composition using UV/VIS spectroscopy. Wastewater (IWA Publishing), 1–8. Available online at: https://www.iwapublishing.com/books/iwa-publishing-digital-reference-library
Lepot, M., Torres, A., Hofer, T., Caradot, N., Gruber, G., Aubin, J. B., et al. (2016). Calibration of UV/Vis spectrophotometers: a review and comparison of different methods to estimate TSS and total and dissolved COD concentrations in sewers, WWTPs and rivers. Water Res. 101, 519–534. doi: 10.1016/j.watres.2016.05.070
Likas, A., Vlassis, N., and Verbeek, J. J. (2003). The global k-means clustering algorithm. Pattern Recognit. 36, 451–461. doi: 10.1016/S0031-3203(02)00060-2
Loos, R., Carvalho, R., António, D. C., Comero, S., Locoro, G., Tavazzi, S., et al. (2013). EU-wide monitoring survey on emerging polar organic contaminants in wastewater treatment plant effluents. Water Res. 47, 6475–6487. doi: 10.1016/j.watres.2013.08.024
Lourenço, N. D., Chaves, C. L., Novais, J. M., Menezes, J. C., Pinheiro, H. M., and Diniz, D. (2006). UV spectra analysis for water quality monitoring in a fuel park wastewater treatment plant. Chemosphere 65, 786–791. doi: 10.1016/j.chemosphere.2006.03.041
Lourenço, N. D., Lopes, J. A., Almeida, C. F., Sarraguça, M. C., and Pinheiro, H. M. (2012). Bioreactor monitoring with spectroscopy and chemometrics: a review. Anal. Bioanal. Chem. 404, 1211–1237. doi: 10.1007/s00216-012-6073-9
Mamandipoor, B., Majd, M., Sheikhalishahi, S., Modena, C., and Osmani, V. (2020). Monitoring and detecting faults in wastewater treatment plants using deep learning. Environ. Monit. Assess. 192:148. doi: 10.1007/s10661-020-8064-1
Rieger, L., Langergraber, G., and Siegrist, H. (2006). Uncertainties of spectral in situ measurements in wastewater using different calibration approaches. Water Sci. Technol. 53, 187–197. doi: 10.2166/wst.2006.421
Russo, S., Disch, A., Blumensaat, F., and Villez, K. (2020). “Anomaly detection using deep autoencoders for in-situ wastewater systems monitoring data,” in 10th IWA Symposium on Systems Analysis and Integrated Assessment (Copenhagen).
Schilperoort, R. P., Dirksen, J., Langeveld, J. G., and Clemens, F. H. (2012). Assessing characteristic time and space scales of in-sewer processes by analysis of one year of continuous in-sewer monitoring data. Water Sci. Technol. 66, 1614–1620. doi: 10.2166/wst.2012.115
Smith, A., Lott, N., and Vose, R. (2011). The integrated surface database: recent developments and partnerships. Bull. Am. Meteorol. Soc. 92, 704–708. doi: 10.1175/2011BAMS3015.1
Thomas, M.-F.. (2017). “Chapter 10: industrial wastewater,” in UV-Visible Spectrophotometry of Water and Wastewater (Amsterdam), 317–348.
Thomas, O., El Khorassani, H., Touraud, E., and Bitar, H. (1999). TOC versus UV spectrophotometry for wastewater quality monitoring. Talanta 50, 743–749. doi: 10.1016/S0039-9140(99)00202-7
Tsoumanis, C. M., Giokas, D. L., and Vlessidis, A. G. (2010). Monitoring and classification of wastewater quality using supervised pattern recognition techniques and deterministic resolution of molecular absorption spectra based on multiwavelength UV spectra deconvolution. Talanta 82, 575–581. doi: 10.1016/j.talanta.2010.05.009
Vaillant, S., Pouet, M., and Thomas, O. (2002). Basic handling of UV spectra for urban water quality monitoring. Urban Water 4, 273–281. doi: 10.1016/S1462-0758(02)00019-5
Vaillant, S., Pouet, M. F., and Thomas, O. (1999). Methodology for the characterization of heterogeneous fractions in wastewater. Talanta 50, 729–736. doi: 10.1016/S0039-9140(99)00200-3
Keywords: wastewater, anomaly detection, machine learning, K-means clustering, Gaussian Mixture Model, hierarchical clustering, DBSCAN, SARS-CoV-2
Citation: Navato AP and Mueller AV (2021) Enabling Automatic Detection of Anomalies in Wastewater: A Highly Simplified Approach to Defining “Normal” in Complex Chemical Mixtures. Front. Water 3:734361. doi: 10.3389/frwa.2021.734361
Received: 01 July 2021; Accepted: 12 November 2021;
Published: 13 December 2021.
Edited by:
Abbas Roozbahani, University of Tehran, IranReviewed by:
Sumit Purohit, Pacific Northwest National Laboratory (DOE), United StatesAnanda Tiwari, University of Helsinki, Finland
Copyright © 2021 Navato and Mueller. This is an open-access article distributed under the terms of the Creative Commons Attribution License (CC BY). The use, distribution or reproduction in other forums is permitted, provided the original author(s) and the copyright owner(s) are credited and that the original publication in this journal is cited, in accordance with accepted academic practice. No use, distribution or reproduction is permitted which does not comply with these terms.
*Correspondence: Alfred P. Navato, bmF2YXRvLmFAbm9ydGhlYXN0ZXJuLmVkdQ==