 Jessica Warrack*
 Mary Kang
- Department of Civil Engineering, McGill University, Montreal, QC, Canada
According to the California Sustainable Groundwater Management Act, the bottom of a basin, and subsequently the depth to which groundwater is managed, can be defined through physical or geochemical qualities of the aquifer. Total dissolved solids (TDS) concentrations are most frequently used to define the basin bottom. However, upper limits in TDS concentrations for “fresh” and “useable” groundwater can range from 1,000 to 10,000 mg/L. To evaluate the applicability of using TDS concentrations to delineate depths subject to sustainable groundwater management, we analyze 216,754 TDS measurements throughout the state of California. We find major challenges to reasonably estimating the BFW with our dataset in 73% of California due to data insufficiencies or complexity introduced by non-montonic TDS-depth relationships. We estimate the BFW in 22% of the Central Valley, a key agricultural region with large groundwater demands and many critically overdrafted groundwater subbasins. Using a TDS limit of 3,000 mg/L, where possible, we estimate the shallowest BFW in the Central Valley to be 155 m below ground surface and the deepest BFW to be 589 m below ground surface. We find that the base of brackish water (TDS < 10,000 mg/L) can extend more than 500 m deeper than the BFW in 78% of the Central Valley where we are able to estimate the BFW, which corresponds to 2% of California. There is a need to evaluate alternative strategies for defining groundwater subject to sustainable management, which likely involves additional measurements and analysis to better characterize groundwater quality with depth throughout California.
Introduction
Groundwater is an essential resource in California and accounts for >40% of the total annual water supply in the state (Babbitt et al., 2018). In 2014, the Sustainable Groundwater Management Act (SGMA) was signed into California law. The intention of SGMA is to provide guidance for long term sustainable groundwater management across the state through the creation of Groundwater Sustainability Agencies (GSA), which are required to submit Groundwater Sustainability Plans (GSPs) (University of California, Division of Agriculture and Natural Resources, 2015). In December 2019, the SGMA Basin Prioritization was completed and classified 94 (18%) of the 515 basins as medium or high priority (State of California, 2020). The basins classified as medium or high priority are primarily located in the Central Valley (MacLeod and Méndez-Barrientos, 2019; State of California, 2020), an agriculturally intensive area that accounts for ~75% of California's groundwater use (Ojha et al., 2018). The GSPs submitted in 2020 reveal that 60% are using the base of fresh water (BFW) concept (Kang et al., 2020) and maps that were developed over 50 years ago to define the basin bottom (Page, 1971, 1973). Therefore, there is a need to evaluate the applicability and the limitations of using the base of fresh water concept.
In order to develop GSPs, GSAs in California are required to implement governance actions based on regulatory and non-regulatory tools provided in the SGMA (Kiparsky et al., 2016). One major legislative gap in the SGMA is the lack of a specific definition of the bottom of a groundwater basin (Thompson et al., 2021). Areal extents of groundwater basins used in the SGMA are defined in Bulletin 118. According to Bulletin 118, the bottom of a groundwater basin can be defined based on physical characteristics or geochemical properties. One such geochemical property is total dissolved solids (TDS) concentrations. TDS limits are used in definitions for “fresh” or “useable” groundwater outlined by United States Geological Survey (USGS), the US Environmental Protection Agency, or the California Water Resources Control Board (SWRCB) (California Department of Water Resources, 2020). Unfortunately, definitions for fresh water in terms of TDS concentration limits vary widely depending on the context of use and the regulating body (Government of Canada, 1991; Rhoades et al., 1992; Driscoll, 2002; Government of Saskatchewan, 2008; Gray et al., 2011; Shevah, 2014). Generally, the upper limit for fresh water to be used as drinking water for humans is taken to be 1,000 mg/L (California State Water Resources Control Board, 2017; United States Geological Survey, 2019). In the widely-used BFW estimates completed in 1971 and 1973 (Page, 1971; Berkstresser, 1973) and more recent updates (O'Bryan, 1992), fresh water is defined as water with <2,000 mg/L TDS. California's Division of Oil, Gas, and Geothermal Resources (DOGGR) [now California Geologic Energy Management (CalGEM)] formerly used TDS concentration <3,000 mg/L for their BFW estimates (Davis et al., 2018). When using any of these TDS limits to estimate a BFW, an inherent assumption is that TDS concentrations monotonically increase with depth (Supplementary Figure 1). However, a state-wide assessment of the relationship between TDS concentrations and depth has not been conducted.
In 2013, the California Senate Bill 4 was passed which requires groundwater monitoring where TDS concentrations are <10,000 mg/L to protect groundwater from oil and gas development. The TDS limit of 10,000 mg/L is based on the United States Environmental Protection Agency's (US EPA) definition for underground sources of drinking water (USDW). Several peer-reviewed publications since the implementation of California Senate Bill 4 have used various methods and a TDS limit of 10,000 mg/L to map groundwater salinity and determine the depth to which groundwater is protected (Gillespie et al., 2017, 2019; Metzger and Landon, 2018; Stephens et al., 2019; Ball et al., 2020). However, to our knowledge, the depth to which TDS concentrations are <10,000 mg/L has not been mapped across California.
Although there are multiple GSAs (The Country of Fresno, 2019; Davids Engineering Inc., 2020; Dee Jaspar and Associates, Inc., et al., 2020; GEI Consultants, Inc., and Kern Groundwater Authority, 2020; Luhdorff and Scalmanini and California Department of Water Resources, 2020; San Joaquin River Exchange Contractors GSA, 2020; Semitropic Water Storage District, 2020) that specifically cite the USGS-estimated BFW (Page, 1971; Berkstresser, 1973; O'Bryan, 1992) for determination of the vertical basin boundaries (Kang et al., 2020), studies also suggest there are likely substantial volumes of fresh and usable water in groundwater aquifers not included by using the USGS-estimated BFW (Kang and Jackson, 2016). Given California Senate Bill 4 and previous research (Gillespie et al., 2017, 2019; Metzger and Landon, 2018; Stephens et al., 2019; Ball et al., 2020), one potential alternative approach is the use of the base of brackish water, where brackish water is usually defined as water with TDS concentrations <10,000 mg/L but greater than fresh water. Brackish water is increasingly becoming economical to treat (Karagiannis and Soldatos, 2008; Gray et al., 2011; Cassaniti et al., 2013; Kahsar, 2020) and there are several uses for brackish water including drinking water for livestock (Pfost et al., 2001), irrigation for agricultural and floricultural crops (Pang et al., 2010; Cassaniti et al., 2013) and thermoelectric power generation (Kahsar, 2020). Moreover, desalination of brackish water is considerably cheaper than seawater due to the lower concentration of impurities that must be removed (Karagiannis and Soldatos, 2008) and seawater is currently desalinated to supply fresh water in many parts of the world, including California (Calsbad Desalination Plant, 2017; Robbins, 2019). The base of brackish water is generally deeper than the BFW and may provide a more conservative approach to defining basin bottoms.
In this paper, we: (i) develop a framework to estimate the TDS profile and the BFW, (ii) estimate the BFW and the base of brackish water, where possible, and (iii) compare our BFW estimates with USGS-estimated BFWs. We then use our results to consider the limitations of utilizing the BFW for sustainable groundwater management. Overall, our results can be used to guide sustainable management of groundwater resources in California and elsewhere.
Methodology
TDS Data
We analyze 216,754 groundwater TDS measurements from five different sources; (1) the USGS Produced Waters Database (PWD), (2) CalGEM Data Sheets, (3) the USGS Brackish Groundwater Assessment (BGA), (4) the Water Quality Portal (WQP), and (5) the USGS Groundwater Ambient Monitoring and Assessment (GAMA) Program (Kang et al., 2019, 2020). We group TDS measurements by their depths: 0–25, 25–75, 75–150, 150–305, 305–1,000, 1,000–2,000, and >2,000 m. Because of the disproportionately large number of TDS data closer to the surface with 60% of data located within 75 m of the surface, we divide the first depth zone (75 m) used by Kang et al. (2020) into two distinct depth zones. We select a depth of 25 m because this depth splits the available data within 75 m of the surface evenly between the newly created depth zones (Supplementary Table 1). The remaining depth zones are based on the boundaries of previously studied depths (Kang et al., 2020). These depth zones are used to select measurements considered in TDS-depth profiles. The depths of the TDS measurements are retained in the analysis.
Estimation of the Base of Fresh Water
To examine the relationship between TDS measurements and depth, we divide the area of California into 10 by 10 km grid sections. We choose 20 grid sections across the Central Valley aquifer such that all of the Central Valley is no more than 50 km from a chosen grid section. We choose the Central Valley aquifer system because of data availability and because many medium and high priority basins are located in this aquifer system (Scanlon et al., 2012; California Department of Water Resources, 2019). After evaluating methodologies to estimate the BFW using the 20 grid sections, we estimate the BFW for all grid sections in the Central Valley, where possible.
For the 20 grid sections, we evaluate two different methods to select the set of TDS measurements that will be used to plot the TDS-depth profiles, determine the relationship between TDS measurements and depth, and estimate the BFW. The first method, the “fixed radius” approach, selects all TDS measurements within a specific radius from the center of the grid. Selection radii in the “fixed radius” approach are chosen in two different manners: (a) selection radii are the same across all grid sections but differ by depth zone to account for the larger number of data at depths closer to the surface and (b) selection radii are based on the density of data and vary with location and depth. Because fewer TDS measurement are available at deeper depths, we increase the selection radius with depth to ensure a sufficient number TDS measurements are selected from each depth zone (see Supplementary Table 1). The second method, the “nearest data” approach, selects a specific number of TDS measurements that are located closest to the center of the grid section. We evaluate two different numbers of TDS measurements: 20 and 10. Additionally, we set a 50 km limit on the search radius for all depth zones except the >2,000 m zone where we set a 100 km limit. As the distance between the available TDS measurement location and a grid section increases, the likelihood the data describes the TDS-depth relationship of that grid section decreases. Therefore, the 50 km and 100 km search radius limits are chosen to ensure that the selected TDS measurements accurately reflect the salinity profiles of each grid section. For all methods, after selection of the TDS measurements, we evaluate whether the BFW can reasonably be defined and estimate the range in BFW values (Supplementary Figure 2).
Across all grids in the Central Valley, we classify the relationship between TDS measurements and depth as: (1) linear and monotonic, (2) non-linear but monotonic, (3) non-linear and non-monotonic and (4) insufficient data (Figure 1 and Supplementary Figure 3). We classify a “linear” relationship when the fit has an R2 > 0.8 using a linear model. To determine the BFW, we complete a linear regression with the available data and use the linear equation to estimate the BFW using a TDS limit of 2,000 mg/L to compare to the USGS-estimated BFW. We also estimate the BFW using a TDS limit of 3,000 mg/L, which was a definition of fresh water formerly used by CalGEM and the Bureau of Land Management (Davis et al., 2018), and we estimate the base of brackish water using a TDS limit of 10,000 mg/L. To avoid extrapolating the available data, we only calculate the base of brackish water in areas where at least one TDS measurement within 100 km of the grid section exceeds 10,000 mg/L. We estimate the BFW and the base of brackish water in areas of the Central Valley with a linear and monotonic TDS-depth relationship. We do not determine an equation of best fit to represent TDS measurements with depth in areas with a “non-linear” (R2 < 0.8) but monotonic relationship. These areas represent only 1% of the total land area in the Central Valley and 0.1% of the total land area of California (Kharaka and Thordsen, 1992). Areas with no data are classified as having a total of 10 data points or less within a 50 km search area or lacking TDS concentrations associated with depths >300 m.
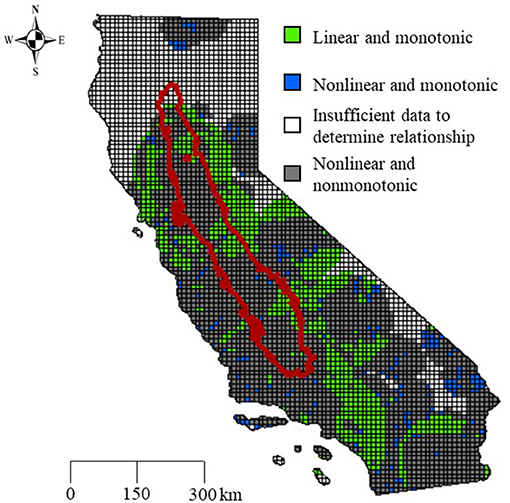
Figure 1. TDS-depth relationship by grid sections in California. Areas with a linear (R2 > 0.8) and monotonic relationship are in green, non-linear (R2 <0.8) and monotonic in blue, and insufficient data in white. Areas in gray have a non-linear non-monotonic TDS-depth relationship.
Comparison of Base of Fresh Water Estimates
We use contour maps of the USGS-estimated BFWs digitized by Kang et al. (2020) and compare them to our BFW estimates determined using a TDS limit of 2,000 mg/L. We note that Kang et al. (2020) did not estimate the BFW but directly compared TDS measurements to the BFWs estimated by the USGS and CalGEM and to depths of groundwater production wells. Here, we make a comparison of our estimated BFWs to the USGS-estimated BFWs despite the fact that these estimates are 50 years old because they are still being used in GSPs submitted in 2020 (Kang et al., 2020). Our comparison is limited to areas where we find linear and monotonic TDS-depth relationships.
Results
Estimates of the Base of Fresh Water in the Central Valley Using 20 Selected Grid Sections
Fixed Radius Approach
Using a fixed search radius that varies only with depth, we find that some of the 20 selected grid sections have substantially more data selected than other grid sections (Table 1, see Supplementary Figures 4–7, Supplementary Table 2). Grid section 1 has the most TDS measurements with 2,698 selected measurements, and grid section 20 has the fewest measurements with 142 selected measurements, resulting in a difference of 2,556 TDS measurements. Only 4 other grid sections (14, 12, 6, and 5) out of the 20 have more than 1,000 TDS measurements selected. We find 6 (30%) of the 20 selected grid sections have TDS measurements >3,000 mg/L within 25 m of the surface, and 8 (40%) of the 20 selected grid sections have a non-monotonic relationship. For 3 (15%) of the 20 selected grid sections, the BFW range is 293–1,350 m below the surface. Using a fixed search radius of 50 km for all depths and 100 km for >2,000 m depths, we can reasonably estimate the BFW in three (15%) of the 20 selected grid sections.
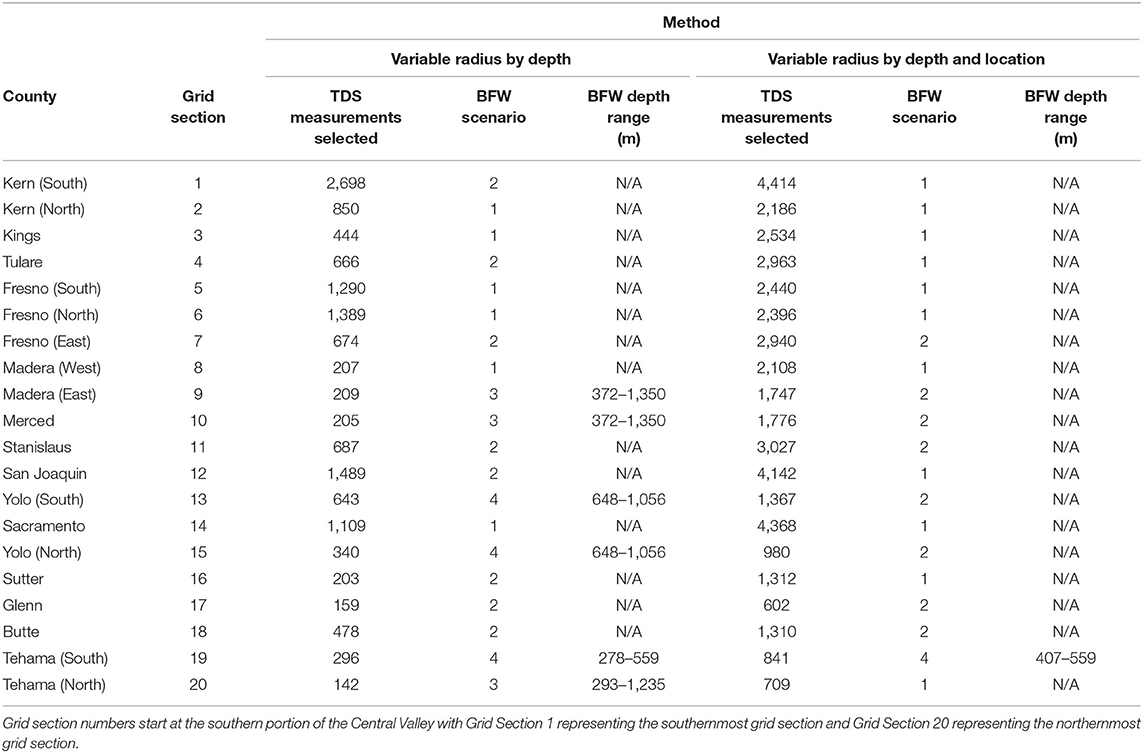
Table 1. Number of selected TDS measurements and ability to determine BFW for each of the 20 selected grid sections using selection methods that have a variable radius.
Next, we vary the search radius based on the point density of TDS measurements within range of the grid section (see Supplementary Figures 8–10, Supplementary Table 3). We find a difference of 3,812 TDS measurements between the grid section with the largest and the smallest number of selected measurements. Grid section 1, the southernmost selected grid section in the western half of Kern County, has the most selected TDS measurements with 4,414, located between 10 km in the two depth zones nearest the surface to 150 km at depths >2,000 m. Grid section 17, located in Glenn County, has the fewest TDS measurements selected with 602. The search radius in Glenn, Butte, Tehama, and Shasta Counties ranges from 10 km in the two depth zones nearest the surface to 200 km for depths >2,000 m. We find 11 (55%) of the 20 selected grid sections have TDS measurements >3,000 mg/L within 25 m of the surface, and 8 (40%) of the 20 selected grid sections have a non-monotonic TDS-depth relationship. We are able to determine the BFW in one (5%) of the 20 selected grid sections using TDS measurements obtained within a radius that varies with depth and location.
Nearest Data Approach
To identify a method that will increase the number of grid sections for which we can estimate the BFW, we select the 20 nearest TDS measurements with a 50 km radius of each grid section (Supplementary Figures 11–13). We find a difference of 36 TDS measurements between the grid section with the fewest and the largest number of selected measurements. We set the maximum number of TDS measurements selected from all depth zones at 120. Grid sections 2, 6, 7, 12, 13, 14, 15, and 16 have the maximum number of data available (Table 2). Grid section 11, in Stanislaus County, has the fewest data points within the selected radius with 84. Grid section 11 and 20 are the only grid sections with <100 selected measurements. We find 8 (40%) of the 20 selected grid sections have TDS measurements >3,000 mg/L within 25 m of the surface, and 4 (20%) of the 20 selected grid sections have a non-monotonic TDS-depth relationship. For 3 (15%) of the 20 selected grid sections, the estimated BFW lies between 372 and 2,133 m below the surface. We can reasonably estimate the BFW in 5 (25%) of the 20 selected grid sections.
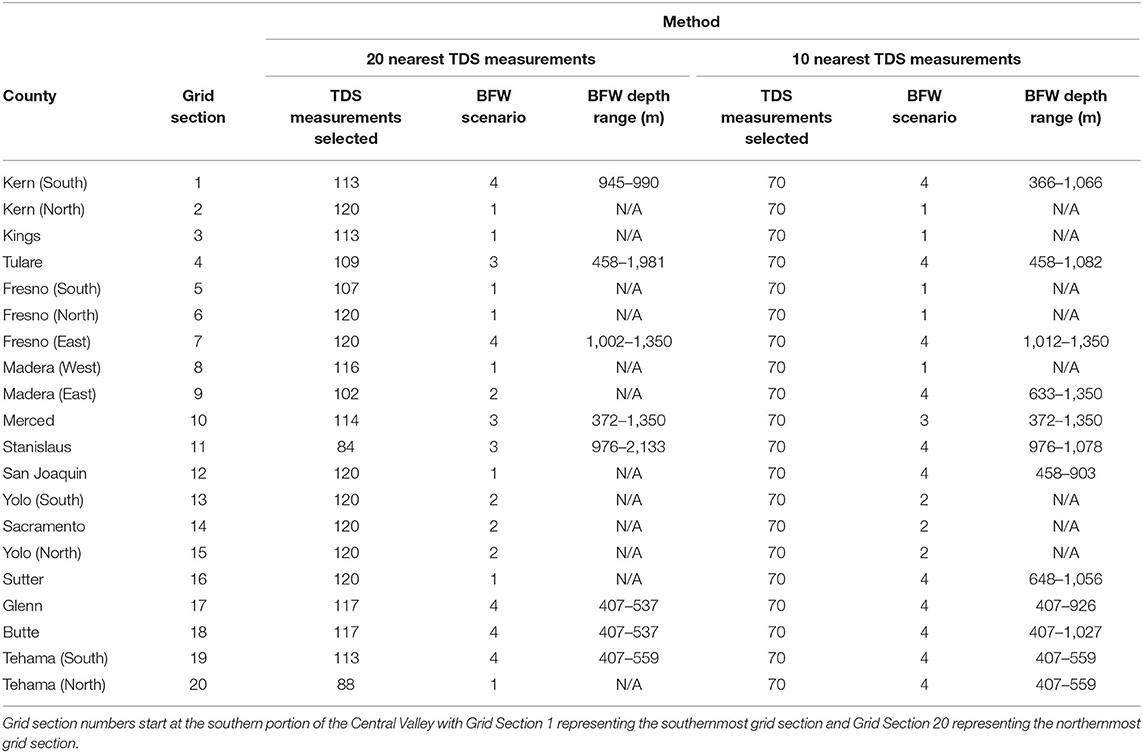
Table 2. Number of selected TDS measurements and ability to determine BFW for each of the 20 selected grid sections using methods that select the nearest 20 and 10 TDS measurements to the center of each grid section.
Next, we evaluate the approach that selects a maximum of the 10 closest TDS measurements in each depth zone (Supplementary Figures 14–16). This corresponds to a maximum of 70 TDS measurements over the seven depth zones (Table 2). We find that every grid section reaches the maximum of 70 selected TDS measurements, given the upper limit in search areas of 50 km radius for the top six zones and 100 km radius for the deepest depth zone (>2,000 km). We find that 5 (25%) of the 20 selected grid sections have TDS measurements >3,000 mg/L within 25 m of the surface, 3 (15%) of the 20 selected grid sections have a non-monotonic TDS-depth relationship, and 1 (5%) of the 20 selected grid sections has a BFW that lies between 372 and 1,350 m below the surface. We can reasonably estimate the BFW in 11 (55%) of the 20 selected grid sections, which represents the largest number of grid sections for which we estimate a BFW among the four methods explored here.
Relationship Between TDS and Depth
Because selection of the 10 nearest TDS measurements to the center of each grid section results in the largest area where a BFW can be reasonably estimated, we use this method to determine the TDS-depth relationship throughout California. To account for high TDS concentrations at the surface we determine two relationships between TDS and depth using (1) all depth zones and (2) depth zones deeper than 25 m (Supplementary Table 4). We find that excluding TDS measured at depths shallower than 25 m does not lead to substantially greater areas in which a BFW can be calculated (Supplementary Table 4). We find that in 20% (84,850 km2) of California, there is a linear (R2 > 0.8) and monotonic relationship between TDS measurements and depth. In 7% (31,506 km2) of California, we find a non-linear (R2 < 0.8) but monotonic relationship between TDS measurements and depth (Figure 1). An additional 23% (98,584 km2) of California, by area, is lacking sufficient TDS measurement data to determine the BFW. (We define areas lacking sufficient data as having <11 TDS measurements within the defined search radius or lacking TDS measurements associated with depths >300 m). In the Central Valley, 3% of the valley's total area does not have sufficient data for BFW calculations. Across California, 49% (209,026.76 km2) of the state's area has sufficient data but a non-linear and non-monotonic TDS-depth relationship, and the BFW concept may not be appropriate for identifying groundwater subject to management and protection in these areas.
Maps of Base of Fresh (TDS < 3,000 mg/L) and Brackish (TDS < 10,000 mg/L) Water
Focusing on the Central Valley, we estimate the BFW and the base of brackish water in 22% (10,461 km2) of the valley with linear and monotonic TDS-depth relationships, which accounts for 2% of the total area of California (Figure 2A). We estimate the shallowest BFW to be 155 m and the shallowest base of brackish water to be 691 m, which can be viewed as consistent with Gillespie et al. (2017). The deepest BFW is 590 m and 59% of BFW estimates are deeper than 400 m. Additionally, all base of brackish water estimates are deeper than 400 m and 68% of estimates are deeper than 1,000 m. The deepest base of brackish water estimate is 1,845 m. Where we calculate the BFW and the base of brackish water, an additional volume of at least 8,377 km3 would be managed and protected when using the base of brackish water, compared to the volume using our estimated BFW based on a TDS limit of 3,000 mg/L.
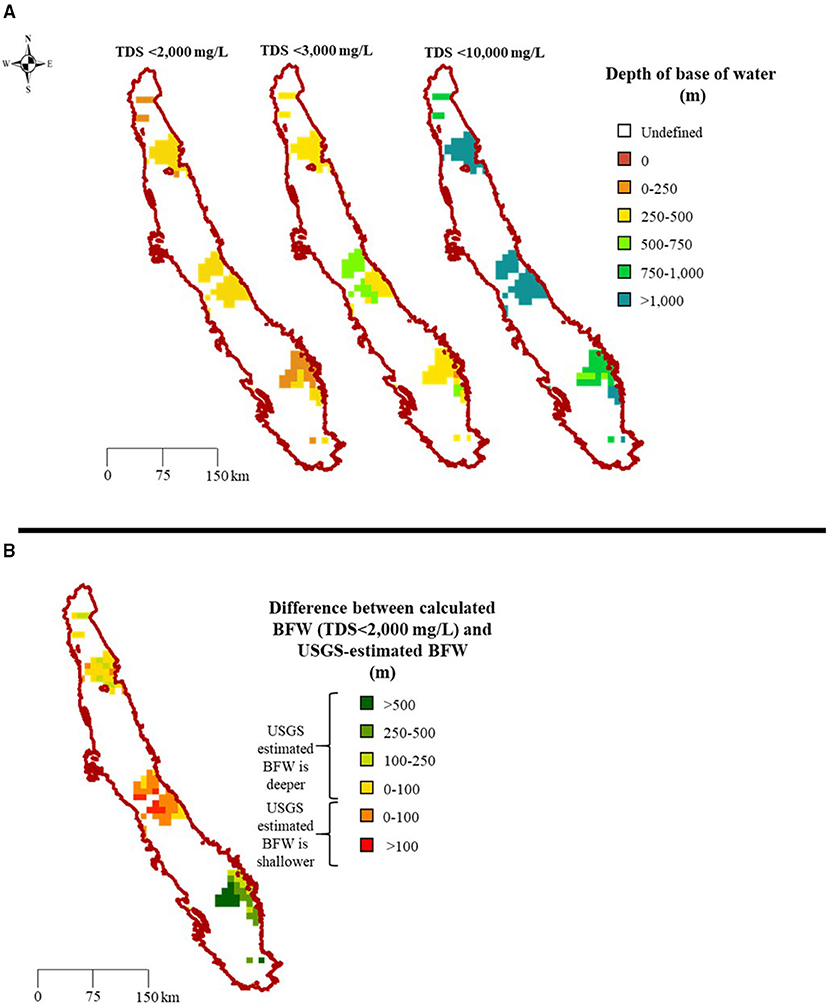
Figure 2. Maps of the base of water (A) using TDS < 2,000 mg/L (left), TDS < 3,000 mg/L (center), and TDS < 10,000 mg/L (right). Differences between the USGS-estimated BFW and our estimated BFW using TDS < 2,000 mg/L (B). In (B), green/yellow areas show where the USGS-estimated BFW is deeper and red/orange areas show where the USGS-estimated BFW is shallower, compared to our BFW estimate using TDS < 2,000 mg/L. (A) Maps of the base of fresh water. (B) Differences between the USGS-estimated BFW and the BFW estimated in this paper using TDS < 2,000 mg/L.
Comparison Between Our Estimated Bases of Fresh Water and Previously-Estimated Bases of Fresh Water
We compare our BFW estimates for the Central Valley (Figure 2A) with the USGS-estimated BFW (both based on a TDS limit of 2,000 mg/L) (Kang et al., 2020) in 22% (10,552 km2) of the Central Valley. We do not consider temporal variability, as a clear temporal trend could not be identified (Supplementary Figures 3, 4). We find that the USGS-estimated BFW is deeper in 65% (6,841 km2) of this estimated area and shallower in 35% (3,637 km2) of the estimated area (Figure 2B). The largest difference between our BFW and the USGS-estimated BFW is found to be 801 m where the USGS-estimated value is deeper than our estimated BFW. In areas of the Central Valley where the USGS estimates are deeper than our estimates, 57% of areas have a difference >100 m, and in areas where the USGS estimates are shallower than the BFW estimated in this paper, 19% have a difference >100 m. Where the USGS estimate is shallower than our estimates, the largest difference is 140 m. The USGS-estimated BFW is deeper than our estimated BFW in a majority of the area for which we estimate the BFW. The areas where our estimated BFW are deeper than the USGS-estimated BFW are found in regions north of Fresno County, whereas the areas where the USGS estimates are deeper are found in Fresno, King, Tulare, and Kern counties (Figure 2B). We find the USGS-estimated BFW conservatively protects more than 1,000 km3 of groundwater when compared to volumes based on our estimated BFW. However, we cannot reasonably estimate the BFW in the majority (85%) of the Central Valley due to non-linear and non-monotonic TDS-depth relationships. Therefore, our finding cannot be used to determine if the USGS-estimated BFW is a conservative option for groundwater management.
Discussion
Anthropogenic contamination from aboveground sources such as agriculture can impact groundwater quality (Ferguson et al., 2018; Warrack et al., 2021). Although we reach similar conclusions regardless of whether TDS measurements in the top 25 m are considered or not, impacts of agriculture on TDS concentrations is likely to be widespread (Suarez, 1989) and irrigated agriculture may also be responsible for the salinization of groundwater deeper than 25 m in the San Joaquin Valley (Schoups et al., 2005; Gillespie et al., 2017). Anthropogenic contamination from agriculture but also other industrial sources such as oil and gas development may be contributing to the large variation in TDS measurements in the top 75 m, which range from ~1 to ~100,000 mg/L between 50 and 75 m of depth. Additional sampling and analysis are needed to identify areas with naturally high TDS concentrations near the surface and areas affected by anthropogenic contamination. Removal of high TDS measurements in areas with contamination could assist in clarifying the TDS-depth relationship.
Overall, our methodology can be used to estimate the BFW and the base of brackish water at a large spatial scale. When combined with additional geologic and chemical properties of aquifers, our data and analysis may be useful for groundwater regulators to estimate TDS concentrations at a wider range of depths and for broader geographical areas. Another important consideration is the temporal variabilities in TDS concentrations as a result of anthropogenic activities such as groundwater overdraft (Hansen et al., 2018). Due to the limited data availability over time, only 16% of TDS samples are taken before 2000, and 45% of available TDS concentrations are lacking date information (Supplementary Figures 3, 4). Therefore, it is difficult to draw statistically significant relationships regarding changes in TDS concentrations over time.
Although we find that the USGS-estimated BFW appears to be a conservative option for groundwater management and protection, this comparison may not be representative as we are only able to reasonably estimate the BFW in 22% of the Central Valley and only 2% of California. Nevertheless, the USGS-estimated BFW is deeper than our estimated BFW in the counties of Fresno, King, Tulare, and Kern, where many critically overdrafted groundwater basins are found, and possibly protects more than 1,000 km3 of groundwater when compared to groundwater volumes based on our estimated BFW.
Even with a large data set of 216,754 TDS measurements, we are unable to reasonably estimate the BFW across 75% of California's area. There are data limitations that prevent characterization of the TDS-depth relationship in 23% of the state with the methods presented here. Moreover, even where there is sufficient data, the BFW (or base of brackish water) concept may not be appropriately applied for groundwater management because the TDS-depth relationship is non-monotonic, which is the case for a majority (52%) of the state. These findings support the conclusion that defining areas subject to groundwater management through TDS limits may not be a viable approach. Possible alternatives include considering other constituents such as nitrate and including geological information.
Another approach for GSPs to conservatively define basin bottoms is to use definitions such as the base of brackish water. However, as with the BFW, the base of brackish water is challenging to estimate because of data gaps, non-monotonic TDS-depth relationships, and large uncertainties. Nevertheless, the deeper depths associated with the base of brackish water would lead to sustainable management of more potentially usable groundwater–both fresh and brackish.
Additional sampling and studies to better define basin bottoms using TDS measurement and other hydrogeological and subsurface data are needed to fully evaluate BFW and alternative strategies, such as the base of brackish water.
Data Availability Statement
The datasets presented in this study can be found in online repositories. The names of the repository/repositories and accession number(s) can be found at: California TDS, Base of Fresh Water (https://osf.io/g42s7/).
Author Contributions
JW was responsible for research and the writing of this paper. MK conceived the project and provided guidance on methodology development, editing, and writing. All authors contributed to the article and approved the submitted version.
Funding
This study was funded by NSERC Discovery Grants Awarded to MK (RGPIN-2018-06383).
Conflict of Interest
The authors declare that the research was conducted in the absence of any commercial or financial relationships that could be construed as a potential conflict of interest.
Publisher's Note
All claims expressed in this article are solely those of the authors and do not necessarily represent those of their affiliated organizations, or those of the publisher, the editors and the reviewers. Any product that may be evaluated in this article, or claim that may be made by its manufacturer, is not guaranteed or endorsed by the publisher.
Acknowledgments
We thank Ziming Wang for support on the TDS data compilation and analysis.
Supplementary Material
The Supplementary Material for this article can be found online at: https://www.frontiersin.org/articles/10.3389/frwa.2021.730942/full#supplementary-material
References
Babbitt, C., Gibson, K., Sellers, S., Brozović, N., Saracino, A., Hayden, A., et al. (2018). The Future of Groundwater in California: Lessons in Sustainable Management from Across the West, Environmental Defense Fund and Robert B. Lincoln: Daugherty Water for Food Global Institute at the University of Nebraska.
Ball, L. B., Davis, T. A., Minsley, B. J., Gillespie, J. M., and Landon, M. K. (2020). Probabilistic categorical groundwater salinity mapping from airborne electromagnetic data adjacent to California's Lost Hills and Belridge Oil Fields. Water Resour. Res. 56:e2019WR026273. doi: 10.1029/2019WR026273
Berkstresser Jr, C. F. (1973). Base of fresh ground water approximately 3,000 micromhos in the Sacramento Valley and Sacramento-San Joaquin Delta, California. Water-Resources Investigations Report.
California Department of Water Resources (2019). Critically Over Drafted Basins. Available online at: https://water.ca.gov/Programs/Groundwater-Management/Bulletin-118/Critically-Overdrafted-Basins.
California Department of Water Resources (2020). California's Groundwater (Bulletin 118). Sacramento, CA.
California State Water Resources Control Board (2017). Groundwater Information Sheet: Salinity. Sacramento, CA: Division of Water Quality.
Calsbad Desalination Plant (2017). About: What We Do. Available online at: https://www.carlsbaddesal.com/what-we-do.html
Cassaniti, C., Romano, D., Hop, M. E. C. M., and Flowers, T. J. (2013). Growing floricultural crops with brackish water. Environ. Exp. Bot. 92, 165–175. doi: 10.1016/j.envexpbot.2012.08.006
Davids Engineering, Inc. (2020). Chowchilla Subbasin Sustainable Groundwater Mangagement Act: First Annual Report. Chowchilla, CA.
Davis, T., Landon, M. K., and Bennett, G. L. (2018). Prioritization of Oil and Gas Fields for Regional Groundwater Monitoring Based on a Preliminary Assessment of Petroleum Resource Development and Proximity to California's Groundwater Resources. Scientific Investigations Report. Reston, VA: United States Geological Survey, 128. doi: 10.3133/sir20185065
Dee Jaspar Associates, Inc., Ken Schmidt Associates, Inc., and South Valley Biology Consulting, LLC (2020). Tri-County Water Authority Groundwater Sustainability Plan. Corcoran, CA.
Driscoll, D. G. (2002). Hydrology of the Black Hills area, South Dakota. Water-resources investigations report: 02-4094. Rapid City, SD; Denver, CO: U.S. Department of the Interior; U.S. Geological Survey; U.S. Geological Survey Information Services.
Ferguson, G., McIntosh, J. C., Perrone, D., and Jasechko, S. (2018). Competition for shrinking window of low salinity groundwater. Environ. Res. Lett. 13:114013. doi: 10.1088/1748-9326/aae6d8
GEI Consultants, Inc., and Kern Groundwater Authority (2020). Groundwater Sustainability Plan. Sacramento, CA.
Gillespie, J., Kong, D., and Anderson, S. D. (2017). Groundwater salinity in the southern San Joaquin Valley. AAPG Bull. 101, 1239–1261. doi: 10.1306/09021616043
Gillespie, J. M., Davis, T. A., Stephens, M. J., Ball, L. B., and Landon, M. K. (2019). Groundwater salinity and the effects of produced water disposal in the Lost Hills–Belridge oil fields, Kern County, California. Environ. Geosci. 26, 73–96. doi: 10.1306/eg.02271918009
Government of Canada (1991). Guidelines for Canadian Drinking Water Quality: Guideline Technical Document – Total Dissolved Solids (TDS). Ottawa, ON.
Government of Saskatchewan (2008). Total Dissolved Solids (For Private Water and Health Regulated Public Water Supplies). Sask H2O. Moosejaw, SK.
Gray, S., Semiat, R., Duke, M. C., Rahardianto, A., and Cohen, Y. (2011). “4.04 - Seawater use and desalination technology,” in Treatise on Water Science, ed P. Wilderer (Oxford: Elsevier), 73–109. doi: 10.1016/B978-0-444-53199-5.00077-4
Hansen, J. A., Jurgens, B. C., and Fram, M. S. (2018). Quantifying anthropogenic contributions to century-scale groundwater salinity changes, San Joaquin Valley, California, USA. Sci. Total Environ. 642, 125–136. doi: 10.1016/j.scitotenv.2018.05.333
Kahsar, R. (2020). The potential for brackish water use in thermoelectric power generation in the American southwest. Energy Policy 137:111170. doi: 10.1016/j.enpol.2019.111170
Kang, M., Ayars, J. E., and Jackson, R. B. (2019). Deep groundwater quality in the southwestern United States. Environ. Res. Lett. 14:034004. doi: 10.1088/1748-9326/aae93c
Kang, M., and Jackson, R. B. (2016). Salinity of deep groundwater in California: water quantity, quality, and protection. Proc. Natl. Acad. Sci. U.S.A. 113, 7768–7773. doi: 10.1073/pnas.1600400113
Kang, M., Perrone, D., Wang, Z., Jasechko, S., and Rohde, M. M. (2020). Base of fresh water, groundwater salinity, and well distribution across California. Proc. Natl. Acad. Sci. U.S.A. 117, 32302–32307. doi: 10.1073/pnas.2015784117
Karagiannis, I. C., and Soldatos, P. G. (2008). Water Desalination Cost Literature: Review and Assessment. Desalination 223, p. 448–456. doi: 10.1016/j.desal.2007.02.071
Kharaka, Y. K., and Thordsen, J. J. (1992). “Stable isotope geochemistry and origin of waters in sedimentary basins,” in Isotopic Signatures and Sedimentary Records, eds N. Clauer and S. Chaudhuri (Berlin; Heidelberg: Springer Berlin Heidelberg), 411–466.
Kiparsky, M., Owen, D., Green Nylen, N., Doremus, H., Christian-Smith, J., Cosens, B., et al. (2016). Designing Effective Groundwater Sustainability Agencies: Criteria for Evaluation of Local Governance Options. eScholarship. Berkeley, CA: University of California, Berkeley.
Luhdorff and Scalmanini and California Department of Water Resources (2020). Westside Subbasin Groundwater Sustainability Plan. Fresno, CA.
MacLeod, C., and Méndez-Barrientos, L. E. (2019). Groundwater management in california's central valley: a focus on disadvantaged communities. Case Stud. Environ. 3, 1–13. doi: 10.1525/cse.2018.001883
Metzger, L. F., and Landon, M. K. (2018). Preliminary Groundwater Salinity Mapping Near Selected Oil Fields Using Historical Water-Sample Data, Central and Southern California. Scientific Investigations Report. Reston, VA: U.S. Geological Survey, 64. doi: 10.3133/sir20185082
O'Bryan, P. L. (1992). “A study of the base of fresh water in the Southern San Joaquin Basin, California,” in SPE Western Regional Meeting (Bakersfield, CA). doi: 10.2118/24084-MS
Ojha, C., Shirzaei, M., Werth, S., Argus, D. F., and Farr, T. G. (2018). Sustained groundwater loss in California's Central Valley exacerbated by intense drought periods. Water Resour. Res. 54, 4449–4460. doi: 10.1029/2017WR022250
Page, R. W. (1971). Base of Fresh Ground Water Approximately 3,000 Micromhos, in the San Joaquin Valley, California. Open-File Report. Reston, VA: United States Geological Survey. doi: 10.3133/ofr71223
Page, R. W. (1973). Base of Fresh Ground Water (Approximately 3,000 Micromhos) in the San Joaquin Valley, California. Hydrologic Atlas. Washington, D.C.
Pang, H.-C., Li, Y. Y., Yang, J. S., and Liang, Y. S. (2010). Effect of brackish water irrigation and straw mulching on soil salinity and crop yields under monsoonal climatic conditions. Agricult. Water Manag. 97, 1971–1977. doi: 10.1016/j.agwat.2009.08.020
Pfost, D. L., Fulhage, C. D., and Casteel, S. (2001). Water Quality for Livestock Drinking. Columbia, MO: University of Missouri.
Rhoades, J. D., Kandiah, A., and Mashali, A. M. (1992). The Use of Saline Waters for Crop Production. FAO irrigation and drainage paper 48. Rome: Food and Agriculture Organization of the United Nations.
Robbins, J. (2019). As Water Scarcity Increases, Desalination Plants Are on the Rise. Available online at: https://e360.yale.edu/features/as-water-scarcity-increases-desalination-plants-are-on-the-rise
San Joaquin River Exchange Contractors GSA (2020). Groundwater Sustainability Plan for the San Joaquin River Exchange Contractors GSP Group in the Delta-Mendota Subbasin. Los Banos, CA.
Scanlon, B. R., Faunt, C. C., Longuevergne, L., Reedy, R. C., Alley, W. M., and McGuire, V. L. (2012). Groundwater depletion and sustainability of irrigation in the US High Plains and Central Valley. Proc. Natl. Acad. Sci. U.S.A. 109:9320. doi: 10.1073/pnas.1200311109
Schoups, G., Hopmans, J. W., Young, C. A., Vrugt, J. A., Wallender, W. W., Tanji, K. K., et al. (2005). Sustainability of irrigated agriculture in the San Joaquin Valley, California. Proc. Natl. Acad. Sci. U.S.A. 102, 15352–15356. doi: 10.1073/pnas.0507723102
Semitropic Water Storage District (2020). Semitropic W.S.D. Groundwater Sustainability Plan. Bakersfield, CA.
Shevah, Y. (2014). Chapter: 1.4 - adaptation to water scarcity and regional cooperation in the middle East, in Comprehensive Water Quality and Purification, ed S. Ahuja (Waltham: Elsevier), 40–70. doi: 10.1016/B978-0-12-382182-9.00004-9
State of California (2020). Sustainable Groundwater Management Act 2019 Basin Prioritization. Department of Water Resources. Sacramento, CA.
Stephens, M. J., Shimabukuro, D. H., Gillespie, J. M., and Chang, W. (2019). Groundwater salinity mapping using geophysical log analysis within the Fruitvale and Rosedale Ranch oil fields, Kern County, California, USA. Hydrogeol. J. 27, 731–746. doi: 10.1007/s10040-018-1872-5
Suarez, D. L. (1989). Impact of agricultural practices on groundwater salinity. Agricult. Ecosyst. Environ. 26, 215–227. doi: 10.1016/0167-8809(89)90014-5
The Country of Fresno (2019). Draft Groundwater Sustainability Plan: County of Fresno GSA's Delta-Mendota Subbasin Management Area A and Management Area B. Fresno, CA.
Thompson, B., Rohde, M. M., Howard, J. K., and Matsumoto, S. (2021). Mind the Gaps: The Case for Truly Comprehensive Sustainable Groundwater Mangement. Stanford: Stanford Digital Repository. Available online at: https://purl.stanford.edu/hs475mt1364
United States Geological Survey (2019). Saline Water Use in the United States. Available online at: https://www.usgs.gov/special-topic/water-science-school/science/saline-water-use-united-states?qt-science_center_objects=0#qt-science_center_objects
University of California Division of Agriculture Natural Resources. (2015). Sustainable Groundwater Management Act. From https://groundwater.ucanr.edu/SGMA/.
Keywords: base of fresh water, California, total dissolved solid (TDS), salinity, groundwater management
Citation: Warrack J and Kang M (2021) Challenges to the Use of a Base of Fresh Water in Groundwater Management: Total Dissolved Solids vs. Depth Across California. Front. Water 3:730942. doi: 10.3389/frwa.2021.730942
Received: 25 June 2021; Accepted: 01 November 2021;
Published: 26 November 2021.
Edited by:
Hang Deng, Lawrence Berkeley National Laboratory, United StatesReviewed by:
Elena Giménez-Forcada, Instituto Geológico y Minero de España (IGME), SpainMichael Stephens, California Water Science Center (USGS), United States
Copyright © 2021 Warrack and Kang. This is an open-access article distributed under the terms of the Creative Commons Attribution License (CC BY). The use, distribution or reproduction in other forums is permitted, provided the original author(s) and the copyright owner(s) are credited and that the original publication in this journal is cited, in accordance with accepted academic practice. No use, distribution or reproduction is permitted which does not comply with these terms.
*Correspondence: Jessica Warrack, amVzc2ljYS53YXJyYWNrQG1haWwubWNnaWxsLmNh