 R. Patrick Bixler
 Sandeep Paul
 Jessica Jones1,2
 Matthew Preisser
 Paola Passalacqua
94% of researchers rate our articles as excellent or good
Learn more about the work of our research integrity team to safeguard the quality of each article we publish.
Find out more
ORIGINAL RESEARCH article
Front. Water, 27 August 2021
Sec. Water and Human Systems
Volume 3 - 2021 | https://doi.org/10.3389/frwa.2021.728730
This article is part of the Research TopicFlood Risk Perception, Vulnerability, and Risk: From Assessments to AnalysesView all 6 articles
To effectively cope with the impacts of climate change and increase urban resilience, households and neighborhoods must adapt in ways that reduce vulnerability to climate-related natural hazards. Communities in the United States and elsewhere are exposed to more frequent extreme heat, wildfires, cyclones, extreme precipitation, and flooding events. Whether and how people respond to increased hazard exposure (adaptive behavior) is widely recognized to be driven by their capacity to adapt, perception of the risk, and past experiences. Underlying these important dimensions, however, is social context. In this paper, we examine how social capital and social vulnerability shape risk perception and household flood mitigation actions. The study, based on a metropolitan-wide survey of households in Austin, Texas, USA, suggests that bonding social capital (personal networks, neighborhood cohesion, and trust) is positively related to mitigation behavior and that social vulnerability is negatively related to risk perception. Importantly, our research demonstrates a positive and significant effect of social capital on adaptive behavior even when controlling for social vulnerability of a neighborhood. This suggests that policies and programs that strengthen the social connectedness within neighborhoods can increase adaptive behaviors thus improving community resilience to flood events.
Increasing the resilience of urban communities to climate-related hazard events continues to be a major challenge across the world. Climate change is projected to amplify patterns of extreme weather, subsequently intensifying this risk for many geographies (Hirabayashi et al., 2013; Myhre et al., 2019; National Academies of Sciences Engineering, 2019; Papalexiou and Montanari, 2019). A combination of urban population growth, urban development sprawl, and aging urban infrastructure further complicate and challenge urban resilience to climate-related risks (Bai et al., 2018; Bixler et al., 2019). The same is true for many cities in the United States (U.S.) where the frequency and scale of extreme weather events have rapidly increased in recent decades. According to the United States National Climate Assessment, the frequency, and cost of billion-dollar socio-natural disasters have been increasing in the U.S., owing to a combination of increased exposure, vulnerability and the effects of climate change (Smith, 2021). Top among these is water-related events, such as severe storms, hurricanes, and tropical storms. It has been reported that more than 70% of the water-related events in the last three decades have cost more than a billion dollars per event in total losses to the U.S. economy (Kunreuther et al., 2018).
The impact of flooding is most acutely experienced by private households, underscoring the need to better understand how households and neighborhoods can decrease vulnerability by reducing exposure, sensitivity or increasing adaptive capacity (Adger, 2006). In response, scholarship that focuses on flood mitigation behavior at the household level is on the rise (Brody et al., 2010, 2017; Babcicky and Seebauer, 2017; Shah et al., 2017). Risk perception, past experience with flooding, and the broader social context have all been explored as driving flood risk mitigation behavior (Kellens et al., 2011; Terpstra, 2011; Babcicky and Seebauer, 2017; Lechowska, 2018; Kuang and Liao, 2020). While there is general agreement that past experience is a consistent factor influencing preparedness and mitigation behavior (Siegrist and Gutscher, 2008; Babcicky and Seebauer, 2017), the relationship between risk perception and mitigation has been found to be more complex (Takao et al., 2004; Lindell and Hwang, 2008; Bubeck et al., 2012). Underlying these important dimensions are variables indicative of one's social context: social capital and social vulnerability.
The ability for people to act collectively, rather than as isolated individuals or households, is fundamental to the ability to adapt to and recover from natural hazards (Adger, 2003; Pelling and High, 2005; Wilson et al., 2020). Social capital—or the social resources such as personal networks, neighborhood cohesion, and trust that a household has access to—is considered an important factor influencing mitigation behavior (Adger, 2003; Pelling and High, 2005; Babcicky and Seebauer, 2017; Hudson et al., 2020). It has been reported that higher levels of social capital can motivate protective action (Babcicky and Seebauer, 2017; Hudson et al., 2020) and influence risk perception (Babcicky and Seebauer, 2017; Hudson et al., 2020). Relatedly, socio-demographic variables related to social vulnerability, such as age, ethnicity, income, and gender have been reported to affect risk perception and mitigation behaviors (Lindell and Hwang, 2008), and multi-dimensional social vulnerability indices are increasingly used to demonstrate the disparate outcomes of flood events at aggregated geographical resolutions, such as counties (Cutter et al., 2003; Tate et al., 2021).
Important contributions have been made exploring the “social context” of risk perception and mitigation behavior (Babcicky and Seebauer, 2017; Hudson et al., 2020), however adequate integration of the social dimensions remains insufficient in both policy and research (Cutter et al., 2003; Engle, 2011). There is little consensus on how social capital and social vulnerability relate to risk perception and flood mitigation action. This research makes a novel contribution by considering the effect of neighborhood social vulnerability (as calculated through a multi-dimensional social vulnerability index) and social capital on risk perception and mitigation behaviors.
Our paper will proceed as follows. First, we review the literature on flood risk perception, household flood risk mitigation behavior, social capital, and social vulnerability. Next, we will present the geographic domain of our study, Austin, Texas, USA, followed by a description and discussion of our data. We will then discuss our analytical technique followed by results and discussion. Our results demonstrate the importance of the “social context” in having positive (social capital) and negative (social vulnerability) effects on flood risk perception and household mitigation behaviors.
Individuals tend to pursue mitigation actions based on access to information and resources (Daramola et al., 2016; Shah et al., 2017). By better understanding why and when individuals implement “household hazard adjustments” (Burton et al., 1993; Lindell, 1997; Brody et al., 2017), local governments can better develop effective programming and policy that reflects the community's needs (Few, 2003; Wisner et al., 2004; Jabeen et al., 2010; Abid et al., 2015; Brody et al., 2017; Shah et al., 2017). These mitigation actions can be structural and/or non-structural actions taken to reduce the impact of flood events to avoid damage to personal property, avoid loss of life, and to decrease or diminish overall damages (Brody et al., 2017).
Numerous factors can influence an individual to pursue flood mitigation actions. Some of the frequently identified factors include: “hazard experience, hazard intrusiveness, location in relation to physical risk, risk perception, and socioeconomic [and demographic] characteristics,” (Brody et al., 2017, p. 569). Previous flood experience is a consistent and reliable factor for flood-related mitigation behaviors (Grothmann and Reusswig, 2006; Siegrist and Gutscher, 2008; Babcicky and Seebauer, 2017). Victims of flood events possess a unique awareness of their vulnerabilities and associate different emotions with floods (Terpstra, 2011), making them more likely to implement mitigation measures than non-victims (Grothmann and Reusswig, 2006; Siegrist and Gutscher, 2008; Zaalberg et al., 2009). Race and ethnicity and socioeconomic status were found to play a role in individuals being able to access and afford mitigation measures (Browne and Hoyt, 2000; Collins, 2008; Lindell and Hwang, 2008; Brody et al., 2017). For example, Lindell and Hwang (2008) found a high correlation to those who identify as white and having flood insurance. Gender also is related to whether individuals seek mitigation measures. Previous research indicates an indirect relationship with risk perception and those who identify as female, indicating a higher risk perception than their male cohort (Lindell and Hwang, 2008; Terpstra and Lindell, 2013; Brody et al., 2017). Education has also been identified as playing a role in flood mitigation actions, with higher levels of education associated with more mitigatory actions (Brody et al., 2010; Shah et al., 2017). Additionally, household size and homeownership may also affect the level of protective measures adopted (Shah et al., 2017).
It should be noted that the relationship between flood mitigation behavior and its major drivers is yet to be fully understood. Inconclusive and differing results on factors influencing uptake on private flood mitigation actions (Hung, 2009; Michel-Kerjan and Kunreuther, 2011; Brody et al., 2017) hints at the need to broaden the scope of inquiry. Any attempt to better understand private flood mitigation should take into consideration the social characteristics and idiosyncrasies of the community in which households are situated. The situation warrants us to take a closer look at the mediating factors, especially the social context, which is inadequately addressed.
Risk perception can be understood as intuitive judgment about the potential risk and its consequence that an individual or group holds (Slovic et al., 1984; Raaijmakers et al., 2008; Rana et al., 2020). It is a process that involves the collection, selection, and interpretation of signals from direct or indirect experiences of uncertain impacts of a potential event (Wachinger et al., 2013). Risk perception is fundamental to understanding adaptation and mitigation actions taken on by individuals.
Scholars have framed flood risk perception in a variety of ways. Raaijmakers et al. (2008) argues that flood risk perception should be conceptualized as a relationship between awareness, worry, and preparedness. Relatedly, Wachinger et al. (2013) identifies a broad set of factors influencing risk perception, including: scientific factors, informational factors, personal factors, and contextual factors. Past experience can also shape risk perception. Factors such as recency, frequency, and intensity of people's personal experience with hazard events can shape their risk perceptions (Weinstein, 1989; Lindell and Prater, 2000; Lindell and Hwang, 2008). However, the relationship between identified characteristics and flood risk perception is not always conclusive; often results vary and are sometimes contradictory (Kellens et al., 2011; Brody et al., 2017; Lechowska, 2018). As mentioned before, this is most prevalent in studies inquiring into the adoption of private mitigation efforts. This might be indicative of a possible presence of risk perception paradox (Wachinger et al., 2013), a situation where individuals do not take appropriate action even if they experience high risk perception. This again validates the need to look more closely at the larger social constructs influencing risk perception. While there is a general consensus that strength of risk perception is important to flood mitigation and governance, they are often not well-integrated in to studies of hazard risk governance (Messner and Meyer, 2006; Birkholz et al., 2014; Rufat et al., 2015) and the intersection with adaptive capacity and social vulnerability is poorly understood.
A seemingly simple yet complex concept, “adaptive capacity” has been approached and defined differently by various disciplines (Adger, 2003; Cutter et al., 2003; Engle, 2011; Wilson et al., 2020). Adaptive capacity is often used to refer to “a vector of resources and assets” (Adger and Vincent, 2005) and is generally considered as four sets of interconnected resources: economic or financial, social, informational, and community (Norris et al., 2008; Barnes et al., 2020). In disaster resilience literature, the concept of adaptive capacity is used to represent the counteracting influences that reduce the effects of hazard exposure and sensitivity, or susceptibility to the hazard (Adger, 2006; Gallopín, 2006; Engle, 2011).
Our interest in this study is primarily on the social dimensions of adaptive capacity, or social capital. Social capital has become one of the more salient concepts in the social sciences and one of the more popular exports from sociological theory to other fields of research and policy (Portes, 1998). Although various definitions exist, they generally involve a focus on networks, norms, social cohesion, and trust. For example, Robert Putnam defines social capital in a way that emphasizes trust and norms as a strategy to enable participants to act together more effectively to pursue shared objectives (Putnam, 1995a,b). Bourdieu (1984) and Lin (2002) focus more on the “network” dimension of social capital with a focus on the resources (and returns) that are available to a person based on strong and/or weak relationships (Bourdieu, 1984, 1986; Lin, 2002). Relatedly, Fukuyama (2002) highlights social cohesion by emphasizing the shared norms or values that promote social cooperation (Fukuyama, 2002). Operationalization and measurement of social capital can and should be distinguished into its three components—bonding, bridging, and linking social capital (Woolcock, 2001; Harrison et al., 2016). If social capital is measured as strong ties between members in the community, it can be termed as “bonding” social capital. Weak ties between more distant or heterogeneous members of a community or network are bridging ties, and the “vertical” dimension of social capital refers to linkages with institutions of power beyond the community (Woolcock, 2001; Harrison et al., 2016).
Based upon a sociological understanding of social capital, in places where more trust, networks, and neighborhood cohesion exist we can expect more adaptive capacity for hazard-related shocks and stressors (Adger, 2003). However, the relationship of social capital with risk perception is not clear-cut and appears to be dependent on the local context. For example, while the study of Babcicky and Seebauer (2017) in the context of Austria argued that social capital may lead to reduced levels of risk perception, Hudson et al. (2020) reported a positive correlation in their case study of a Vietnam region. Moreover, social capital does not guarantee mitigation action (Adeola, 2009; Hawkins and Maurer, 2010).
Increasingly, awareness has grown that vulnerability to hazards is not just limited to the status of biophysical elements and the built environment, but also to the social aspects of the individual, community, or place under consideration (Cutter et al., 2003; Birkmann, 2013). As Cutter et al. (2003) argue, vulnerability is a measure of societal resistance or resilience to hazards (Cutter et al., 2003). How a hazard affects a population depends on hazard exposure as well as to the sensitivity of the population and its ability to respond and recover. This understanding has led to the emergence of social vulnerability, and related social vulnerability indices, as a key concept in hazards research and in many domains of science-policy interface with potential applications for various levels of governance (Fordham et al., 2013).
As a multi-dimensional concept, social vulnerability indices quantify variables underlying susceptibility and capacity to recover, which can aid decision making, resource allocation, and project prioritization (Rufat et al., 2015). Existing metrics such as the Social Vulnerability Index (SoVI®) created by the Hazards and Vulnerability Research Institute at the University of South Carolina; Cutter et al., 2003) and the Centers for Disease Control and Prevention's (CDC) Social Vulnerability Index (SVI) (Flanagan et al., 2018) have increased significantly in flood-related research as of late. Table 1 presents the key concepts and literature sources.
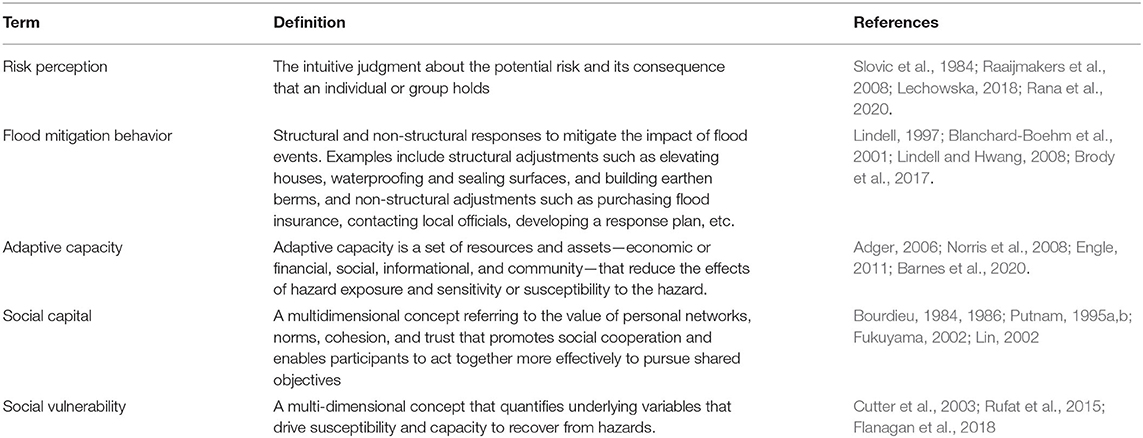
Table 1. Terms and definitions.
Given the existing body of research, we examine how social capital and social vulnerability influence risk perception and adaptive behaviors. We assert that where social capital is strong, households are more adaptive; where social vulnerability is high households are less adaptive. In particular, this work will test the hypotheses that (i) Households with high social capital have lower perceived risk; (ii) Households with high social vulnerability have higher risk perception; (iii) Households with high social capital take more risk mitigation behaviors; and (iv) Households with high social vulnerability take fewer risk mitigation behaviors.
Texas is historically among the states in the USA with the greatest number of flood fatalities (Sharif et al., 2015; Terti et al., 2017) and suffers heavy economic losses annually from floods. Austin, Texas, experiences inland fluvial and pluvial flooding associated with frequent intense rain events that are characteristic of the “flash flood alley” of central Texas. Central Texas has seen an increase in high precipitation and flood events, experiencing three major flooding events between 2013 and 2018. Austin is also one of the fastest-growing cities in the U.S. with a population of just under one million as of 2020 (City of Austin, 2021). Flood risk is amplified by rapid urbanization, population growth, increased commercial and residential development, and subsequent expansion of impervious surfaces, and current and projected precipitation patterns.
The Austin Area Community Survey is an IRB-approved survey conducted as part of the Austin Area Sustainability Indicators project (www.austinindicators.org). Data collection is cross-sectional and randomly sampled in the Austin metropolitan region that includes Travis County, Bastrop County, Burnet County, Caldwell County, Hays County, and Williamson County. Figure 1 shows a map of the study area. The data were collected between September and November of 2020. The survey is part of a longitudinal effort to track sustainability and quality of life indicators in the Austin area and represents the seventh wave of data collection (2004, 2006, 2008, 2010, 2015, and 2018). The 2020 wave of data collection was the first to ask respondents specifically about flood risk perception and mitigation behaviors, therefore only data from the 2020 sample are included in this analysis. In 2020, the sample size for the survey was 1,215 residents. A sample size of 1,215 was the target for the +/– 3% margin of error it provides for the Austin metropolitan area (estimated 2020 population of 2.28 million). Surveys were completed by an external firm, Consumer Research International (CRI), who uses computer-assisted telephone interviewing software to minimize questioning errors, dialing errors, and implement survey skip patterns. CRI uses a list-sample methodology and uses a computer-generated random dial approach calling both landline and mobile phones. The phone surveys were conducted both in English and Spanish. The 2020 survey employed a multi-mode collection process utilizing combination of telephone (75%) and web-based panel procedures (25%) to reach the 1,215 completed surveys. Quotas were imposed to ensure an adequate representation from Hispanic and 18–24-year-old respondents. The average age of all respondents was 48 years old. The survey adheres to methodological and ethical procedures and definitions from the American Association for Public Opinion Research (The American Association for Public Opinion Research, 2016). Reported here is a subset of the total sample who responded in the affirmative of having experienced a flood event in the past 10 years (N = 177). Analysis was conducted using R Studio Version 1.3.959.
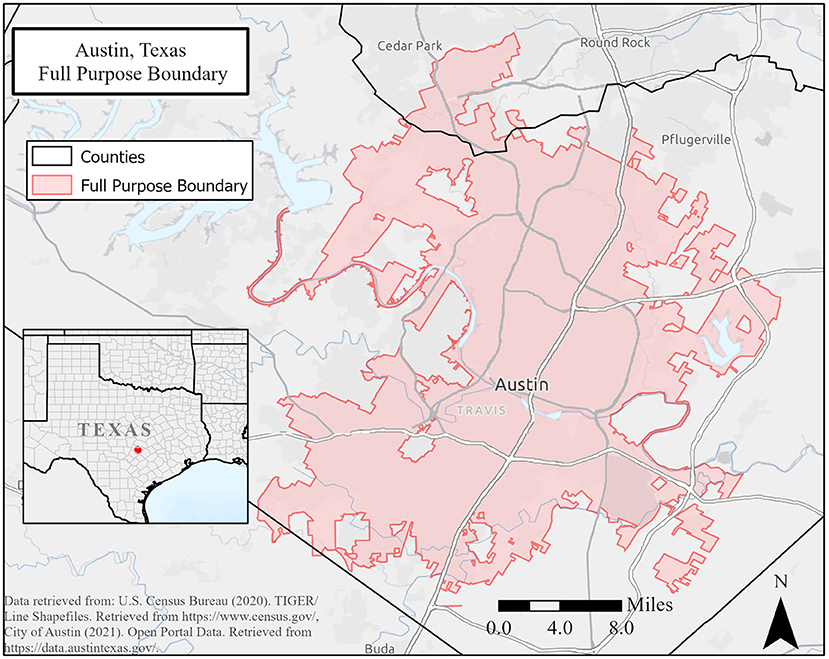
Figure 1. Study area- Austin, Texas, U.S.A.
In the survey, we used a combination of yes/no, Likert scales, and computed factor scores to capture the responses to items in the survey. Individual survey items are either verbatim or slightly adapted questions from existing published research of valid and reliable instruments. Sources for the conceptual framing and dimension definition can be found in Table 1. Sources for individual item verification can be found in the subsequent sections. The exact wording and descriptive statistics for each item are in Table 2. Missing data of survey items (<2%) was at random and treated using a predictive mean matching imputation method. The source data for the social vulnerability index is the Census Bureau's American Community Survey. We merge these two data sources for this analysis based on location.
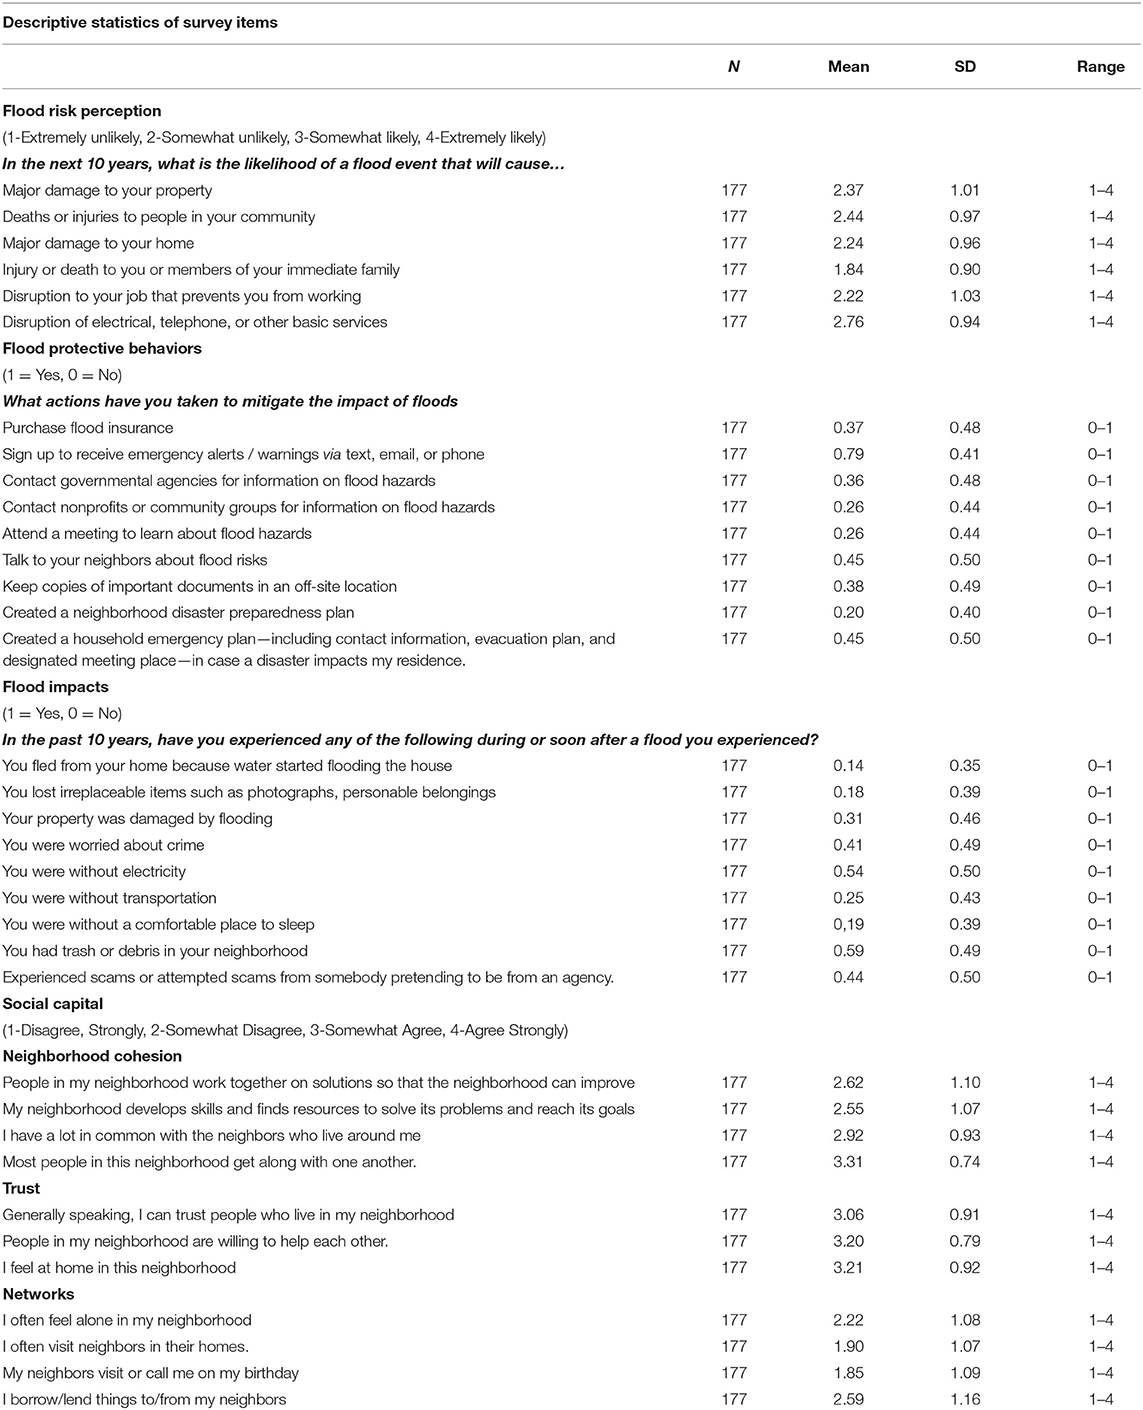
Table 2. Descriptive statistics of survey items.
Flood mitigation behaviors were measured by combining nine survey items to produce a single score that represents the count of non-structural mitigation actions, ranging from 0 to 9. The respondents were asked about the household flood protective measures undertaken to mitigate the impact of floods. The responses for each question were coded zero for no and one for yes. The language of the nine items can be found in Table 2. The Cronbach's Alpha shows good internal consistency for the mitigation behavior score (α = 0.76).
We measure risk perception from six survey items (see Table 2). The measure consists of perceived severity and expected consequences of flooding for the respondent's safety, health, possessions, and quality of life. The responses were measured on a scale of 1–4 (1-Extremely unlikely, 2-Somewhat unlikely, 3-Somewhat likely, 4-Extremely likely). The flood risk perception variable was computed as an arithmetic mean of the six survey items with a range from 1 (lowest) to 4 (highest). The Cronbach's Alpha shows good internal consistency for this risk perception score (α = 0.84).
An individual's reaction to risk partially depends on the frequency and severity of past events. The model also contains a variable to capture the differing intensities of previous exposure. The measure ranging from 0 to 9 was calculated by combining nine survey questions about the impacts experienced during the past flood events. The respondents were asked whether “In the past 10 years, have you experienced any of the following during or soon after a flood you experienced?” and provided with nine possible negative impacts of flooding. The responses were coded zero for no and one for yes. The language of each item can be found in Table 2. The Cronbach's Alpha shows good internal consistency for this risk perception score (α = 0.71).
In this study, we focus primarily on bonding social capital and measure it as three distinct dimensions - trust, cohesion, and personal networks—that form one latent construct of social capital. The specific items come from insights from meta-analysis on the measurement of social capital (Lochner et al., 1999; Friesen, 2018). The responses to individual survey questions were measured on a scale of 1–4 (1-Disagree Strongly, 2-Somewhat Disagree, 3-Somewhat Agree, 4-Agree Strongly) and then analyzed using lavaan package in R (Yves et al., 2017). The neighborhood cohesion variables capture the collaborative relations that contribute to social capital and the network variables that bring together benefits out of interpersonal communications that influence the adaptive capacity of the community. The level of social trust indicates how well these ties of social capital (bonding and bridging) will manifest or express themselves during a hazard. Survey items for each dimension can be found in Table 2 and Figure 2. A confirmatory factor analysis was conducted on the sample to verify that the chosen questions represent the corresponding constructs (see Figure 2).
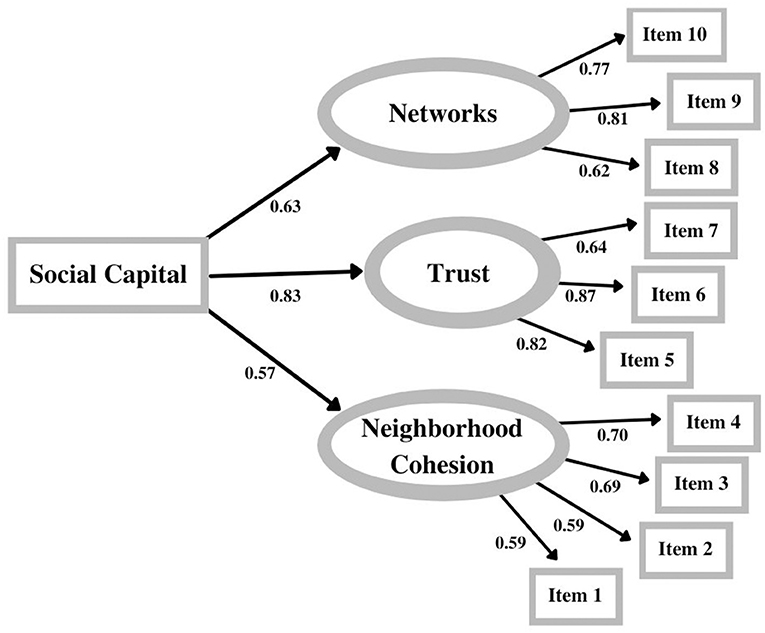
Figure 2. Social capital latent structure.
A social vulnerability index was developed at the census block group level utilizing data from the 2017 ACS 5-Year Estimates. The procedure documented extensively elsewhere (Bixler et al., 2021), uses 18 variables divided into six components (Wealth, Language and Education, Elderly, Housing Status, Social Status, and Gender). The 18 variables and associated loading scores include: median housing value (0.915); median gross rent (0.892); median age (0.658); per capita income (0.86); people per household unit (0.874); percent of the population under five and over 65 (0.859); percent Black or African American (0.666); percent unemployed civilian labor force 16 and older (0.723); percent less than high school education over 25 years old (0.732); percent speaking English as a second language (0.806); percent children living in married-couple families (0.844); percent female (0.877); percent of female workforce participation (0.836); percent housing units with no car (0.559); percent poverty (0.533); percent of households earning over $200,000 annually (0.915); percent Hispanic (0.739); and percent of households receiving social security benefits (0.896).
The 18 variables utilized for the index accounted for 74.48% of the observed variance in social vulnerability across the Austin Area. The cardinality of each component was adjusted so that a higher variable value indicated a higher vulnerability. The numerical composite social vulnerability score for each block group is the sum of the normalized and direction-adjusted values for each variable. This final score was again normalized from 0 to 1 (with one being the most vulnerable) with a mean of 0.52 and a standard deviation of 0.54. Based on the information provided by each survey respondent, coordinates for each household were identified and the corresponding census block group was identified using the R package tigris (Walker, 2016). Each case was then assigned the social vulnerability score for its respective census block group. The distribution of the calculated social vulnerability index by census block groups in the study area is provided in Figure 3.

Figure 3. Distribution of social vulnerability index in study area.
Key demographic information obtained from survey respondents was included in our models. Race/ethnicity was coded into four categories White, Black, Hispanic, and Other. Gender was coded as dichotomous. Annual family income was coded into four levels ranging from < $35,000 to more than $125,000.
We conduct Ordinary Least Squares multiple regression analysis (OLS) to assess the impact of social capital and social vulnerability on flood risk perception and then include flood risk perception with the other predictors on flood mitigation behaviors. Our models explain between 21 and 27% of the variance, which aligns with similar models on flood risk perception (Sjöberg et al., 2004; Babcicky and Seebauer, 2017). Table 3 presents a correlation matrix of the model variables. Variance inflation factor (VIF) scores were computed for coefficients in each of the four models and all values were below 2, indicating the absence of or very little multicollinearity (James et al., 2013).
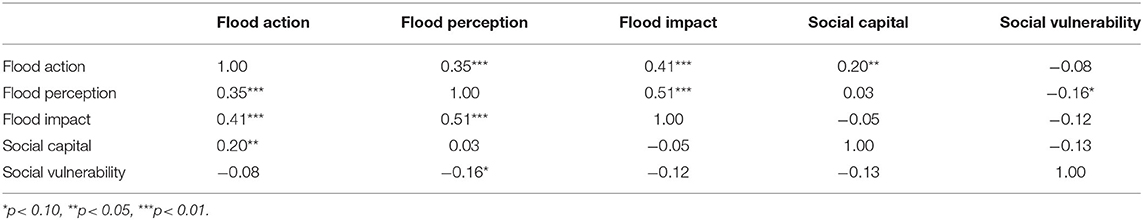
Table 3. Correlation matrix of model variables.
We use multiple linear regression analysis to examine the relationship between the predictors of flood risk perception without social vulnerability (model 1) and with social vulnerability (model 2). Model 3 examines the relationship between predictors plus risk perception on mitigation behaviors (without social vulnerability) and model 4 includes social vulnerability. All models control for gender, race/ethnicity, and income. As shown in Table 4, OLS results show that several independent variables are statistically significant from p < 0.1 to p < 0.001.
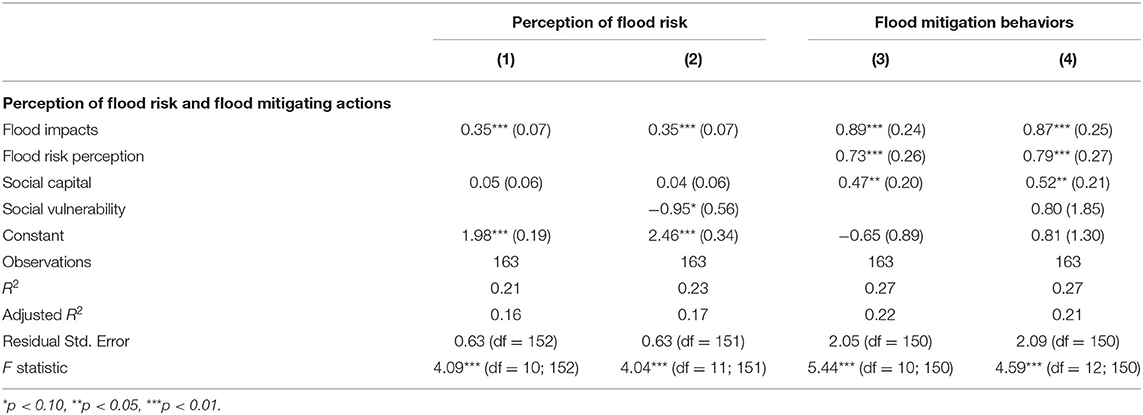
Table 4. OLS regression results.
All models show that previous impacts of floods have a significant and positive effect on risk perception (0.35, p < 0.01) and mitigation behaviors (0.88, p < 0.01), suggesting that risk perceptions (models 1 and 2) and actions (models 3 and 4) are higher among households who have been more severely impacted by flooding than those who have experienced a flood but had little or no impact to themselves, their family, or their belongings.
Both models 3 (0.89, p < 0.01) and 4 (0.87, p < 0.01) show a significant effect of social capital on flood mitigation behaviors while controlling for previous impacts, risk perception, social vulnerability, and socio-demographic characteristics. The effect of social capital on risk perception is small, positive, and statistically insignificant. Flood risk perception also has a positive and statistically significant impact on flood mitigation behaviors when not controlling for social vulnerability (0.73, p < 0.01) and when controlling for social vulnerability (0.79, p < 0.01).
Social vulnerability (H02, model 2) has a large, negative and statistically significant effect on risk perception (−0.95, p < 0.10) and the models show a positive coefficient of social vulnerability on flood mitigation behaviors, although not statistically significant and a high standard error (H04, model 4). We will discuss our interpretation of this below.
Most of the control variables, not reported in Table 4, are not statistically significant except for income on mitigation actions with social vulnerability (model 4). Figure 4 shows the groups means and confidence intervals by income.
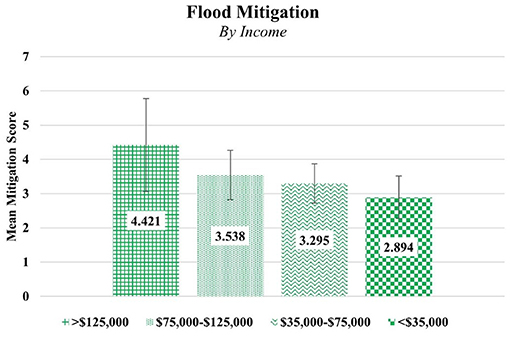
Figure 4. Average mitigation actions by income.
A post-hoc comparison of the analysis of variance [F(3, 32.9) = 2.026, p = 0.112] using a Tukey multiple comparison of means test (Tukey HSD) shows an adjusted p = 0.078 for the difference between the mean mitigation actions for those < $35,000 and more than $125,000. Although in line with other studies, we highlight this point for two reasons. First, the income effect holds even when including social vulnerability (which includes per capita income, poverty, and other wealth related variables as part of the index). Second, to highlight the positive impact of social capital when holding income and social vulnerability constant.
Models 3 and 4 highlight the role of bonding social capital as a factor that increases flood mitigation behaviors. This finding—that social capital is a significant factor predicting how households take actions to mitigate the future impacts of flooding—reflects the positive impacts of neighborhood cohesion, trust, and personal networks. The effect of social capital not only persists but increases when including social vulnerability (model 4). We suggest there may be a positive reinforcing loop between the perception of risk, bonding social capital and mitigation behaviors and that a supportive social and neighborhood context is important for adaptive capacity. Importantly, our research demonstrates a positive and significant effect of social capital on adaptive behavior even when controlling for social vulnerability of a neighborhood.
Few, if any, studies have examined the intersection of social vulnerability (as a geographically delineated aggregated index) and risk perception. We found social vulnerability to have a large, negative, and statistically significant effect on risk perception. That is, as the social vulnerability of your neighborhood increases, the perception of the risk perceived to themselves, their family, or their belongings goes down. This is contrary to what we expected (H02), although our hypothesis was grounded only in the literature suggesting the relationship between lower risk perception among higher-income households.
This is an important finding, particularly in the context of disproportionate exposure among socially vulnerable populations. Social vulnerability has become an important concept for hazards research as a proxy for household and neighborhood sensitivity or susceptibility to flood events. Moreover, there is growing evidence that a disproportionate amount of flood exposure is in urban areas of higher social vulnerability (Tate et al., 2021). This result strongly supports the need for more research at the intersection of social vulnerability and risk perception, given the prominence of social vulnerability in hazards research, yet the limited scholarship at this intersection.
Building adaptive capacity to climate-related hazards is of growing importance in urban U.S. communities. Our findings indicate that strategies that can facilitate and cultivate bonding social capital as part of integrated flood risk policy and governance processes can have positive effects on adaptive behavior. A supportive social context can decrease flood vulnerability by increasing adaptive capacity to flooding events, even when controlling for social vulnerability. There are practical and policy implications as cities design and implement policies that address climate change action and climate justice. A better understanding of how and to what degree bonding social capital increases adaptive capacity would allow for policy interventions to be better targeted and designed in order to produce the largest increase in community resilience.
Furthermore, research into how the social context influences risk perception and adaptation behavior is warranted because neighborhood cohesion and social vulnerability can vary widely from place to place or neighborhood to neighborhood. Our study suggests that these factors are important for a community's ability to prepare and respond to natural hazards. But a greater focus on longitudinal data collection from both social and physical environments will be necessary to evaluate the interplay between interventions that build social capital for adaptive capacity, those that reduce exposure mitigation, and policies and programs that reduce social vulnerability.
There is a growing emphasis on social vulnerability in flood risk governance, however, our study suggests that the intersection of social vulnerability and flood risk perception needs more attention. Individual risk perceptions are important for preparing risk communication strategies and raising awareness in communities (Fuchs et al., 2017), yet little attention has been given to how living in a “socially vulnerable” neighborhood influences the perception of flood risks. This is likely of high importance, particularly in the context of increasing adaptive behaviors among populations who are already at disproportionate exposure to flooding.
The raw data supporting the conclusions of this article will be made available by the authors, without undue reservation.
The studies involving human participants were reviewed and approved by University of Texas Institutional Review Board. Written informed consent for participation was not required for this study in accordance with the national legislation and the institutional requirements.
RB and PP contributed to the conception and design of the study. RB and JJ led the data collection and cleaning. RB and SP performed the statistical analysis. RB, SP, and JJ wrote sections of the manuscript. MP developed the maps. JJ developed the figures based on survey data. PP and MP provided technical and conceptual reviews. All authors contributed to manuscript revision, read, and approved the submitted version.
This work was financially supported by the RGK Center for Philanthropy and Community Service through funding to the Austin Area Sustainability Indicators program; Planet Texas 2050, a research grand challenge at the University of Texas at Austin; The Institute for Science, Technology, and Public Policy at Texas A&M University; the St. David's Foundation, and the Michael and Susan Dell Foundation.
The authors declare that the research was conducted in the absence of any commercial or financial relationships that could be construed as a potential conflict of interest.
All claims expressed in this article are solely those of the authors and do not necessarily represent those of their affiliated organizations, or those of the publisher, the editors and the reviewers. Any product that may be evaluated in this article, or claim that may be made by its manufacturer, is not guaranteed or endorsed by the publisher.
The authors would like to thank Carmen Llanes Pulido and Frances Acuña at Go Austin, Vamos Austin, and Marc Coudert at the Office of Sustainability at the City of Austin for their partnership and support of this research. We also thank Auva Shariatmadari, Undergraduate Research Assistant, and reviewers for their reviews and constructive feedback.
Abid, M., Scheffran, J., Schneider, U. A., and Ashfaq, M. (2015). Farmers' perceptions of and adaptation strategies to climate change and their determinants: the case of Punjab Province, Pakistan. Earth Syst. Dyn. 6, 225–243. doi: 10.5194/esd-6-225-2015
Adeola, F. O. (2009). Katrina cataclysm: does duration of residency and prior experience affect impacts, evacuation, and adaptation behavior among survivors? Environ. Behav. 41, 459–489. doi: 10.1177/0013916508316651
Adger, W. N. (2003). Social capital, collective action, and adaptation to climate change. Econ. Geogr. 79, 387–404. doi: 10.1111/j.1944-8287.2003.tb00220.x
Adger, W. N. (2006). Vulnerability. Glob. Environ. Change 16, 268–281. doi: 10.1016/j.gloenvcha.2006.02.006
Adger, W. N., and Vincent, K. (2005). Uncertainty in adaptive capacity. Comptes Rendus Geosci. 337, 399–410. doi: 10.1016/j.crte.2004.11.004
Babcicky, P., and Seebauer, S. (2017). The two faces of social capital in private flood mitigation: opposing effects on risk perception, self-efficacy and coping capacity. J. Risk Res. 20, 1017–1037. doi: 10.1080/13669877.2016.1147489
Bai, X., Dawson, R. J., Ürge-Vorsatz, D., Delgado, G. C., Barau, A. S., Dhakal, S., et al. (2018). Six research priorities for cities and climate change. Nature 555, 23–25. doi: 10.1038/d41586-018-02409-z
Barnes, M. L., Wang, P., Cinner, J. E., Graham, N. A. J., Guerrero, A. M., Jasny, L., et al. (2020). Social determinants of adaptive and transformative responses to climate change. Nat. Climate Change 10, 823–828. doi: 10.1038/s41558-020-0871-4
Birkholz, S., Muro, M., Jeffrey, P., and Smith, H. M. (2014). Rethinking the relationship between flood risk perception and flood management. Sci. Total Environ. 478, 12–20. doi: 10.1016/j.scitotenv.2014.01.061
Birkmann, J. (2013). “Measuring vulnerability to promote disaster-resilient societies and to enhance adaptation: conceptual frameworks and definitions” in Measuring Vulnerability to Natural Hazards: Towards Disaster Resilient Societies, 2nd Edn, ed J. Birkmann (Tokyo: United Nations University Press), 9–79.
Bixler, R. P., Lieberknecht, K., Leite, F., Felkner, J., Oden, M., Richter, S. M., et al. (2019). An observatory framework for metropolitan change: understanding urban social–ecological–technical systems in Texas and Beyond. Sustainability 11:3611. doi: 10.3390/su11133611
Bixler, R. P., Yang, E., Richter, S. M., and Coudert, M. (2021). Toward co-production for urban resilience: a 436multi-hazard approach in Austin, Texas. Int. J. Hazard Risk Reduct.
Blanchard-Boehm, R. D., Berry, K. A., and Showalter, P. S. (2001). Should flood insurance be mandatory? Insights in the wake of the 1997 new year's day flood in reno-sparks, Nevada. Appl. Geogr. 21, 199–221. doi: 10.1016/S0143-6228(01)00009-1
Bourdieu, P. (1984). Distinction a Social Critique of the Judgement of Taste. In Inequality Classic Readings in Race, Class, and Gender, 2nd Edn. London: Routledge.
Bourdieu, P. (1986). The Forms of Capital. In Handbook of Theory and Research for the Sociology of Education (New York, NY: Greenwood Press), 241–258. Available online at: https://www.marxists.org/reference/subject/philosophy/works/fr/bourdieu-forms-capital.htm (accessed June 19, 2021).
Brody, S. D., Kang, J. E., and Bernhardt, S. (2010). Identifying factors influencing flood mitigation at the local level in texas and florida: the role of organizational capacity. Nat. Hazard. 52, 167–184. doi: 10.1007/s11069-009-9364-5
Brody, S. D., Lee, Y., and Highfield, W. E. (2017). Household adjustment to flood risk: a survey of coastal residents in Texas and Florida, United States. Disasters 41, 566–586. doi: 10.1111/disa.12216
Browne, M. J., and Hoyt, R. E. (2000). The demand for flood insurance: empirical evidence. J. Risk Uncertainty 20, 291–306. doi: 10.1023/A:1007823631497
Bubeck, P., Botzen, W. J. W., and Aerts, J. C. J. H. (2012). A review of risk perceptions and other factors that influence flood mitigation behavior. Risk Anal. 32, 1481–1495. doi: 10.1111/j.1539-6924.2011.01783.x
Burton, I., Kates, R. W., and White, G. F. (1993). The Environment As Hazard, 2nd Edn. New York, NY: Guilford Press. Available online at: https://www.routledge.com/The-Environment-As-Hazard/Burton-Kates-White/p/book/9780898621594 (accessed June 21, 2021).
City of Austin (2021). City Launches a New Dashboard with 2020 Population Estimates for the City and Austin-Metro Area. AustinTexas.Gov. May 28, 2021. Available online at: https://www.austintexas.gov/news/city-launches-new-dashboard-2020-population-estimates-city-and-austin-metro-area (accessed July 24, 2021).
Collins, T. W. (2008). What influences hazard mitigation? Household decision making about wildfire risks in Arizona's White Mountains. Professional Geogr. 60, 508–526. doi: 10.1080/00330120802211737
Cutter, S. L., Boruff, B. J., and Shirley, W. L. (2003). Social vulnerability to environmental hazards. Soc. Sci. Quart. 84, 242–261. doi: 10.1111/1540-6237.8402002
Daramola, A. Y., Oni, O. T., Ogundele, O., and Adesanya, A. (2016). Adaptive capacity and coping response strategies to natural disasters: a study in Nigeria. Int. J. Disast. Risk Reduct. 15, 132–147. doi: 10.1016/j.ijdrr.2016.01.007
Engle, N. L. (2011). Adaptive capacity and its assessment. Glob. Environ. Change Spec. Issue Polit. Pol. Carbon Capt. Storage 21, 647–656. doi: 10.1016/j.gloenvcha.2011.01.019
Few, R. (2003). Flooding, vulnerability and coping strategies: local responses to a global threat. Progr. Dev. Stud. 3, 43–58. doi: 10.1191/1464993403ps049ra
Flanagan, B. E., Hallisey, E. J., Adams, E., and Lavery, A. (2018). Measuring community vulnerability to natural and anthropogenic hazards: the centers for disease control and prevention's social vulnerability index. J. Environ. Health 80, 34–36.
Fordham, M., Lovekamp, W. E., Thomas, D. S. K., and Phillips, B. D. (2013). “Understanding social vulnerability,” in Social Vulnerability to Disasters, Second Edition, eds D. Thomas, B. Phillips, W. Lovekamp, and A. Fothergill (Boca Raton, FL: Taylor & Francis), 1–32.
Friesen, M. (2018). Navigating Social Capital Scholarship. Cardus: Social Cities. Available online at: https://www.cardus.ca/research/social-cities/reports/navigating-social-capital-scholarship/ (accessed July 26, 2021).
Fuchs, S., Karagiorgos, K., Kitikidou, K, Maris, F, Paparrizos, S, and Thaler, T. (2017). Flood risk perception and adaptation capacity: a contribution to the socio-hydrology debate. Hydrol. Earth Syst. Sci. 21, 3183–3198. doi: 10.5194/hess-21-3183-2017
Fukuyama, F. (2002). Social capital and development: the coming agenda. SAIS Rev. 22, 23–37. doi: 10.1353/sais.2002.0009
Gallopín, G. C. (2006). Linkages between vulnerability, resilience, and adaptive capacity. Glob. Environ. Change Resilience Vulnerabil. Adapt. 16, 293–303. doi: 10.1016/j.gloenvcha.2006.02.004
Grothmann, T., and Reusswig, F. (2006). People at risk of flooding: why some residents take precautionary action while others do not. Nat. Hazards 38, 101–120. doi: 10.1007/s11069-005-8604-6
Harrison, J. L., Montgomery, C. A., and Bliss, J. C. (2016). Beyond the monolith: the role of bonding, bridging, and linking social capital in the cycle of adaptive capacity. Soc. Nat. Resourc. 29, 525–539. doi: 10.1080/08941920.2015.1103389
Hawkins, R. L., and Maurer, K. (2010). Bonding, bridging and linking: how social capital operated in New Orleans following hurricane katrina. Br. J. Soc. Work 40, 1777–1793. doi: 10.1093/bjsw/bcp087
Hirabayashi, Y., Mahendran, R., Koirala, S., Konoshima, L., Yamazaki, D., Watanabe, S., et al. (2013). Global flood risk under climate change. Nat. Climate Change 3, 816–821. doi: 10.1038/nclimate1911
Hudson, P., Hagedoorn, L., and Bubeck, P. (2020). Potential linkages between social capital, flood risk perceptions, and self-efficacy. Int. J. Disast. Risk Sci. 11, 251–262. doi: 10.1007/s13753-020-00259-w
Hung, H.-C. (2009). The attitude towards flood insurance purchase when respondents' preferences are uncertain: a fuzzy approach. J. Risk Res. 12, 239–258. doi: 10.1080/13669870802497702
Jabeen, H., Johnson, C., and Allen, A. (2010). Built-in resilience: learning from grassroots coping strategies for climate variability. Environ. Urban. 22, 415–431. doi: 10.1177/0956247810379937
James, G., Witten, D., Hastie, T., and Tibshirani, R. (2013). An Introduction to Statistical Learning: With Applications in R. Berlin: Springer Science & Business Media.
Kellens, W., Zaalberg, R., Neutens, T., Vanneuville, W., and Maeyer, P. D. (2011). An analysis of the public perception of flood risk on the belgian coast. Risk Anal. 31, 1055–1068. doi: 10.1111/j.1539-6924.2010.01571.x
Kuang, D., and Liao, K.-H. (2020). Learning from floods: linking flood experience and flood resilience. J. Environ. Manag. 271:111025. doi: 10.1016/j.jenvman.2020.111025
Kunreuther, H., Wachter, S., Kousky, C., and Lacour-Little, M. (2018). Flood Risk and the U.S. Housing Market. Penn Institute of Urban Research and Wharton Risk Managment and Decision Processes Center, Working Paper. Available online at: https://penniur.upenn.edu/uploads/media/Flood_Risk_and_the_U.S_._Housing_Market_10-30_.pdf (accessed April 06, 2021).
Lechowska, E. (2018). What determines flood risk perception? a review of factors of flood risk perception and relations between its basic elements. Nat. Hazards 94, 1341–1366. doi: 10.1007/s11069-018-3480-z
Lin, N. (2002). Social Capital: A Theory of Social Structure and Action. Cambridge: Cambridge University Press.
Lindell, M. K. (1997). Adoption and implementation of hazard adjustments. Int. J. Mass Emerg. Disast. 15, 327–453. Available online at: http://ijmed.org/issues/15/3/ (accessed June 3, 2021).
Lindell, M. K., and Hwang, S. N. (2008). Households' perceived personal risk and responses in a multihazard environment. Risk Anal. 28, 539–556. doi: 10.1111/j.1539-6924.2008.01032.x
Lindell, M. K., and Prater, C. S. (2000). Household adoption of seismic hazard adjustments: a comparison of residents in two states. Int. J. Mass Emerg. Disast. 18, 317–338. Available online at: http://ijmed.org/articles/312/ (accessed June 19, 2021).
Lochner, K., Kawachi, I., and Kennedy, B. P. (1999). Social capital: a guide to its measurement. Health Place 5, 259–270. doi: 10.1016/S1353-8292(99)00016-7
Messner, F., and Meyer, V. (2006). “Flood damage, vulnerability and risk perception – challenges for flood damage research,” in Flood Risk Management: Hazards, Vulnerability and Mitigation Measures, NATO Science Series, eds J. Schanze, E. Zeman, and J. Marsalek (Dordrecht: Springer Netherlands), 149–167. doi: 10.1007/978-1-4020-4598-1_13
Michel-Kerjan, E., and Kunreuther, H. (2011). Redesigning flood insurance. Science 333, 408–409. doi: 10.1126/science.1202616
Myhre, G., Alterskjær, K., Stjern, C. W., Hodnebrog, Ø., Marelle, L., Samset, B. H., et al. (2019). Frequency of extreme precipitation increases extensively with event rareness under global warming. Sci. Rep. 9:16063. doi: 10.1038/s41598-019-52277-4
National Academies of Sciences Engineering (2019). Framing the Challenge of Urban Flooding in the United States. Washington, DC: The National Academies Press. doi: 10.17226/25381
Norris, F. H., Stevens, S. P., Pfefferbaum, B., Wyche, K. F., and Pfefferbaum, R. L. (2008). Community resilience as a metaphor, theory, set of capacities, and strategy for disaster readiness. Am. J. Commun. Psychol. 41, 127–150. doi: 10.1007/s10464-007-9156-6
Papalexiou, S. M., and Montanari, A. (2019). Global and regional increase of precipitation extremes under global warming. Water Resourc. Res. 55, 4901–4914. doi: 10.1029/2018WR024067
Pelling, M., and High, C. (2005). Understanding adaptation: what can social capital offer assessments of adaptive capacity? Glob. Environ. Change 15, 308–319. doi: 10.1016/j.gloenvcha.2005.02.001
Portes, A. (1998). Social capital: its origins and applications in modern sociology. Ann. Rev. Sociol. 24, 1–24. doi: 10.1146/annurev.soc.24.1.1
Putnam, R. D. (1995a). Bowling alone: America's declining social capital. J. Democracy 6, 65–78. doi: 10.1353/jod.1995.0002
Putnam, R. D. (1995b). Tuning in, tuning out: the strange disappearance of social capital in America. Polit. Sci. Polit. 28:664.
Raaijmakers, R., Krywkow, J., and van der Veen, A. (2008). Flood risk perceptions and spatial multi-criteria analysis: an exploratory research for hazard mitigation. Nat. Hazards 46, 307–322. doi: 10.1007/s11069-007-9189-z
Rana, I. A., Jamshed, A., Younas, Z. I., and Bhatti, S. S. (2020). Characterizing flood risk perception in urban communities of Pakistan. Int. J. Disast. Risk Reduct. 46:101624. doi: 10.1016/j.ijdrr.2020.101624
Rufat, S., Tate, E., Burton, C. G., and Maroof, A. S. (2015). Social vulnerability to floods: review of case studies and implications for measurement. Int. J. Disast. Risk Reduct. 14, 470–486. doi: 10.1016/j.ijdrr.2015.09.013
Shah, A. A., Ye, J., Abid, M., and Ullah, R. (2017). Determinants of flood risk mitigation strategies at household level: a case of Khyber Pakhtunkhwa (KP) Province, Pakistan. Nat. Hazards 88, 415–430. doi: 10.1007/s11069-017-2872-9
Sharif, H. O., Jackson, T. L., Hossain, M. M., and Zane, D. (2015). Analysis of flood fatalities in Texas. Nat. Hazards Rev. 16:4014016. doi: 10.1061/(ASCE)NH.1527-6996.0000145
Siegrist, M., and Gutscher, H. (2008). Natural hazards and motivation for mitigation behavior: people cannot predict the affect evoked by a severe flood. Risk Anal. 28, 771–778. doi: 10.1111/j.1539-6924.2008.01049.x
Sjöberg, L., Bjørg-Elin, M., and Torbjørn, R. (2004). Risk Perception. An Evaluation of the Psychometric, 84. Rotunde publikasjoner. Available online at: https://www.yumpu.com/en/document/read/31421344/explaining-risk-perception-an-evaluation-of-the-psychometric (accessed June 13, 2021).
Slovic, P., Fischhoff, B., and Lichtenstein, S. (1984). Behavioral decision theory perspectives on risk and safety. Acta Psychol. 56, 183–203. doi: 10.1016/0001-6918(84)90018-0
Smith, A. B. (2021). 2020 U.S. Billion-Dollar Weather and Climate Disasters in Historical Context. NOAA Climate.Gov. Available online at: https://www.climate.gov/news-features/blogs/beyond-data/2020-us-billion-dollar-weather-and-climate-disasters-historical (accessed April 19, 2021).
Takao, K., Motoyoshi, T., Sato, T., Fukuzondo, T., Seo, K., and Ikeda, S. (2004). Factors determining residents' preparedness for floods in modern megalopolises: the case of the Tokai Flood Disaster in Japan. J. Risk Res. 7, 775–787. doi: 10.1080/1366987031000075996
Tate, E., Rahman, M. A., Emrich, C. T., and Sampson, C. C. (2021). Flood exposure and social vulnerability in the United States. Nat. Hazards 106, 435–457. doi: 10.1007/s11069-020-04470-2
Terpstra, T. (2011). Emotions, trust, and perceived risk: affective and cognitive routes to flood preparedness behavior. Risk Anal. 31, 1658–1675. doi: 10.1111/j.1539-6924.2011.01616.x
Terpstra, T., and Lindell, M. K. (2013). Citizens' perceptions of flood hazard adjustments: an application of the protective action decision model. Environ. Behav. 45, 993–1018. doi: 10.1177/0013916512452427
Terti, G., Ruin, I., Anquetin, S., and Gourley, J. J. (2017). A situation-based analysis of flash flood fatalities in the United States. Bullet. Am. Meteorol. Soc. 98, 333–335. doi: 10.1175/BAMS-D-15-00276.1
The American Association for Public Opinion Research (2016). Standard Definitions: Final Dispositions of Case Codes and Outcome Rates for Surveys, 9th Edn. Standard Definitions Report. AAPOR. Available online at: https://www.aapor.org/AAPOR_Main/media/publications/Standard-Definitions20169theditionfinal.pdf (accessed June 21, 2021).
Wachinger, G., Renn, O., Begg, C., and Kuhlicke, C. (2013). The risk perception paradox—implications for governance and communication of natural hazards. Risk Anal. 33, 1049–1065. doi: 10.1111/j.1539-6924.2012.01942.x
Walker, K. (2016). Tigris: an R package to access and work with geographic data from the US Census Bureau. R J. 8, 231–242. doi: 10.32614/RJ-2016-043
Weinstein, N. D. (1989). Effects of personal experience on self-protective behavior. Psychol. Bullet. 105, 31–50.
Wilson, R. S., Herziger, A., Hamilton, M., and Brooks, J. S. (2020). From incremental to transformative adaptation in individual responses to climate-exacerbated hazards. Nat. Climate Change 10, 200–208. doi: 10.1038/s41558-020-0691-6
Wisner, B., Blaikie, P., Blaikie, P. M., Cannon, T., and Davis, I. (2004). At Risk: Natural Hazards, People's Vulnerability and Disasters. Second Edition. London: Routledge.
Woolcock, M. (2001). The place of social capital in understanding social and economic outcomes. Can. J. Pol. Res. 2, 11–17. http://www.socialcapital.net/docs/The%20Place%20of%20Social%20Capital.pdf (accessed June 3, 2021).
Yves, A., Oberski, D., Byrnes, J., VanBrabant, L., Savalei, V., Merkle, E., et al. (2017). Package Lavaan. Available online at: http://www.jstatsoft.org/v48/i02/ (accessed July 26, 2021).
Keywords: flood mitigation, risk perception, social capital, social vulnerability, flood risk governance
Citation: Bixler RP, Paul S, Jones J, Preisser M and Passalacqua P (2021) Unpacking Adaptive Capacity to Flooding in Urban Environments: Social Capital, Social Vulnerability, and Risk Perception. Front. Water 3:728730. doi: 10.3389/frwa.2021.728730
Received: 22 June 2021; Accepted: 02 August 2021;
Published: 27 August 2021.
Edited by:
Irfan Ahmad Rana, National University of Sciences and Technology (NUST), PakistanCopyright © 2021 Bixler, Paul, Jones, Preisser and Passalacqua. This is an open-access article distributed under the terms of the Creative Commons Attribution License (CC BY). The use, distribution or reproduction in other forums is permitted, provided the original author(s) and the copyright owner(s) are credited and that the original publication in this journal is cited, in accordance with accepted academic practice. No use, distribution or reproduction is permitted which does not comply with these terms.
*Correspondence: R. Patrick Bixler, cnBiaXhsZXJAdXRleGFzLmVkdQ==
Disclaimer: All claims expressed in this article are solely those of the authors and do not necessarily represent those of their affiliated organizations, or those of the publisher, the editors and the reviewers. Any product that may be evaluated in this article or claim that may be made by its manufacturer is not guaranteed or endorsed by the publisher.
Research integrity at Frontiers
Learn more about the work of our research integrity team to safeguard the quality of each article we publish.