 Jaclyn E. Smith
 Jennifer L. Wolny
 Matthew D. Stocker
 Robert L. Hill
 Yakov A. Pachepsky1
95% of researchers rate our articles as excellent or good
Learn more about the work of our research integrity team to safeguard the quality of each article we publish.
Find out more
ORIGINAL RESEARCH article
Front. Water , 01 November 2021
Sec. Environmental Water Quality
Volume 3 - 2021 | https://doi.org/10.3389/frwa.2021.724025
This article is part of the Research Topic Functional Diversity of Aquatic Microorganisms and Their Roles in Water Quality View all 10 articles
Phytoplankton functional groups and their influence on water quality have been studied in various types of water bodies but have yet to be studied in agricultural irrigation ponds. Freshwater sources (e.g., lakes, rivers, and reservoirs) have been previously shown to exhibit high spatial and temporal variability in phytoplankton populations. Improvements in the monitoring of phytoplankton populations may be achieved if patterns of stable spatial variability can be found in the phytoplankton populations through time. The objective of this work was to determine if temporally stable spatial patterns in phytoplankton communities could be detected in agricultural irrigation ponds using a functional group approach. The study was performed at two working agricultural irrigation ponds located in Maryland, USA over two summer sampling campaigns in 2017 and 2018. Concentrations of four phytoplankton groups, along with sensor-based and fluorometer based water quality parameters were measured. Temporal stability was assessed using mean relative differences between measurements in each location and averaged measurements across ponds on each sampling date. Temporally stable spatial patterns of three phytoplankton functional groups were found for both ponds over the two sampling seasons. Both ponds had locations where specific phytoplankton functional group concentrations were consistently higher or lower than the pond's average concentration for each sampling date. Zones of consistently higher or lower than average concentrations were associated with flow conditions, pond morphology, and human activities. The existence of temporally stable patterns of phytoplankton functional group concentrations can affect the outcome of a water quality assessment and should be considered in water quality monitoring designs.
Phytoplankton are commonly found members of microbial populations within many diverse water bodies including agricultural irrigation ponds. These primary producers are an important component of the food web within aquatic ecosystems. Previous research has shown that phytoplankton may be an effective bio-indicator of water quality and also a reflection of ecosystem health (Wang et al., 2015; Su et al., 2017; Adloff et al., 2018).
Freshwater phytoplankton populations are typically divided into functional groups based on morphology, physiology, adaptations, and ecological attributes (Reynolds et al., 2002; Varol, 2019; Jin et al., 2020). Three major phytoplankton functional groups are diatoms (Bacillariophyta), green algae (Chlorophyta), and cyanobacteria (Cyanophyta; also commonly referred to as blue-green algae), each of which possess different qualities that may influence and be indicative of water quality (Shi et al., 2012, 2015; Xiao et al., 2013). The richness and uniformity of the phytoplankton community may also indicate different water properties and a range of water qualities from pristine to degraded water quality conditions. Phytoplankton communities have been utilized as an indication of the trophic state of a water body (Hu et al., 2012; Ren et al., 2016; Rimet and Druart, 2018), to confirm eutrophication (Ren et al., 2016; Varol, 2019), pollution and/or other anthropogenic effects (Shi et al., 2015; Feki-Sahnoun et al., 2018). The use of phytoplankton functional groups in more complex assessments, such as understanding biogeochemical models (Shimoda and Arhonditsis, 2016) and in the development of remote sensing technologies (Wolanin et al., 2016; Vandermeulen et al., 2017; Xi et al., 2017) continues to be a growing research area in large water bodies or on broad scales, but less is known about the temporal stability of these groups on smaller scale irrigation water systems (e.g., irrigation ponds, retention ponds, and aquaculture ponds).
Agricultural irrigation water has been shown to play a substantial role in the microbial contamination of fresh produce and foodborne illness outbreaks (World Health Organization, 2008; Uyttendaele et al., 2015; Jongman and Korsten, 2018). Certain groups of phytoplankton can form large proliferations or “blooms” and release toxins into the environment (Wood, 2016; Bouma-Gregson et al., 2017) which can be biotransported into the food supply (Bittencourt-Oliveira et al., 2016; Buratti et al., 2017). This presents both environmental and human health risks. Monitoring of irrigation water quality is important to avoid the transport of degraded and potentially contaminated waters to nearby crops.
Research on phytoplankton communities has previously been conducted across numerous water body types to determine spatial and temporal population trends, assess species composition, and community responses to changes in water quality. Within the Chesapeake Bay watershed, long-term phytoplankton data sets have been used to augment and support water quality guidelines in lakes, rivers, and estuaries (Marshall et al., 2006, 2009; Marshall, 2013, 2014; Hernandez Cordero et al., 2020), but not specifically for agricultural irrigation waters.
Although phytoplankton may be used as water quality bio-indicators, attempts to integrate phytoplankton community assessments to agricultural irrigation water quality seemingly have been limited to laboratory studies (DeLorenzo et al., 2002). The objective of this study was to determine if temporally stable spatial patterns of phytoplankton functional groups exist within temperate agricultural irrigation ponds and if these groups could be correlated to easily measured water quality parameters which could lead to potential improvements in on-farm water quality monitoring and aid with the prediction and mitigation of food-safety issues.
Sampling was conducted at two working farms for two consecutive growing seasons (2017–2018). These ponds were chosen because water was routinely drawn for irrigation of co-located crop fields. Each pond was sampled six times during the May through October growing season, with an exception to Pond 2 in 2017 with only five sampling dates. For 2017 sampling occurred from May to August and for 2018 from June to October. This resulted in a total of 276 and 242 phytoplankton samples collected for Pond 1 and Pond 2, respectively. Both ponds were located within a one hour drive from the USDA-ARS laboratory, so samples were maintained at ambient temperature and processed the same day as collection.
Pond 1 is a 1.01-acre man-made embankment pond located in Germantown, MD, USA with an average depth of 2.7 m (Figure 1-P1). Vegetation surrounding Pond 1 embankments consisted of deciduous trees and shrubs along the northern and eastern banks with the remaining embankments having a grass cover. The pond is surrounded by crop fields. When the water level in this pond gets low, the farm operators will occasionally pump water into Pond 1 from another pond which is stream-fed. The inflow and outflows are both located near sampling location 15. The irrigation pump intake is located near location 12 and is ~2-3 feet below the water's surface. The photic zone in Pond 1, as determined by Secchi depth, averages 0.8 m. In 2017 and 2018, the algicide copper sulfate was commonly used to treat the water in Pond 1.
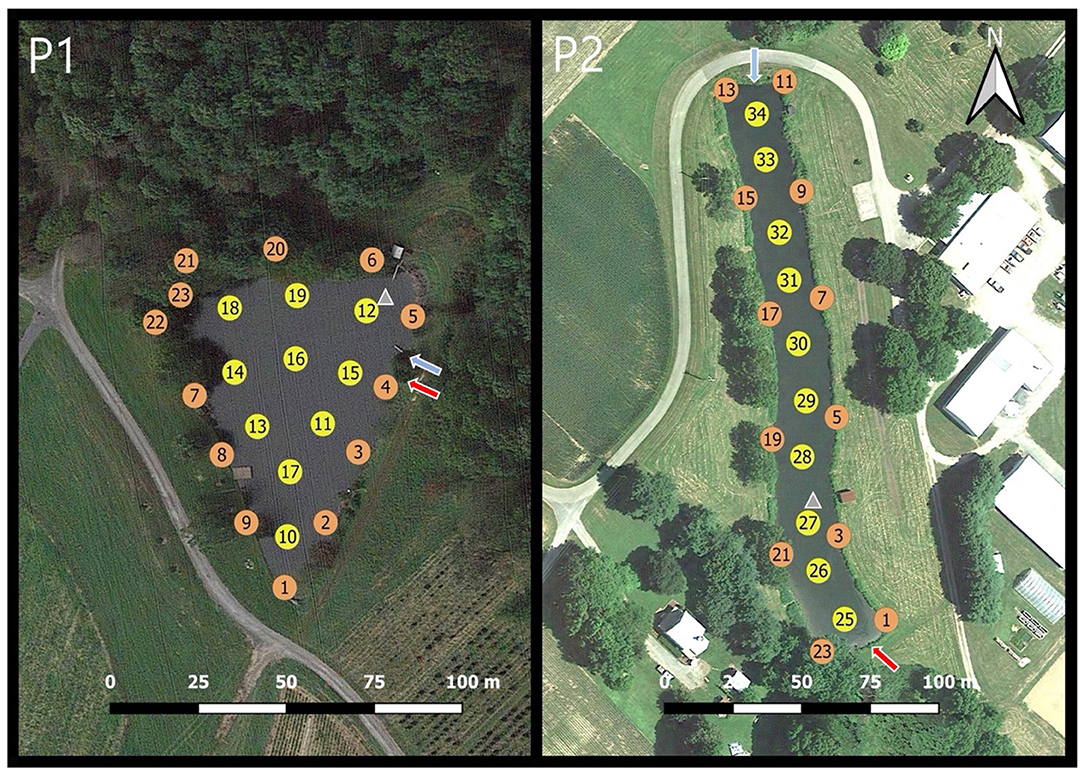
Figure 1. Sampling locations for both Pond 1 (P1) and Pond 2 (P2). Station location number is stated inside the circle. Yellow circles indicate interior water sampling locations and orange circles indicate nearshore sampling locations. Blue arrows represent inflow points and outflows are represented by red arrows. Irrigation intake is represented by a gray triangle.
Pond 2 is located at the University of Maryland Wye Research Center in Wye Mills, MD, USA (Figure 1-P2). This pond is a 1.05-acre excavated pond with an average depth of 2.7 m and most of the bank areas are covered with grass and dense shrubs. Large trees are also present along the perimeter but are ~20 m from the water's edge. This pond is surrounded by crop fields, farm buildings, and one residential property. In March of each year, the surrounding crop fields receive chemical fertilizers, but no animal manures are applied. This pond is primarily fed through rainfall which typically enters through an ephemeral creek that leads into a culvert near location 12. This culvert tends to have a substantial inflow only when precipitation has recently occurred. On the south end of the pond, there is a water-level dependent outflow drain near location 24. The irrigation pump intake is near location 27 and is ~2-3 feet below the water's surface. The depth of the photic zone, determined by Secchi depth, for Pond 2 averages 0.5 m.
Pond 1 had 23 sampling locations and Pond 2 had 22 sampling locations (Figure 1). Surface water samples were taken at a depth of 0–15 cm. Nearshore samples were taken with a 500 mL hand grab sampler at ~1.5 m from the shoreline. Interior samples were taken from a boat with GPS tracking used to provide consistency of sampling locations between different sampling dates. Sampling locations remained the same for every sampling date over both years. After collection, samples were immediately placed into a cooler without ice to help maintain the original ambient water temperature. Samples were then transported to the lab for analysis.
In-situ water quality measurements were taken concurrently with sample collection using a YSI Exo-2 sonde (YSI Inc., Yellow Springs, OH). The YSI sonde was used to measure temperature (°C), dissolved oxygen (DO mg L−1), pH, fluorescent dissolved organic matter (f DOM, RFU), chlorophyll-a (CHL YSI, RFU), phycocyanin (Phyco YSI, RFU), and turbidity (NTU). A Secchi disk was used to measure water transparency, approximating the photic zone depth (m). Precipitation data was obtained from weather stations located within 3 km of each pond.
Water samples were measured for colored dissolved organic matter (CDOM, μg L−1), in-vivo or whole-cell chlorophyll-a (CHL RFU, RFU), and phycocyanin (Phyco LAB, μg L−1) using an Aquafluor fluorometer (Turner Designs, San Jose, CA). Samples were also processed and measured for extracted chlorophyll (CHL EXT, μg L−1) following EPA method 445 (EPA, 1997) using an Aquafluor fluorometer. For the extraction process, ~100 mL of pond water was vacuum filtered using 0.7 μm glass fiber filters (Whatman, Maidstone, United Kingdom) and steeped in a 90% acetone and 10% deionized water solution overnight at 4°C before being analyzed with the fluorometer. A subsample of ~50 mL was taken for phytoplankton identification and enumeration. This subsample was preserved with Lugol's iodine solution at a 1% final concentration. Samples were stored at 4°C and in the dark to prevent phytoplankton cell degradation until microscopic analysis could be completed.
During examination and enumeration of the preserved phytoplankton samples each phytoplankton was identified to the lowest taxon possible using John et al. (2011) and Bellinger and Sigee (2015). To assess the phytoplankton community at the group level species data was recorded as cell abundance (cells L−1) and then classified into one of four major phytoplankton functional groups: diatoms, dinoflagellates, chlorophytes (including motile and non-motile species), and cyanobacteria as done for corresponding long-term, regional datasets (Lamlou, 1977; Marshall et al., 2006; Marshall, 2013, 2014). Because of the infrequent occurrence of dinoflagellate species in both ponds over the 2 years these data were not included in the final analysis but are available in Supplementary Figure 1. The cell abundance data for potentially toxic cyanobacteria species were compared with cell abundances presented in national and regional action guidelines (VDH, 2015; EPA, 2019).
All phytoplankton samples were examined using a Nikon Ts2R inverted microscope (Nikon Instruments Inc., Melville, NY) and a modified Utermöhl method as described in Marshall and Alden (1990). A 2- or 3-mL Lugol's iodine preserved sample was pipetted into a chambered covered glass slide (Thermo Scientific, Rochester, NY), and allowed to settle for 30 min to 1 h. After settling, enumeration started in the upper left-hand corner of the chambered slide. After the first frame was counted, the next frame would be moved down and to the right to avoid frame overlap and possible double counting of algal cells. This movement of the field of view created a diagonal pattern across the cover glass slide. The frames were counted in this pattern until either a 200-cell minimum or 20 frames were examined.
To assess spatio-temporal stability of phytoplankton functional groups, mean relative difference method (MRD) was applied. The mean relative difference indicates how an individual location compares to the pond average over multiple sampling dates and reveals areas that are consistently higher or lower than the pond's average for a measured parameter. This method follows those reported in other spatial pattern studies (Pachepsky et al., 2017; Stocker et al., 2018). The relative difference RDij between the observation of variable x at location i at time j (xij), and the spatial average of x at the same time (< x>j), is defined as:
The MRD for location i then becomes
Where Nt is the number of sampling days, and i = 1, 2, …, Ni, where Ni is the total number of locations.
The coefficient of variation (CV) was computed for each phytoplankton functional group for each date and pond. The calculation for CV is defined as:
Where σij is the population standard deviation of phytoplankton functional group i on sampling date j and μij is the population mean of phytoplankton functional group i on sampling date j.
Mean relative differences and Spearman rank correlations were computed in RStudio. Correlations were considered moderate if r ≥ 0.400 (p-values, P1 = 0.059 P2 = 0.065) and considered strong if r ≥ 0.600 (p-values, P1 < 0.001 P2 < 0.001). Sigmaplot v. 13 (SYSTAT, Chicago, IL, USA) and QGIS (OSGeo, Switzerland) were used to create visual representations of the data.
Daily ambient air temperature and precipitation data for both ponds and years are displayed in Figure 2. In 2017, there was an increase in the air temperatures at both ponds from May to July. In 2018, the initial increase in temperature was less pronounced than in 2017. Pond 1 experienced more rainfall in 2018 compared to 2017. Information on the number of days following the last rainfall event from sampling dates and total rainfall accumulations may be seen in Supplementary Table 1. Over the two years, sampling at Pond 1 was performed six times with a rainfall event occurring the day before sampling, three times with a rainfall event occurring one to three days before sampling, and three times when a rainfall event was four or more days before sampling. At Pond 2, sampling was done twice with a rainfall event occurring the day before sampling, six times with a rainfall event occurring one to three days before sampling, and three times with a rainfall event occurring four or more days before sampling. Major precipitation events (>6 cm) at Pond 1 occurred on Jul-28-17 and Jul-21-18 with daily rainfall accumulations of 10.04 and 14.10 cm, respectively. Sampling near both major precipitation dates was avoided, and sampling was not conducted for three days following a major event. At Pond 2, major precipitation events occurred on Jul-28-17, Jul-29-17, Aug-7-17, and Jul-21-18 with daily rainfall accumulations of 8.28, 8.40, 16.76, and 8.03 cm, respectively. Sampling was avoided within three days of these rainfall events with the exception of the Aug-7-17 event. Sampling occurred on Aug-8-17 which was one day following a major rainfall event.
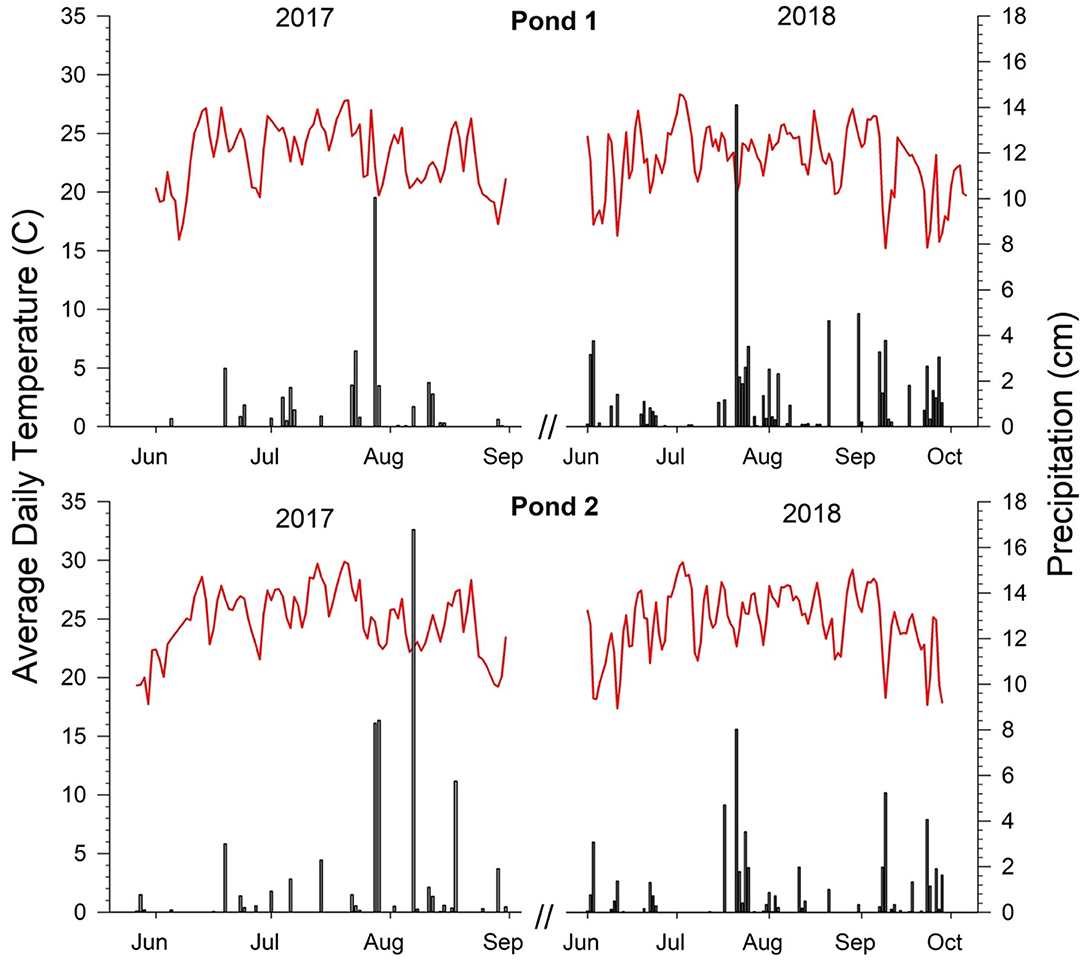
Figure 2. Precipitation and ambient air temperature data for both ponds. Precipitation data is represented in bars and temperature data are shown with red lines.
Time series data of water quality parameters measured for 2017 and 2018 are presented in Supplementary Tables 2, 3. Mean values of all measurements related to phytoplankton pigments (Phyco YSI, CHL YSI, EXT CHL, LAB CHL, and Phyco LAB) were generally higher at Pond 2 than at Pond 1 for both 2017 and 2018. Specific conductance and pH measurements were lower for both ponds in 2018 compared to 2017. The positive relationship between higher pH and higher DO concentrations was more pronounced for Pond 2, compared to Pond 1. Algicide was applied to Pond 1 after the first sampling date on Jul-1-18. Consequently, in Pond 1 all measurements related to phytoplankton pigments (Phyco YSI, CHL YSI, CHL EXT, LAB CHL, and Phyco LAB) displayed large decreases on sampling date Jul-5-18. Phycocyanin measurements remained low for the remainder of the sampling season (Phyco YSI, Phyco LAB), while chlorophyll measurements recovered after two sampling dates (CHL YSI, CHL EXT, LAB CHL). A decrease in Phyco YSI, CHL YSI, and CHL EXT measurements was seen in Pond 2 in 2017 following a 16.8 cm rainfall event. Phycocyanin measurements (Phyco YSI and Phyco LAB) for both ponds in 2018 indicated a cyanobacteria bloom was present during the first sampling dates. Phyco LAB measurements on the first sampling dates were 114 and 110 μg L−1 for Pond 1 and Pond 2, respectively. Furthermore, these blooms were also visually identified by the appearance of green surface scums and confirmed via microscopy analysis of phytoplankton samples. Phycocyanin measurements remained approximately the same in Pond 2 during the entire sampling season.
The time series data of log concentrations of green algae, diatoms, and cyanobacteria for both ponds and years are presented in the box plot graphs of Figure 3. Descriptive statistics for all phytoplankton groups, both ponds, and both sampling years are reported in Supplementary Table 4. Green algae displayed the lowest variability and cyanobacteria displayed the highest variability among the phytoplankton functional groups for both ponds. The coefficients of variation (CV) values are presented in Supplementary Table 5. In 2017 the CVs for Pond 1 ranged from 0.024 to 0.066 for green algae, 0.064 to 0.124 for diatoms, and 0.074 to 0.214 for cyanobacteria. The CVs followed a similar pattern in Pond 1 during 2018 with green algae CVs ranging from 0.023 to 0.051, diatoms from 0.044 to 0.132, and cyanobacteria from 0.040 to 0.262. The green algae CVs were generally lower in Pond 2 than the values for diatoms and cyanobacteria. The CVs for diatoms and cyanobacteria did not follow the same pattern as found for Pond 1, the overall ranges of the diatom CVs were less than the cyanobacteria CVs for each respective sampling season. Green algae and diatoms had a similar intra-seasonal (May–August) trend during 2017 at both ponds wherein population growth occurred from May to June followed by a period of stabilization for the remainder of the sampling season. Diatoms and green algae in Pond 1 exhibited similar trends in 2018 (June–October) displaying a period of stabilization from June to July followed by a drop in concentrations for the remainder of the sampling season. Cyanobacteria trends were drastically different from 2017 to 2018 for both ponds. A cyanobacteria bloom was observed within both ponds during June 2018. During this study, copper sulfate was applied to Pond 1 on Jul-1-18 and impacted the total phytoplankton concentrations, particularly decreasing the abundance of cyanobacteria species.
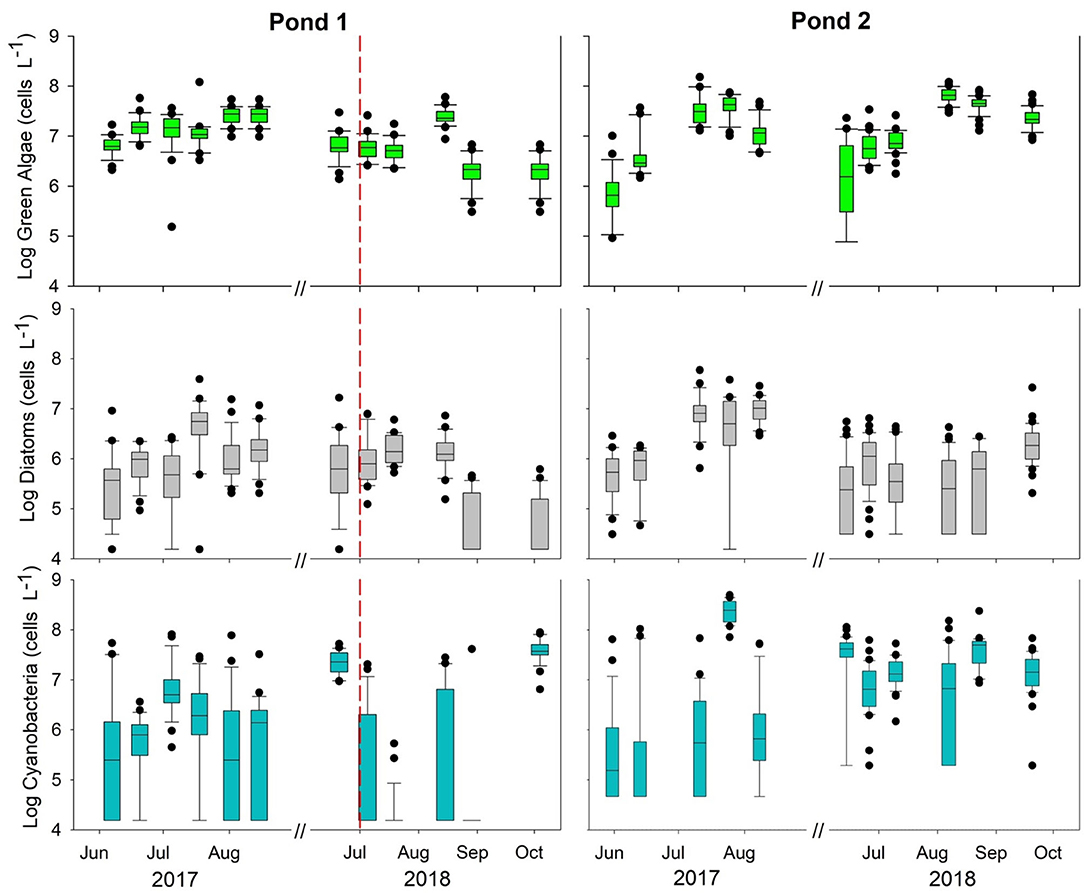
Figure 3. Time series data of log concentrations of the major phytoplankton functional groups (green algae, diatoms, and cyanobacteria) for both years. The mid-point line of the box plots represents the median for each date. Outliers (10 and 90th percentiles) are represented by black circles. The red dashed line represents an algicide application that took place on Jul-1–18 at Pond 1.
Temporal stability was assessed by considering the standard errors of the mean relative differences for each location. The mean relative differences along with standard error bars are displayed in Supplementary Figure 2. Small standard errors indicate that a location has minimal phytoplankton variation between each sampling date and large standard errors indicate substantial phytoplankton variation between sampling dates. Green algae, diatoms, and cyanobacteria displayed temporally stable spatial patterns in both ponds and over the entire 2-year study period.
The MRD values of the logarithms of green algae, diatoms, and cyanobacteria concentrations computed over the 2-years of observations at Pond 1 are shown in Supplementary Figure 1. Visual representations of the locations with consistently higher and consistently lower concentrations of each phytoplankton functional groups are displayed in Figures 4–6. The same patterns were observed for all three phytoplankton functional groups in Pond 1. The MRDs of each group tended to be lower for the interior sampling locations, and higher for the nearshore sampling locations. For green algae (Figure 4-P1), zones with consistently lower concentrations were all interior locations, except for location 6 where the irrigation pump is located. Zones of high concentrations of green algae were seen at the southern shoreline of the pond (locations 1, 8, 10), as well as locations 5 and 23. The southern shoreline of the pond is very shallow and located adjacent and downhill from crop fields. Location 5 is the site of an inflow pipe which pumps water from a nearby stream-fed pond. Location 23 is a very shallow area with aquatic vegetation and has an inflow from an ephemeral stream. Locations of consistently higher and lower concentrations of diatoms (Figure 5-P1) were very similar to those of green algae. Low concentrations of diatoms were exclusively observed at interior sampling locations. High concentrations of diatoms were observed for locations 1, 5, 6, 23 (previously described), and 2. Locations with consistently higher and lower cyanobacteria concentrations are displayed in Figure 6-P1. Low cyanobacteria concentrations were found at all interior sampling locations except for location 20. High cyanobacteria concentrations were found at all nearshore sampling locations except for location 17. Consistently high concentrations of cyanobacteria were also seen close to the ephemeral stream inflow at locations 21 and 22; and at location 1 near the crop fields.
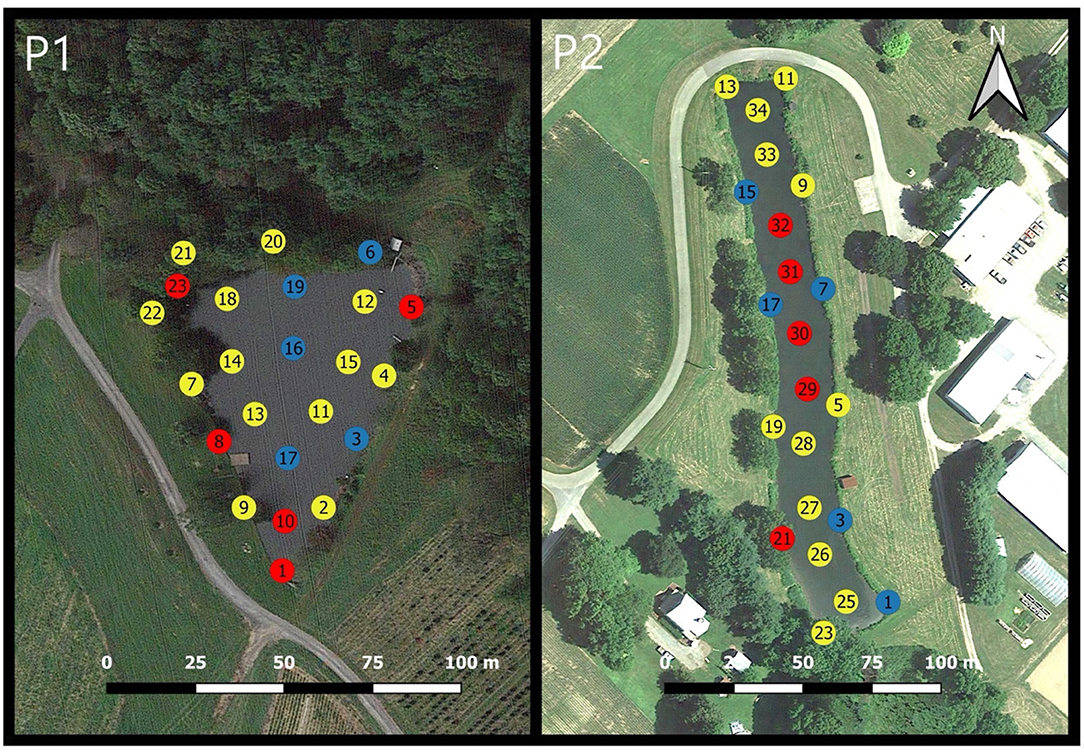
Figure 4. Mean relative differences (MRD) of green algae over the 2-year period for Pond 1 (P1) and Pond 2 (P2). Locations with MRD values below the 25th percentile are displayed in blue, locations above the 75th percentile are displayed in red, and locations between the 25 and 75th percentile are displayed in yellow.
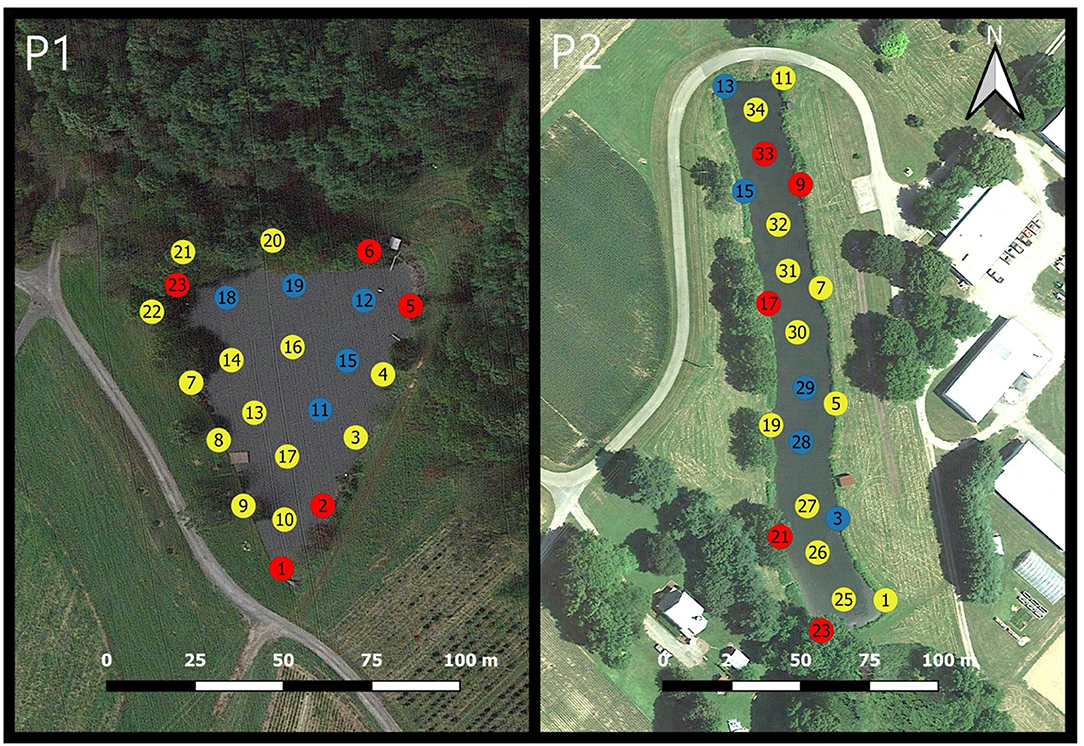
Figure 5. Mean relative differences (MRD) of diatoms over the 2-year period for Pond 1 (P1) and Pond 2 (P2). Locations with MRD values below the 25th percentile are displayed in blue, locations above the 75th percentile are displayed in red, and locations between the 25 and 75th percentile are displayed in yellow.
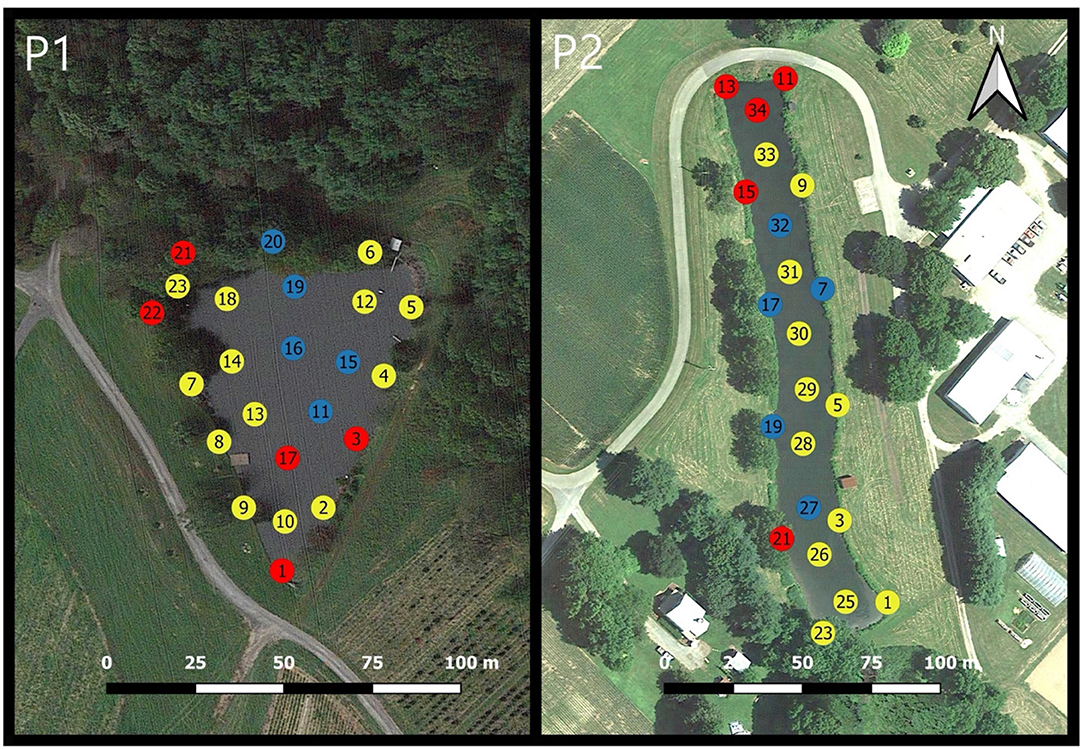
Figure 6. Mean relative differences (MRD) of cyanobacteria over the 2-year period for Pond 1 (P1) and Pond 2 (P2). Locations with MRD values below the 25th percentile are displayed in blue, locations above the 75th percentile are displayed in red and locations between the 25 and 75th percentile are displayed in yellow.
The MRD values of the logarithms of green algae, diatoms, and cyanobacteria concentrations computed over the 2-year period for Pond 2 are shown in Supplementary Figure 1. Visual representations of MRDs for green algae, diatoms, and cyanobacteria are displayed in Figures 4–6. Low MRDs for green algae (Figure 4-P2) were all nearshore sampling locations of the pond, although there was a somewhat dispersed distribution with similar values not observed within one specific area of the pond. Locations with consistently higher concentrations of green algae were mostly interior sampling locations except for sampling location 21, which is a shallow location with aquatic vegetation present. High concentrations of diatoms were found at nearshore sampling locations and within a small zone on the southeastern shoreline of the pond where there is a water level dependent outflow drain (Figure 5-P2). Cyanobacteria MRDs displayed a zonal pattern (Figure 6-P2) with higher cyanobacteria concentrations located in the northern portion of the pond apart from the observations at location 21 (as previously described). Consistently low concentrations of cyanobacteria formed a zone in the middle of the pond containing both interior and nearshore sampling locations.
The mean relative difference values of measured water quality parameters (Temp, DO, SPC, pH, NTU, Phyco YSI, CHL YSI, f DOM, and CHL EXT) for both ponds are shown in Supplementary Figures 3A–I. Within Pond 1, low MRDs were observed for temperature, DO, and pH for nearshore locations. For turbidity, Phyco YSI, CHL YSI, f DOM, and extracted chlorophyll, high MRDs were associated with nearshore locations and low MRDs were associated with interior locations within Pond 1. Within Pond 2, similar trends were observed with high MRD values for temperature, DO, and pH being observed at interior locations and low MRD values found at the nearshore locations. An inverse distribution was seen for turbidity, Phyco YSI, CHL YSI, f DOM, and extracted chlorophyll within Pond 2. Low MRD values were typically observed for the interior locations and high MRD values were observed for the nearshore locations. Therefore, both ponds exhibited differences in the water quality parameters between the interior and the nearshore sampling locations.
The Spearman rank correlations between the mean relative differences of the water quality parameters and the mean relative differences of phytoplankton groups are displayed in Table 1. Moderate correlations were defined as r ≥ 0.400 (p-values, P1 = 0.059 P2 = 0.065) and are highlighted in yellow. Strong correlations were defined as r ≥ 0.600 (p-values, P1 < 0.001 P2 < 0.001) and are highlighted in blue. Moderate and strong correlations were observed within Pond 1 for the green algae MRDs and most of the water quality MRDs (DO, SPC, pH, NTU, Phyco YSI, CHL YSI, and CHL EXT). Lower correlations were observed for diatom MRDs and cyanobacteria MRDs within Pond 1. There were no moderate or strong correlations observed for diatom MRDs in Pond 1. The cyanobacteria MRDs were moderately correlated with the MRDs of the SPC, pH, and NTU parameters. Pond 2 differed from Pond 1 regarding MRD correlations. Within Pond 2, green algae MRDs were characterized with fewer moderate correlations than diatom MRDs and cyanobacteria MRDs. Green algae MRDs within Pond 2 had a strong correlation with the MRDs of extracted chlorophyll. Diatom MRDs correlated strongly with most water quality MRDs (Temp, DO, SPC, pH, and NTU) and moderately with CHL EXT. Cyanobacteria MRDs correlated moderately with Phyco YSI and CHL YSI and strongly with most water quality MRDs (Temp, SPC, pH, and CHL EXT).
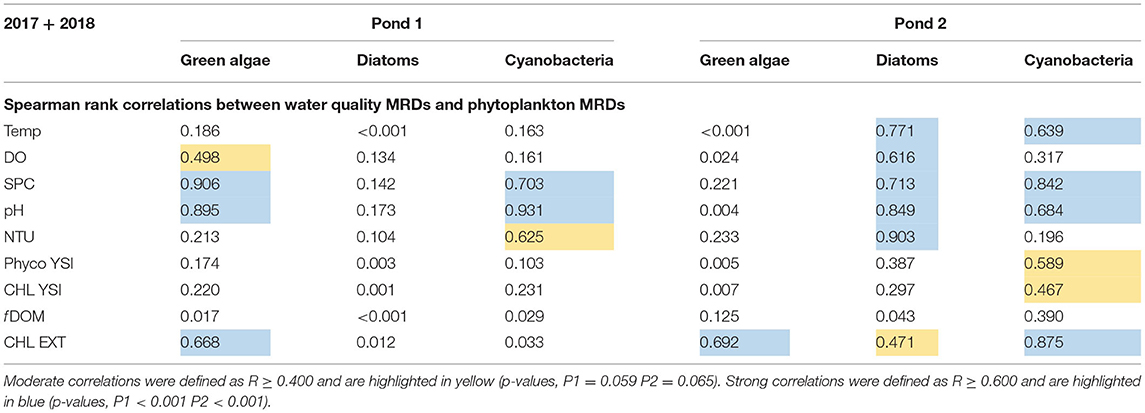
Table 1. Spearman rank correlations between the mean relative differences of water quality parameters and MRD values of phytoplankton functional groups.
The abundance and species distribution of phytoplankton taxa has been used as a bioindicator of water quality across freshwater and marine systems for decades (Patrick, 1973; Smith, 2003; Reynolds et al., 2012). Decadal phytoplankton datasets have proven to be useful when examining the seasonal periodicity and long-term trends in coastal water quality (Marshall et al., 2009; Nishikawa et al., 2010; Hernandez Cordero et al., 2020), however, similar longitudinal datasets are lacking for agricultural irrigation waters despite the fact it has been reported that land-use and nutrient loading can impact phytoplankton biodiversity in agricultural waters (Zhang et al., 2020). Smith et al. (2020) demonstrated that within agricultural irrigation ponds there was a relationship between easily measured environmental co-variates, such as CDOM and NTU, and cyanobacteria (phycocyanin) concentrations. However, the temporal and spatial stability of the cyanobacteria, or other phytoplankton functional groups, in these ponds was not examined. Here, an assessment of the phytoplankton community present during the May to October growing season, when agricultural irrigation water is used most frequently and the risk due to cyanotoxins is greatest, is presented.
The agricultural irrigation ponds examined in this study, located on working farms in Maryland, did not exhibit drastically different phytoplankton populations during the growing seasons of 2017 and 2018. Diatom concentrations did not differ within the two ponds and were comparable with concentrations found in other temperate freshwater lakes and reservoirs (Rollwagen-Bollens et al., 2013; Gorokhova and Zinchenko, 2019; Jia et al., 2019) including lakes studied by Marshall (2013, 2014) in Virginia, located south of this study area. Mean concentrations of green algae were similar within the two ponds, but Pond 1 had a smaller overall range of concentrations than Pond 2. Concentrations of green algae were comparable to values reported for other freshwater systems (Dembowska et al., 2018; Gorokhova and Zinchenko, 2019; Khaliullina and Fazlieva, 2019). Pond 2 had slightly higher concentrations of green algae and cyanobacteria. These higher values may potentially be explained by the absence of an algicide application for Pond 2. Concentrations of cyanobacteria within Pond 1 were similar to those previously reported within temperate lakes (Dembowska et al., 2018; Jia et al., 2019), including those studied locally by Marshall (2013, 2014). However, due to recurrent cyanobacteria blooms composed mainly of Aphanizomenon spp. and Microcystis wesenbergii, in Pond 2, cell concentrations were comparable with concentrations reported within small temperate lakes in which cyanobacteria blooms frequently occur (Lee et al., 2015; Woodhouse et al., 2016), including other Maryland lakes (Tango and Butler, 2008; J. Wolny, unpublished data), but were greater than those recorded by Marshall (2013, 2014).
Both ponds displayed spatial and temporal variability of major phytoplankton functional groups during the two growing seasons. Spatio-temporal variations of phytoplankton communities have been documented within freshwater lakes (Wu et al., 2014; Naselli-Flores and Padisák, 2016; Xiao et al., 2018), wetland ponds (Soininen et al., 2007), reservoirs (Alexander and Imberger, 2009), rivers (Marshall et al., 2009), and estuaries (Marshall et al., 2006). While the phytoplankton community temporal trends noted in this study were similar to those reported by Marshall (2013, 2014) for Virginia lakes, comparisons between these earlier studies and spatial variation are not possible due to the limited spatial variance in the Virginia lakes dataset. The heterogeneity or homogeneity of phytoplankton communities should not be an assumed trait within a water body. As explained by Lewis (1978), not all species or groups of phytoplankton continuously exhibit heterogenous distributions, but rather homogenous and heterogenous distributions may synchronously exist within a water body. Additionally, exogenous forces, such as wind, water flow, and lake morphology, have all been documented to attribute to the spatial variation of green algae, diatoms, and cyanobacteria (Li et al., 2013).
Two forms of spatial trends were observed within the two ponds during this study. The predominant spatio-temporal trends that were present within both ponds appeared to be a contrast between interior and nearshore sampling locations. Within Pond 1, this trend was displayed for all groups. Pond 1 had consistently higher concentrations of green algae, cyanobacteria, and diatoms at nearshore sampling locations; and consistently lower concentrations of green algae, cyanobacteria, and diatoms at interior locations. This pattern of higher concentrations at nearshore sampling locations vs. interior sampling locations was reported for both ponds in a preceding study using average quartile ranks of phycocyanin concentrations (Smith et al., 2020). Higher concentrations of phytoplankton being closer to the shoreline of shallow water bodies has been attributed to several different concepts. Bondarenko et al. (1996) stated that spatial distribution of phytoplankton was related to water depth, with shallow waters being richest in phytoplankton. Both ponds in this study were only 2.7 m deep, thus indicating that even in shallow environments depth-dependent gradients can be set up within the phytoplankton community. In other studies, greater abundances of phytoplankton were found in stands of Phragmites australis and other aquatic plants, due to the creation of favorable water quality conditions, including increased phosphorus concentrations (Celewicz-Goldyn and Kuczynska-Kippen, 2008, 2017) and in zones with elevated nutrient concentrations and water temperatures (Chen et al., 2003). Aquatic vegetation was noted at both ponds and future work will look to correlate the spatial patterns of the phytoplankton community with the characteristics of the resident aquatic vegetation.
Similarly, within Pond 2 consistently higher concentrations of diatoms were found at nearshore locations. The opposite trend was observed for green algae within Pond 2 wherein consistently higher concentrations of green algae were observed for interior sampling locations, and consistently lower concentrations of green algae were observed for nearshore sampling. While this is a difference from co-located Pond 1, this trend has been previously documented by Celewicz-Goldyn and Kuczynska-Kippen (2008) who indicated that the greatest abundance of small chlorophytes was found in open waters where the potential threat of predation from zooplankton was less.
The major spatio-temporal patterns observed for Pond 2 were the formation of zones in which cyanobacteria were the dominant taxa. Consistently higher concentrations of cyanobacteria were found at the northern portion of the pond (sampling locations: 11, 13, 15, and 34) near a culvert, which following precipitation events provides inflow of potentially nutrient-rich waters to the pond. This high cyanobacteria biomass zone was also established in the preceding study on quartile ranks of phycocyanin concentrations (Smith et al., 2020). Other studies have documented spatial trends of cyanobacteria among other phytoplankton species due to either nutrient-rich runoff or river inflow (Powell et al., 1975; Marshall et al., 2006; Woodhouse et al., 2016). Other potential explanations for the formation of these cyanobacteria-rich zones could be wind or wind-driven water flow as noted by Cloern et al. (1992) and Fragoso et al. (2008) or microhabitats set up through thermal stratification as noted by Vasas et al. (2013).
There was a zone of consistently low cyanobacteria concentrations within Pond 2 that was located near the middle of the pond (sampling locations: 17, 27, 32, 7, 19, 5). The pump house and water intake pipe for the farm irrigation system is in this area. The location of the irrigation intake pipe has important implications for food safety. It has been well-established that irrigation waters with toxigenic cyanobacteria can contaminate crops (Miller and Russell, 2017), remain in soils for extended periods of time (Machado et al., 2017), and may even be taken up by the root system of the produce (Lee et al., 2017). Thus, placing an irrigation intake system in a location with consistently higher concentrations of cyanobacteria may increase produce contamination risks. It appears that the pump and intake infrastructure in Pond 2 is located in a low-risk zone, as cell concentrations of potentially toxic cyanobacteria species never exceeded EPA or regional guidelines (VDH, 2015; EPA, 2019). However, future research and monitoring efforts should focus on determining the prevalence of cyanotoxins in these irrigation waters.
Of note, a copper sulfate algicide was applied to Pond 1 midway through the study, on Jul-1-18, to mitigate a bloom of Microcystis, a potentially toxigenic cyanobacteria species. While the concentration of copper sulfate used is unknown, all measured water quality parameters decreased significantly following this application. These reductions were comparable to values reported by Schrader et al. (2000) and Song et al. (2011) within other inland waters that were assessed during and after treatments with copper sulfate. Average concentrations of DO, pH, CDOM, and f DOM returned to pre-application levels about 1 month after application. For the algal pigments (CHL RFU, CHL YSI, CHL EXT, and phycocyanin), all concentrations decreased after the copper sulfate application and slowly recovered to either pre-application levels or higher by the end of August. The return of chlorophyll-a readings to previous values was also reported by Dia (2016) and Effler et al. (1980) following low-level algicide treatments (8–14 μg L−1) in freshwater lakes. Elder and Horne (1978) reported the recovery of pre-treatment algal populations in as little as five days after treatment and attributed this recovery to copper sulfate possibly being beneficial for biological activity if applied in very low concentrations (5–10 μg L−1). The effect of algicide on cyanobacteria concentrations was more pronounced than the effect on green algae and diatoms concentrations. Similar responses were reported by Padovesi-Fonseca and Philomeno (2004) and XiaoLi et al. (2009) wherein cyanobacteria concentrations, including Microcystis aeruginosa, Cylindrospermopsis raciborskii, and Anabaena flos-aquae, decreased and green algae and diatoms became the dominant taxa after an algicide application, with the subsequent population changes attributed to cyanobacteria species sensitivity to copper. The rate of recovery of the phytoplankton community to the application of copper sulfate, or other algicides, should be monitored if the algicide application is meant to act as a safeguard to crops from cyanotoxin exposure via irrigation waters. It should be mentioned that the treatment of water bodies with algicides can immediately release large quantities of cyanotoxins, if toxin-producing algal species are highly concentrated (Zhou et al., 2013; Greenfield et al., 2014). An assessment of phytoplankton community composition should be performed prior to an algicide application if the water is to be used for crop irrigation or as drinking water for livestock to safeguard against the introduction of concentrated biotoxins.
Although not similar, both ponds expressed moderate and strong correlations between the spatial patterns of phytoplankton functional groups and water quality parameters. Pond 1 had strong water quality correlations with green algae, while Pond 2 had strong correlations with diatoms and cyanobacteria. The correlations between water quality and phytoplankton spatial trends provides helpful insights for irrigation pond monitoring. The examination of phytoplankton community structure using microscopy is an intensive analysis which requires extensive laboratory infrastructure and highly trained personnel (Lawton et al., 1999). However, if strong correlations exist among water quality parameters and optical properties associated with distinct phytoplankton functional groups, the option of using less specialized monitoring methods, such as in-situ sensors or drone-based imagery could be employed for routine resource management. These technologies would be efficient and cost-effective methods capable of being used by a broader group of personnel to safeguard against irrigating crops with degraded water drawn from agricultural irrigation waters. While identifying water quality covariates and the use of optical techniques to assess the phytoplankton functional groups present in water will not identify toxic vs. non-toxic phytoplankton species it can provide the information necessary to make better informed decisions about when and where to conduct toxin risk assessments.
Using a mean relative difference analysis to assess spatio-temporal stability, it was determined that phytoplankton functional groups exhibited stable spatio-temporal trends in the two agricultural irrigation ponds evaluated in this study. Temporally stable spatial patterns of the three phytoplankton functional groups studied here were found within both ponds over the two sampling years. Both ponds had locations where phytoplankton group concentrations were consistently higher or lower than the pond's average concentrations. Typically, these patterns could be classified into two categories: nearshore or interior sampling locations or zones. These distributions indicate the importance of sampling locations for water quality monitoring purposes. If sampling is performed in areas of consistently higher or lower concentrations of phytoplankton, that sample may not be an accurate representation of the phytoplankton community within the entire waterbody. Because of the correlation between water quality parameters and certain phytoplankton functional groups it may be possible to employ broad-based technologies to routinely monitor irrigation waters for potentially harmful cyanobacteria instead of relying on labor intensive microscopy methods. However, it is important to note that there are other types of agricultural ponds, such as aquaculture ponds and retention ponds. While this study can provide a framework for assessing agricultural ponds no extrapolation should be made to these other water sources from the finding presented here.
The raw data supporting the conclusions of this article will be made available by the authors, without undue reservation.
JS: conducted sample collection, microscopy assays, and data analysis and wrote the original draft. JW: aided with microscopy and provided substantial assistance with manuscript editing. MS: assisted with sample collection and manuscript editing and created GIS-based figures. RH: provided guidance during the writing process. YP: provided guidance and insight during sample collection design, data analysis, and writing process. All authors contributed to the article and approved the submitted version.
The authors declare that the research was conducted in the absence of any commercial or financial relationships that could be construed as a potential conflict of interest.
All claims expressed in this article are solely those of the authors and do not necessarily represent those of their affiliated organizations, or those of the publisher, the editors and the reviewers. Any product that may be evaluated in this article, or claim that may be made by its manufacturer, is not guaranteed or endorsed by the publisher.
The Supplementary Material for this article can be found online at: https://www.frontiersin.org/articles/10.3389/frwa.2021.724025/full#supplementary-material
Supplementary Figure 1. The mean relative difference values of the logarithms of dinoflagellate concentrations computed over the 2-year period for both Pond 1 and Pond 2.
Supplementary Figure 2. The mean relative difference values of the logarithms of green algae, diatoms, and cyanobacteria concentrations computed over the 2-year period for Pond 1 and Pond 2.
Supplementary Figure 3. (A) The mean relative difference values of temperature over the 2-year period for Pond 1 and Pond 2. (B) The mean relative difference values of dissolved oxygen over the 2-year period for Pond 1 and Pond 2. (C) The mean relative difference values of specific conductance over the 2-year period for Pond 1 and Pond 2. (D) The mean relative difference values of pH over the 2-year period for Pond 1 and Pond 2. (E) The mean relative difference values of turbidity over the 2-year period for Pond 1 and Pond 2. (F) The mean relative difference values of phycocyanin from the YSI sonde over the 2-year period for Pond 1 and Pond 2. (G) The mean relative difference values of chlorophyll pigment from the YSI sonde over the 2-year period for Pond 1 and Pond 2. (H) The mean relative difference values of fluorescent dissolved organic matter over the 2-year period for Pond 1 and Pond 2. (I) The mean relative difference values of extracted chlorophyll over the 2-year period for Pond 1 and Pond 2.
Supplementary Table 1. Sampling dates from 2017 and 2018 with corresponding rainfall event information for Pond 1 and Pond 2.
Supplementary Table 2. Time series data of 2017 water quality parameters for Pond 1 and Pond 2.
Supplementary Table 3. Time series data of 2018 water quality parameters for Pond 1 and Pond 2.
Supplementary Table 4. Descriptive statistics of phytoplankton functional groups.
Supplementary Table 5. Coefficient of variation values for Pond 1 and Pond 2.
Adloff, C. T., Bem, C. C., Reichert, G., and Azevedo, J. C. R. de. (2018). Analysis of the phytoplankton community emphasizing cyanobacteria in four cascade reservoirs system of the Iguazu River, Paraná, Brazil. Brazil. J. Water Resourc. 23:318170050. doi: 10.1590/2318-0331.0318170050
Alexander, R., and Imberger, J. (2009). Spatial distribution of motile phytoplankton in a stratified reservoir: the physical controls on patch formation. J. Plankton Res. 31, 101–118. doi: 10.1093/plankt/fbn101
Bellinger, E. D., and Sigee, D. C. (2015). Freshwater Algae, 1st Edn. Hoboken, NJ: John Wiley & Sons, Ltd. doi: 10.1002/9781118917152
Bittencourt-Oliveira, M. do C., Cordeiro-Araújo, M. K., Chia, M. A., Arruda-Neto, J. D., de, T., Oliveira, Ê. T., de Santos, F., et al. (2016). Lettuce irrigated with contaminated water: photosynthetic effects, antioxidative response and bioaccumulation of microcystin congeners. Ecotoxicol. Environ. Saf. 128, 83–90. doi: 10.1016/j.ecoenv.2016.02.014
Bondarenko, N. A., Guselnikova, N. E., Logacheva, N. F., and Pomazkina, G. V. (1996). Spatial distribution of phytoplankton in Lake Baikal, Spring 1991. Freshw. Biol. 35, 517–523. doi: 10.1111/j.1365-2427.1996.tb01765.x
Bouma-Gregson, K., Power, M. E., and Bormans, M. (2017). Rise and fall of toxic benthic freshwater cyanobacteria (Anabaena spp.) in the Eel river: buoyancy and dispersal. Harmful Algae 66, 79–87. doi: 10.1016/j.hal.2017.05.007
Buratti, F., Manganelli, M., Vichi, S., Stefanelli, M., Scardala, S., Testai, E., et al. (2017). Cyanotoxins: producing organisms, occurrence, toxicity, mechanism of action and human health toxicological risk evaluation. Archiv. Toxicol. 91, 1049–1130. doi: 10.1007/s00204-016-1913-6
Celewicz-Goldyn, S., and Kuczynska-Kippen, N. (2008). Spatial Distribution of Phytoplankton Communities in Small Water Body. Roczniki Akademii Rolniczej w Poznaniu. Botanika-Steciana, 12. Available online at: http://agro.icm.edu.pl/agro/element/bwmeta1.element.agro-09ba7268-dd81-45ba-993f-5bff48b31977 (accessed September 17, 2021).
Celewicz-Goldyn, S., and Kuczynska-Kippen, N. (2017). Ecological value of macrophyte cover in creating habitat for microalgae (diatoms) and zooplankton (rotifers and crustaceans) in small field and forest water bodies. PLoS ONE 12:e0177317. doi: 10.1371/journal.pone.0177317
Chen, Y., Qin, B., Teubner, K., and Dokulil, M. T. (2003). Long-term dynamics of phytoplankton assemblages: microcystis-domination in Lake Taihu, a large shallow lake in China. J. Plankton Res. 25, 445–453. doi: 10.1093/plankt/25.4.445
Cloern, J. E., Alpine, A. E., Cole, B. E., and Heller, T. (1992). Seasonal changes in the spatial distribution of phytoplankton in small, temperate-zone lakes. J. Plankton Res. 14, 1017–1024. doi: 10.1093/plankt/14.7.1017
DeLorenzo, M. E. M., Taylor, L. A., Lund, S. A., Pennington, E. D., Strozier, E. D., and Fulton, M. H. (2002). Toxicity and bioconcentration potential of the agricultural pesticide endosulfan in phytoplankton and zooplankton. Archiv. Environ. Contaminat. Toxicol. 42, 173–181. doi: 10.1007/s00244-001-0008-3
Dembowska, E. A., Mieszczankin, T., and Napiórkowski, P. (2018). Changes of the phytoplankton community as symptoms of deterioration of water quality in a shallow lake. Environ. Monitor. Assess. 190:95. doi: 10.1007/s10661-018-6465-1
Dia, S. A. (2016). Efficacy of Three Algaecides on Algal Blooms in Hypereutrophic Lakes. (Master's Thesis), American University of Beirut, Beirut, Lebanon.
Effler, S. W., Litten, S., Field, S. D., Tong-Ngork, T., Hale, F., Meyer, M., et al. (1980). Whole lake responses to low level copper sulfate treatment. Water Res. 14, 1489–1499. doi: 10.1016/0043-1354(80)90015-9
Elder, J. F., and Horne, A. J. (1978). Copper cycles and CuSO4 algicidal capacity in two California lakes. Environ. Manag. 2, 17–30. doi: 10.1007/BF01866443
EPA (1997). In vitro Determination of Chlorophyll a and Pheophytin a in Marine and Freshwater Algae by Fluorescence. EPA-600R15006 (Washington, DC), 15022.
EPA (2019). Recommendations for Cyanobacteria and Cyanotoxin Monitoring in Recreational Waters. EPA-823-R-19-001 (Washington, DC), 16.
Feki-Sahnoun, W., Hamza, A., Béjaoui, B., Mahfoudi, M., Rebai, A., and Bel Hassen, M. (2018). Multi-table approach to assess the biogeography of phytoplankton: ecological and management implications. Hydrobiologia 815, 229–251. doi: 10.1007/s10750-018-3566-3
Fragoso, C. R., Marques, D. M. L. M., Collischonn, W., Tucci, C. E. M., and van Nes, E. H. (2008). Modelling spatial heterogeneity of phytoplankton in Lake Mangueira, a large shallow subtropical lake in South Brazil. Ecol. Model. 219, 125–137. doi: 10.1016/j.ecolmodel.2008.08.004
Gorokhova, O. G., and Zinchenko, T. D. (2019). Phytoplankton of the Usa River and its tributaries (Kuibyshev Reservoir Basin). Biol. Bullet. 46, 1382–1389. doi: 10.1134/S1062359019100121
Greenfield, D. I., Duquette, A., Goodson, A., Keppler, C. J., Williams, S. H., Brock, L. M., et al. (2014). The effects of three chemical algaecides on cell numbers and toxin content of the cyanobacteria Microcystis aeruginosa and Anabaenopsis sp. Environ. Manag. 54, 1110–1120. doi: 10.1007/s00267-014-0339-2
Hernandez Cordero, A. L., Tango, P. J., and Batiuk, R. A. (2020). Development of a multimetric water quality indicator for tracking progress towards the achievement of Chesapeake Bay water quality standards. Environ. Monitor. Assess. 192:94. doi: 10.1007/s10661-019-7969-z
Hu, C., Ou, Y., Zhang, D., Zhang, H., Yan, C., Zhao, Y., et al. (2012). Phytoremediation of the polluted Waigang River and general survey on variation of phytoplankton population. Environ. Sci. Poll. Res. 19, 4168–4175. doi: 10.1007/s11356-012-0931-z
Jia, J., Gao, Y., Song, X., and Chen, S. (2019). Characteristics of phytoplankton community and water net primary productivity response to the nutrient status of the Poyang Lake and Gan River, China. Ecohydrology 12:e2136. doi: 10.1002/eco.2136
Jin, Y., Yu, R., Zhang, Z., Zhang, Q., Li, M., Cao, Z., et al. (2020). Spatiotemporal variability of phytoplankton functional groups in a shallow eutrophic lake from cold, arid regions. Environ. Monitor. Assess. 192:371. doi: 10.1007/s10661-020-08349-4
John, D. M., Whitton, B. A., and Brook, A. J. (2011). The Freshwater Algal Flora of the British Isles: An Identification Guide to Freshwater and Terrestrial Algae. London: Cambridge University Press, 724.
Jongman, M., and Korsten, L. (2018). Irrigation water quality and microbial safety of leafy greens in different vegetable production systems: a review. Food Rev. Int. 34, 308–328. doi: 10.1080/87559129.2017.1289385
Khaliullina, L. Y., and Fazlieva, A. R. (2019). The composition and seasonal dynamics of planktonic green algae in the mouth of the Kazanka River (Republic of Tatarstan). J. Environ. Treat. Techniq. 5, 993–998.
Lamlou, V. W. (1977). Distribution of Phytoplankton in Maryland Lakes. Las Vegas, NV: Environmental Protection Agency, Office of Research and Development, Environmental Monitoring and Support Laboratory, Monitoring Operations Division.
Lawton, L., Marsalek, B., Padisak, J., and Chorus, I. (1999). “Determination of cyanobacteria in the laboratory,” in Toxic Cyanobacteria in Water: A Guide to Their Public Health Consequences, Monitoring and Management, eds I. Chorus and J. Bartram (New York, NY: E & FN Spon).
Lee, S., Jiang, X., Manubolu, M., Riedl, K., Ludsin, S. A., Martin, J. F., et al. (2017). Fresh produce and their soils accumulate cyanotoxins from irrigation water: implications for public health and food security. Food Res. Int. 102, 234–245. doi: 10.1016/j.foodres.2017.09.079
Lee, T. A., Rollwagen-Bollens, G., and Bollens, S. M. (2015). The influence of water quality variables on cyanobacterial blooms and phytoplankton community composition in a shallow temperate lake. Environ. Monitor. Assess. 187:315. doi: 10.1007/s10661-015-4550-2
Lewis, W. M. (1978). Spatial distribution of the phytoplankton in a tropical lake (Lake Lanao, Philippines). Int. Rev. Ges. Hydrobiol. Hydrogr. 63, 619–635. doi: 10.1002/iroh.19780630508
Li, F., Zhang, H., Zhu, Y., Xiao, Y., and Chen, L. (2013). Effect of flow velocity on phytoplankton biomass and composition in a freshwater lake. Sci. Tot. Environ. 447, 64–71. doi: 10.1016/j.scitotenv.2012.12.066
Machado, J., Campos, A., Vasconcelos, V., and Freitas, M. (2017). Effects of microcystin-LR and cylindrospermopsin on plant-soil systems: a review of their relevance for agricultural plant quality and public health. Environ. Res. 153, 191–204. doi: 10.1016/j.envres.2016.09.015
Marshall, H., and Alden, R. (1990). A comparison of phytoplankton assemblages and environmental relationships in three estuarine rivers of the lower Chesapeake Bay. Estuaries. 13, 287–300. doi: 10.2307/1351920
Marshall, H. G. (2013). Phytoplankton in Virginia lakes and reservoirs. Virginia J. Sci. 64, 3–15. doi: 10.25778/f2rh-zd44
Marshall, H. G. (2014). Phytoplankton in Virginia lakes and reservoirs: part II. Virginia J. Sci. 65, 3–8. doi: 10.1353/wvh.2014.0003
Marshall, H. G., Lacouture, R. V., Buchanan, C., and Johnson, J. M. (2006). Phytoplankton assemblages associated with water quality and salinity regions in Chesapeake Bay, USA. Estuar. Coast. Shelf Sci. 69, 10–18. doi: 10.1016/j.ecss.2006.03.019
Marshall, H. G., Lane, M. F., Nesius, K. K., and Burchardt, L. (2009). Assessment and significance of phytoplankton species composition within Chesapeake Bay and Virginia tributaries through a long-term monitoring program. Environ. Monitor. Assess. 150, 143–155. doi: 10.1007/s10661-008-0680-0
Miller, A., and Russell, C. (2017). Food crops irrigated with cyanobacteria-contaminated water: an emerging public health issue in Canada. Environ. Health Rev. 60, 58–63. doi: 10.5864/d2017-021
Naselli-Flores, L., and Padisák, J. (2016). Blowing in the wind: how many roads can a phytoplanktont walk down? A synthesis on phytoplankton biogeography and spatial processes. Hydrobiologia 764, 303–313. doi: 10.1007/s10750-015-2519-3
Nishikawa, T., Hori, Y., Nagai, S., Miyahara, K., Nakamura, Y., Harada, K., et al. (2010). Nutrient and phytoplankton dynamics in Harima-Nada, Eastern Seto Inland Sea, Japan during a 35-year period from 1973 to 2007. Estuar. Coast. 33, 417–427. doi: 10.1007/s12237-009-9198-0
Pachepsky, Y., Kierzewski, R., Stocker, M., Sellner, K., Mulbry, W., Lee, H., et al. (2017). Temporal stability of Escherichia coli concentrations in waters of two irrigation ponds in Maryland. Appl. Environ. Microbiol. 84:e01876-17. doi: 10.1128/AEM.01876-17
Padovesi-Fonseca, C., and Philomeno, M. G. (2004). Effects of algicide (copper sulfate) application on short-term fluctuations of phytoplankton in Lake Paranoá, Central Brazil. Brazil. J. Biol. 64, 819–826. doi: 10.1590/S1519-69842004000500011
Patrick, R. (1973). Use of algae, especially diatoms, in the assessment of water quality. Biol. Method. Assess. Water Qual 76–95. doi: 10.1520/STP34718S
Powell, T. M., Richerson, P. J., Dillon, T. M., Agee, B. A., Dozier, B. J., Godden, D. A., et al. (1975). Spatial scales of current speed and phytoplankton biomass fluctuations in Lake Tahoe. Science 189, 1088–1090. doi: 10.1126/science.189.4208.1088
Ren, X., Yang, K., Che, Y., Wang, M., Zhou, L., and Chen, L. (2016). Spatial and temporal assessment of the initial pattern of phytoplankton population in a newly built coastal reservoir. Front. Earth Sci. 10, 546–559. doi: 10.1007/s11707-015-0543-2
Reynolds, C. S., Huszar, V., Kruk, C., Naselli-Flores, L., and Melo, S. (2002). Towards a functional classification of the freshwater phytoplankton. J. Plankton Res. 24, 417–428. doi: 10.1093/plankt/24.5.417
Reynolds, C. S., Maberly, S. C., Parker, J. E., and Ville, M. M. D. (2012). Forty years of monitoring water quality in Grasmere (English Lake District): separating the effects of enrichment by treated sewage and hydraulic flushing on phytoplankton ecology. Freshw. Biol. 57, 384–399. doi: 10.1111/j.1365-2427.2011.02687.x
Rimet, F., and Druart, J.-C. (2018). A trait database for phytoplankton of temperate lakes. Ann. Limnol. Int. J. Limnol. 54:18. doi: 10.1051/limn/2018009
Rollwagen-Bollens, G., Bollens, S. M., Gonzalez, A., Zimmerman, J., Lee, T., and Emerson, J. (2013). Feeding dynamics of the copepod Diacyclops thomasi before, during and following filamentous cyanobacteria blooms in a large, shallow temperate lake. Hydrobiologia 705, 101–118. doi: 10.1007/s10750-012-1385-5
Schrader, K. K., Duke, S. O., Kingsbury, S. K., Tucker, C. S., Duke, M. V., Dionigi, C. P., et al. (2000). Evaluation of ferulic acid for controlling the musty-odor cyanobacterium, Oscillatoria perornata, in aquaculture ponds. J. Appl. Aquacult. 10, 1–16. doi: 10.1300/J028v10n01_01
Shi, X., Liu, X., Liu, G., Sun, Z., and Xu, H. (2012). Application of phytoplankton communities for monitoring water quality in the Hangzhou section of Jing-Hang Grand Canal, southern China. Fundamental Appl. Limnol. 2012, 1–11. doi: 10.1127/1863-9135/2012/0238
Shi, X., Sun, Z., Liu, G., and Xu, H. (2015). Insights into community-based discrimination of water quality status using an annual pool of phytoplankton in mid-subtropical canal systems. Environ. Sci. Poll. Res. 22, 1199–1206. doi: 10.1007/s11356-014-3391-9
Shimoda, Y., and Arhonditsis, G. B. (2016). Phytoplankton functional type modelling: running before we can walk? A critical evaluation of the current state of knowledge. Ecol. Model. 320, 29–43. doi: 10.1016/j.ecolmodel.2015.08.029
Smith, J. E., Stocker, M. D., Wolny, J. L., Hill, R. L., and Pachepsky, Y. A. (2020). Intraseasonal variation of phycocyanin concentrations and environmental covariates in two agricultural irrigation ponds in Maryland, USA. Environ. Monitor. Assess. 192:706. doi: 10.1007/s10661-020-08664-w
Smith, V. H. (2003). Eutrophication of freshwater and coastal marine ecosystems a global problem. Environ. Sci. Poll. Res. 10, 126–139. doi: 10.1065/espr2002.12.142
Soininen, J., Kokocinski, M., Estlander, S., Kotanen, J., and Heino, J. (2007). Neutrality, niches, and determinants of plankton metacommunity structure across boreal wetland ponds. Écoscience 14, 146–154. doi: 10.2980/1195-6860(2007)14[146:NNADOP]2.0.CO;2
Song, L., Marsh, T. L., Voice, T. C., and Long, D. T. (2011). Loss of seasonal variability in a lake resulting from copper sulfate algaecide treatment. Phys. Chem. Earth A/B/C 36, 430–435. doi: 10.1016/j.pce.2010.04.016
Stocker, M. D., Penrose, M., and Pachepsky, Y. A. (2018). Spatial patterns of Escherichia coli concentrations in sediment before and after high-flow events in a first-order creek. J. Environ. Qual. 47, 958–966. doi: 10.2134/jeq2017.11.0451
Su, X., Steinman, A. D., Xue, Q., Zhao, Y., Tang, X., and Xie, L. (2017). Temporal patterns of phyto- and bacterioplankton and their relationships with environmental factors in Lake Taihu, China. Chemosphere 184, 299–308. doi: 10.1016/j.chemosphere.2017.06.003
Tango, P. J., and Butler, W. (2008). Cyanotoxins in tidal waters of Chesapeake Bay. Northeastern Natural. 15, 403–416. doi: 10.1656/1092-6194-15.3.403
Uyttendaele, M., Jaykus, L.-A., Amoah, P., Chiodini, A., Cunliffe, D., Jacxsens, L., et al. (2015). Microbial hazards in irrigation water: standards, norms, and testing to manage use of water in fresh produce primary production. Comprehens. Rev. Food Sci. Food Saf. 14, 336–356. doi: 10.1111/1541-4337.12133
Vandermeulen, R. A., Mannino, A., Neeley, A., Werdell, J., and Arnone, R. (2017). Determining the optimal spectral sampling frequency and uncertainty thresholds for hyperspectral remote sensing of ocean color. Opt. Expr. 25, A785–A797. doi: 10.1364/OE.25.00A785
Varol, M. (2019). Phytoplankton functional groups in a monomictic reservoir: seasonal succession, ecological preferences, and relationships with environmental variables. Environ. Sci. Poll. Res. 26, 20439–20453. doi: 10.1007/s11356-019-05354-0
Vasas, G., Farkas, O., Borics, G., Felföldi, T., Sramkó, G., Batta, G., et al. (2013). Appearance of Planktothrix rubescens bloom with [D-Asp3, Mdha7]MC-RR in gravel pit pond of a shallow lake-dominated area. Toxins 5, 2434–2455. doi: 10.3390/toxins5122434
VDH (2015). Virginia Recreational Water Guidance for Microcystin and Microcystis Blooms Provisional Guidance. Available online at: https://townhall.virginia.gov/L/ViewGDoc.cfm?gdid=5479 (accessed September 17, 2021).
Wang, L., Wang, C., Deng, D., Zhao, X., and Zhou, Z. (2015). Temporal and spatial variations in phytoplankton: correlations with environmental factors in Shengjin Lake, China. Environ. Sci. Poll. Res. 22, 14144–14156. doi: 10.1007/s11356-015-4640-2
Wolanin, A., Soppa, M. A., and Bracher, A. (2016). Investigation of spectral band requirements for improving retrievals of phytoplankton functional types. Remote Sens. 8:871. doi: 10.3390/rs8100871
Wood, R. (2016). Acute animal and human poisonings from cyanotoxin exposure—a review of the literature. Environ. Int. 91, 276–282. doi: 10.1016/j.envint.2016.02.026
Woodhouse, J. N., Kinsela, A. S., Collins, R. N., Bowling, L. C., Honeyman, G. L., Holliday, J. K., et al. (2016). Microbial communities reflect temporal changes in cyanobacterial composition in a shallow ephemeral freshwater lake. ISME J. 10, 1337–1351. doi: 10.1038/ismej.2015.218
World Health Organization (2008). Microbiological Hazards in Fresh Leafy Vegetables and Herbs: Meeting Report (Vol. 14). Washington, DC: World Health Organization.
Wu, Z., He, H., Cai, Y., Zhang, L., and Chen, Y. (2014). Spatial distribution of chlorophyll a and its relationship with the environment during summer in Lake Poyang: a Yangtze-connected lake. Hydrobiologia 732, 61–70. doi: 10.1007/s10750-014-1844-2
Xi, H., Hieronymi, M., Krasemann, H., and Röttgers, R. (2017). Phytoplankton group identification using simulated and in situ hyperspectral remote sensing reflectance. Front. Mar. Sci. 2017:272. doi: 10.3389/fmars.2017.00272
Xiao, L.-J., Zhu, Y., Yang, Y., Lin, Q., Han, B.-P., and Padisák, J. (2018). Species-based classification reveals spatial processes of phytoplankton meta-communities better than functional group approaches: a case study from three freshwater lake regions in China. Hydrobiologia 811, 313–324. doi: 10.1007/s10750-017-3502-y
Xiao, R., Su, S., Ghadouani, A., and Wu, J. (2013). Spatial analysis of phytoplankton patterns in relation to environmental factors across the southern Taihu basin, China. Stochastic Environ. Res. Risk Assess. 27, 1347–1357. doi: 10.1007/s00477-012-0670-1
XiaoLi, Z., LiRong, S., and XiaoMing, Z. (2009). Effects of copper sulfate treatment on eutrophic urban lake phytoplankton communities. Acta Hydrobiol. Sin. 33, 596–602. doi: 10.3724/SP.J.1035.2009.40596
Zhang, Z., Gao, J., and Cai, Y. (2020). The direct and indirect effects of land use and water quality on phytoplankton communities in an agriculture-dominated basin. Environ. Monitor. Assess. 192:760. doi: 10.1007/s10661-020-08728-x
Keywords: agricultural irrigation pond, mean relative difference analysis, phytoplankton functional groups, spatial patterns, water quality
Citation: Smith JE, Wolny JL, Stocker MD, Hill RL and Pachepsky YA (2021) Temporal Stability of Phytoplankton Functional Groups Within Two Agricultural Irrigation Ponds in Maryland, USA. Front. Water 3:724025. doi: 10.3389/frwa.2021.724025
Received: 11 June 2021; Accepted: 30 September 2021;
Published: 01 November 2021.
Edited by:
Jasna Kovac, The Pennsylvania State University (PSU), United StatesReviewed by:
Maria Emilia Cunha, Instituto Português do Mar e Atmosfera, PortugalCopyright © 2021 Smith, Wolny, Stocker, Hill and Pachepsky. This is an open-access article distributed under the terms of the Creative Commons Attribution License (CC BY). The use, distribution or reproduction in other forums is permitted, provided the original author(s) and the copyright owner(s) are credited and that the original publication in this journal is cited, in accordance with accepted academic practice. No use, distribution or reproduction is permitted which does not comply with these terms.
*Correspondence: Jaclyn E. Smith, amFja2llLnNtaXRoQHVzZGEuZ292
†Present address: Jennifer L. Wolny, Office of Regulatory Science, Center for Food Safety and Applied Nutrition, US Food and Drug Administration, College Park, MD, United States
Disclaimer: All claims expressed in this article are solely those of the authors and do not necessarily represent those of their affiliated organizations, or those of the publisher, the editors and the reviewers. Any product that may be evaluated in this article or claim that may be made by its manufacturer is not guaranteed or endorsed by the publisher.
Research integrity at Frontiers
Learn more about the work of our research integrity team to safeguard the quality of each article we publish.