 David Poon
 Joann K. Whalen
 Aubert R. Michaud
- 1Department of Natural Resource Sciences, Macdonald Campus of McGill University, Ste-Anne-de-Bellevue, QC, Canada
- 2Institut de Recherche et de Développement en Agroenvironnement, Québec, QC, Canada
More water and nutrients from artificially-drained agricultural land reach surface waters by leaching through macropores than by percolating through the soil matrix. However, the Soil and Water Assessment Tool (SWAT) describes water flows poorly in land with subsurface drainage because it does not partition water between macropore and matrix transport processes. We produced a new percolation algorithm to distinguish the macropore flow pathway, which was integrated in the SWAT-MAC model and used to predict water flows in a 30 km2 agricultural subwatershed in southern Quebec, Canada. Partitioning of subsurface flow between macropore and matrix components was reasonable, compared to a chemical-based hydrograph separation of streamflow in this subwatershed. The macropore flow algorithm also improved water allocation between the annual surface runoff and subsurface flow in the SWAT-MAC model. We predict more macropore flow into tile drains under fine-textured soils than coarse-textured soils, which is consistent with experimental observations. However, macropore flow was underestimated in the non-growing season and over-predicted during the growing season, which can be adjusted in the macropore flow algorithm by accounting for dynamic macropore connectivity or effective macroporosity. There are too few observations of regional-specific effects of soil moisture and management practices on macropore flow to correct the algorithm at this time. We conclude that the percolation algorithm of SWAT-MAC represents the macropore flow pathway and improves the description of water movement through agricultural soils with subsurface drainage systems, which are important for transferring water and nutrients to downstream aquatic systems in cold, humid temperate regions.
Introduction
The Soil and Water Assessment Tool (SWAT) is used widely for water quality modeling at the watershed scale (Gassman et al., 2007). In agricultural regions where land is systematically drained by installing subsurface tile drainage, such as in Quebec, Canada (Gollamudi, 2006; Michaud et al., 2009), it is important to describe accurately subsurface pathways that transport phosphorus (P) into tile drains, since P is a main cause of eutrophication in surface waters. An important pathway for P loss from soil is macropores, which include cracks and soil pores with minimum equivalent diameters of 0.3–0.5 mm (Jarvis, 2007). A greater proportion of water flows through macropores than the soil matrix, and the high water volume contributes to subsurface transport of P, particularly in fine-sized sediments (de Jonge et al., 2004; Vidon and Cuadra, 2011; Poirier et al., 2012).
Because SWAT (version 2005) overestimated runoff and underestimated tile drain flow in Quebec watersheds, a modified version of SWAT called SWAT-QC was developed to better predict the balance between surface and subsurface drainage (Michaud et al., 2008). Modifications to the SWAT-QC model increased the tile drainage from <100 mm per year to values that are closer to measured tile drainage volumes, which can be >200 mm per year in Quebec. However, surface runoff was still over-predicted and subsurface drainage was still under-predicted (Michaud et al., 2008). Moreover, neither SWAT nor SWAT-QC explicitly describe macropore flow for non-Vertisolic soils (Neitsch et al., 2011). Thus, a new algorithm was needed to partition percolating water into macropore and matrix flows, considering the factors that control macropore flow in non-Vertisolic soils of the cold, humid temperate region.
This study incorporates a macropore flow algorithm into SWAT, creating a new version of the model that is called the SWAT-MAC (Quebec version 2). This macropore flow algorithm considers soil properties and hydrologic factors that control macropore flow in Quebec soils. The main objective of this work is to demonstrate how this new percolation algorithm, which explicitly moves water into macropores in the SWAT model, will affect the predicted surface and subsurface water flows in an agricultural subwatershed in southern Quebec. A secondary objective was to validate the macropore flow estimated with SWAT-MAC by comparing the model output with results from a chemical-based hydrograph separation method for streamflow in the same agricultural subwatershed.
Materials and Methods
Default Percolation Algorithm in the Soil and Water Assessment Tool
The SWAT (version 2009) is a semi-distributed, watershed-scale hydrologic model with a daily time step that delineates subbasins from the stream network and topography, so that each subbasin has a main channel (Neitsch et al., 2011). Hydrologic response units (HRUs) within each subbasin are described according to their land use, soil, and topography. Within each HRU, the model calculates surface runoff, tile drainage, and groundwater resurgence transmitted to the main channel of each subbasin, which then flows to the watershed outlet (Neitsch et al., 2011).
The SWAT uses a modified Curve Number method (USDA-SCS, 1972) to partition the net precipitation between surface runoff and water that infiltrates the first or uppermost soil layer within each HRU. After water enters the first soil layer, the SWAT simulates the downward percolation of water using a “capacity-type approach”: if the water content (SWly, mm) exceeds the field capacity (FCly) in a soil layer, water moves from that layer to the soil layer immediately beneath it. The daily volume of percolation (mm) into a given soil layer depends on the SWly:
where SATly (mm) is the water content at saturation and Ksat, ly (mm h−1) is the saturated hydraulic conductivity, for the soil layer ly in Equation (1).
Modified Percolation Algorithm in the SWAT-MAC Model
Most SWAT versions assume that each soil layer of a non-Vertisolic soil is homogenous. In contrast, the SWAT-MAC divides each soil layer into a matrix domain and a macropore domain containing water that bypassed the soil matrix. Macropore flow is assumed to represent the water flowing downward through soil cracks, root channels, and burrows. Thus, macropore flow is part of the preferential flow pathway, which by definition includes water transferred through soil cracks and burrows, finger flow, and lateral flow (Allaire et al., 2009). In each HRU, the water in the macropore domain is then routed to tile drains (if tile drains are present) or into the vadose zone (if tile drains are not present).
In the SWAT-MAC, the daily water volume that enters the macropore domain (qmac, ly, mm) through preferential flow is determined for each soil layer from Equation (2) or (3), depending on the soil water content (SWly) relative to the field capacity (FCly):
where ICmat, ly is the daily infiltration capacity (mm) of the matrix domain of layer ly, and fly is the macropore connectivity factor (dimensionless value between 0 and 1) that the modeler adjusts during the calibration and validation steps for layer ly. The Ily represents the daily infiltration into layer ly from the soil surface or due to water percolating downward, through the matrix, from the overlying soil layer (mm), which is the same as the unmodified SWAT (version 2009).
In the SWAT-MAC, the infiltration capacity (ICmat, ly, mm) depends directly on the daily maximum amount of percolation (mm) from a soil layer, which occurs when the soil water content is at saturation [i.e., percolationly(SATly), from Equation (1)]. Infiltration capacity is calculated as:
where dly is the thickness (mm) of the soil layer ly defined from the soil input data, and CN1y (mm) is the curve number adjustment parameter.
The CNly values modify the infiltration capacity to account for the effect of the Curve Number method on infiltration into the uppermost soil layer (i.e., layer 1). Whereas infiltration (Ily) into the uppermost soil layer is the net precipitation reduced by the amount of runoff, the infiltration into the underlying soil layers (i.e., layers 2, 3, 4, etc.) is simply the matrix flow that percolates from the layer immediately above. Consequently, the CNly was set to 50 mm for layer 1 and 150 mm for all underlying layers in this study, based on the goodness-of-fit of curves describing the water movement through soil via preferential flow, deduced from experimental observation of soil profiles of tile-drained fields in the study region (Chikhaoui et al., 2008; Michaud et al., 2019). Because soil layer thickness (dly) and CNly both affect the infiltration capacity (Equation 4), the CNly values may depend on the soil layer thicknesses in the model input data for a particular site. In this study, the mean thickness of the underlying soil layers was 326 mm and the median thickness was 290 mm, based on 11 mineral soil profiles that were each 1,000 mm deep.
The macropore connectivity factor (fly) is the only factor in the modified percolation algorithm that is adjusted during calibration and validation, and it may be adjusted for each layer in each HRU. The fly indicates the degree of connectivity between macropores and tile drains (if tile drains are present) or between macropores and the vadose zone (if tile drains are absent). If all fly values are zero, the SWAT-MAC does not simulate macropore flow and gives identical output as the unmodified SWAT (version 2009).
Study Area
The Ewing subwatershed (32.2 km2) is located within the Pike River watershed, southern Quebec, Canada (Figure 1), which is an important tributary of Missisquoi Bay, Lake Champlain. Given the recurring issue of cyanobacterial blooms in the bay, intervening on the Pike River and other transboundary watersheds to reduce the influx of phosphorus to the bay is a priority for the governments of Quebec, Canada and the state of Vermont, USA (IJC, 2020).
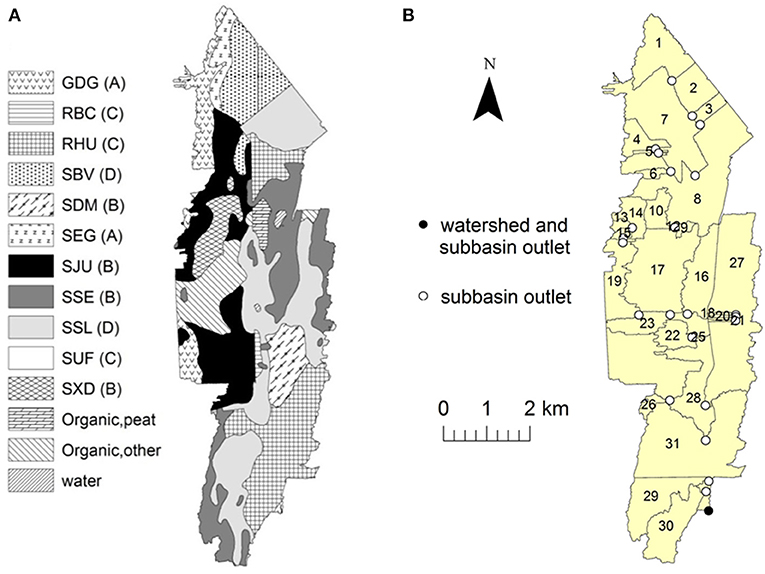
Figure 1. The Ewing subwatershed of the Pike River watershed in southern Quebec, Canada showing (A) the soils (and hydrologic soil groups in brackets), described in Table 1. (B) Location of outlets of the 31 subbasins and the watershed in the model watershed setup.
Ewing's land use is mainly agricultural on this flat (mean slope <1%) subwatershed. Soil types range from clayey Inceptisols to sandy Sposodols (Michaud et al., 2007). Agriculture is the dominant land use (98% of the area), and crops include grain corn (Zea mays L.) that is cultivated in rotation with soybeans (Glycine max (L.) Merr.), small grains and hay (perennial forages) (Figure 1). The subwatershed has an average (1981–2010) annual precipitation of approximately 1,100 mm, half of which falls between May and September, with about 200 mm snowfall each year. Average mean daily temperatures are 21°C in July and −9.1°C in January Environment Climate Change Canada (2020).
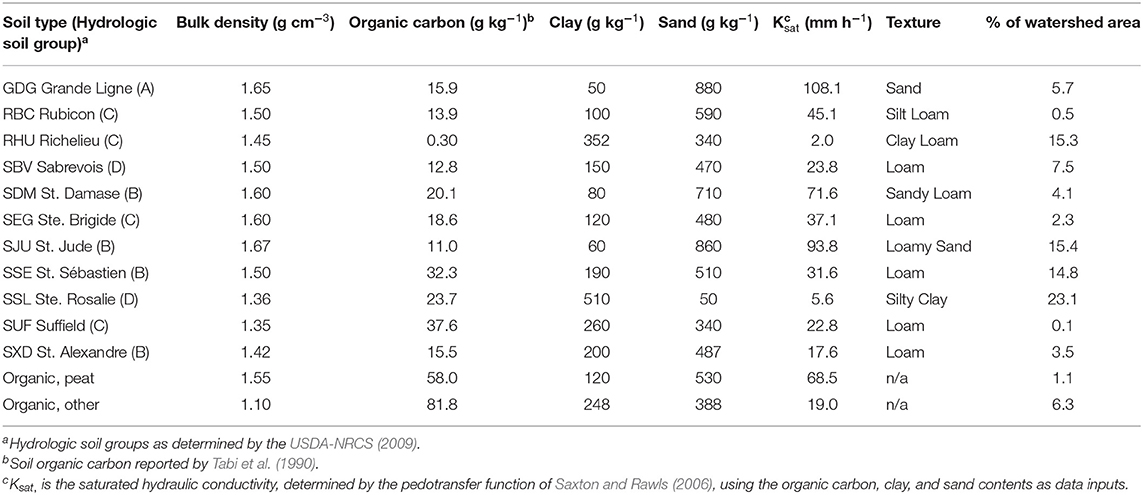
Table 1. Soil types and physico-chemical properties in the surface layer (0–15 cm) in the Ewing subwatershed of the Pike River watershed, southern Quebec, Canada.
Several studies have been conducted on the Ewing subwatershed and the transboundary Pike River watershed in the past two decades, for the purpose of describing phosphorus transfers from agricultural land use to downstream ecosystems. The current SWAT-MAC development builds from preceding work on monitoring and modeling hydrologic responses and nutrient fluxes within these watersheds. Chikhaoui et al. (2008); Poirier et al. (2012), and Michaud et al. (2019) gathered critical hydrometric observations describing preferential tile flows and nutrient fluxes at plot, field and micro-watershed scales within the study region, which provided experimental evidence for the percolation algorithm development and validation.
Parameterizing the SWAT Model for the Study Area
The graphical ArcSWAT interface was used to delineate 31 subbasins and 314 HRUs in the Ewing subwatershed using a soil map, a digital elevation model (DEM), and a land use map. The soil map (1:63,360) and the 1-m resolution DEM were obtained from the Institut de Recherche et de Développement en Agroenvironnement. Soil physico-chemical properties, including the saturated hydraulic conductivity (Ksat), are reported in Table 1. The land use map was for the 2008 growing season, as reported by Financière Agricole du Québec. (2011). The HRUs were defined with an 8% threshold that eliminated land uses that represent <1% of the watershed's area.
Daily precipitation and temperature from the weather archive of Environment Climate Change Canada (2020) was used for the model warm-up period (2001–2003), calibration (October 1, 2007 to September 30, 2010), and validation (October 1, 2004 to September 30, 2007). Potential evapotranspiration was estimated with the Penman-Monteith method. Model predictions of daily streamflow were compared with measurements from the Centre d'Expertise Hydrique du Québec.
All HRUs with annual crops were assumed to have tile drains. For HRUs with hay (perennial forages), tile drains were assumed to be present in the six HRUs of the soil hydrologic groups C and D but absent in the seven HRUs of the soil hydrologic groups A and B. Consequently, there were 2,100 ha of HRUs with tile drainage in the 3,000 ha model watershed. Drain depth was set at 900 mm, the time required for drains to fill to capacity was 24 h, and the time for drainage water to reach the nearest waterway was 12 h. For simplicity, we assumed no crop rotation occurred during the simulation period (2001–2010), and management schedules for each crop type were based on the common agronomic practices in this region.
Predictions of daily streamflow with the unmodified SWAT and SWAT-MAC were evaluated by visually comparing the hydrographs and with three statistics: (1) the Pearson correlation coefficient (r), (2) the Nash Sutcliffe coefficient (NSE), and (3) percent bias (PBIAS). Output from the calibrated and validated models was considered to be satisfactory when r >0.75, according to the recommendation of Donigan (2002) for a daily time step, and when NSE >0.50 and PBIAS < ±0.25 for a monthly time step, based on Moriasi et al. (2007).
Validation of the SWAT-MAC Output
After a satisfactory calibration was achieved for daily streamflow predictions with the unmodified SWAT, these calibrated parameter values (Table 2) were used for SWAT-MAC simulations. To determine how the SWAT-MAC's modified percolation algorithm affected the streamflow (water yield) and its components, the macropore connectivity factor (fly) was adjusted during SWAT-MAC simulations. Two scenarios were considered: fly = 0.15, which represents low macropore connectivity and fly = 0.35 that has high macropore connectivity. For simplicity, each soil layer in the HRUs was assigned the same value of fly in a particular SWAT-MAC simulation. No macropore flow is expected in organic soils (Watts and Dexter, 1998; Jarvis et al., 2009), so the fly was set to zero for all layers of organic soils, which represent 7.4% of the land area in the HRUs of the Ewing subwatershed (Michaud et al., 2009).
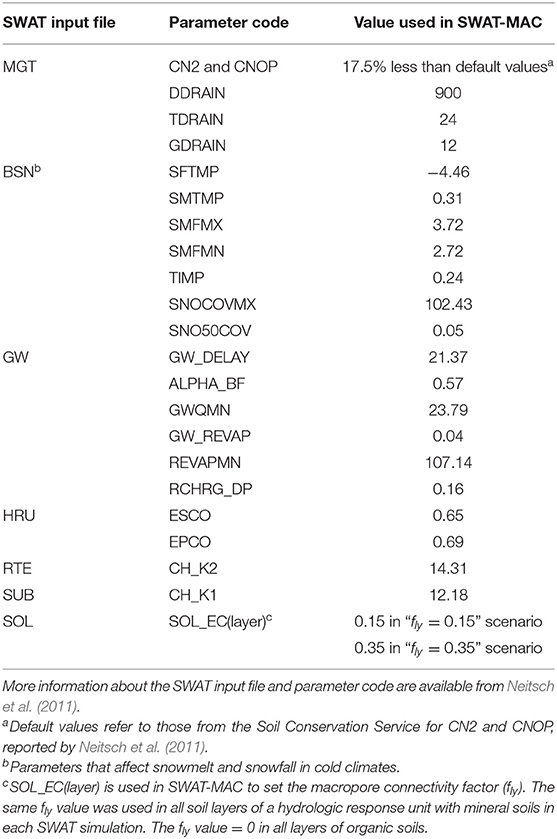
Table 2. Parameter values used in SWAT-MAC, taken from the unmodified SWAT after it was calibrated for the Ewing subwatershed of the Pike River watershed, southern Quebec, Canada.
The SWAT-MAC predicts field-level hydrologic processes that contribute to streamflow, and these predictions were compared to an independent set of streamflow estimates from a chemical-based hydrograph separation model described by Michaud et al. (2019). Briefly, the chemical-based hydrograph separation model relied on measurements of electrical conductivity in surface runoff and tile drainage water from 10 fields in the Ewing subwatershed, along with concurrent measurements of water quality at the Ewing subwatershed outlet, to separate the stream hydrograph into four components: surface runoff, water exiting the tile drainage through matrix flow, water exiting the tile drainage via preferential flow, and groundwater resurgence (Michaud et al., 2019). Preferential flow was the source of 30–44% of tile drainage discharge, and this percolating water contained about 75–88% of the total phosphorus that exited the subsurface drainage system. Monthly estimates of streamflow from the four-component hydrograph separation model were compared to simulations generated by the SWAT-MAC model for periods when water was not frozen (29 months in total) from July 2007 to November 2010. Predicted values from the SWAT-MAC model and the chemical-based hydrograph separation method were compared visually and with the r, NSE, and PBIAS statistics. We also discuss the similarity between SWAT-MAC simulations and the hydrograph separation of streamflow in the Ewing subwatershed based on an electrical conductivity time series (2007–2011), described by Umuhire et al. (2021).
Results
The calibration and validation of the daily streamflow was satisfactory for the unmodified SWAT and two SWAT-MAC scenarios of fly = 0.15, “low macropore connectivity” and fly = 0.35, “high macropore connectivity.” The fly = 0.15 and fly = 0.35 scenarios were as effective as unmodified SWAT in predicting peak flows (Figure 2), indicating that the modified percolation algorithm in SWAT-MAC does not affect the estimated streamflow value. Goodness-of-fit statistics in the calibration period were similar for unmodified SWAT and the SWAT-MAC scenarios (Table 3). In the validation period, descriptive statistics related to the streamflow prediction indicate less under-prediction bias with the SWAT-MAC scenarios than with the unmodified SWAT (Table 3).
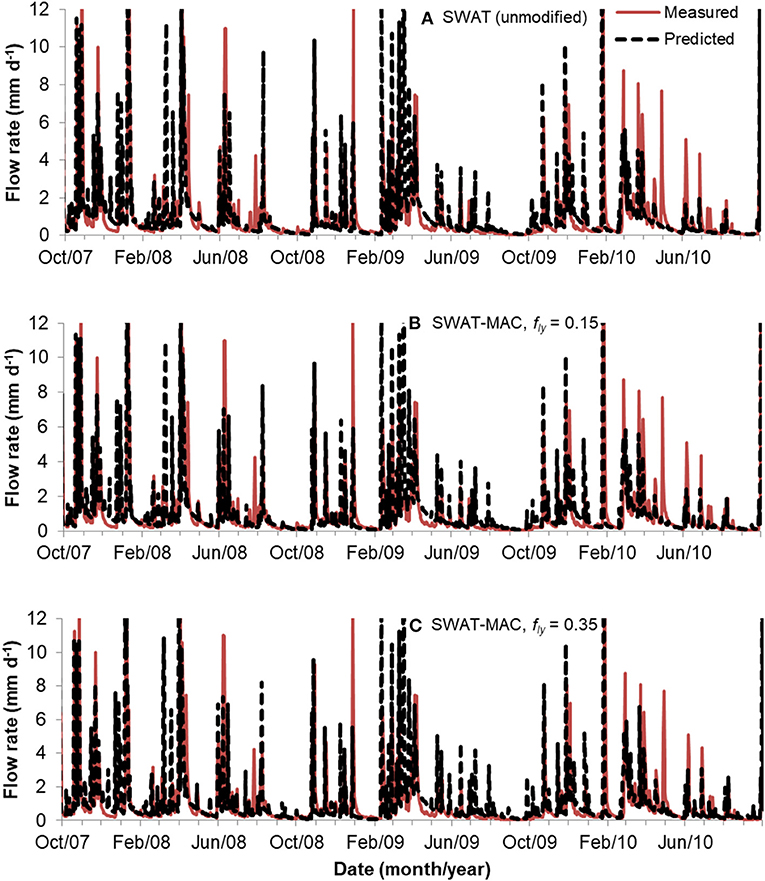
Figure 2. Simulated stream flow rates with (A) unmodified SWAT, (B) SWAT-MAC using 0.15 as the macropore connectivity factor (fly), and (C) SWAT-MAC using fly = 0.35. Flow rate is truncated at 12 mm d−1 so peaks <5 mm d−1 are visible.
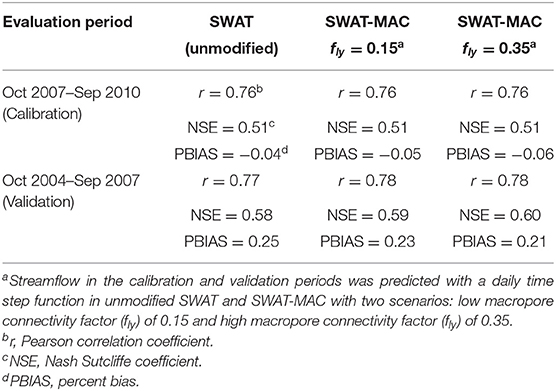
Table 3. Goodness-of-fit statistics for streamflow from the Ewing subwatershed of the Pike River watershed, southern Quebec, Canada.
Annual Water Balance: Surface and Subsurface Flows
The annual water balance calculated by the SWAT model is consistent with local observations and agri-environmental conditions in this region. Evapotranspiration was close to half of total precipitation, which is expected for southern Quebec (Deslandes et al., 2007). The annual water balance for unmodified SWAT and the SWAT-MAC scenarios predicted that approximately 55% of precipitation was lost through evapotranspiration and 40% left the Ewing subwatershed in streamflow from 2005 to 2010 (Table 4).

Table 4. Mean annual water balance in the Ewing subwatershed of the Pike River watershed, southern Quebec, Canada from 2005 to 2010, predicted by SWAT (unmodified) and SWAT-MAC with two scenarios: low macropore connectivity factor, fly = 0.15 and high macropore connectivity factor, fly = 0.35.
The tile drainage component of predicted total water yield was sensitive to fly, with an increase of 15% (16 mm) after increasing the fly from 0 to 0.15 and an increase of 37% (38 mm) in response to increasing the fly from 0 to 0.35 (Table 4). The predicted surface runoff was less sensitive, with a decrease of only 4% (5 mm) along the 0–0.15 fly gradient and a decrease of 10% (14 mm) along the 0–0.35 fly gradient. The sensitivity of tile drainage and surface runoff yields to the fly value depends on soil type. In HRUs with the Saint-Rosalie clay loam, surface runoff decreased by 23% (44 mm) and tile drainage yield increased by 103% (126 mm) when the fly increased from 0 to 0.35. For the Saint-Jude sandy loam, the effect of the 0–0.35 fly gradient on surface runoff water yield was minimal, and greater macropore connectivity only slightly increased (by 9.6 mm) the tile drainage water yield.
Subsurface Water Balance: Macropore and Matrix Flow Through Tile Drains
The amount of water in tile drainage predicted from SWAT-MAC scenarios (fly = 0.15 and fly = 0.35) was correlated (monthly r > 0.67) with the water volume through tile drainage estimated by the four-component hydrograph separation method of Michaud et al. (2019) (Figures 3A,B; Table 5). The fly = 0.15 scenario predicted macropore flow through tile drainage with a positive NSE value when compared to the hydrograph separation method. The fly = 0.15 scenario tended to under-estimate the macropore flow through tile drainage, while the fly = 0.35 scenario over-predicted the macropore flow through tile drainage (Figures 3A,B; Table 5). Overall, the SWAT-MAC prediction of Ewing streamflow separation during the 2005–2010 period is consistent with Umuhire et al. (2021), who determined that 22–44% of the total water yield from April–November comes from rapid flow pathways, which are conceptually equivalent to the surface runoff and preferential flow through tile drainage. The SWAT-MAC results predict that surface runoff and preferential flow through tile drainage (delivered by macropores) sums to 39% (fly = 0.15 scenario) and 45% (fly = 0.35 scenario) of total water yield during the same measurement period. Hence, this is additional corroborating evidence that the percolation algorithm is representing a realistic amount of macropore flow in these soils.
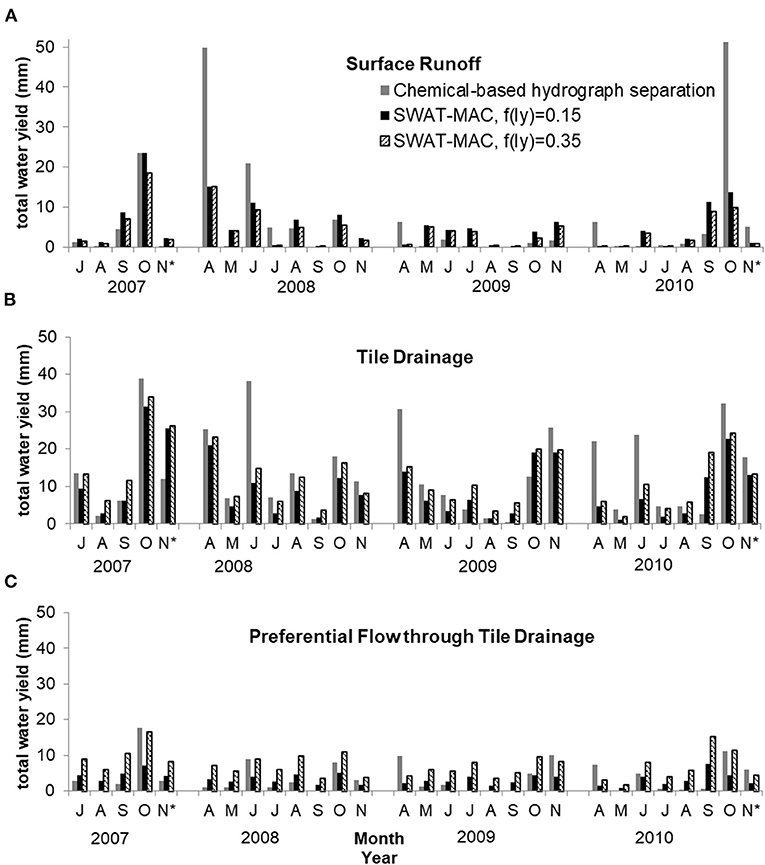
Figure 3. Monthly water level (mm) in streamflow originating from in-field hydrologic sources in the Ewing subwatershed, partitioned into (A) surface runoff, (B) tile drainage, and (C) preferential flow through tile drainage. The preferential flow was assumed to be water moving through macropores. Monthly data estimated from a four-component hydrograph separation model is plotted along with predictions from SWAT-MAC using fly = 0.15 and fly = 0.35 as the macropore connectivity factor (fly). Asterisks (*) indicate months for which the last week of results were not available.
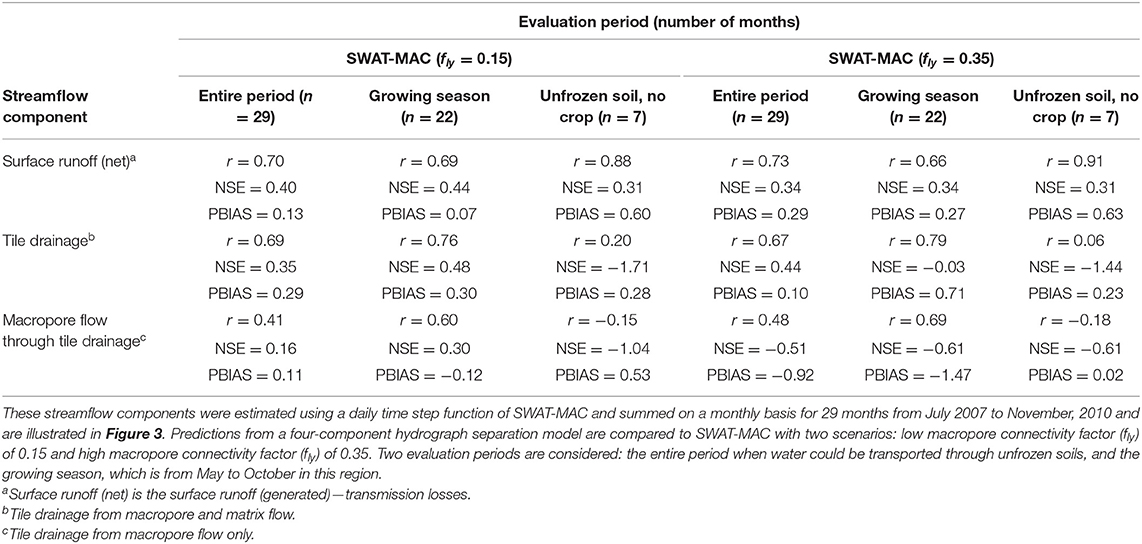
Table 5. Goodness-of-fit statistics for surface runoff, tile drainage and macropore flow through tile drainage from the Ewing subwatershed of the Pike River watershed, southern Quebec, Canada.
Fine-textured soils were responsible for more of the macropore flow that moved water to streamflow, according to the SWAT-MAC model. In this study, the amount of macropore flow and tile drainage volume increased as fly and the clay content of the soils increased, based on annual estimates from the SWAT-MAC (Table 6). Concurrently, the annual surface runoff decreased as fly and the clay content of the soils increased.
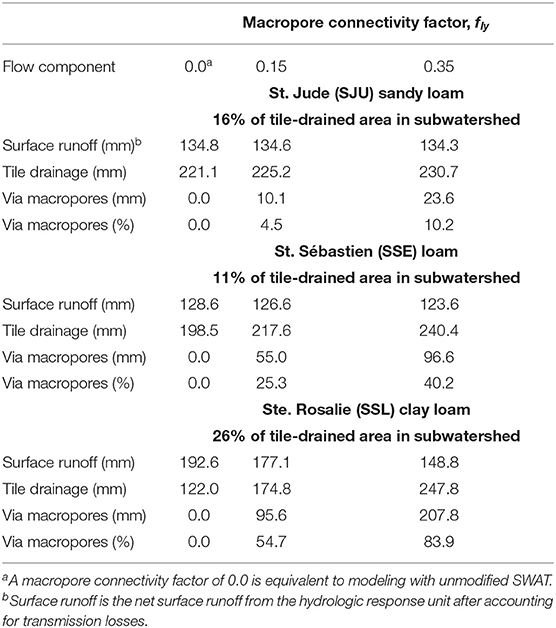
Table 6. Mean annual surface runoff, tile drainage, and macropore flow predicted by SWAT-MAC under tile-drained areas of the three main soils in the Ewing subwatershed of the Pike River watershed, southern Quebec, Canada, for 6 years (2005–2010).
Although annual estimates were generally robust, the seasonal variation in water flow does not align perfectly between the SWAT-MAC model and the hydrograph separation method. This is due, in part, to the seasonal fluctuations in water flow pathways in this agroclimatic region. On a seasonal basis, Umuhire et al. (2021) estimated that rapid flow pathways delivered 48% of the total water yield in spring, and this declined to 20 and 36% of the total water yield in summer and fall, respectively, based on an electrical conductivity signal-based flow separation method.
Omitting the water fluxes from April and November improved the goodness-of-fit for surface runoff and macropore flow in the SWAT-MAC scenarios for the growing season (May to October, representing 22 months of the 29 month simulation from July 2007 to November 2010) according to the evaluation statistics in Table 5. We can accept the macropore flow estimate during this 22 month period when macropore connectivity was set at fly = 0.15 in the SWAT-MAC because the value was comparable to the preferential flow calculated in the hydrograph separation method (monthly r = 0.60, NSE = 0.30), according to the criteria of Moriasi et al. (2007). During the 7 months when soils are not frozen but no crop is growing (i.e., the months of April and November during the 29 month simulation from July 2007 to November 2010), the best macropore flow estimate was obtained when macropore connectivity was assumed to be fly = 0.35 (Figure 3C). We also considered that October could be in the non-growing season, since crops reach physiological maturity at this time of year, which reduces evapotranspiration. When April, October and November were considered to have fly = 0.35, this increased the monthly NSE from −0.44 to 0.30 for the macropore flow component and had minimal change effect on the water volume in surface runoff and tile drainage that was predicted by the SWAT-MAC model (Figure 3C).
Discussion
The percolation algorithm of the SWAT-MAC model allowed more water to be routed through subsurface tile drainage while reducing surface runoff, without negatively impacting streamflow predictions. The streamflow predictions were similar or better aligned with in-field observations compared to the unmodified SWAT. Since, the main objective of this study was to describe how the new algorithm impacts the hydrologic flow pathways, the same parameters from the calibration of the unmodified SWAT model were used for the SWAT-MAC scenarios. It may have been possible to improve the SWAT-MAC streamflow predictions with additional calibration, including fly as a calibration parameter. Such procedure was applied to the David River watershed (323 km2) that is within the same physiographic Montérégie region as the Ewing watershed. SWAT-MAC was used to predict the effects of controlled drainage and climate change scenarios (Michaud et al., 2018), where fly was optimized at 0.30 for subsurface drained HRUs following model calibration. The projected tile water yield averaged 238 mm per year for the 1985–2015 period, which is similar to the 251 mm yearly average at field sites monitored for subsurface drainage discharge and nutrients during the 2014–2017 period.
The new percolation algorithm does not overcome limitations of the snowfall and snowmelt algorithms in the SWAT model (Levesque et al., 2008), which remain uncertain in cold humid temperate regions. However, the percolation algorithm does not affect SWAT's use of the empirical Curve Number method to partition surface water between surface runoff and infiltration. Still, Perrone and Madramootoo (1998) suggested adjusting these empirical relationships, which are based on data mostly from the midwestern United States, when applying the Curve Number method to predict runoff in the southern Quebec region. This led Deslandes et al. (2007) and Michaud et al. (2007) to reduce the default curve numbers, described by Neitsch et al. (2011), by 20% for the unmodified SWAT model to estimate annual runoff yields accurately. In this study, the default curve numbers were reduced by 17.5% in all model simulations.
Spatial Variation in Water Flow Predictions
Rather than decreasing curve numbers to reduce surface runoff, the new percolation algorithm developed for SWAT-MAC will increase tile drainage according to soil properties, resulting in greater potential for macropore flow to tile drainage in fine-textured soils than coarse-textured soils. The hydrograph separation method (Michaud et al., 2019) indicates that macropore connectivity (fly) between 0.15 and 0.35 will represent the water flow through macropores when soils are unfrozen from April to November. Choosing the appropriate fly value is more important for fine-textured soils, which have more macropores and the greatest potential for macropore flow. Chemical-based hydrograph separation of tile drain discharge revealed that 70% came from macropore flow in a field with clay loam soil and 20% was from macropore flow in a sandy loam soil in the Pike River watershed (Chikhaoui et al., 2008). In fields with annual crops <30 km southeast of the Ewing subwatershed, the surface runoff was 25–30% of total annual drainage from a clay loam field and between 13 and 23% of total annual drainage from a sandy loam field (Eastman et al., 2010). The estimated values from the SWAT-MAC model and hydrograph separation methods will need to be validated with experimental measurements of macropore flow in the major soil types of the study area, but the percolation algorithm provides the modeler with the option to increase macropore flow based on soil properties that vary spatially (among HRUs), by adjusting a single factor (fly).
The SWAT-MAC model partitioned the subsurface flow reasonably, compared with results from the chemical-based hydrograph separation method. The subsurface transport of P increases with greater proportions of subsurface water that flows through macropores relative to the soil matrix, particularly in fine-sized sediments (Vidon and Cuadra, 2011; Poirier et al., 2012). Without the percolation algorithm developed for SWAT-MAC, the model predictions of subsurface drainage flow would not be partitioned at all between macropore and matrix flow components.
Temporal Variation in Water Flow Predictions
The temporal water flow during the growing season was represented better with the SWAT-MAC model, based on its ability to represent peak events in the summer and fall months that were not described at all by the unmodified SWAT. However, the overall improvement of streamflow prediction was minimal because of difficulty to represent larger peak flow events in the spring, which are largely controlled by snowmelt and infiltration processes that are not fully explained by the SWAT model in cold, humid temperate regions. In another study in the Pike River watershed, the unmodified SWAT did not predict water outflows from agricultural fields after heavy rainfall events during the summer (Deslandes et al., 2007). Macropore flow is responsible for much of the water leaving fields in tile drainage, according to the hydrograph separation method, hence it appears that the percolation algorithm in the SWAT-MAC model can represent water moving through the preferential flow pathway in these soils.
Our results suggest that macropore connectivity is dynamic throughout the year, since a constant fly value in the SWAT-MAC model does not reflect the temporal variation in macropore flow. The best fit was achieved with a low fly = 0.15 during the growing season (approximately May–October) and a high fly = 0.35 when soils were not frozen and had no growing crop (i.e., in the months of April and November). Conceptually, changes in fly values should reflect physical changes in how the macropores are connected through a soil profile with tile drains. Greater macropore connectivity occurs when soil cracks upon drying near the end of the growing season in southern Ontario (Frey et al., 2012) and in Sweden (Messing and Jarvis, 1993). Management could change macropore connectivity, since secondary tillage breaks up macropores and reduces the hydraulic conductivity of soils (Starr, 1990; Cullum, 2009). Most of the agricultural land in the Ewing subwatershed is tilled with a secondary tillage implement (e.g., disk harrow, vibrating tine harrow) before the crop is planted. This could be responsible for lower fly and hence less macropore flow during the growing season. These possibilities still need to be evaluated under realistic field conditions.
The percolation algorithm considers macropore connectivity, but it does not fully describe the antecedent soil moisture at the time of a rainfall event, which determines how much water will be displaced from the soil matrix and move into the macropores. Macropore flow typically begins when soil water pressure approaches −10 to −6 cm (Jarvis, 2007), which can occur with low rainfall intensity in a soil that is already near field capacity, the usual condition in an unfrozen soil with no growing crop (i.e., in the months of April and November) in this region. Macropore flow was observed in silt loam and clay loam soils when soil moisture was above field capacity, at all tested rainfall intensities (as low as 1 mm h−1) (Coles and Trudgill, 1985). In silty to sandy loam soils, macropore flow occurred in wet, but not necessarily ponded soils, at a rainfall intensity of about 2 mm h−1 (Villholth et al., 1998). The percolation algorithm considers that soil moisture below field capacity reduces the fraction of excess infiltration that becomes macropore flow in direct proportion to SWly/FCly (see Equations 2 and 3). However, the algorithm does not consider how soil moisture at or above field capacity affects water flow through macropores between soil layers. This is a common problem in hydrologic models, which led Malone et al. (2001) to suggest that the Root Zone Water Quality Model would better describe macropore flow if it incorporated a dynamic effective macroporosity to recognize that more macropores transmit water (and increase soil hydraulic conductivity) as rainfall or soil moisture increases. In conclusion, the percolation algorithm needs an additional soil moisture factor to describe the water partitioning between the soil matrix and macropores, since this affects the volume and chemistry of soil water that enters streamflow and moves to downstream environments.
Conclusions
A new percolation algorithm was added to the SWAT model to generate the SWAT-MAC (Quebec version 2). The percolation algorithm reflects the surface-subsurface water flows from agricultural fields at the subwatershed scale. The percolation algorithm gave a reasonable prediction of subsurface flow partitioning into macropore and matrix flow pathways, based on comparison with streamflow components derived from a chemical-based hydrograph separation method in this subwatershed. Soil texture was responsible for spatial variation in macropore flow across the landscape. Seasonal variation in macropore flow was attributed to temporal change in macropore structure (i.e., macropore connectivity) or the portion of macropores that transmit water (i.e., effective macroporosity) in these fields. Experimental measurements of soil macroporosity are needed to select the appropriate macropore connectivity (fly) values in dynamic field environments. We also recommend that the percolation algorithm be updated to include a soil moisture factor that describes water transfer between the soil matrix and macropores during the growing season. This will be accomplished by taking site-specific measurements that consider the major soil types and management practices in the study region.
The new percolation algorithm is an essential step towards better prediction of P losses from agricultural watersheds where preferential flow significantly contributes to P transport to surface water via macropores that are connected to subsurface drains. In these watersheds, the SWAT-MAC model allows for partitioning of subsurface water into macropore and matrix flow pathways. The next logical step will be to consider water as a carrier for dissolved and particulate-bound P compounds, to predict P transport through macropores.
Data Availability Statement
The original contributions presented in the study are included in the article/supplementary material, further inquiries can be directed to the corresponding author/s.
Author Contributions
DP: conceptualization, investigation, writing—original draft and validation. JW: writing—review and editing. AM: conceptualization and writing—review and editing. All authors contributed to the article and approved the submitted version.
Funding
Financial support was from the Partnership Program on Cyanobacteria of the Fonds de Recherche sur la Nature et les Technologies du Quebec. DP received a postgraduate scholarship from the Natural Sciences and Engineering Research Council of Canada.
Conflict of Interest
The authors declare that the research was conducted in the absence of any commercial or financial relationships that could be construed as a potential conflict of interest.
Publisher's Note
All claims expressed in this article are solely those of the authors and do not necessarily represent those of their affiliated organizations, or those of the publisher, the editors and the reviewers. Any product that may be evaluated in this article, or claim that may be made by its manufacturer, is not guaranteed or endorsed by the publisher.
Acknowledgments
We appreciate the technical assistance of Isabelle Beaudin and Colline Gombault with the SWAT model, and Simon-Claude Poirier for sharing experimental data to validate the model. We thank Leanne Ejack for helpful review of an earlier version of this manuscript.
References
Allaire, S. E., Roulier, S., and Cessna, A. J. (2009). Quantifying preferential flow in soils : a review of different techniques. J. Hydrol. 378, 179–204. doi: 10.1016/j.jhydrol.2009.08.013
Chikhaoui, M., Madramootoo, C., Eastman, M., and Michaud, A. (2008). “Estimating preferential flow to agricultural tile drains,” in Proc. 2008 ASABE Ann. Intl. Meet. American Society of Agricutural and Biological Engineers, (St. Joseph, MI).
Coles, N., and Trudgill, S. (1985). The movement of nitrate fertilizer from the soil surface to drainage waters by preferential flow in weakly structured soils, Slapton, South Devon. Agric. Ecosyst. Environ. 13, 241–259. doi: 10.1016/0167-8809(85)90014-3
Cullum, R. F. (2009). Macropore flow estimations under no-till and till systems. Catena 78, 87–91. doi: 10.1016/j.catena.2009.03.004
de Jonge, L. W., Moldrup, P., Rubaek, G. H., Schelde, K., and Djurhuus, J. (2004). Particle leaching and particle-facilitated transport of phosphorus at field scale. Vadose Zone J. 3, 462–470. doi: 10.2136/vzj2004.0462
Deslandes, J., Beaudin, I., Michaud, A., Bonn, F., and Madramootoo, C. A. (2007). Influence of landscape and cropping system on phosphorus mobility within the Pike River watershed of southwestern Quebec: model parameterization and validation. Can. Wat. Res. J. 32, 24–42. doi: 10.4296/cwrj3201021
Donigan, A. S. (2002). “Watershed model calibration and validation: the HSPF experience,” in Proc. WEF National TMDL Science and Policy 2002, (Phoenix, AZ).
Eastman, M., Gollamudi, A., Stämpfli, N., Madramootoo, C. A., and Sarangi, A. (2010). Comparative evaluation of phosphorus losses from subsurface and naturally drained agricultural fields in the Pike River watershed of Quebec, Canada. Agric. Wat. Manage. 97, 596–604. doi: 10.1016/j.agwat.2009.11.010
Environment Climate Change Canada (2020). Monthly Meteorological Summaries for Philipsburg. Atmospheric Environment Branch, Environment and Climate Change Canada, Ottawa, ON, Canada. Available online at: https://climate.weather.gc.ca/ (accessed June 24, 2020).
Financière Agricole du Québec. (2011). État des Cultures. Gouvernement du Québec. Available online at: http://www.fadq.qc.ca/acces_medias/evenements/etats_des_cultures/etat_des_cultures_2011.html (accessed December 15, 2011).
Frey, S. K., Rudolph, D. L., and Parkin, G. W. (2012). Spatial and temporal influences on hydraulic properties in macroporous tile-drained soil. Soil Sci. Soc. Am. J. 76, 350–360. doi: 10.2136/sssaj2011.0194
Gassman, P. W., Reyes, M. R., Green, C. H., and Arnold, J. G. (2007). The soil and water assessment tool: historical development, applications, and future research directions. Trans. ASABE. 50, 1211–1250. doi: 10.13031/2013.23637
Gollamudi, A. (2006). Hydrological and Water Quality Modeling of Agricultural Fields in Quebec. MSc thesis, McGill University, Montreal, QC, Canada.
IJC (2020). Nutrient Loading and Impacts in Lake Champlain – Missisquoi Bay and Lake Memphremagog. International Joint Commission (IJC). p. 220. Available online at: https://www.ijc.org/en/lclm/nutrient-loading-and-impacts-lake-champlain-missisquoi-bay-and-lake-memphremagog (accessed June 10, 2021).
Jarvis, N. J. (2007). A review of non-equilibrium water flow and solute transport in soil macropores: principles, controlling factors and consequences for water quality. Eur. J. Soil Sci. 58, 523–546. doi: 10.1111/j.1365-2389.2007.00915.x
Jarvis, N. J., Moeys, J., Hollis, J. M., Reichenberger, S., Lindahl, A. M. L., and Dubus, I. G. (2009). A conceptual model of soil susceptibility to macropore flow. Vadose Zone J. 8, 902–910. doi: 10.2136/vzj2008.0137
Levesque, E., Anctil, F., van Griensven, A., and Beauchamp, N. (2008). Evaluation of streamflow simulation by SWAT model for two small watersheds under snowmelt and rainfall. Hydrol. Sci. J. 53, 961–976. doi: 10.1623/hysj.53.5.961
Malone, R. W., Shipitalo, M. J., Ma, L., Ahuja, L. R., and Rojas, K. W. (2001). Macropore component assessment of the root zone water quality model (RZWQM) using no-till soil blocks. Trans. ASAE. 44, 843–852. doi: 10.13031/2013.6249
Messing, I., and Jarvis, N. J. (1993). Temporal variation in the hydraulic conductivity of a tilled clay soil as measured by tension infiltrometers. J. Soil Sci. 44, 11–24. doi: 10.1111/j.1365-2389.1993.tb00430.x
Michaud, A., Macrae, M. L., Niang, M., and Hanke, K. (2018). Managing Subsurface Drainage Water to Optimize Crop Productivity, Nutrient Use, and Water Availability in Contemporary and Future Climate. IRDA. 154 p. Available online at: https://irda.blob.core.windows.net/media/5487/michaud-et-al-2018-managing_subsurface_drainage_water_to_optimize_crop_productivity_nutrient_use_and_water_availability_in_contemporary_and_future_climate_report.pdf (accessed June 12, 2021).
Michaud, A., Ruyet, F., and Beaudin, I. (2009). Évaluation des Outils de Gestion groenvironnementale à l'Échelle du Bassin Versant dans un Cadre Opérationnel de Service-Conseil à la Ferme - Dans le Cadre du Projet Lisière Verte. Québec City, QC: IRDA, Coopérative de solidarité du bassin versant de la rivière au Brochet, Dura-Club, AAC (PASCAA) et MAPAQ. Available online at: https://www.irda.qc.ca/fr/publications/ (accessed on June 12, 2021).
Michaud, A., Seydoux, S., Beaudin, I., and Gombault, C. (2008). Beneficial Management Practices and Water Quality: Hydrological Modelling of Two Basins in the Montérégie Region (Quebec). National Agri-Environmental Standards Initiative Technical Series Report No. 4–65. p. 129.
Michaud, A. R., Beaudin, I., Deslandes, J., Bonn, F., and Madramootoo, C. A. (2007). SWAT-predicted influence of different landscape and cropping systems alterations on phosphorus mobility within the Pike River watershed of South-western Quebec. 2007. Canad. J. Soil Sci. 87, 329–344. doi: 10.4141/S06-046
Michaud, A. R., Poirier, S.-C., and Whalen, J. K. (2019). Tile drainage as a hydrologic pathway for phosphorus export from an agricultural subwatershed. J. Environ. Qual. 48, 64–72. doi: 10.2134/jeq2018.03.0104
Moriasi, D. N., Arnold, J. G., Van Liew, M. W., Bingner, R. L., Harmel, R. D., and Veith, T. L. (2007). Model evaluation guidelines for systematic quantification of accuracy in watershed simulations. Trans. ASABE. 50, 885–900. doi: 10.13031/2013.23153
Neitsch, S. L., Arnold, J. G., Kiniry, J. R., and Williams, J. R. (2011). Soil and Water Assessment Tool: Theoretical Documentation, Version 2009. Temple, TX.
Perrone, J., and Madramootoo, C. A. (1998). Improved curve number selection for runoff prediction. Can. J. Civil Eng. 25, 728–734. doi: 10.1139/l98-007
Poirier, S.-C., Michaud, A. R., and Whalen, J. K. (2012). Bioavailable phosphorus in fine-sized sediments transported from agricultural fields. Soil Sci. Soc. Am. J. 76, 258–267. doi: 10.2136/sssaj2010.0441
Saxton, K. E., and Rawls, W. J. (2006). Soil water characteristic estimates by texture and organic matter for hydrologic solutions. Soil Sci. Soc. Am. J. 70, 1569–1578. doi: 10.2136/sssaj2005.0117
Starr, J. L. (1990). Spatial and temporal variation of ponded infiltration. Soil Sci. Soc. Am. J. 54, 629–636. doi: 10.2136/sssaj1990.03615995005400030001x
Tabi, M., Tardif, L., Carrier, D., Laflamme, G., and Rompré, M. (1990). Rapport Régional de la Région Agricole 6, Richelieu, Saint-Hyacinthe. Ministère de l'Agriculture, des Pêcheries et de l'Alimentation du Québec, Quebec.
Umuhire, F., Anctil, F., Michaud, A. R., and Desjardins, J. (2021). Evaluation of filtring methods for hydrograph separation in small agricultural watersheds in Québec, Canada. Trans. ASABE. 63, 981–1005. doi: 10.13031/trans.13434
USDA-NRCS (2009). “Chapter 7 Hydrologic Soil Groups,” in Part 630 Hydrology National Engineering Handbook, [Washington, DC. United States Department of Agriculture, Natural Resources Conservation Service (USDA-NRCS)]. Available online at: http://soils.usda.gov/technical/handbook/ (accessed June 12, 2021).
USDA-SCS (1972). “Chapter 10: Estimation of direct runoff from storm rainfall” in National Engineering Handbook, Supplement A, Section 4, Hydrology, (Washington, DC. United States Department of Agriculture, Soil Conservation Service). Available online at: https://directives.sc.egov.usda.gov/OpenNonWebContent.aspx?content=18393.wba (accessed June 12, 2021).
Vidon, P., and Cuadra, P. E. (2011). Phosphorus dynamics in tile-drain flow during storms in the US Midwest. Agric. Wat. Manage. 98, 532–540. doi: 10.1016/j.agwat.2010.09.010
Villholth, K. G., Jensen, K. H., and Fredericia, J. (1998). Flow and transport processes in a macroporous subsurface-drained glacial till soil - I: field investigations. J. Hydrol. 207, 98–120. doi: 10.1016/S0022-1694(98)00129-2
Keywords: SWAT model, preferential transport, matrix flow, algorithm, artificial tile drainage, subsurface water, leaching, vadose zone
Citation: Poon D, Whalen JK and Michaud AR (2021) Re-conceptualizing the Soil and Water Assessment Tool to Predict Subsurface Water Flow Through Macroporous Soils. Front. Water 3:704291. doi: 10.3389/frwa.2021.704291
Received: 02 May 2021; Accepted: 21 June 2021;
Published: 26 July 2021.
Edited by:
Silvio Gumiere, Laval University, CanadaReviewed by:
Pei Wang, Beijing Normal University, ChinaXianhong Xie, Beijing Normal University, China
Copyright © 2021 Poon, Whalen and Michaud. This is an open-access article distributed under the terms of the Creative Commons Attribution License (CC BY). The use, distribution or reproduction in other forums is permitted, provided the original author(s) and the copyright owner(s) are credited and that the original publication in this journal is cited, in accordance with accepted academic practice. No use, distribution or reproduction is permitted which does not comply with these terms.
*Correspondence: Joann K. Whalen, am9hbm4ud2hhbGVuQG1jZ2lsbC5jYQ==