 Kenneth E. Okedu
 Mohsin Said Al Siyabi
94% of researchers rate our articles as excellent or good
Learn more about the work of our research integrity team to safeguard the quality of each article we publish.
Find out more
ORIGINAL RESEARCH article
Front. Water, 15 July 2021
Sec. Water and Climate
Volume 3 - 2021 | https://doi.org/10.3389/frwa.2021.686856
This article is part of the Research TopicWater Harvesting Methods in Drylands to Increase Climate ResilienceView all 8 articles
Hydropower technology is a simple and renewable form of energy that involves the conversion of potential energy due to head and mass flow rate of water into kinetic energy that drives a water turbine connected to a generator. In this paper, the potential of hydropower in the Sultanate of Oman is studied, considering Wadi Dayqah Dam in Quriyat. The following variables of the dam were used in evaluating its potential for electricity generation for the year 2010 through 2018: the amount of water flowing in and out of the dam and the amount of water available in the dam at the beginning and end of the considered years. A recommendation was made for the type of hydro turbine for maximum power extraction from the dam, based on the available water head and flow rate, considering the standard characteristic selection envelope for hydro turbines. Power generation from the dam could be affected as a result of the decline in reservoir water level, the continuous release of water for irrigation purposes, fear of the aftermath of a cyclone, lack of rains for consecutive years, and high evaporation. However, the occurrence of a cyclone increases the reservoir water level of the dam for more power generation. Some long-term scenarios for effective operation of the dam considering water availability and management were discussed. In addition, some ways of mitigating water loss from the reservoir of the dam through evaporation were proposed.
The use of hydropower for electricity generation dates back to the late nineteenth century (International Renewable Energy Agency, 2015), and presently, over 160 countries in the world make use of this technology for power solutions (IEA, 2008; Ecofys, 2011). The installed global hydropower capacity in the last few years has contributed over 16% of electricity supply to the world (IEA, 2012; Working Group III Mitigation of Climate Change, 2017), and presently, this technology still remains one of the highest renewable energy sources in generation of electricity (Gagnon et al., 2002; Berga, 2008; Gagnon, 2008). Apart from electricity generation, the technology of hydropower could be very useful in irrigation purposes, control of flood, and means of water reservoirs. Hydropower technology seems to be very flexible in its operation because its reservoirs possess energy storage capacity which could enhance fast response to electricity demand fluctuations in grid networks (Paish, 2002; Adhikari and Wood, 2017, 2018). This control strategy leads to the optimized production of electricity and the effective control of loss of power from other energy sources in the grid network.
There are two basic configurations of the hydropower scheme: dams with reservoir scheme and run-of-the-river with no reservoir scheme (Gorla and Perona, 2013; Novak et al., 2014; Nasir, 2017; Rotilio et al., 2017). The earlier scheme can be divided to small dams having regulations at night and day times or large dams having storage that are seasonal or pumped typed (U.S. Department of the Interior Bureau of Reclamation Power Resource Office, 2005; International Renewable Energy Agency, 2015). The run-of-the-river scheme is usually employed in small hydropower technology (Schramm et al., 2016; Botelho et al., 2017; Reichl and Hack, 2017), with little or no environmental impacts, compared with large hydropower plants that could raise both environmental and social concerns due to their effects on water availability, ecosystems, and population in the region.
In hydropower schemes, the water turbine is the main component; therefore, improving the efficiency of the water turbine is of paramount interest. The efficiency of the water turbine generally is related to output power increase with minimal cost. Theoretically, the water turbine efficiency is the ratio of power extracted to the mass flow rate, gravity, and head of the water turbine (Acharya et al., 2015; Sammartano et al., 2016; Židonis and Aggidis, 2016). The following parameters are used to determine the potential energy capability or production in a hydropower system: the volume or amount of water in the dam; flood spill water loss, bypass, or leakage; the head; hydraulic losses due to water friction with respect to change in velocity; and electromechanical energy conversion efficiency of the system (Adhikari, 2016; Working Group III Mitigation of Climate Change, 2017). Usually, some amount of water will be lost during the operation of the water turbine; hence, the amount of water intake is not always fully utilized by the water turbines.
The efficiency of modern turbines is very high in transforming mechanical to electrical energy (Sammartano et al., 2013), compared with older water turbines due to water sediments leading to wear and abrasion (Working Group III Mitigation of Climate Change, 2017). However, inefficiency may result because of water circuit hydraulic losses that occur on the water intake, water turbine, and tailrace of the system; turbo-generator mechanical losses; and electrical generator losses. Consequently, the total efficiency of the hydropower scheme depends on the components of the above losses. The different turbine types with their efficiencies employed in hydropower technology have been reported in the studies of Vinogg and Elstad (2003), Uhunwangho and Okedu (2009), and Uhunmwangho et al. (2018), and it was concluded that the best turbines that could be used for maximum power efficiencies are the Pelton, Kaplan, and Francis, respectively.
Some representative examples of hydropower installations in Italy, France, Switzerland, Belgium, and the USA were carried out by Quaranta et al. (2020), where the case studies covered ecologically improved and low head hydropower converters (vortex turbine, hydrostatic pressure machine, turbines, and hydrokinetic turbines), hydropeaking reduction, new control systems, governors, and digitalization. The authors of this paper proposed hydropower as a strategy for local sustainable development and energy recovery in existing hydraulic infrastructures and aqueducts. In the study of Kougias et al. (2019), analysis of emerging technologies in the hydropower sector was carried out, while determination of optimal rotational speed of some hydropower turbines was carried out by Quaranta (2019). The revival of old hydraulic turbines for innovative hydropower generation was carried out by Quaranta (2020), where optimal hydropower was extracted using old turbines, instead of phasing them out. In the studies of Quaranta and Müller (2018) and Metzler and Pelz (2015), the application of low head hydropower turbine for optimal operation was reported using water wheels and the draft tube design, respectively. The technology of an uplift pressure and hydraulic gradient was reported by Norouzi et al. (2020) for Sabalan dam in Iran. The paper was able to determine the factors affecting the maximum and minimum water discharges in the dam based on the surrounding environmental factors. The numerical investigation of the optimal location of vertical drains and granular filters was reported by Nourani et al. (2017) and Jafari et al. (2019), respectively. The harnessing of hydropower in Malaysia and the southern part of Nigeria was presented by the International Water Power Dam Construction (2020) and Okedu et al. (2020), respectively. The International Water Power Dam Construction (2020) shows that as a way of moving forward in hydropower technology, there is potential for hydro pumped storage projects in providing power generation. These papers presented similar studies in the literature that are related to the Wadi Dayqah Dam under study in this paper considering the head and water discharge flow rate parameters.
In Oman, hydropower technology is limited because it is a semiarid country having very few permanent water resources due to its location in the desert region. Wadi Dayqah Dam, which is the case study of this paper, is one of the few wadi (valley) dams with constant water flow throughout the year. The reservoir of this dam is in Al Haja Ash Sharqi Mountains, and it flows through gorges from the Tul village down to Daghmar, where it discharges to the sea (Ministry of Regional Municipalities and Water Resources, 2018), with some flash floods during a few months of rain causing damages. An estimated volume of 720 million m3 of water since 1978 has been lost due to water discharge in the sea according to the literature. Besides, infiltration of half of the normal surface water into the ground occurs in this dam. There have been efforts since 1978 in the Sultanate to investigate the feasibility of using flashed floods for important use like electricity generation or other purposes by capturing the floods. However, a recommendation of using a dam to store flash flood waters was made. In 2003, a study about the wadi dam suggests a head of 78.8 m above the bed level with a holding capacity of 100 million m3 of flood water (Ministry of Regional Municipalities and Water Resources, 2018)1.
In light of the above, this paper presents the potential of hydropower technology in the Sultanate of Oman considering the Wadi Dayqah Dam in Quriyat. The duration of the study is from 2010 to 2018 based on the following variables of the dam in evaluating its hydropower potential: the volume or amount of water flowing into it, the volume of water flowing out, and the volume of water available in the dam for each year. Power generation from the dam could be affected mainly due to the occurrence of cyclone, thus improving the potential of harnessing available power from the dam. Also, the fear of cyclone and its aftermath could decrease the potential of harnessing the available power, by discharging the dam into the sea. Other factors that may affect the power generation of the dam are climate change, lack of rain, and non-continuous flow of the volume of water in the dam. The water resources, geography, geology, hydrology, and parameters of the dam were also discussed. A recommendation was made based on the analysis carried out for each year for maximum extraction of hydropower from the dam and the type of hydro turbine that would give the maximum hydropower extraction considering the water turbine selection characteristic envelope, the available head, and the water flow rate of the dam.
Dams are usually categorized in terms of form, material, and purpose. In Oman, they are major water projects that contribute to the development of water resources for different domestic, agricultural, and industrial uses. They are basically constructed engineering structures on valleys, rivers, and depressions for the purpose of capturing and storing the maximum possible quantity of water. Since water resources are limited in Oman, the government has exerted great efforts in developing such resources through building recharge dams and small storage dams. The following are some of the dams in Oman, which are similar to the Wadi Dayqah Dam under study in this paper: the groundwater recharge dams, the storage dams, and the flood protection dams.
The main purpose of groundwater recharge dams is to enhance ground water aquifers by making use of flood water that is usually lost to the sea and desert. This can be done by storing such water under the ground in order to use it later for various purposes. This type of dams provides some degree of protection against floods as well as in curtailing intrusion of sea water into groundwater aquifers. Recharge dams are constructed on alluvial valley channels for storing flood water in dam reservoirs for a temporary period of not more than 14 days to avoid evaporation losses and health risks. Then, the stored water is released slowly through controllable culverts to allow it to infiltrate into thick alluvium downstream of the dam, after which it can be extracted for use. The government of Oman constructed 43 recharge dams between 1985 and 2011, with a total storage capacity of more than 95.401 million m3 all over Oman (Ministry of Regional Municipalities and Water Resources, 2012). These dams have captured about 1,431.3 million m3 of flood water from their commissioning to operation up to the end of the year 2011. The first recharge dam in the Sultanate of Oman is the Al Khoud recharge dam shown in Figure 1A, which was constructed from December 1983 to March 1985. The length of the dam is 5,100 m and the height is 11 m with a storage capacity of 11.6 million m3.
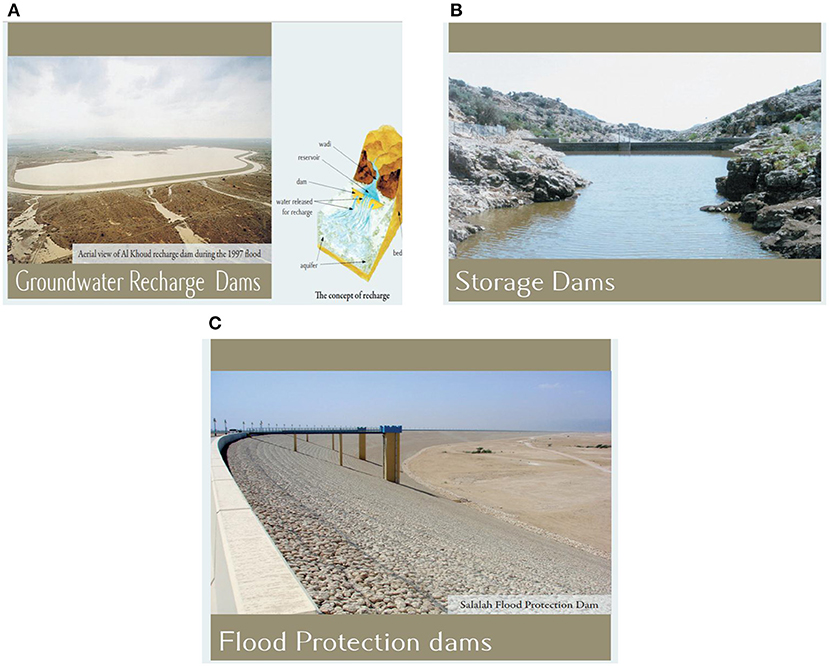
Figure 1. Some existing dams in Oman. (A) Groundwater recharge dams. (B) Storage dams. (C) Flood protection dams.
Another class of dams in Oman is the storage dam shown in Figure 1B. The purposes of building these dams are to provide and develop water resources for villagers and settlements spreading near wadi channels and mountainous areas which suffer from lack of water resources and also to encourage human settlement in these areas. A study was carried out in 1989 regarding possible means to develop water resources in the Jabal Al Akhdar region, as the population of such areas is increasing despite limited water resources. This study confirmed that the best way is to collect water in small storage dams. This idea was accepted by citizens due to its minimal adverse effects on current downstream users. The first stage of this project which serves 29 villages was completed in 1994. Twenty-six small storage dams and three service reservoirs for water collection with ancillary works and ~20 km of pipelines were built. The first set of the second stage of the project was executed in 1996, which included four storage dams and three service reservoirs for water collection. In the period between 1999 and 2004, 12 storage dams were constructed in Jabal Shams villages, and in 2004, three storage dams were also constructed in Jabal A' Surah, Wilayat of Ibri. In the same year 2004, the second phase of the dams and the hydraulic structure project was implemented in Jabal A' Surah, Wilayat of Ibri (Ministry of Regional Municipalities and Water Resources, 2012). This phase included the construction of nine storage dams: three of them were in Al Jabal Al Akhdar, four dams in Jabal Shams, one dam in Jabal Al-Kawr, and one dam in Wadi Amti. Another four storage dams were constructed in the same year in the mountainous areas of Dhofar Governorate. In 2007, two small storage dams were constructed in Jabal Shams and one Dam in Jabal A' Surah, and another seven storage dams were constructed: one in each of Al Jabal Al Abyadh in Wiylayat Dima and Al Tayeen and in Jabal Al-Marrat and in Jabal A' Surah Wilayat of Ibri; two in Jabal Dhawi in Wilayat of Al Rustaq; and two in Wilayat Ibri. At the end of 2011, another 20 storage dams were also constructed in Al Jabal Al Akhdar and one storage dam was constructed in Jabal Al Abyadh in Wilayat Dima and Al-Tayeen. The total number of storage dams in the Sultanate is 89, and the estimated total storage capacity of these dams is about 231,191 m3 (Ministry of Regional Municipalities and Water Resources, 2012)2.
Floods directly endanger human life and properties in different countries and eras. Nevertheless, agricultural areas are also exposed to floods. A lot of dams in the world have been constructed for flood protection and most of the multipurpose dams built do the role of flood protection. In the Sultanate of Oman, factors such as high steep mountains with dry climate and variable rainfalls lead to high peak flash floods that cause damage to life and property. In order to protect against such incidents, a number of flood protection dams were constructed. In Muscat Governorate, 11 dams were constructed, such as the Muscat Dam, Al-Ansab Dam, and Al-Jifnayn Dam. These are supervised and administrated by the Muscat Municipality. The Ministry of Regional Municipalities and Water Resources has completed construction of Salalah Interceptor Guard Dam in Salalah, Dhofar Governorate, and flood protection dam at Al-Amerat Heights, shown in Figure 1C. This is one of a series of flood protection dams (Gagnon et al., 2002) that will be constructed in Wadi Aday catchment (Ministry of Regional Municipalities and Water Resources, 2012). In addition to that, the Ministry of Regional Municipalities and Water Resources, in Oman, has completed carrying out consultancy studies to construct flood protection dams in different wadis in Muscat Governorate: Al-Batinah, Sharqia, and Al-Dhakhilia. This is in order to protect against the biggest floods of Gonu type.
The Wadi Quriyat Dam is located south east of the Sultanate capital of Oman, about 83 km away from Muscat, with a stretch of 85 km from the sea of Oman (Ministry of Regional Municipalities and Water Resources, 2018)3. There are a number of mountains of different shapes and diversified wadis and lands that are fertile around this dam, with its location being an attractive site for tourism, fishing, and agriculture. Therefore, apart from the potential of hydropower technology, the dam is also of economic importance. There are changes of climate and rainfall pattern between summer and winter periods and also from mountainous to coastal or wadi regions. The dam has high temperatures and humidity during the summer season in the coastal areas, while the mountainous areas have lower humidity.
There are irregular rainfall patterns during the winter period; however, some years are much wetter leading to devastating floods as a result of other wadis around the dam. The constant sunshine and mostly dry years of the region make the water flow of the wadis and wells very low. There is a discharge of the wadi into the sea via the alluvial coastal Daghmar plain, with a flow generally limited to a narrow gorge passing through the Tul village. The catchment area of the dam is in the Al Hajar Al Shargi mountain region, having a peak point above sea level of 1,500 m (Ministry of Regional Municipalities and Water Resources, 2018).
The average flow of surface water annually is 50.97 million m3 per year, while the recommended reliable water yield is 35 million m3 per year (Ministry of Regional Municipalities and Water Resources, 2018). This dam is well known for its large floods, with the reservoir helping to mitigate the floods to downstream and flood water loss effects. With time, the dry and wet periods follow each other; thus, the true or reliable water yield indicator would be the overall average. This dam flows into the sea of Oman, with a catchment area covering some 2,000 and 1,688 km2 above its location at Mazara (see text footnote 3), and becomes steep and narrow below the Tul village. The dam surface water is infiltrated into karstic aquifers between Mazara and Hayl Al Ghaf, before flowing into offshore springs. As reported by the Ministry of Water Resources, <50% of water volume of the dam at Mazara stream station flows through the gorge of Daghmar based on the hydrological measurements carried out.
There are two dams located in Wadi Dayqah: the main dam that is constructed across the main channel and a saddle dam that is constructed on the left rim depression of the reservoir, to prevent water escape due to rise in the reservoir water. The main dam is made of roller compacted concrete, with curved plan and vertical upstream stepped inclined face on the side of the downstream, having a spillway to release flood water flows as shown in Figure 2A. Also, there exists an intake tower with 10 inlet valved pipes that allow water draw off selection from the main water supply, i.e., regulate water withdrawal from the dam. The gap via the mountains is closed by the saddle dam that is made of rock fill, having an impervious core and which is currently used as a tourist area. There exists an access road that is 0.6 m above the reservoir level to the main dam from the peak of the saddle dam (Ministry of Regional Municipalities and Water Resources, 2018; see text footnote 1).
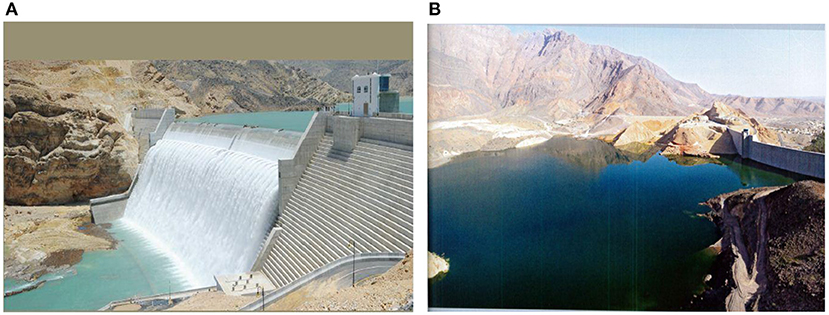
Figure 2. The Wadi Dayqah Dam. (A) The water flow of the Wadi Dayqah Dam. (B) Storage reservoir of the Wadi Dayqah Dam.
Figure 3A shows the generic scheme of a hydropower plant based on a dam (Bøckman et al., 2006), while Figure 3B gives details of the components of the dam. The cross section of the spillway is shown in Figure 3C, while the combined spillway rating curve is shown in Figure 3D (Swenty, 1989). The height of the dam depends on the storage that is required in the reservoir. In order to evaluate this, the following steps are necessary (Smout and Shaw, 1990):
• determine the water requirement per day (R, L/day);
• estimation of the area of the reservoir (A, m2), the evaporation and seepage/filter losses per day (Emm, per day), and the volume of losses per day (A × E, L/day);
• estimation of the length of the critical period (T, days), considering when the stream flow is less than the water requirement and losses, based on the requirements of using the storage in the reservoir;
• estimation of the average stream flow during the critical period (Q, L/day); and
• the effective storage required (S, L) = (water requirement per day plus evaporation and seepage losses per day minus average inflow per day) multiplied by the length of the critical period:
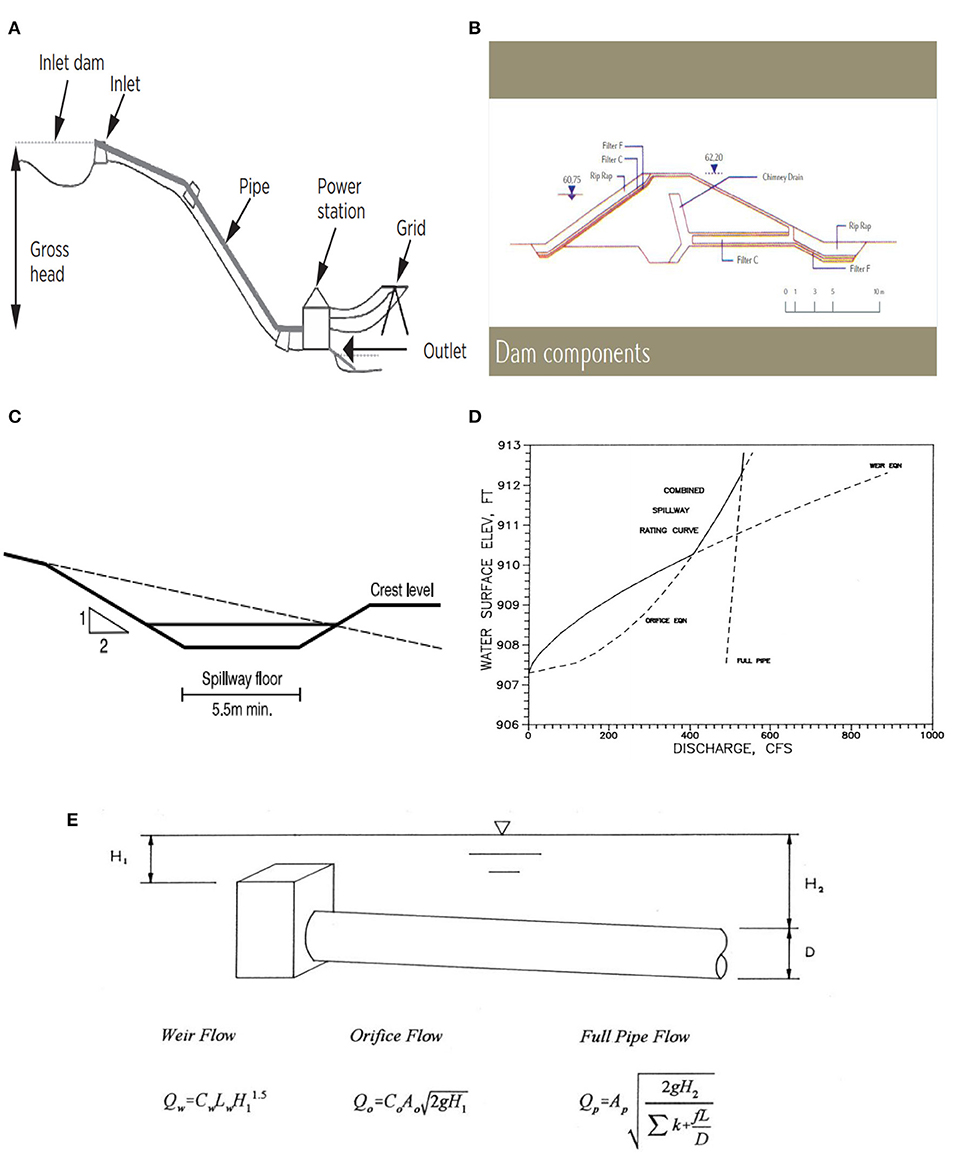
Figure 3. Engineering analysis of the dam. (A) Generic scheme of dam hydropower. (B) Components of the dam. (C) Cross-section of the spillway for the dam. (D) Combined spillway rating curve for the dam. (E) The spillway numerical formulation outlet for the dam.
Based on Equation (1), the dam must be high enough to store this quantity of water. The storage capacity of the reservoir (C, L) is best determined from cross-section surveys across the valley, but can be estimated from the area of the reservoir (A, m2) and the maximum depth of water at the dam (Dm) when full:
It is necessary to survey the site in order to estimate the area (A) of the reservoir for different values of D. One way of doing this is by a trial-and-error method, which will then give the reservoir capacity (C) that is required to meet the storage (S) and provides a safety margin. The resulting value of A should then be used in the calculation of S to obtain a consistent result. The height of the dam is therefore,
In Figure 3, the discharge characteristics are determined by the portion of the structure controlling the discharge, based on the combined spillway rating curve. There are three separate potentials for controls; therefore, three distinct sections exist in the elevation discharge curve. The first control is the weir flow given by the weir equation (Swenty, 1989):
Where Q is the discharge in cfs or m3/s, CW is the weir coefficient, LW is the perimeter length of weir in ft or m, and H is the depth of water over the weir in ft or m.
The design parameters of the main and saddle dams are given in Tables 1A,B, respectively.
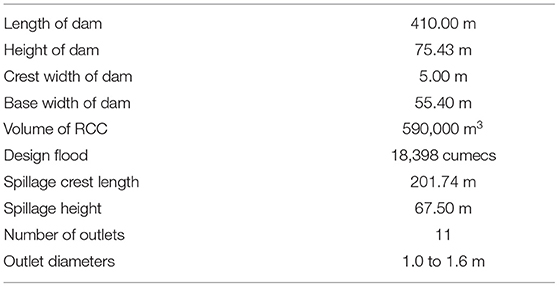
Table 1A. Parameters of the main dam.
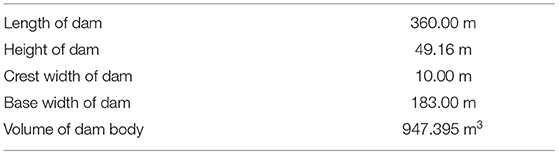
Table 1B. Parameters of the saddle dam.
In order to determine the weir coefficient CW, the following equations were proposed by the International Hydropower Association (2019) and (Portland Cement Association, 1964) for rectangular drop inlet as a function of the level of the reservoir and the diameter of the outlet pipe as:
Where H is the headwater depth above the inlet in ft or m and D is the diameter of the outlet pipe in ft or m. The weir coefficient CW for circular drop inlets is given by:
Where Drc is the diameter or riser in ft or m.
The transition point between the weir and orifice flow occurs during contraction flow that is fully developed at the inlet. The second control form to be considered is the orifice flow which is given by:
Where Qo is the discharge in cfs or m3/s, Co is the contraction coefficient, A is the cross-sectional area of the inlet in ft2 or m2, and H is the head in ft or m. The head is usually taken to be the difference of elevation between the top of the inlet and the reservoir surface. When the depth of water in the vertical riser is above the critical depth for weir flow, the drop inlet will be submerged. Consequently, the flow would then be determined using the relationship:
Where QP is the discharge through the pipe in cfs or m, AP is the cross-sectional area of the pipe in square ft or m, Ht is the total head measured from the headwater surface in the riser to the crown of the pipe outlet in ft or m, KC is the total entrance losses and is a dimensionless coefficient, K0 is the total outlet losses and is a dimensionless coefficient, f is the Darcy–Weisbach friction factor, L is the length of the pipe in ft or m, and D is the diameter of the pipe in ft or m.
In Equation (9), the effect of friction in the riser is ignored for shirt risers. Figure 3E shows the flow rates under weir, orifice, and full pipe flow conditions. The total flow rate QTotal is determined at each elevation by taking the minimum of QW, Qo, and QP. Based on the numerical formulations and engineering analysis of the dam system above, the design parameters of the main and saddle dams for the studied Wadi Dayqah are given in Tables 1A,B, respectively.
The reservoir of the dam covers an area of about 350 ha when full, with 28-km perimeter at the top water level, extending 6 km from the main dam upstream as shown in Figure 2B. The Wadi Dayqah Dam has a storage capacity of 100 million m3 that equates a 2-year period of average flow, considering monitoring records of the upstream records (Ministry of Regional Municipalities and Water Resources, 2018). There is an evaporation loss of the reservoir water of around 2.5 m depth on average each year; however, this effect is very small compared with the huge volume of stored water. The parameters of the reservoir for the dam are given in Table 1C.
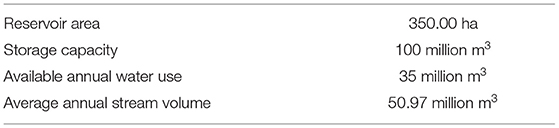
Table 1C. Parameters of the storage reservoir of the dam.
The following data in Tables 2, 3 are obtained from the Ministry of Regional Municipalities and Water Resources (2018) in Oman for a study period of 9 years of the dam, considering the variables of the dam, in order to evaluate its output power.
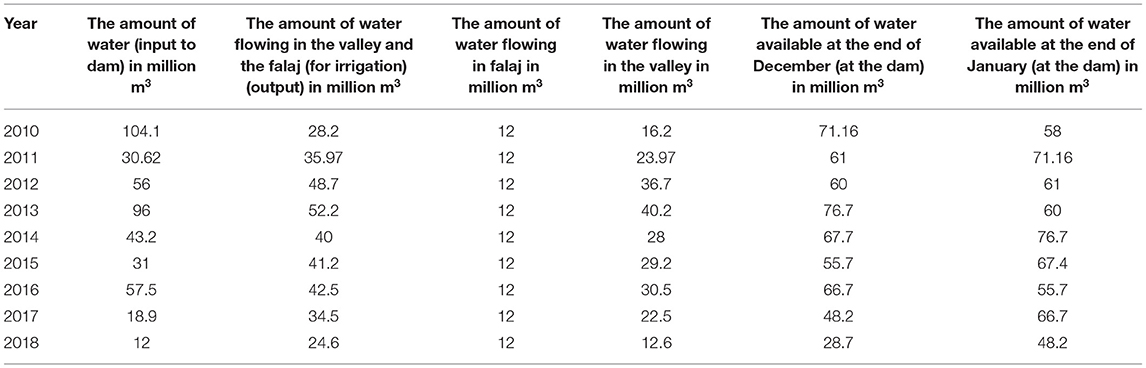
Table 2. Numerical index of the variables of the Wadi Dayqah Dam.

Table 3. Summary of the quantities of water in the lake of the narrow valley dam.
From Table 1C, the storage capacity of the dam is 100 million m3, while from Table 2, the minimum annual average discharge of the dam is 12 million m3. With 100 million m3 dam capacity:
That is, 8.33 years would be required to discharge the dam without rain. If the rain is constant, annually, the dam water will increase and the daily flow will also increase. Since the minimum average annual discharge is 12 million m3 for the dam without rain, the monthly discharge would be 1 million m3. Therefore, the minimum expected water flow rate or discharge rate for the dam would be:
A water turbine employed in the extraction of hydropower in a dam is a rotary machine that helps in the conversion of kinetic and potential energies of water into mechanical useful work. The different water turbine types with their efficiencies employed in hydropower technology (Vinogg and Elstad, 2003; Uhunwangho and Okedu, 2009; Uhunmwangho et al., 2018), with the best turbines that could be used for maximum power extraction, are shown in Figure 4. The Pelton, Kaplan, and Francis water turbines, respectively, are of high efficiencies, with the crossflow water turbine having minimum efficiency. Figure 5 shows the water turbine selection chart considering the water head that is available and the flow rate (Sammartano et al., 2013; Adhikari et al., 2016; International Hydropower Association, 2019). Generally, the impulse turbines are employed in high head sites, while the reaction turbine types are used in low head site applications. However, some impulse turbines have jets per runner that are multiple in nature, in order to help balance the shaft thrust experienced during operation. This configuration reduces cost and losses due to mechanical motions as it permits the use of smaller water turbine runners. Furthermore, the Kaplan-type water turbines having an adjustable pitch blade are suitable for water flow with wide ranges or head, because their maximum efficiency could be obtained over a wide range of water flow.
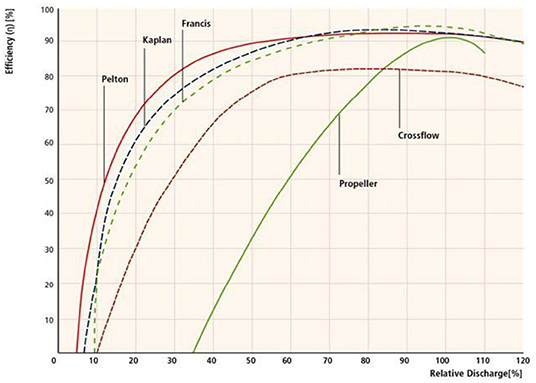
Figure 4. Typical efficiency curves for different types of hydropower turbines.
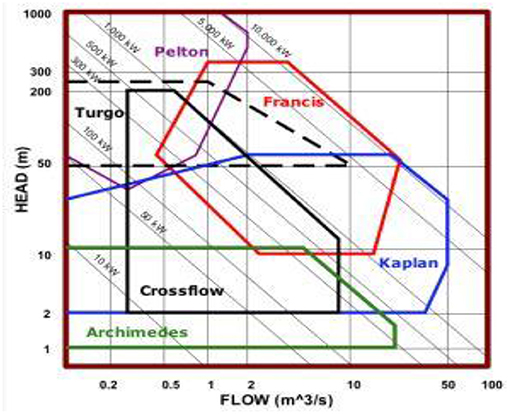
Figure 5. Selection chart or operating envelope diagram for hydropower turbines.
The small categories of water turbines below 10 MW or even large bulb turbine types are built with shafts that are horizontal. Francis and Kaplan water turbines that are large in size do have vertical shafts, since it helps the machine to effectively use the head of the water that is available, coupled with the economic cost of installing the connected generator to the water turbine. The Pelton water turbine is either horizontal or vertical shaft-based water turbine, due to the fact that water turbine size is very small compared with the head available. The typical range of heads for the various water turbine types is given in Table 4 (International Hydropower Association, 2019). Considering Figure 3 for the water turbine selection envelope, for the flow rate for the Wadi Dayqah Dam of 0.3858 m3/s as obtained above, with a gross head of 75.43 m from Table 1, then the water turbine could be modeled as follows.
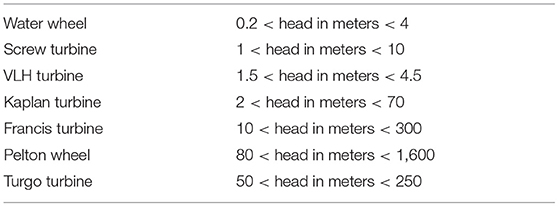
Table 4. Range of heads for water turbine.
The maximum obtainable hydropower power output of a water turbine depends on the head and water flow rate. The power from the hydro turbine could be expressed as:
From Equation (10), P is the power in watts, m is mass flow rate in kg/s expressed numerically the same as the flow rate in L/s, since 1 L of water weighs 1 kg, while g is the acceleration due to gravity with a value of 9.81 m/s2. Hnet is the net head which is defined as physically measured gross head less the head losses that may occur (10% losses). Therefore,
For the wadi dam, from Equation (11), Hnet = 75.43 m × 0.9 = 67.89m.
η is the efficiency of the water turbine. From Figure 5 and Table 4, with a minimum water flow rate or discharge of 0.3858 or 38.58% for the dam, a net head of 67.89 m, and a gross head of 75.43 m, the Francis, turgor, or crossflow water turbines are suitable for the Wadi Daqyah Dam.
From Figure 4, the efficiency of the Francis water turbine with a minimum discharge rate of 38.58% for the dam would be ~75%.
From Equation (10), the minimum extracted hydropower from the dam would be:
The above power is ~200 kW or 0.2 MW which is the same as the value obtained using the water turbine envelope chart of Figure 5, for a minimum water flow rate of 0.3858 m3/s and a gross head of 67.89.
From Table 2, the average input water to the dam is 49.92 million m3 (50 million m3), conforming with the value obtained in Table 1C for average annual stream (50.97 million m3). Thus, the average input water flow in m3/s is
Based on the head of the dam, with a water flow rate of 1.608 m3/s, the Francis, turgo, and crossflow water turbines would be good for the dam. From Equations (10) and (11), the average input power for a Francis turbine with a water flow rate of 1.608 m3/s and efficiency of 90% from Figure 4 would be 0.96MW.
From Table 2, the annual average output water for use by the dam is 38.65 million m3 (39 million m3), conforming almost with the available annual water use of 35 million m3 of Table 1C. Thus, the average output water flow in m3/s is
Based on the head of the dam, with a water flow rate of 1.2539 m3/s, the Francis, turgo, and crossflow water turbines would be good for the dam. From Equations (10) and (11), the average input power for a Francis turbine with a water flow rate of 1.2539 m3/s and efficiency of 90% from Figure 4 would be 0.75 MW. Thus, there is an average loss of 0.21 MW of power in the dam, because all the water is not utilized.
From Table 1C, with a storage capacity of 100 million m3 for the dam, the water flow in m3/s is
Based on the head of the dam, with a water flow rate of 3.2150 m3/s, the Francis or turgo water turbines would be good for the dam. From Equations (10) and (11), the output power for a Francis turbine with a water flow rate of 3.2150 m3/s and efficiency of 90% from Figure 4 would be 1.93 MW or ~2 MW. Therefore, considering the Francis water turbine technology, the maximum, average, and minimum output power of the wadi dam are 2, 0.75, and 0.2 MW, respectively.
Considering Table 2, the water flow rate for the dam is different for the considered years due to the different flow rates as a result of uneven distribution of rainfall, even though the head may be the same. Consequently, the water flow rate, the corresponding output power based on the efficiency of the Francis turbine, and the type of turbine suitable based on the operating envelope diagram of Figure 5 for the considered years (2010–2018) are given in Table 5A. The average output power and the efficiency of the three water turbines for the same average water flow of 1.2539 m3/s for the dam are given in Table 5B based on Equations (10) and (11). Thus, the method employed for harnessing or extracting electrical power from the dam is based on the water available in the reservoir because of the location of Oman in the desert region, where rainfall hardly takes place, based on Table 6 (Kwarteng et al., 2009). Consequently, the velocity of the dam may not change with time. This is one of the causes or reasons the government has not keyed into hydropower solutions in the country.
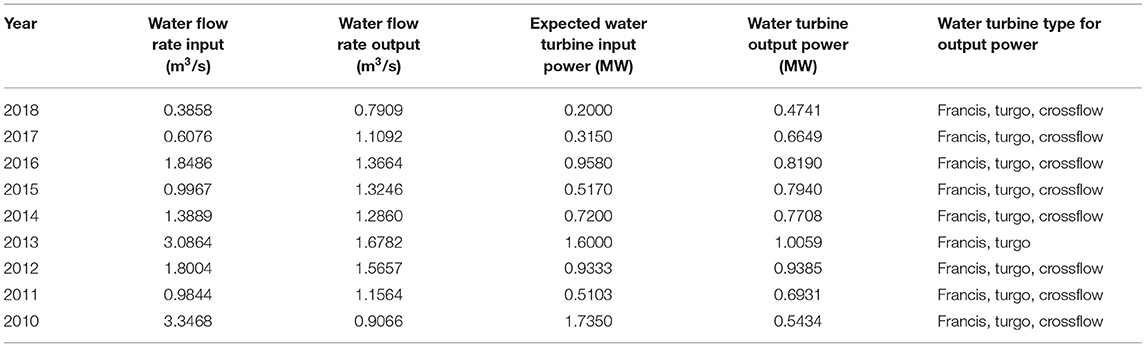
Table 5A. Flow rate, output power, and water turbine types for the dam.
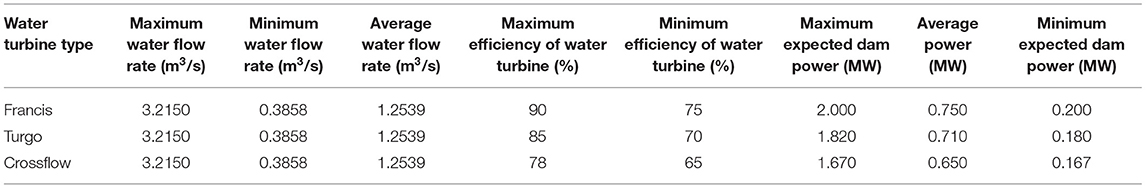
Table 5B. Summary of expected dam power and water turbine selection.
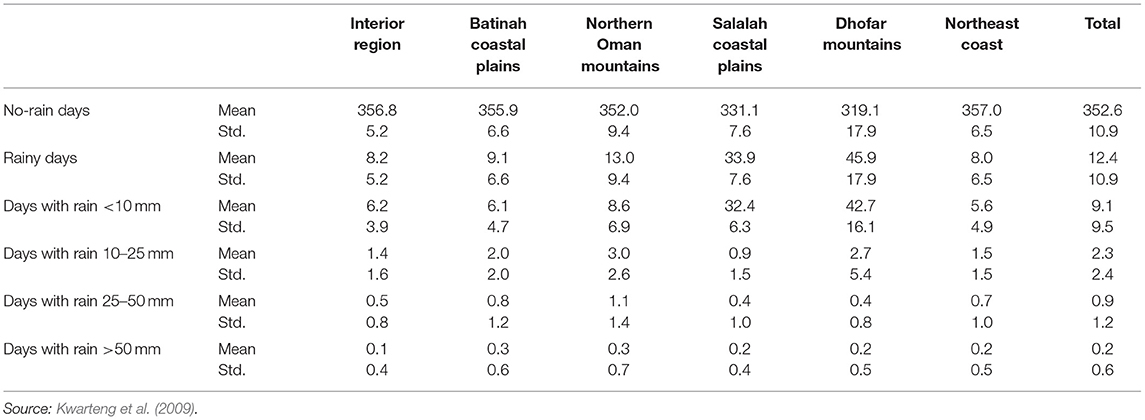
Table 6. Yearly average number of rainy days and no-rain days in Oman.
The results obtained are further analyzed in this section. Figure 6 shows the quantity of water in the dam. At the beginning of each year, the water-holding capacity of the dam is supposed to be 100 million m3; however, this value is not obtainable for the considered years of the study. At the beginning of the year of 2014, the dam capacity came to its peak value with almost 80 million m3 water capacity due to effects of the cyclone that happened at the end of the year of 2013, although the effects of the cyclone could also be seen in the months of May 2013 and February to June 2016, with the increase of water, making the dam reach its maximum water-holding capacity of 100 million m3. Again in 2012 and 2013 between April and June, the dam attained its water-holding capacity due to a combination of climate factors, including cyclone and rainfall. Therefore, the potential of the dam was at its peak in these months and years for maximum hydropower extraction. Due to fear of cyclone and its aftermath, the Ministry of Regional Municipalities and Water Resources in Oman resorted to draining the dam to avoid adverse effects of water overflow damaging households and the environment around the dam based on past experience. This could be observed in 2017 and 2018, thus reducing the potential of the dam in harnessing maximum power. Unfortunately, the predicted cyclones in the years 2017 and 2018 did not happen and there was a lack of rain; consequently, the dam capacity was at its lowest potential for these years. Apart from these reasons, there is also a continuous release of water downstream aflaj in addition to the release of water for the recharge of aquifers in the downstream. In Figure 7, the water flow in the dam is presented, where the amount of water input into the dam is not regular. The cyclone Phet in 2010 was the strongest that affected the dam area, with the volume of water in the dam reaching its capacity. The lack of rain for 2–3 consecutive years and high evaporation also resulted in the decline of water reservoir level or amount of water retained in the dam as seen in Figure 6.
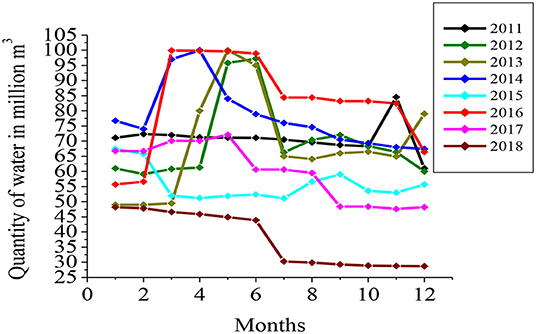
Figure 6. Quantity of water in the dam.
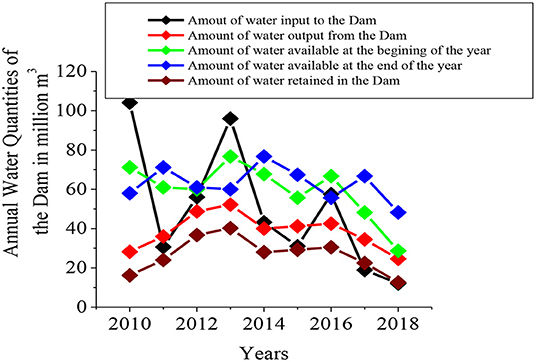
Figure 7. Water flow in the dam.
The effect of limited water input into the dam led to low water output as shown in Figure 7. Consequently, the water flow rate of the dam and the expected extracted power and efficiency of the water turbines would be affected as shown in Figures 8A,B, respectively. The water turbines presented in Figure 8A are based on the selection envelope of Figure 5, with the Francis water turbine performing better for hydropower extraction from the wadi dam with improved efficiency more than the turgo and crossflow turbines based on the obtained data used for the study. The power generation from the dam is limited as shown in Figures 8A,B, due to the non-continuous flow of water as shown in Figures 6, 7 for the dam system.
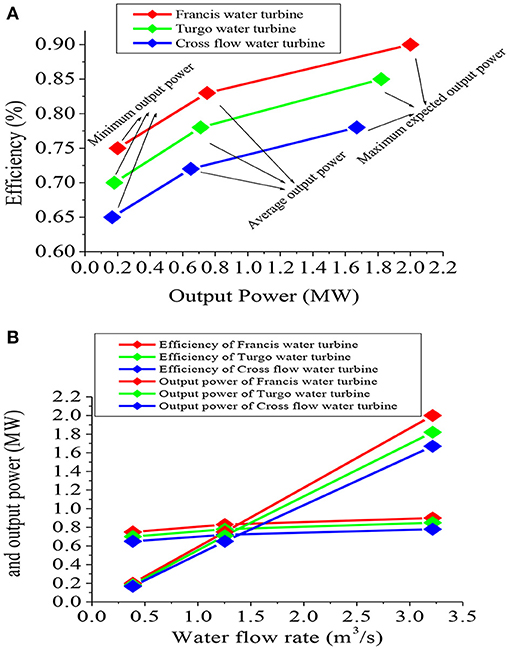
Figure 8. (A) Performance of the selected water turbines for the dam. (B) Evaluation of the variables of the water turbines for the dam.
Floods in Oman are hazardous and difficult to predict, with mean velocities sometimes in excess of 5 m/s, and high sediment flowage rates are a feature of torrential wadis. A spillway is required to protect the dam from overtopping during high flows. It passes surplus water downstream safely, preventing both the failure of the dam and damage downstream. Surplus water flows over the spillway crest at the top water level and into an open channel around the side of the dam, discharging safely into the stream below the dam. Figure 9A shows the minimum inlet width for the flood flow for the dam, where it can be observed that a higher flood flow for the spillway would require a wider inlet width. Figure 9B shows the graph of the reservoir storage of the dam over the years, where each point on the curve represents reservoir storage and outflow at a given elevation, and the maximum water surface elevation during the design flood is obtained from the peak rate of outflow. It could be seen that water storage in the dam is decreasing over the years due to climate change factors and evaporation as discussed in detail in the subsequent section.
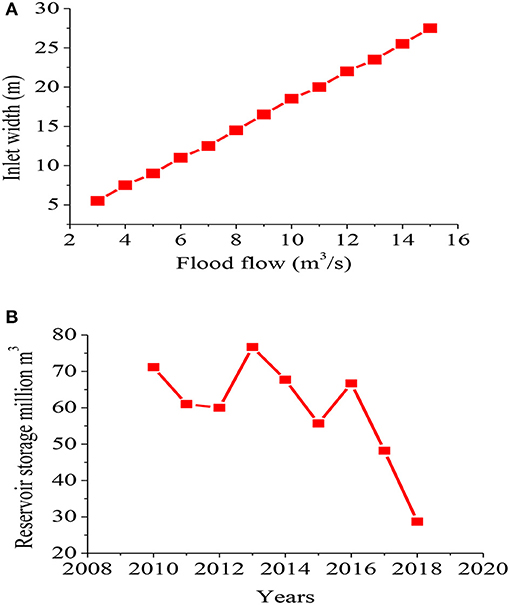
Figure 9. (A) Inlet width of the spillway for the dam. (B) Outflow discharge versus storage of the reservoir for the dam.
In light of the performance of the dam above, it is flexible to operate the water stored in the dam in the form of hydropower, thus, making it valuable to electric power systems. Hydropower can play a significant role in the rapid response to load following and balancing capabilities, peaking capacity, and power quality attributes, ensuring reliable electricity service. In a hybrid system, the reservoir of the dam and pumped storage hydropower can be used to reduce the frequency of start-ups and shutdowns of thermal plants, to maintain a balance between supply and demand under changing demand or supply patterns and thereby reduce the load following burden of thermal plants, and to increase the amount of time that thermal units are operated at their maximum thermal efficiency, thereby reducing carbon emissions. In addition, storage and pumped storage hydropower can help reduce the challenges of integrating variable renewable resources such as wind, solar photovoltaics, and wave power.
Some of the most expected long-term scenarios in hydropower generation, which are dependent on water availability upstream, are discussed in this section. This water availability is driven by climate change and by human interventions upstream like diversion of water for agricultural, industrial, and domestic purposes. Knowledge of future projection of upstream water availability is key toward hydropower generation and management. The following long-term scenarios are necessary for effective hydropower generation in Oman (Smout and Shaw, 1990; Texas Commission on Environmental Quality, 2000; Kumar et al., 2011).
The water retention ability of a dam is very vital because the purpose of a dam is to retain water effectively and safely. The following are some of the ways water may pass from the reservoir to the downstream side of the dam: seeping through the dam, through the abutments, under the dam, overtopping the dam, through the outlet works, through or over a primary or service spillway, and through an emergency spillway. The first three modes are usually not desirable, particularly if the seepage or filter is not limited in area or volume. Another undesirable mode is overtopping of an embankment dam because the materials used for the embankment material may be eroded away. Generally, water usually leaves a dam by passing through outlet works or service spillway. During emergency scenarios, an emergency spillway is employed only during periods of very high reservoir levels and high-water inflow.
The intentional release of water through spillway or outlet works or emergency spillways would affect the dam for hydropower generation. A typical case in Oman is the constant release of dam water for irrigation purposes and the fear of cyclone to avoid overflooding. Dams should be designed to have some drawdown facilities that could help in quickly lowering the water level if failure of the dam is imminent, serve operational purposes of the reservoir, lower the water level for the repair of the dam, and fluctuating the pool or water level purposely to kill weeds and mosquitoes in the Dam. An emergency spillway could be utilized to avoid overtopping of the dam, and this should be discharged away from the toe of the dam to avoid erosion. It is imperative to construct such spillway so that they are not seriously eroded during use, as erosional failure of the spillway could be as catastrophic as failure of the dam itself.
There are local social and environmental impacts of hydropower projects based on the type, size, and local conditions. Some of these impacts are changes in flow regimes and water quality, barriers to fish migration, loss of biological diversity, and population displacement. The dam reservoirs are the source of the most severe concerns even though it provides multiple beneficial services beyond energy supply. The lifecycle assessments indicate very low carbon emissions, and presently, no consensus on the issue of land use change related to net emissions from reservoirs has been reported. Experience gained during the past decades in combination with continually advancing sustainability guidelines and criteria, innovative planning based on the government of Oman and stakeholder consultations, and scientific know-how can support high sustainability performance in future hydropower projects. Furthermore, transboundary water management, including the management of hydropower projects, establishes an arena for international cooperation that may contribute to promoting sustainable economic growth and water security.
Steady growth in the supply of hydropower is therefore projected to occur even in the absence of greenhouse gas (GHG) mitigation policies, though demand growth is anticipated to be even higher, resulting in a shrinking percentage share of hydropower in global electricity supply. Evidence suggests that relatively high levels of deployment over the next 20 years are feasible, and hydropower should remain an attractive renewable energy source within the context of global GHG mitigation scenarios. Though hydropower can provide energy and water management services and also help to manage variable renewable energy supply that may further support its continued deployment, but environmental and social impacts will need to be carefully managed.
Hydropower plants do not consume the water that drives the turbines. The water, after power generation, is available for various other essential uses. A significant proportion of hydropower projects are designed for multiple purposes. In these instances, the dams help to prevent or mitigate floods and droughts; provide the possibility to irrigate agriculture; supply water for domestic, municipal, and industrial use; and can improve conditions for navigation, fishing, tourism, or leisure activities. One aspect often overlooked when addressing hydropower and the multiple uses of water is that the power plant, as a generator of revenue, in some cases can help pay for the facilities required to develop other water uses that might not generate sufficient direct revenues to finance their construction.
The overall impacts of climate change on the existing global hydropower generation may be expected to be small or even slightly positive. However, there are substantial variations in changes in energy production across the desert regions and even within Oman. Uncertainty about future impacts as well as increasing difficulty of future system operations may pose a challenge that must be addressed in the planning and development of future hydropower projects. Indirect effects on water availability for energy purposes may occur if water demand for other uses such as irrigation and water supply for households and industry rises due to the climate change.
Evaporation water loss from large reservoir surface area is crucial in water balance calculation of the dam. It is necessary to elaborate its implications on future hydropower generations. Low rainfall in Oman, high water evaporation rates due to the high intensity of solar energy in the desert region of Oman, sandy soils, and flat landscapes all contribute to a lack of abundant runoff and surface water resources. Besides, the underground water resources in most parts of Oman are too saline for stock use, and surface water flows last only for a short time. Based on these, there is huge dependence on the Wadi Dayqah Dams to provide water for livestock, irrigation, and domestic use. Consequently, there is a need to effectively capture water in the wadi dam and to prevent loss through evaporation for the harvested water. Some of the ways to minimize wadi dam evaporation losses are as follows: appropriate design of the dam to minimize the surface area and encouraging management strategies like windbreaks, evaporation control covers, floating covers, suspended shade structures, and chemical monolayers.
There will be less evaporation of water in the dam, if the ratio of surface area to volume is reduced. In order to reduce the surface area, the dam should be built very deep and narrow. Though this method is very effective, however, it is expensive (Australian Wool Innovation Limited, 2020). The plantation of windbreaks like trees near dams provides some protection from evaporation, though the plantation of trees near the wadi dam is risky. Windbreaks planted near dams provide some protection from evaporation (Australian Wool Innovation Limited, 2020). Trees should not be planted directly on top of or adjacent to dam walls as the roots may increase the risk of wall failure or even draw water out of the dam.
Lately, the use of hydroelectric power as a renewable means of electricity generation is on the rise. Some hydropower technology makes use of rivers, streams, or canals; however, dams are preferable for a more reliable water flow because they create a head. Dams have the capability of storing water which could be used later for electricity production; thus, the reservoir of the dam acts like a battery. Apart from electricity generation, dams could also be used for irrigation purposes. In this paper, the potential of hydropower technology in Oman with the case study of the Wadi Dayqah Dam was presented. The study involved the geography, hydrology, and catchment area of the dam. The parameters and variables of the dam obtained from the Ministry of Regional Municipalities and Water Resources in the Sultanate of Oman were analyzed considering the water turbine envelope selection characteristics. The dam has about 75.43 m head above bed level and could hold about 100 million m3 of flood water.
The water inflow to the dam is irregular over the years, thus affecting the water outflow rate. The cyclone Phet in 2010 was the strongest that affected the area of the dam, among the other cyclones. There are two main reasons for the decline of water level in the reservoir of the dam. First and foremost, there is a continuous release of water to downstream aflaj; in addition, there are some other releases of water whenever necessary for the recharge of aquifers in the downstream and during fear of cyclone due to its aftermath. Secondly, the lack of rain for 2–3 consecutive years and high evaporation also resulted in the decline of water reservoir level. In this study, the expected output power of the dam is around 2 MW, and this could be obtained with the use of the Francis water turbine due to its high efficiency. The other water turbines used in the evaluation of the dam variables are the turgo and crossflow, with the crossflow water turbine giving the least performance. Some long-term scenarios for hydropower generation in Oman were discussed. In addition, some long-term scenarios in hydropower generation in relation to water management and ways of reducing water loss via evaporation in the dam were discussed. Some recommendations and future scope of work could involve a hybrid conventional power generation system, pumped storage hydropower, and floating solar farm with the dam.
The original contributions presented in the study are included in the article/supplementary material, further inquiries can be directed to the corresponding author/s.
Both authors listed have made a substantial, direct and intellectual contribution to the work, and approved it for publication.
The authors declare that the research was conducted in the absence of any commercial or financial relationships that could be construed as a potential conflict of interest.
The authors acknowledge the support from the Ministry of Regional Municipalities and Water Resources for their support in this work.
1. ^Oman Electricty and Transmission Company, 2005.
2. ^Government of the Sultanate of Oman, 2014.
3. ^Google Map, 2018.
Acharya, N., Kim, C. G., Thapa, B., and Lee, Y. H. (2015). Numerical analysis and performance enhancement of a cross-flow hydro turbine. Renew. Energy 80, 819–826. doi: 10.1016/j.renene.2015.01.064
Adhikari, R. (2016). Design Improvement of Crossflow Hydro Turbine. (Ph.D. Thesis). University of Calgary, Calgary, AB, Canada.
Adhikari, R., and Wood, D. (2017). A new nozzle design methodology for high efficiency crossflow hydro turbines. Energy Sustain. Dev. 41, 139–148. doi: 10.1016/j.esd.2017.09.004
Adhikari, R., and Wood, D. (2018). The design of high efficiency crossflow hydro turbines: a review and extension. Energies 11, 1–18. doi: 10.3390/en11020267
Adhikari, R. C., Vaz, J., and Wood, D. (2016). Cavitation inception in crossflow hydro turbines. Energies 9:237. doi: 10.3390/en9040237
Bøckman, T., Fleten, S.-E., Juliussen, E., Langhammer, H., and Revdal, I. (2006). Investment Timing and Optimal Capacity Choice for Small Hydropower Projects. Trondheim: Department of Industrial Economics and Technology Management, Norwegian University of Science and Technology. Available online at: https://www.susana.org/en/knowledge-hub/resources-and-publications/library/details/4123?pgrid=1 (accessed June 6, 2021).
Botelho, A., Ferreira, P., Lima, F., Costa Pinto, L. M., and Sousa, S. (2017). Assessment of the environmental impacts associated with hydropower. Renew. Sustain. Energy Rev. 70, 896–904. doi: 10.1016/j.rser.2016.11.271
Ecofys (2011). Financing Renewable Energy in the European Energy Market: Final Report. Utrecht: Ecofys.
Gagnon, L., Bélanger, C., and Uchiyama, Y. (2002). Life-Cycle assessment of electricity generation options: the status of research in year 2001. Energy Pol. 30, 1267–1278. doi: 10.1016/S0301-4215(02)00088-5
Gorla, L., and Perona, P. (2013). On quantifying ecologically sustainable flow releases in a diverted river reach. J. Hydrol. 489, 98–107. doi: 10.1016/j.jhydrol.2013.02.043
International Renewable Energy Agency (2015). Hydropower Technology Brief. Energy Technology Systems Analysis Programme ETSAP (Abu Dhabi).
International Water Power and Dam Construction (2020). Harnessing Hydropower in Malaysia. London: Hydropower News and Technology.
Jafari, F., Salmasi, F., and Abraham, J. (2019). Numerical investigation of granular filter under the bed of a canal. Appl. Water Sci. 9, 1–15. doi: 10.1007/s13201-019-1023-8
Kougias, I., Aggidis, G., Avellan, F., Deniz, S., Lundin, U., Moro, A., et al. (2019). Analysis of emerging technologies in the hydropower sector. Renew. Sustain. Energy Rev. 113:109257. doi: 10.1016/j.rser.2019.109257
Kumar, A., Schei, T., Ahenkorah, A., Rodriguez, R. C., Devernay, J., and Freitas, M. (2011). Hydropower. Special Report on Renewable Energy Sources and Climate Change Mitigation. Working Group III, Mitigation of Climate Change, Intergovernmental Panel on Climate Change, 437–496.
Kwarteng, A. Y., Dorvlo, A. S., and Vijaya, K. (2009). Analysis of a 27-year rainfall data (1977–2003) in the Sultanate of Oman. Int. J. Climatol. 29, 605–617. doi: 10.1002/joc.1727
Metzler, M., and Pelz, P. F. (2015). Draft tube design method for operation at optimal coefficient of performance in low head hydropower. Wasserwirtschaft 105, 13–17.
Nasir, B. A. (2017). Design of micro -hydro -electric power station. Int. J. Eng. Adv. Technol. 2, 39–47.
Norouzi, R., Salmasi, F., and Arvanaghi, H. (2020). Uplift pressure and hydraulic gradient in Sabalan Dam. Appl. Water Sci. 10:111. doi: 10.1007/s13201-020-01195-2
Nourani, B., Salmasi, F., Abbaspour, A., and Oghati Bakhshayesh, B. (2017). Numerical investigation of the optimum location for vertical drains in gravity dams. Geotechnol. Geol. Eng. 35, 799–808. doi: 10.1007/s10706-016-0144-1
Novak, M., Mozdren, T., Gono, R., and Gono, M. (2014). “Methods of small hydropower plants connection in water supply system,” in 14th International Conference on Environment and Electrical Engineering (EEEIC) (Krakow: IEEE). doi: 10.1109/EEEIC.2014.6835905
Okedu, K. E., Uhunmwangho, R., and Odje, M. (2020). Harnessing the potential of small hydro power in Cross River state of Southern Nigeria. Sustain. Energy Technol. Assess. 37, 1–11. doi: 10.1016/j.seta.2019.100617
Paish, O. (2002). Small hydro power: technology and current status. Renew. Sustain. Energy Rev. 6, 537–556. doi: 10.1016/S1364-0321(02)00006-0
Quaranta, E. (2019). Optimal rotational speed of Kaplan and Francis turbines with focus on low-head hydropower applications and dataset collection. J. Hydraul. Eng. 145:04019043. doi: 10.1061/(ASCE)HY.1943-7900.0001643
Quaranta, E. (2020). The revival of old hydraulic turbines for innovative hydropower generation: water wheels, archimedes screws, deriaz and girard turbines. Curr. Trends Civ. Struct. Eng. 5, 1–4. doi: 10.33552/CTCSE.2020.05.000625
Quaranta, E., Bonjean, M., Cuvato, D., Nicolet, C., Dreyer, M., Gaspoz, A., et al. (2020). Hydropower case study collection: innovative low head and ecologically improved turbines, hydropower in existing infrastructures, hydropeaking reduction, digitalization and governing systems. Sustainability 12, 1–78. doi: 10.3390/su12218873
Quaranta, E., and Müller, G. (2018). Sagebien and Zuppinger water wheels for very low head hydropower applications. J. Hydraul. Res. 56, 526–536. doi: 10.1080/00221686.2017.1397556
Reichl, F., and Hack, J. (2017). Derivation of flow duration curves to estimate hydropower generation potential in data-scarce regions. Water J. 9:572. doi: 10.3390/w9080572
Rotilio, M., Marchionni, C., and De Berardinis, P. (2017). The small-scale hydropower plants in sites of environmental value: an Italian case study. Sustainability 9, 1–15. doi: 10.3390/su9122211
Sammartano, V., Aricò, C., Carravetta, A., Fecarotta, O., and Tucciarelli, T. (2013). Banki-Michell optimal design by computational fluid dynamics testing and hydrodynamic analysis. Energies 6, 2362–2385. doi: 10.3390/en6052362
Sammartano, V., Morreale, G., Sinagra, M., and Tucciarelli, T. (2016). Numerical and experimental investigation of a cross-flow water turbine. J. Hydraul. Res. 54, 321–331. doi: 10.1080/00221686.2016.1147500
Schramm, M. P., Bevelhimer, M. S., and DeRolph, C. R. (2016). A synthesis of environmental and recreational mitigation requirements at hydropower projects in the United States. Environ. Sci. Policy 61, 87–96. doi: 10.1016/j.envsci.2016.03.019
Smout, I., and Shaw, R. (1990). Small Earth Dams: WEDC Loughborough University Leicestershire LE11 3TU UK. 48, 61–64. Available online at: https://www.lboro.ac.uk/services/sustainability/response/ (accessed June 6, 2021).
Swenty, B. J. (1989). Engineering Analysis of Dams, Missouri Department of Natural Resources Division of Geology and Land Survey Dam and Reservoir Safety Program (Rolla, MO), 14–31.
Texas Commission on Environmental Quality (2000). Chapter 2: Introduction to Dams, Guidelines for Operation and Maintenance of Dams in Texas (Austin, TX), 9–12.
U.S. Department of the Interior Bureau of Reclamation Power Resource Office (2005). Reclamation, Managaing Water in the West. Hydroelectric Power. Washington, DC: U.S. Department of the Interior Bureau of Reclamation Power Resource Office.
Uhunmwangho, R., Odje, M., and Okedu, K. E. (2018). Comparative analysis of mini hydro turbines for Bumaji stream, Boki, Cross, River State, Nigeria. Sustain. Energy Technol. Assess. 27, 102–108. doi: 10.1016/j.seta.2018.04.003
Uhunwangho, R., and Okedu, K. E. (2009). Small hydropower for sustainable development. Pacific J. Sci. Technol. 10, 535–543. doi: 10.1016/j.rser.2011.01.006
Vinogg, L., and Elstad, I. (2003). Mechanical Equipment. Trondheim: Norwegian University of Science and Technology, 130.
Working Group III Mitigation of Climate Change (2017). Hydropower Special Report on Renewable Energy Sources and Climate Change Mitigation, Final Release. Geneva: Intergovernmental Panel on Climate Change (IPCC).
Keywords: hydro power, dam, flow rate, power potential, renewable energy
Citation: Okedu KE and Al Siyabi MS (2021) Harnessing Hydropower Potential in Desert Regions: The Case of Wadi Dayqah Dam, Quriyat, Oman. Front. Water 3:686856. doi: 10.3389/frwa.2021.686856
Received: 28 March 2021; Accepted: 07 June 2021;
Published: 15 July 2021.
Edited by:
Alison Parker, Cranfield University, United KingdomReviewed by:
Aly Abdelbaky Elbatran, Arab Academy for Science, Technology and Maritime Transport (AASTMT), EgyptCopyright © 2021 Okedu and Al Siyabi. This is an open-access article distributed under the terms of the Creative Commons Attribution License (CC BY). The use, distribution or reproduction in other forums is permitted, provided the original author(s) and the copyright owner(s) are credited and that the original publication in this journal is cited, in accordance with accepted academic practice. No use, distribution or reproduction is permitted which does not comply with these terms.
*Correspondence: Kenneth E. Okedu, b2tlZHVrZW5uZXRoQG51LmVkdS5vbQ==
Disclaimer: All claims expressed in this article are solely those of the authors and do not necessarily represent those of their affiliated organizations, or those of the publisher, the editors and the reviewers. Any product that may be evaluated in this article or claim that may be made by its manufacturer is not guaranteed or endorsed by the publisher.
Research integrity at Frontiers
Learn more about the work of our research integrity team to safeguard the quality of each article we publish.