
95% of researchers rate our articles as excellent or good
Learn more about the work of our research integrity team to safeguard the quality of each article we publish.
Find out more
ORIGINAL RESEARCH article
Front. Water , 05 October 2021
Sec. Water and Hydrocomplexity
Volume 3 - 2021 | https://doi.org/10.3389/frwa.2021.681723
This article is part of the Research Topic Hydroeconomic Analysis View all 4 articles
 Márcia M. G. Alcoforado de Moraes1*
 Gerald N. Souza da Silva2Marcelo Pereira da Cunha3Nilena B. M. Dias4
 Terezinha F. Cardoso3Joaquim J. M. Guilhoto5Laíse Alves Candido6Reinan R. S. Santos7
Allocation of Water Resources at the basin level is a critical issue for economic growth as well as for environmental sustainability. This study integrates network-based optimization with an Input-Output model, made available through a Spatial Decision Support System (HEAL), to support design and evaluation of water allocation policies. The innovative platform was applied to a case study using four-interlinked hydrographic basins in Northeastern of Brazil. The integrated modeling was able to measure broader socioeconomic impacts of decisions on reservoir volumes and water allocations at basin level, through indicators in a sectoral and regional scale, including ones associated with Sustainable Development Goals, such as the Water Use Efficiency (WUE) indicator. Results of the trade-offs between two scenarios, representative of the limits of performance of regulatory water instruments, were generated using the integrated modeling. They were compared with the Reference scenario for the base year (2011) and show that the economic sector most negatively affected by the regulatory instrument use is the industrial sector. Furthermore, the sugar and ethanol industry, main water users in the industrial sector (93.1% of the sector's water use) and less efficient (WUE 1.47 US$/m3 vs. 30.70 US$/m3 average of the sector) in the base year, maintain their percentage share of water use in the sector and even slightly expand it (93.2%), with slight efficiency gains (+2.3%). On the other hand, non-water-intensive industries, have their shares reduced (from 6.9 to 6.8%) and lose efficiency (−9.5%). Results of the same trade-offs by region showed that the largest proportional economic losses occur in the drier areas, damaging the economy, especially in the most industrialized municipalities with the highest GDPs. Integrated economic modeling can expand aspects involved in water security issues, assisting management by introducing socioeconomic impact measures, in a broader scale, associated with allocation decisions. Hydrological allocation criteria cannot distinguish between user efficiency and which economic sectors are using how much water. This results in economic and social losses. In water-scarce regions and with growing transfer needs, such as in the basins studied, adequate incentives, through management instruments designed based on economic theory, are essential to promote sustainable development.
The allocation of water resources in hydrographic basins is considered a critical issue, as the viability of economic growth as well as desirable future environmental conditions depend on how water is distributed among economic sectors and the preservation of its quality. In particular, when the economy and competition for water and the value of water grow, the benefits of reallocating water accompany this growth significantly (Rosegrant and Binswanger, 1994). This reallocation requires instruments for water management that are designed and evaluated using economic theory, with the proper analytical tools. These tools, models, and decision support systems must be capable of simulating the existing system and measuring how well the system allocates resources to impact positively on the economy, the environment, productivity, and equality.
The pressure on water resources is further exacerbated considering climate change, increasing global demand for agricultural products, driven by a growing population and the need for renewable sources of energy (MAPA., 2016), ongoing worldwide rural-urban transitions, and migration movements (GWP., 2004) in a changing world. Given this, efficient water allocation from an economics standpoint is, more than ever, a challenge for managers, users and researchers, especially in places where there is relative water scarcity (The World Bank Group, 2016). Water decision-makers need to become aware of economic models and decision supports, especially in developing countries with weak law-enforcement institutions, unbalanced political powers, uncertainties about water availability and diversity of multiple water uses (Araújo, 2020).
Network-based optimization models are especially useful at basin scales, because they are able to evaluate water allocation strategies from different perspectives for all basin water users and uses and to extend these to incorporate environmental, institutional and policy constraints (Cai, 2008; Harou et al., 2009; Mayer and Muñoz-Hernandez, 2009). New hybrid models integrating these network-based models with economywide ones such as Input-Output model (IOM) and Computable General Equilibrium model (CGEM), are required to address regional and distributional impacts.
The input-output model has been used to analyze different aspects related to water use (Lenzen and Foran, 2001; Yu et al., 2010; Llop, 2013; Llop and Ponce Alifonso, 2015; WWAP, 2016). The input-output model approach has also been used in water footprint assessment and to identify virtual water trade in sectorial production considering regional, national, or global scales (Zhang et al., 2011; Manzardo et al., 2016; Munoz Castillo et al., 2019; Bunsen et al., 2021; Li et al., 2021; Qi et al., 2021). Even though IOMs are increasingly being applied in the water management field, they lack good spatial and hydrologic representations, and thus are not able to associate water allocation decisions to the measurement of socioeconomic indicators. Reviews from recent literature reviews (Bekchanov et al., 20171) have emphasized the need for integrating economywide to network-based models of water management and have suggested that there is a lack of this kind of integration able to support the demand management of water resources.
This paper evaluates water management instruments with a hybrid decision support platform that is being developed under a Brazilian National Program (2017–2022) funded by CAPES (Educational Government Agency) and ANA (National Water Agency). The platform enables the integration of the optimization models (network-based) with an IOM (economywide model). The integration can measure broader economic impacts linked to water allocation decisions, such as water flows, reservoir volumes, water deliveries and availability at the basin level. The optimization models use hydrological allocation criteria to simulate regulatory instrument effects. These, integrated with the IOM, produced result and socioeconomic indicators for each economic sector and municipality of the study case for a 3-year period (2011–2013), that started with a severe drought in the area and lasted until 2018.
Our case study concerns four interlinked river basins in the state of Pernambuco (PE), Northeast (NE) of Brazil. This state has water issues typical of those faced by the rest of the Brazilian semi-arid region and other arid regions elsewhere. Furthermore, an inter-basin transfer system is being built, that will transfer water not only among the basins within the state, but also from the distant São Francisco (SF) river basin. This is a supply management policy, with the aim to provide water security for the semiarid region (NE), which suffers from water scarcity. Additionally, demand management, using water policy instruments, that recognize and incorporate broader economic measures associated with water security, can influence the evolution of current and potential regional economy (Munoz Castillo et al., 2017).
Pernambuco state is one of the driest states in Brazil with an average per capita water availability of 1,320 m3/year, below the threshold of 1,500 considered as water stress, and equivalent to 3.5% of the national average per capita availability. The four river basins are in Agreste region, a portion of the state, that is not the driest part, but currently has the worst water balance in the country. Additional water to this region will be transferred from the SF basin and distributed through the Agreste canal, which links these basins. Parts of Pernambuco state, such as the Sertão and Agreste subregions, represent 89% of the state's territory and have only about 20% of the water available in the state, with per capita water availability ranging from 400 m3/year (Sertão) to 800 m3/year (Agreste) (Baker et al., 2016). Figure 1 shows the case study area.
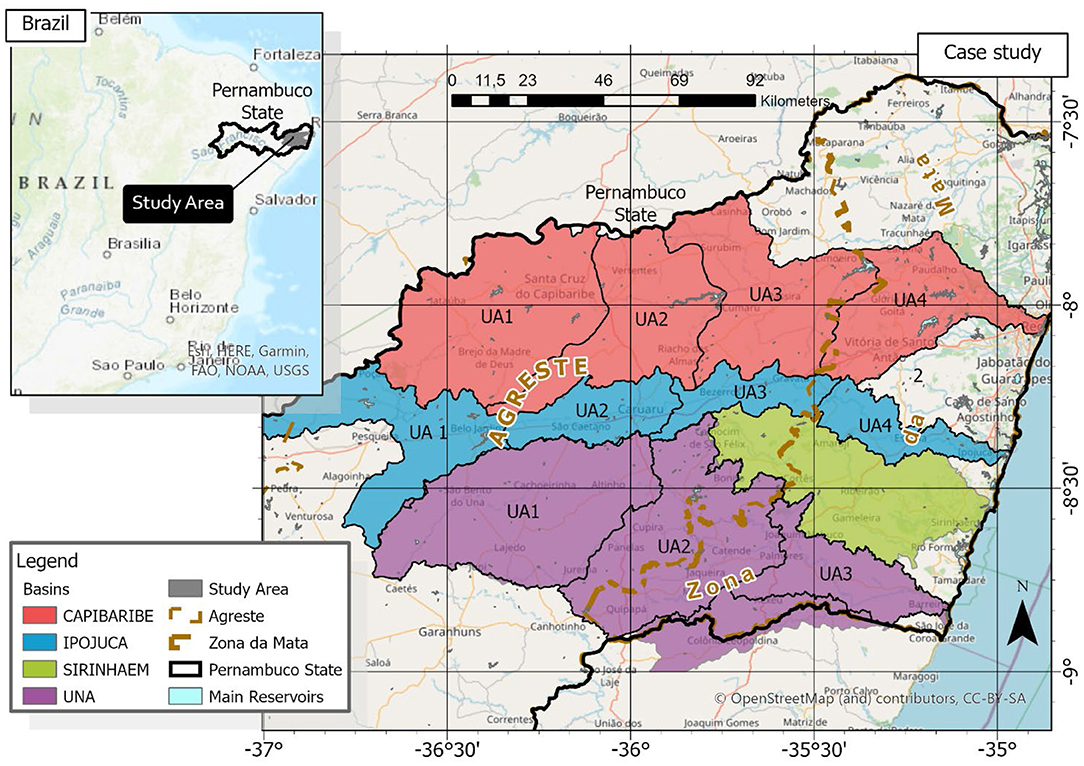
Figure 1. Case study area: Pernambuco State–Brazil; Interlinked basins (Capibaribe, Ipojuca, Una, and Sirinhaém); Agreste region and Zona da Mata region.
The key river basins in the Agreste subregion are the Capibaribe, Ipojuca, Una and Sirinhaém rivers. The basins have critical water balances and increasing water transfer needs. The water distribution to Agreste region comes from interlinked channels and will receive contribution from the São Francisco River (Alcoforado de Moraes et al., 2018), after the end of the construction of the São Francisco river transboundary project (ANA, 2005). These basins already have domestic water supply systems that are inter-municipal, some of them using water captured from a municipality in one basin and consumed in a municipality in another basin. Because of this, the first part of the present study was to identify cases of Inter-basin transfer (IBT), even though these transfers are expected to increase as the water infrastructure system is concluded.
This region has been receiving considerable investments in water infrastructure and should benefit from the development of public water policies that improve management and increase efficiency of water use. An increased knowledge from water economy models for supporting demand management in regions like this and other regions with critical balances and transfer needs can be used to support decisions on sustainable water policy design. As a basis for proposing reform on water policies, the integrated platform presented here, its current and potential results, aims to broaden the policymaker's view regarding water policy choices that would be effective for the implementation of an environmentally sustainable economic development.
Since the largest reservoirs in the studied region have limited flow regularization capacities (considering demands and runoff timeseries), and the initial year (2011) was quite wet, the optimization model considered a 3-year time period with the reservoirs in the beginning at full storage and in the following month/ years with supply values as observed in the following dry years. Under this extreme case water supply context, the socioeconomic impacts within the limits of two hydrological allocation criteria, were thus provided. This made it possible to evaluate command-and-control instruments, according to the effects on water reductions imposed in different regions and/ or by economic sectors, using indicators such as income, employments and water use efficiency (WUE).
With the aim to provide an integrated decision support for hydrologic and economic criteria's, models need to be designed, which can represent real world problems in most appropriate way. Prescriptive or optimization model results are particularly important to support water policy decisions as they can identify a strategy to be adopted to satisfy a certain objective or decision criteria, which can be hydrological (hydrology-inferred), with a function-goal where the decision on inter-sector allocation is derived from hydrological specifications, and an economic goal, using the economic equimarginality principle (Cai, 2008). Even when those optimization network-based models incorporate economic criteria (Brouwer and Hofkes, 2008; Maneta et al., 2009; Salla et al., 2014; Chakroun et al., 2015; Kahil et al., 2015; Garbe and Beevers, 2017; Ghosh et al., 2017; Ahmadaali et al., 2018; Giri et al., 2018; Gunawardena et al., 2018; Maria et al., 2020) and can calculate the economic optimum (hydro-economic models) and to measure the direct economic impacts of this allocation, they are not able to obtain broader socioeconomic indicators such as: GDP, employment, government revenues, consumption, investment, exports and imports, income distribution, or comparative advantages between sectors. Models that can generate these values are known as economywide and examples of them are Input-Output and Computable General Equilibrium (Bekchanov et al., 2017; Sun et al., 2020). These, however, lack satisfactory spatial and hydrologic representations. Because of this, the measurement of these last indicators associated with water allocation decisions is still a challenge.
This study integrated hydrological optimization models with an IOM to measure broader economic impacts, linking them to allocation decisions in the management of water resources, such as reservoir volumes and water allocations at the basin level. The optimization models available in the platform maximized different hydrological objective functions (see Figure 2) making it possible to provide values for water decision variables simultaneously in all time periods, considering all inflows related to the full-time horizon period under analysis (2011–2013), when a severe drought in the study region occurred.
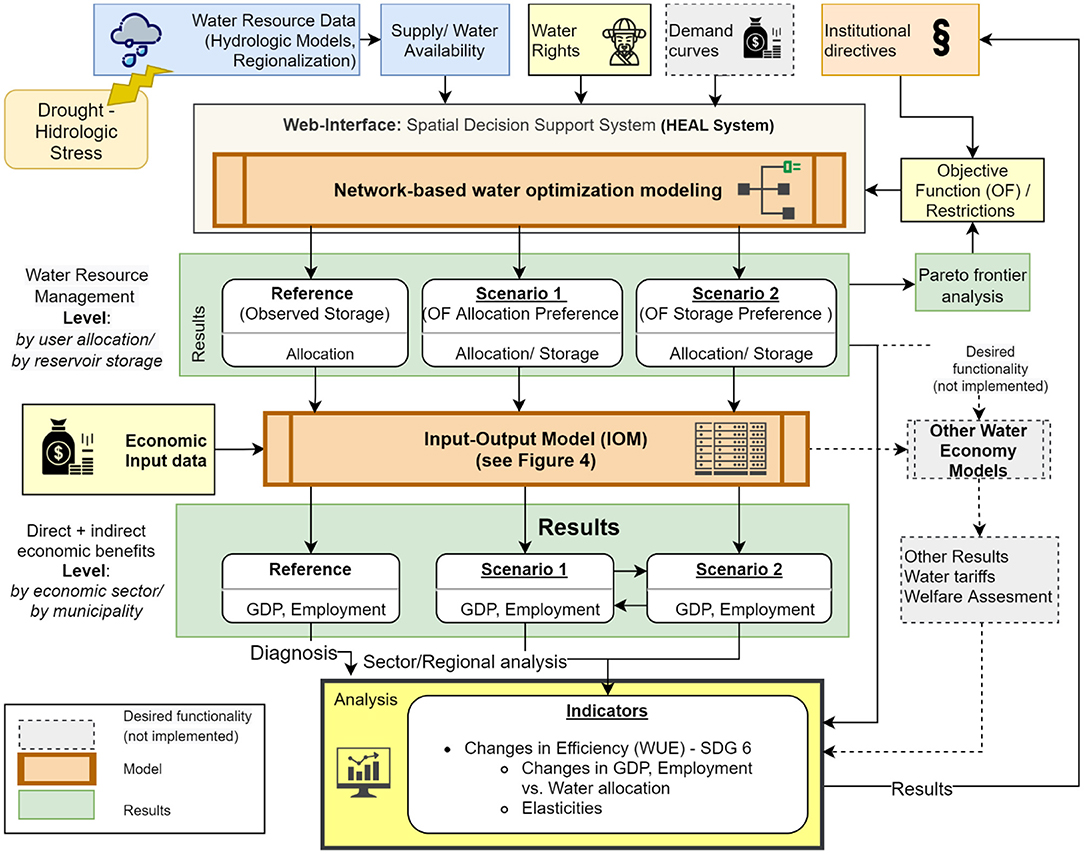
Figure 2. Modeling concept –Flow chart of the Integrated Economic Modeling platform.
Figure 2 shows the modeling concept as flow chart of the used methods and materials in an illustrative manner. Water supply and demand data was used together with institutional directives [constraints, objective functions (OF)] to identify water allocation of all water users. The trade-off of different water allocation strategies were analyzed using distinct OF in the optimization model. The chosen scenarios for this study representing opposing objectives, regarding water allocation for users and water storage, which were analyzed using a pareto frontier analysis. The “Storage Preference OF” represents a more conservative water resource management and “Allocation Preference OF” a less conservative water resource management. To measure broader economic impacts, the optimization model results were integrated with an inter-regional (IOM), which represents the same economic sectors and regions (municipalities and groups of them) of the user demands in the network-based model. Such integration does provide direct and indirect economic impacts of water management decision related to water infrastructure and availability. These results are expected to support water policies that recognize and incorporate broader economic measures associated with water security and resilience.
The next sections briefly describe the developed models, detailed descriptions can be found in the Supplementary Material. The strategy for coupling these optimization models with the Input-Output Model (IOM) disaggregated for the same study area is also described. This integration can produce socioeconomic impacts, associated to different water allocations for each user, for economic sector and for region. This makes it possible for institutions, that are deliberating or making decisions on water allocations on end-user scale, to use an economic analysis for their decision-making.
The network-based water optimization models were developed with different hydrological objective functions, with the same institutional and physical constraints, regarding the problem of water allocation, using a Spatial Decision Support System (HEAL System) (Souza da Silva and Alcoforado de Moraes, 2021). The platform uses a water network consisting of demand and supply nodes, to identify hydrological optimal water allocations between different water uses, subject to physical and institutional constraints. Different types of constraints and mass balance were applied for different types of nodes. The network structure of nodes and links can spatially represent the main components of the water system, integrating hydrological and economic information. This spatial location of water supply and demand in these models allow geographical location of all components of the water balance of a basin, such as inflows, evaporation, demands, return coefficients, and reservoir storages and releases. Relevant water infrastructures such as the larger reservoirs are also represented.
The network-based model is based on graph theory with water transport represented through a directed graph (or links). The nodes represent the physical entities (main users and water sources in the region) and links the logical connections between these entities. As already mentioned, there are two different types of nodes: (1) supply nodes, such as rivers, channels, and reservoirs; (2) consumptive (off-stream) demand nodes (irrigated agriculture, industrial facilities, and domestic demands) and non-consumptive (instream) demand (hydroelectric, recreational, environmental). Depending on the type, these nodes will have different attributes. Among the supply nodes there are stream nodes, which represent intermediate points along the river channels, segmenting them, and reservoir nodes, the waterbody's (storage capacities) of the study area. From these supply nodes the demand nodes (water user/uses or representative of the various water users) are connected. Figure 3 shows the created network for the case study and the interface of the HEAL system. Additional information regarding the node-link network can be found in the Supplementary Material.
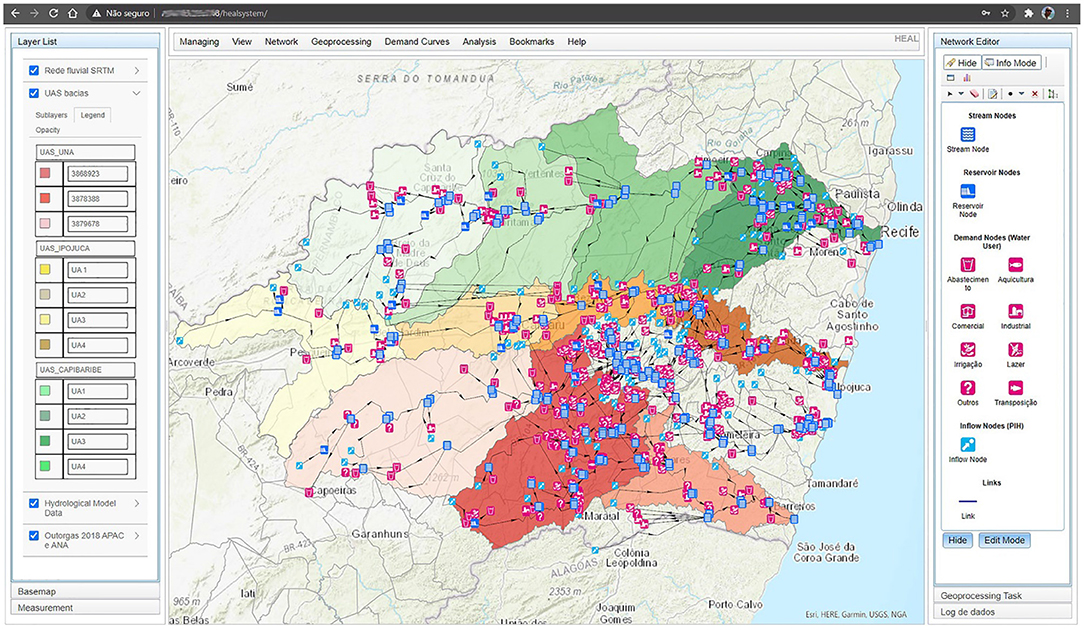
Figure 3. Web-interface HEAL System, Layer with Units of Analysis (UA) of the Capibaribe, Ipojuca and Una hydrographic basins; created network of nodes and links.
The HEAL System automatically generates optimization models for GAMS (General Algebraic Modeling System) (Rosenthal, 2012) from the created network. The non-linear problems were solved using GAMS and employing the Conopt3 solver. The economic data, in addition to the physical information's, is associated with the network nodes (spatial objects), this information is important to enable linking optimization (physical) models to economic models (IOM). The Supplementary Material shows detailed information's regarding the algebraic formulation of the network.
The optimal results provided values for the decision variables, which are the values allocated, simultaneously, in all periods of time (months/ years) considering all inflows relative to the same time period under analysis (2011–2013). The models used optimization techniques (Cai et al., 2001) to represent the complex problem of water allocation between the network user nodes, representative of the study area–involving 116,046 variables and 102,129 equations (objective functions and constraints). Part of these constraints were physical, part institutional. The physical constraints determined that the optimal allocation of water resources to users who demand water for their activities needs to be compatible with the water supply in each source of supply in the network of nodes and links to which the user is connected. Thus, spatial and temporal limitations along the river and across the basin could be considered. Besides meeting the supply balance described above, the supply nodes representing reservoirs must respect the operating limits, such as minimum volume, capacity for water intake and spillway (see Supplementary Material).
The input-output model enables the view of the monetary flow between the productive sectors and the final demand, that is, it allows to identify the interdependence of productive activities as regards the inputs used in the production process and the products (Miller and Blair, 2009). A simplified framework of the input-output model is shown in Figure 4.
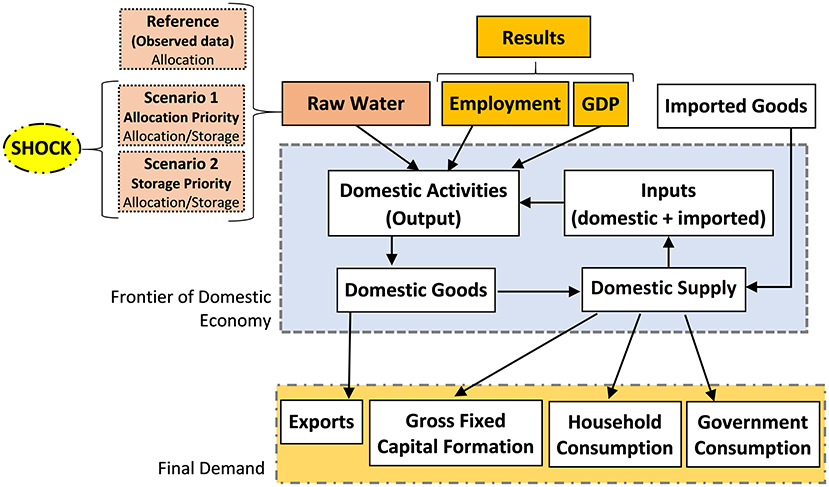
Figure 4. Input-Output Model Framework.
The interregional IOM used in this study was developed with 76 economic sectors for 75 regions (based on the type of uses and regions identified in the basins), obtained from a Brazilian IOM of 2011 (Guilhoto et al., 2010, 2017). The regional division comprised Rest of Brazil, Rest of the Northeast, Bahia, Rest of PE, 68 municipalities and three municipal clusters belonging to the four interlinked basins (Capibaribe, Ipojuca, Una, and Sirinhaém).
An IOM describes the economy in a matrix form (Leontief, 1986; Miller and Blair, 2009), as illustrated in Table 1, using a Transaction Matrix (Z), which represents the intermediate consumption matrix. Each element of that matrix (Zi,j) represents the monetary flow from sector j to sector i. The value of input i is consumed in the production of sector j; Yi,r is the vector of final demand, where Yi,r is the production value of sector i in the r region, destined for final demand. Keep in mind that the final demand is composed of Exports, Household Consumption, Government Consumption, Gross Fixed Capital Formation (Figure 4). Below the columns, the following are registered: the Value Added (VA) vector, where VAj is the value added of sector j; the Production Value (Total Output) vector for each activity (vector X); the Employment vector (E), where Ej is the employment of sector j (number of jobs); and RWj, the raw water vector of sector j (m3).
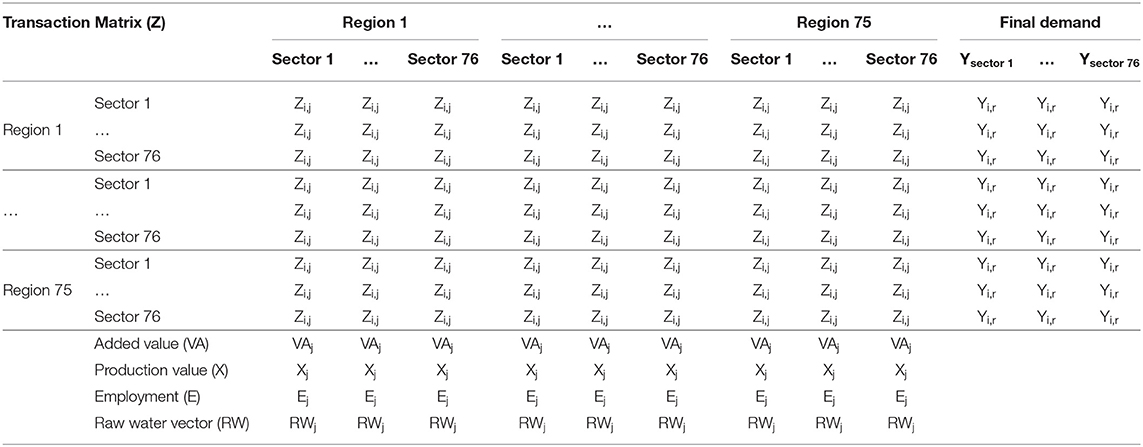
Table 1. Transaction Matrix (Z) used in this study.
The value of production (Total Output) or final demand by sector in each region, can be found in the last column or bottom row of the Transaction matrix according to the equations:
Where the production value of sector i is equal to the intermediate consumption of sector i plus the final demand of sector i in region r; or also, the production value of sector j is equal to the inputs of sector j plus the value added by sector j in region r. Assuming that the intermediate flows per unit of the final product are fixed, one can obtain the Leontief open system (Leontief, 1986), where the final demand is considered to be exogenous to the system and we have:
Where: ai,j is the technical coefficient that indicates the amount of input from sector i needed to produce a unit of final product from sector j in region r and thus the equation above can be written as follows:
Where A is the matrix of technical coefficients (n x n); X and Y are column vectors of order (n x 1).
Assuming a shock in the demand of this economy in each region r and economic sector n and writing in terms of variation we have:
ΔX = AΔX + ΔY resulting in (I − A)ΔX − ΔY = 0; where I is the identity matrix r.n x r.n;
We then have a system of r.n equations with r.n variables and are able to calculate the effect of the shock on the production vector of this economy by the change of the demand in each sector and region: . This is the use of traditional IOM, where final demand is used as an exogenous variable and the production output (X) as endogenous component.
Considering the comparative static analysis, in this study a mix of exogenous/endogenous component was more suitable. The production technology used considers the use of inputs in fixed proportions (Leontief Technology). The input-output matrix is estimated from monetary flows, and the analysis is performed considering that prices are constant. Thus, as prices are constant, changes in the output (in monetary values) correspond to changes in the physical units. Therefore, all sectors in which there was raw water allocated in the reference scenario, in the base year (2011), production (X) was an exogenous variable. This means that changes in production due to water allocation, as a result of different raw water allocation strategies, were made outside the IOM. Then, the variation in the raw water allocated between the economic sectors and regions of the study area in relation to the value used as reference in 2011 (ΔRWj) represented the conditions of the different scenarios and years of the series and was used as an exogenous shock in the IOM. The two models are thus integrated and able to measure the direct and indirect economic impacts of different water allocation strategies. For this, the variations of Xi were admitted, in percentage terms, equal to the respective percentage variations of their raw waters.
Where is the percentage change in , and is the percentage change in .
The shock, in our study, is attributed to the production vector of this economy given by the increase (or decrease) in the allocation of raw water. This increase/decrease was given by the optimization model results in each scenario, compared to the reference, which is given by the values of the raw water line in the IOM in 2011, for each economic sector (j = 1, 2, …, n) and region (k = 1, 2, …, r). This formulation resulted in 5.700 equations and 10.700 (endogenous and exogenous) variables. More detailed information about the interregional IO model integration can be found in Supplementary Material section The input-output model (IOM) and the algebraic formulation of the network-based and IO-model integration.
To analyze trade-offs and economic impacts, three scenarios were built to obtain the optimum allocation for the years 2011 to 2013, following hydrological criteria's (non-economic criteria's), namely: maximizing the fulfillments of meeting the water requirements (demands) and storage of the reservoirs. The hydrological or “engineering” criteria is based on water allocation strategies, which are mainly considering water quantity measures (attend demands and provide water security), without considering economic impacts and trade-offs. For example, during the drought period in the case study, water allocation was driven by cutting arbitrary percentages of the main sectors (domestic/service, industry, agriculture), without considering direct or indirect economic impacts for the sectors/regions.
All scenarios have identical initial storage conditions (the observed reservoir storage conditions in 2011). The reservoir depletion in the drought event is analyzed using the same boundary conditions. Scenarios 1 and 2 have the same initial and final storage conditions. All analyses are carried out in relation to the Reference (Baseline) scenario year 2011, therefore only relative values were used.
The first scenario (Reference scenario) simulates the real use of water in the study area in the period and established the water use reference (2011) for the other two scenarios for comparison (Baseline). This reference is obtained through the optimization model too, using the observed values of the reservoir volumes and the rules followed by the water resources management agencies. The mathematical formulation for that simulation using a stepwise multi-objective approach, starting by minimizing the difference between the storage volumes resulting from the model and the observed storage volumes of the main reservoirs (Equation 6). Thereafter, water is allocated for public (domestic) water users (Equation 7), priority policy currently adopted in Brazil). At last, the allocation to all other water uses is maximized (Equation 8).
Reference Scenario: Observed Reservoir Storage calibration (SR) with water allocation (da)
1. Objective Calibration with observed Storage
2. Objective Priority Water Allocation (da) - Priority for public (human) supply demands(hs)
3. Objective Water Allocation (wa) for all users demands
Scenario 1 and 2 were designed with the purpose to measure impacts of different strategies. The Allocation preference (Scenario 1) maximizes the fulfillment of demands but requires that there be a minimum volume stored in the reservoirs. The second scenario (Storage Preference) does the opposite: maximizes the volume stored in the reservoirs, ensuring a minimum amount to meet the demands. The following equations illustrate the objective functions used.
Scenario 1—Allocation Preference: Tradeoff consumptive demands (da) with fixed reservoir constraint (SR)
Scenario 2—Storage Preference: Storage maximization with fixed water allocation
The scenarios created (Scenario 1 e 2) represent two different water allocation strategies and can be seen in the two-objective plan (see Figure 5), known as the Pareto efficient frontier, related to two criteria (OF 2 and OF 3) used in the optimization models. It is noteworthy that the models assuming perfect foresight of the hydrological supply for the 3-year-period studied. The values of the objective functions are summed physically quantities (flow/storage) over the simulation period. It is important to highlight that the water use simulation results (Reference scenario), for the same period, appears on the graph as being dominated by the others, that is, it appears inside the Pareto frontier. That means that under the actual water use, at the time period, both objectives could be improved: meeting demands and stored volume in the reservoirs. The solutions on the Pareto frontier are dominant, but there are trade-offs among them (scenarios 1, 2). For example, greater compliance with the demands of scenario 1 represents lower volumes in the reservoirs, which are higher in Scenario 2, but with fewer allocations and failure to meet some of the demands.
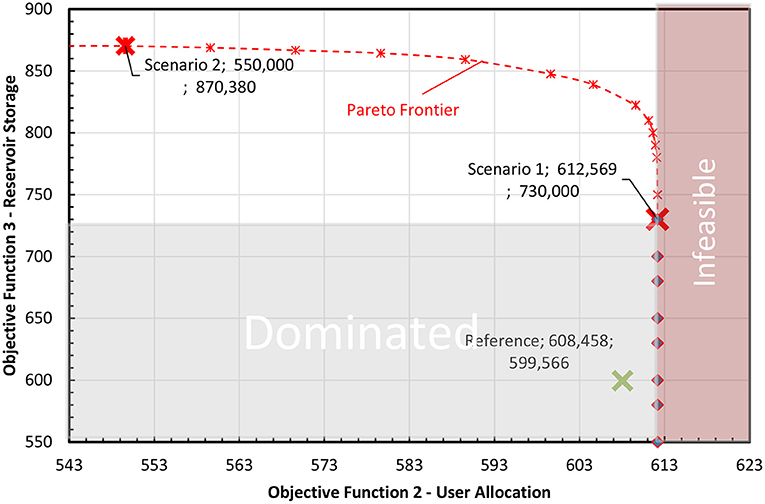
Figure 5. Pareto efficient analysis–Representations of the scenarios OF results in a scatterplot with two objectives (Allocation preference OF 2/Storage preference OF 3).
The results of the network-based modeling defined by these scenarios are hydrological optimal allocations of raw water. These allocations represent the effects of using regulatory instruments (command-and-control), from the meeting the maximum possible demands, to the more conservative strategy regarding storage in reservoirs. The Scenarios 1 and 2 (Figure 5), as the two diametrically opposed points on the Pareto border, can represent the limits of performance of these regulatory demand management instruments. To compare the Storage Preference allocation strategy to the one that is less conservative (Allocation Preference—Scenario 1), water allocation reductions by users are aggregated by economic sector/regions in the IOM, which supports the evaluation of regulatory demand management instruments, incorporating socioeconomic impacts.
The evaluation of the water allocation strategies (Scenarios 1 and 2) and the trade-off between them is obtained from the integration of the network-based model with the regionalized IOM, whose results were able to produce indicators associated with goal 6.4 of the Sustainable Development Goals (SDGs) of the United Nations. Those indicators were produced for the Scenarios 1, Scenario 2 and Reference Scenario (diagnosis), according to FAO (Food and Agriculture Organization of the United Nations) recommendations (FAO, 2018, 2019). The goal (6.4 in FAO, 2018) is associated with an increase in the efficiency of water use in all sectors, as well as a substantial reduction in situations of water stress and is anchored in two indicators: Water Use Efficiency—WUE and Water Stress—WS.
The WUE Indicator deals with the measurement of water use efficiency in countries and regions. The WUE is obtained considering the ratio between the GDP (Gross Domestic Product in US $) of a region or economic activity, and its consumption of raw water (m3). Therefore, the WUE (US $/m3) indicates the monetary value generated by the volume of water used. The higher the value of this indicator, the greater the efficiency in the use of water of the sector or region (FAO, 2018; Montoya and Finamore, 2020). The WUETotal consider the sum of WUE of three sectors–Agriculture (A), Industry–MIMEC2 (M), and Services (S)–weighted by the proportion of water used (P) by each sector, according to the following equation:
In the same manner, the WUE can indicate the number of employments generated per volume of water used (Employment /m3) (Montoya and Finamore, 2020). The WUE values can vary widely depending on the predominant economic activity in the region studied. Regions where the economy is heavily based on agriculture have a low WUE, while regions where the economy is based on industry and services have higher a WUE (FAO, 2018).
Using the recommendations of the FAO, for this study, efficiency indicators, as presented in the result section, are built using the integrated modeling for each scenario in the period studied. The allocated values of raw water are identified by the optimization model for each demand node (requirements (water demand) given by their water rights grants), associated to an economic sector and a municipality in the study area by aggregating these values by sector/region of IOM, water abstraction rather than water consumption in each scenario is used to build the efficiency indicators, as recommended by FAO. Another important point is that, given this, the employment of the water data used to build the efficiency indicators is completely based on the values required and declared in the water rights grants. In general, the raw water use values based on the grants seem to have underestimated the real water use values in agriculture, which are obtained from the irrigated areas with impacts on the efficiency values, as will be discussed in the result section Diagnosis.
In the reference scenario, in the base year (2011), the water allocation is supposed reflect the total attendance to the demands, as this year was a wet year (above average rainfall and stored water volumes at maximum level), and therefore represent the real water use of the different users, sectors, and regions. Because of that, these water use values were used in the raw water line in the IOM (see section The Input-Output Model and the Algebraic Formulation of the Network-Based and IO-Model Integration), for each economic sector and region, and will be used as a reference when analyzing changes in water deliveries due to the different allocation strategies (scenarios 1 and 2) in the studied period (see section Results).
In the case of economic sectors which use part raw and part treated water, and those which only use treated water, the treated water values are obtained through IOM, have been added to those of raw water, to represent the total use of the respective sector, based on the water abstraction of the sector / municipality. In the other words, for the estimate of the water used in each economic sector, the raw water and the treated water used in each one of them are added, except for the “Water & sewage” sector. For this sector, it is admitted that all the raw water used by it is fully converted into the treated water. Thus, to avoid double-counting, the use of water in the “Water & sewage” sector the water use is admitted as being only treated water (self-consumption).
The economic values of GDP from the perspective of income and jobs for each of the 76 economic sectors of the regionalized IOM for the study area in all scenarios are aggregated into three major sectors, seeking to follow the FAO (FAO, 2018)—see Supplementary Table 2, which establishes the following aggregation using the sectors listed in the International Standard Industrial Classification of All Economic Activities (ISIC) Rev 4: Irrigated Agriculture (ISIC A, excluding forestry and fishing); MIMEC (ISIC B, C, D, and F) and Services (ISIC E, G to T). Sector E includes the treated water production and distribution sector. Following recommendations from the same document, some adaptations were made in the economic sector aggregations of our study area. The first concerns issues of homogenization of the efficiency values found; the second concerns the industries (MIMEC). Those that are supplied through water distribution companies (E), and therefore do not draw raw water directly from water sources, had their values added to constitute the measure of efficiency in the Services sector. Given that through the regionalized IOM used in this study, we could identify the use of raw water and treated water by sector/region, from sectors B, C, D and F, those that are supplied only with treated water became part of the Services group (in our study C and D had become Services), and not of the MIMEC group. The sectors of the IOM in our study area and the classification made for each of the sectors in the study area, according to the aggregation of sectors described above, can be seen in Supplementary Table 3.
The economic values of the regionalized IOM are in current values for 2011, which was considered the base year in this study. The economic values were converted into US dollars prevailing exchange rate of the base year (2011), to obtain water use efficiency indicators given in USD/m3, for each aggregate sector and region (Exchange rate: R$ 1.67 per U.S. dollar).
To consider the economic results associated only with the agricultural economic sector, given that there is no disaggregated data on value added for rainfed and irrigated agriculture in the IOM, we used the Equation (12) suggested by FAO. This equation uses the proportion of irrigated total cultivated land (Ai), to calculate the proportion of agricultural gross value added produced by rainfed agriculture (Cr) for each sector and municipality. The generic default ratio between rainfed and irrigated yields is 0.375. Finally, the value of agricultural GDP for the sector and municipality is multiplied by (1–Cr) (IBGE, 2006). The (Ai) values used were obtained in the 2006 Agricultural Census for each crop and municipality and are kept the same in all years studied (2011, 2012 and 2013) (Supplementary Table 4).
The water stress (WS) indicator used in this study also follows the methodology recommended by the FAO. However, this indicator does not vary with scenarios, this is because the surface water availability is estimated using long term hydrological time series for the basins (PERH-PE, 1998) and the water withdraw is given by the requirements that in the studied period of 3 years did not change. The indicator provides an estimate of pressure by all sectors on the region's renewable surface water resources. In our study, the indices are obtained using the water availability as described in the Supplementary Material section Water supply and demand data required for the integrated modeling and the water withdraws obtained by the model based on water right grants (requirements of the region's demand nodes).
Regarding the environmental flow requirements, most of the study area is within the semiarid region of Brazil, with intermittent rivers, and no groundwater or base flow, therefore no environmental flow was considered. This is also given by the state water resource plan (PERH-PE, 1998).
The assessment of the allocation strategies represented by Scenarios 1 and 2, in the study area, started from a socio-economic diagnosis, carried out in the Reference scenario, for the base year (2011), using the allocations of raw and treated water and their socioeconomic impacts on the different economic sectors and regions. Both for the diagnosis in the base year (2011) and for the two hydrological allocation scenarios (Scenarios 1 and 2) in the model period, the storage volumes, flows and water deliveries to the users of the network could be associated to socioeconomic impacts using integrated modeling, which in turn enabled the production of regional/sectorial indicators, including ones associated with goals of the United Nation's SDGs (see section Indicators for Evaluation of Water Allocation Strategies).
The integration of the network-based water model with the Input-Output model (as described in section The Input-Output Model and the Algebraic Formulation of the Network-Based and IO-Model Integration), made it possible to identify the raw water used as well as the GDP and number of jobs generated, by both the economic sector and by municipality in the study region for all scenarios in the model. Furthermore, based on this information, water use efficiency (WUE) and jobs generated per million cubic meters of water used could be calculated in a broader scale. Table 2 shows the values of the reference Scenario, in the base year (2011), and their respective proportions, of Raw Water (RW), Treated Water (TW), Gross Domestic Product (GDP), and Employment (E), in the three aggregated sectors (Agriculture, Industry, and Services) for the 4-interlinked basins.
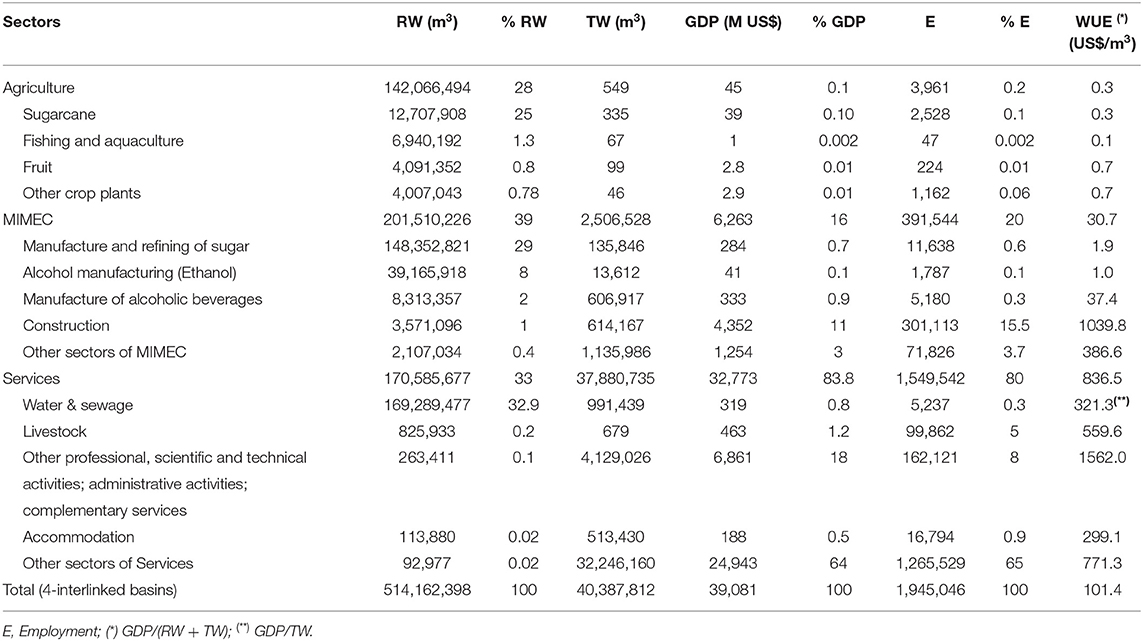
Table 2. Share of the use of Raw Water (RW), Gross Domestic Product (GDP), and Employments (E) for aggregated sectors in the 4-interlinked basins region [Reference Scenario; base year (2011)].
It is important to highlight that the reference scenario simulates the actual situation related to the water allocation and reservoir operation decisions, during the period studied, including the base year (2011). Furthermore, the economic data used in the MIP are calibrated for the same base year (IBGE, 2007, 2011), so the socio-economic data associated with water use and the efficiency indicators generated by sector/region in the reference scenario represent the actual situation in 2011. The results presented in Table 2, could only be generated simulating and combining observed data from the integrated model, and did not actually exist at this level of detail.
It is possible to observe that in the Agricultural sector, the use of raw water is higher than 27%, while the GDP and Employment represent 0.1 and 0.2%, respectively. Note that “Growing sugarcane” accounts for about 24% of raw water use, 0.1% of GDP, and just over 0.1% of Employment in the analyzed basins. The Agriculture sector, however, uses about 89% of its raw water use for sugarcane cultivation and accounts for about 85% of the GDP, and close to 64% of Employment.
The Industrial sector (MIMEC) uses approximately 39% of raw water, and accounts for 16% of the GDP, and 20% of Employment. The “Manufacturing and refining of sugar” sector and “Alcohol manufacturing (Ethanol)” are the most prominent. For all the 4-interlinked basins, sugar manufacturing and ethanol production represent ~29 and 8% of raw water use, 0.7 and 0.1% of GDP, and 0.6 and 0.1% of jobs, respectively. When analyzing only the Industrial (MIMEC) sector, the sugar and ethanol activities together represent almost 93% of the use of raw water, but only 5% of GDP, and 3% of jobs.
Services, in turn, use about 33% of all the raw water but represent close to 84% of GDP and about 80% of the jobs generated. Almost of the raw water in the Services sector is treated and distributed to the other sectors supplied by the distribution companies, including the Industry (MIMEC) sectors (see Supplementary Table 3), in addition to Final Demand.
Figure 6 shows the water use efficiency (WUE) indicator in the study region (Reference Scenario), considering 68 municipalities and identifying the three clusters of municipalities belonging to the four interconnected basins (Capibaribe, Ipojuca, Una, and Sirinhaém).
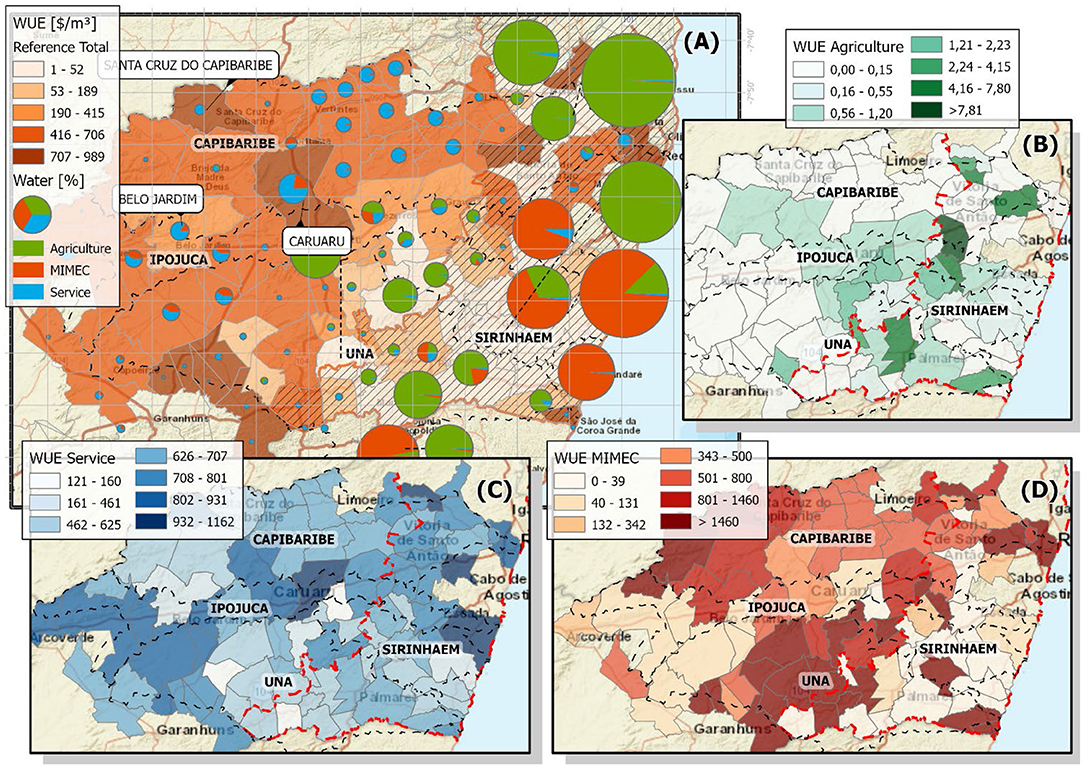
Figure 6. Water use efficiency (WUE) of sectors for Reference scenario in US $/m3, (A) Total WUE and water usage of sectors in % (pie chart), (B) Service (blue), (C) Agriculture (green), (D) MIMEC (red).
The Capibaribe Basin together with the western half of the Ipojuca and Una basins (Capibaribe portion) are composed of municipalities that have the highest WUE. The Sirinhaém basin along with the eastern half of the Ipojuca and Una (Sirinhaem portion) basins encompasses, in general, the municipalities with the lowest efficiency rates for water use.
These differences in efficient use of water can be explained by analyzing the WUE for the 3 aggregate sectors–Agriculture, Industry (MIMEC), and Services, together with the total amount and the proportion of water use by sector for each municipality/region (see pie chart in Figure 6). The Services sector has the highest values of WUE, followed by Industry (MIMEC) and then Agriculture (Table 2, Figure 6).
In the Capibaribe portion within the semi-arid zone (removing the part that is in the Zona da Mata area), the drier area within the region covered by 4-interlinked basins, the highest water use is by Services and Industry. These are the sectors that, for the 4-interlinked basins as well as for this portion, have the highest efficiency values (Table 2, Figure 6). The Services and Industrial sectors in this drier part of the study area are not large consumers of water. The greatest WUEs in the region are due to the Services sector, which includes many industries, who only use treated water distributed through the water companies.
The Sirinhaém portion, on the other hand, the wetter area within the 4-interlinked basins, uses higher amounts of water, mostly in the Agricultural and Industrial sectors. In that region, those sectors are constituted mainly (more than 90%) of sugarcane and sugar-alcohol manufacturing activities, which have low water use efficiencies (Table 2), due to their high water use requirements (see sector maps in Figure 6).
To illustrate water use efficiency (WUE) and water stress (WS) within the basins, Figure 7 shows the contrast between water availability, water demand and efficiency of water use. As can be seen the 3 basins to the north have high stress indexes, with the available surface water resources nearly depleted. Despite this, many municipalities in this region have low water use efficiencies, as well as high stress. This indicates the necessity for water management and policies for this region.
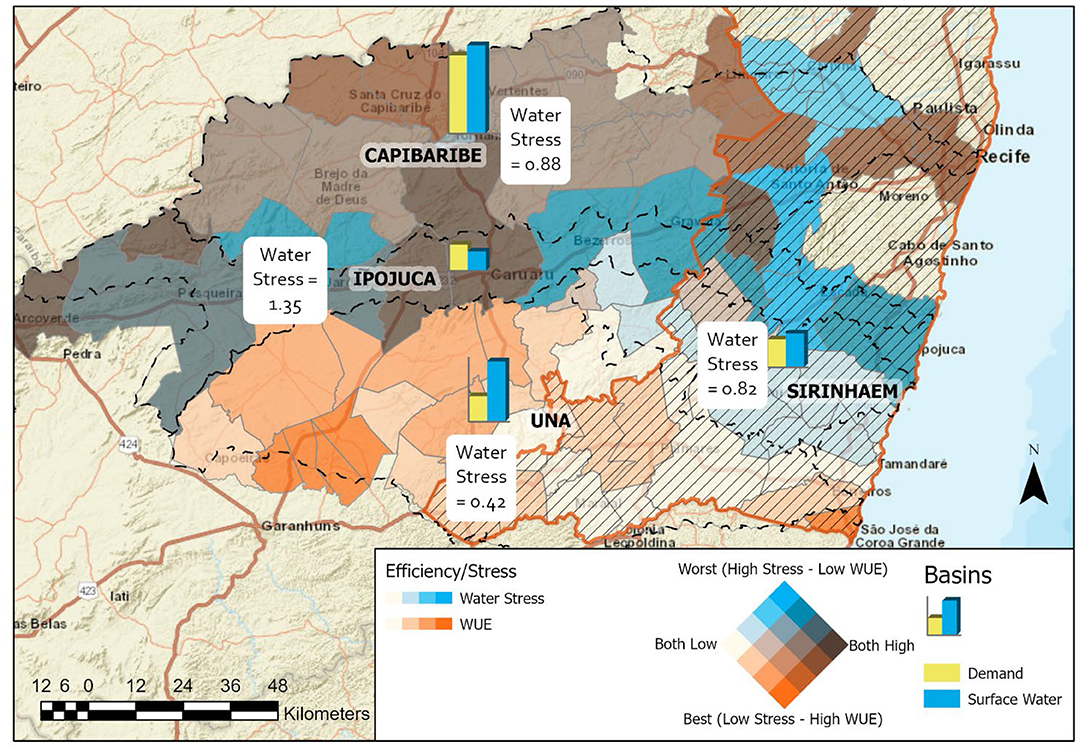
Figure 7. Water Use Efficiency [US $/m3] vs. Water Stress (bivariate choropleth map) and Surface water demand/availability (bar chart).
Two different regions appear in the Capibaribe portion when the two indicators (WUE and WS) are combined (Figure 7): one, the western half of the Una basin, with high efficiency of use (predominance of Services sector), and less water pressure in the basin study area. This marks the region as in the best situation in the study area in the base year, related to the need for management (high efficiency and low stress). The other region is in one of the few areas in the Capibaribe portion where agriculture is the predominant sector and uses a lot of water, presenting low efficiency indicators. Located close to the Recife (capital city of the Pernambuco state) metropolitan region this area under sugarcane cultivation represents the worst situation in the 4-basins area, in the base year as its low efficiency rates result in the high water stress associated with the Capibaribe basin. In practice this may be relative, given that the stress indicator was calculated for the Capibaribe basin, most of which is within an arid region, and the part described has higher humidity.
These same two indicators (WUE and WS) when combined in the Sirinhaém portion indicate another region that presents a critical situation for management (high stress and low efficiency): the Sirinhaém basin and the eastern half of the Ipojuca basin. Contrasting with the critical situation identified earlier, this region is located almost entirely within the humid region of the study area; thus, the combined indicators show intensive water use and should not be relativized. In the case of the Ipojuca basin itself, the stress situation is even worse, with total demand in the basin already exceeding availability by 35%. Thus, the low efficiency of water use in this critical region must be the object of extreme attention.
It was possible to verify that GDP and Employment presents a strong positive correlation between them (0.99). This allows us to expect that what was observed in terms of GDP for sectors/municipalities can be extended to employment analysis.
Integrated modeling can identify regions in the study area where the need for management was urgent in the base year (2011), as well as how the different economic sectors made use of and put pressure on water resources, as well as the generation of income and employment. This information is especially important for finding and evaluating options to reduce this pressure and improve water management.
Water use for integrated modeling was based on the water right grants issued by ANA/APAC (ANA, 2020) for the study area. As described in section Water supply and demand data required for the integrated modeling in the Supplementary Material, the water use values for the agricultural and industrial sector may have been underestimated (Supplementary Tables 5, 7), which would lead to even lower efficiencies in these sectors and higher levels of water stress in the study area. Even if, in absolute values, these indicators could be improved, the comparative analysis between them by sector and by region remains valid.
In order to represent the regulatory management instruments, we have used the results of Scenarios 1 and 2, which were obtained through the integrated modeling using hydrological means in making water allocations. As already explained in Section Scenario Design, these two points are Pareto-optimal (see Figure 5) and can represent well the limits of performance of the command-and-control water instruments. By restricting attention to these two points, that are Pareto-efficient, it is possible to measure the tradeoffs between them, which in economics is commonly expressed as opportunity costs.
The trade-offs are the differences between the integrated modeling results of these two scenarios. For example, the reservoir volume results for the 4-interlinked basins show that a more conservative strategy (scenario 2) of reservoir operation in the region would lead to an increased average stored volume of 34.04 Million m3. This contrasts with scenario 1 with an average water volume of only about 30.27 Million m3 for the entire period, indicating that the users under the second scenario were allocated higher volumes.
This means that there is a trade-off between stored volumes and meeting demands, associated to regulatory water management instrument capacities. This trade-off can be measured by integrated modeling using socioeconomic and water use efficiency indicators. Differences in water allocations by user, and the resultant variations in income and employment as well as differences in water use efficiency (WUE) indicators could be associated to these trade-offs between storage and allocations in the period (2011–2013) using the integrated modeling. As explained in the methods section (see section The Input-Output Model and the Algebraic Formulation of the Network-Based and IO-Model Integration), the structure of the economy represented by the IOM in 2011 is kept constant for the period studied (2011–2013), which means that the resulting socio-economic impacts in the period are due solely to the differences in water distribution among economic sectors and among the regions. By aggregating those results by economic sector and region, it is possible to assess the impacts of the water management instrument, including their contribution to the achievement of the SDG target 6. This is an innovative way of evaluating water management instruments.
The integrated modeling is applied using the two hydrological criteria for the 4-interlinked basins. The difference between the results of two scenarios (S2–S1) results is aggregated (see Table 3), first, by economic sector and compared with the Reference scenario for the base year (2011), then the same results will be obtained by municipality/ region.
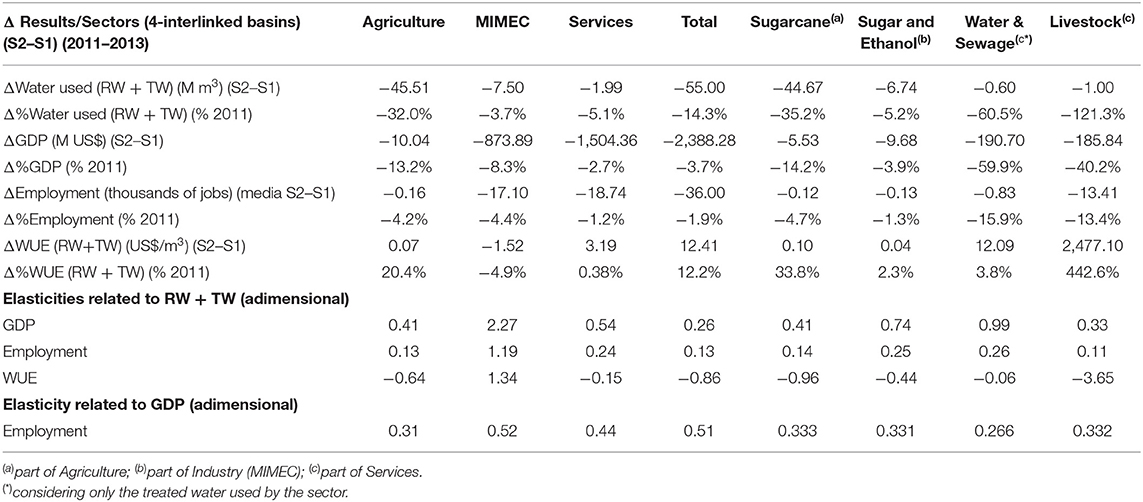
Table 3. Differences in the integrated modeling results associated to the trade-offs between Storage (Scenario 2) and attendance (Scenario 1) objectives for the 4-interlinked basins (2011–2013).
Proportionate Economic impact [Δ%GDP (% 2011) and Δ%Employment (% 2011)] and water impact [Δ%Water used (RW+TW) (% 2011)] are calculated for the whole sector in the study area. (see Table 3) All proportionate variations (Δ%'s) are calculated using the corresponding value in the Reference scenario, for the base year (2011).
This proportionate water impact can be seen as a measure of the intensity of water reduction allocations, in relative terms, required to increase storage (trade-off), using a regulatory instrument. The proportionate economic impact, in the other hand, is a measurement of that reduction, from the point of view of social and economic losses. When evaluating these measures by economic sector, the socioeconomic impact of the trade-off, is evaluated in each of the sectors for the 4-interlinked basins.
Elasticity refers to the measurement of a percentage change of one variable in response to a change in another, an indication of a variable's sensitivity to a change in another variable. Being a unitless ratio, an absolute elasticity value >1 of one variable over another means that the first variable responds proportionally more to changes in the other variable. In contrast, values of absolute elasticity <1 means less than proportional changes.
In this study, we have calculated the ratio between the proportionate economic impact (changes in the socioeconomic indicators) in response to the proportionate water impact (changes in the water allocations) for each economic sector. Those elasticities can show the socioeconomic indicators' sensitivity to a change in water allocations, in each economic sector. Elasticities of social (employment) and economic (GDP) indicators <1 show that the allocation strategy, the current network and the water availability of the period, changed water allocations in that sector, so that economic and social losses were proportionally smaller in relation to water reduction. This can occur either by reducing the proportion of water allocated to less efficient activities, implying an increase in the proportion of more efficient ones, or by increasing efficiency, especially of activities that use proportionately more water. In both situations, efficiency gains in the sector are measurable (ΔWUE). Sectors with elasticities >1, on the contrary, suffer proportionate economic losses greater than reductions in water and therefore have losses in efficiency.
Those efficiency variations (ΔWUE), in its turn, also could be measured as an elasticity related to the changes in water allocations [Δ%WUE (% 2011)/Δ%Water used (RW+TW) (% 2011)] in each economic sector. Thus, this elasticity can measure the efficiency indicator sensitivity to a change in water allocations in the sector. This value thus represents the capacity of the water instrument to improve efficiency, which is an important goal of these demand instruments. The effects of the management instruments can be assessed, by sector, as well as water security issues associated with social and economic indicators and efficiency gains for the entire study area.
The results for the 4-interlinked basins showed that the trade-offs between storage and allocations attendance objectives, required under a regulatory instrument, causing the Agriculture and Services sectors to present socioeconomic losses proportionally less than the proportion of water reductions to them, resulting in elasticities <1, for GDP and jobs. The way these cutbacks in water are implemented by the instrument thus lead to efficiency gains in these two economic sectors in the study area (see Table 3).
In the case of the Agricultural sector, practically all the water reduction required occurred in irrigated sugarcane. The instrument reduced the allocation of water to the crop, changing to 85% of water used in the sector, against 89% in the base year. This reduction results in a proportional increase in water use for other crops in the sector, all of which are more efficient than cane (Table 2). In addition, efficiency of water use is higher in sugarcane activity (Table 3), explaining the low elasticity of the agriculture sector as a whole and its efficiency gains.
Related to the Services sector, in terms of raw water (see Table 2) almost all the allocation is made to the water & sewage activities (99.51% of the raw water in this activity), with almost all of its water collected in the form of treated water distributed to the Service and other sectors (MIMEC and Agriculture). The efficiency of water and sewage activities, as well as the effects of reductions required by the regulatory instrument, are considered only in relation to the use of treated water, and not raw water. Therefore, the item Water & Sewage activities should not be compared with the other sectors and activities, which consider all water used, both raw and treated (Table 3).
The network-based model allocates raw water by hydrological criteria in all scenarios to the water & sewage activities. With reductions in water & sewage activities, only water delivery between the various existing water treatment plants is modified. The I-O Matrix, in view of the new allocation of raw water between stations, then reallocates the treated water, according to the same proportions as the base year, thus impacting all other activities associated with Services as well as the other sectors.
The sectors within the Services group in this study (see Supplementary Table 3) are sectors traditionally considered in this category (ISIC E, G to T) (FAO, 2018), as well as some industries (ISIC C and D), supplied only with treated water from water distribution companies (E). In addition to these, according to FAO guidelines, other sectors, not traditionally categorized as Services, were included, such as livestock, in order to homogenize efficiency values in the study area. In this way, the WUE for services was not significantly changed and WUE for agriculture showed a relatively similar value to that found in other studies (FAO, 2018; Montoya and Finamore, 2020). In terms of water management, this aggregation is acceptable.
In fact, in relation to the base year, the water reduction required as a trade-off for storage under regulatory instruments removes an important part of the water from livestock, but without impact on the efficiency of the Services sector aggregate. The other Services activities undergo other reductions in the sector (49.75%), which leads to small increases in its efficiency and in the efficiency value gained in the Services sector (+ 0.38%).
The industrial sector (MIMEC) is the only one in the study area that presents positive elasticities of socioeconomic indicators higher than 1. This indicates that economic losses in this sector alone are proportionally higher than the reductions in raw water imposed by the regulatory instrument as a trade-off for increased storage, network and water availability in the studied period. Although the reduction in absolute terms is high in the sugar-alcohol industry, which is the largest consumer in the base year (93.06% of the sector's water) and has efficiency well-below the sector average (Table 2), proportionally the use of water in the activity increases (93.18% of the water used in the sector after the reduction), and there also efficiency gains of this activity, but they are small (Table 3). This implies a proportional reduction of water required for other industrial activities, which on average are almost 30 times more efficient than the sugar-alcohol industry. Industries in the study area, not including sugar and alcohol, are not water-intensive and are located almost entirely in the drier area. These have much higher efficiency values than sugar-ethanol companies and represent a percentage loss both in the use of water (from 6.94 to 6.81%) and in efficiency (−9.5%). This explains the proportionately higher economic and social losses of the industrial sector as a whole, as well as the greater efficiency losses being imposed on that sector, due to the application of the regulatory instrument, in those infrastructure and hydrological conditions (Table 3).
The adoption of a particular instrument, given the existent hydraulic infrastructure and specific water availability for the time and region selected, has its effects reflected in the resulting variations in the sectorial socio-economic indicators. Thus, integrated economic modeling supports management decisions by including broader socioeconomic impact measures in water instruments use.
The results of variations in the main socio-economic indicators (GDP and Jobs) and efficiency values (WUE), in the face of water reductions required as a trade-off under regulatory instruments can also be obtained by municipalities and regions. In the case of analysis by municipalities/regions, the effects of the reductions required are measured through changes in water allocation between sectors within the same municipality, resulting in an assessment of the water instruments at that same level, made through losses of social and economic resources located there, as well as changes in WUE.
Different regions in the study area, have already been characterized above (section Diagnosis) in relation to socioeconomic indicators, water use intensity, water use efficiency (WUE), water stress and the need for management (Figure 7) in the base year. The effects of the water allocation reductions are now evaluated by municipality/ regions and are associated to their previous characterization (section Diagnosis).
As already seen in section Diagnosis, the highest uses of water in absolute values in the base year were concentrated in the eastern region of the study area (Sirinhaém portion, the wetter area). Water uses are almost entirely for irrigated sugarcane and the sugar and ethanol manufacturing activities, the very ones that showed low efficiencies in the study area (Table 2) and especially in this region (Figure 6), which is critical from a management perspective (Figure 7). The GDP values of the municipalities in this same region (Figure 8) are high with the Services sector, in relative terms, followed by the sugar and alcohol industry. The GDP associated with irrigated agriculture is negligible and only two municipalities have some percentage of their GDPs related to this sector.
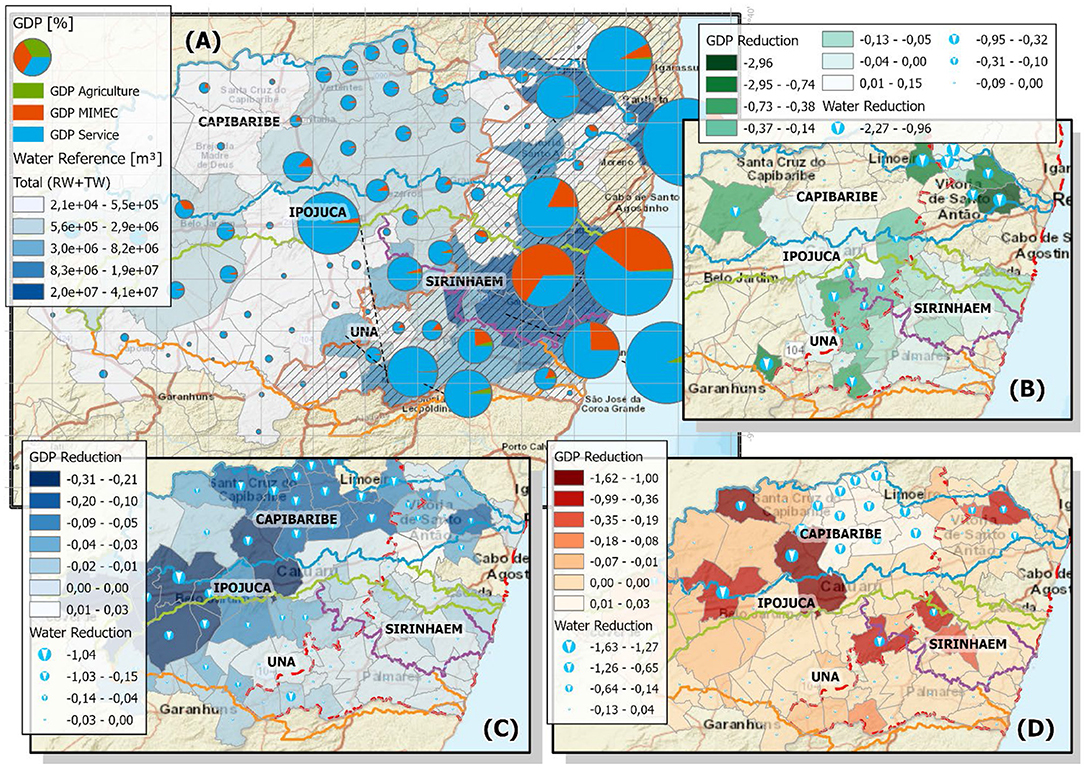
Figure 8. (A) Allocated water (RW+TW) in m3 and GDP of economic sectors in %; Corresponding relative GDP/Water reductions of sectors [Scenario (2–1)/Ref)] in the municipalities [Agriculture: green (B), MIMEC: red (C), Service: blue (D)].
The highest proportional water reductions required as a trade-off in this region occur in sugar and ethanol industries followed by agriculture, which led to GDP reductions in both sectors (Figure 8). The water impact [Δ% Water used (RW + TW) (% 2011)] for most of municipalities in the region was low (light blue Figure 9) or moderate (medium blue Figure 9), These can be associated with the greater water availability in the region and the presence of reservoirs. The associated economic impact [Δ% GDP (% 2011)] imposed by the instrument is also presented (Figure 9) and can be evaluated in relation to water constraints, through elasticities. GDP elasticities <1 (inelastic) in a given municipality, show that economic losses were proportionally smaller in relation to water reductions, and the opposite occurs, if they are >1 (elastic).
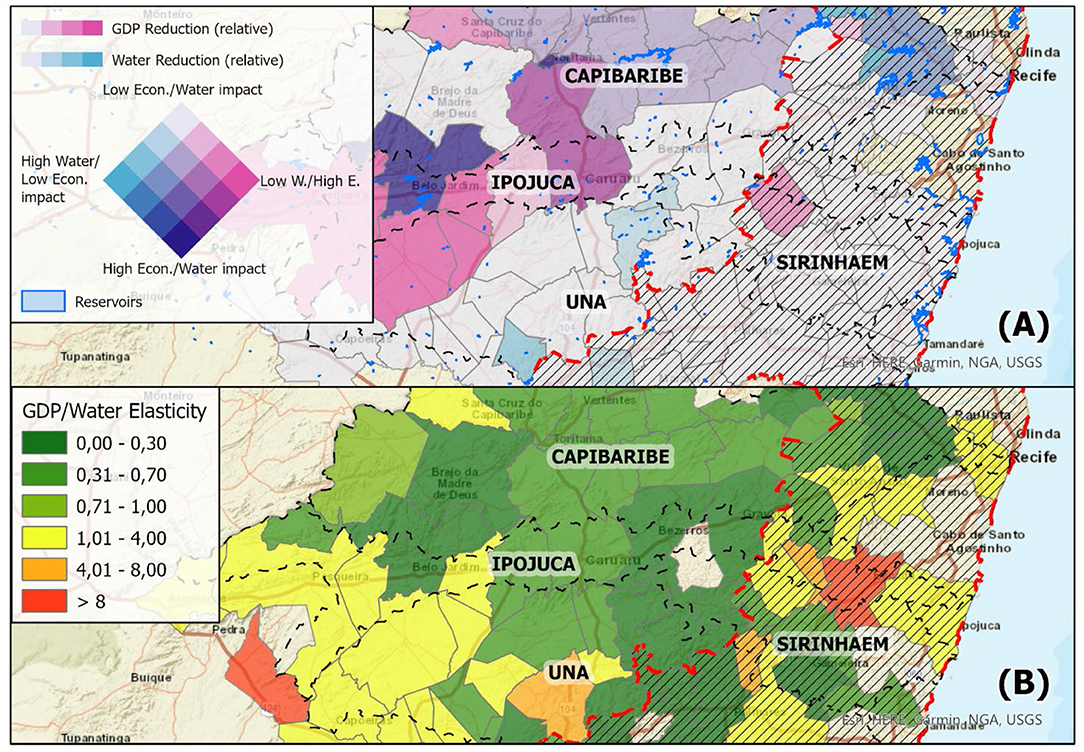
Figure 9. (A) Relative Economic and Hydrologic Impact in the municipalities (Bivariate colors); (B) GDP/water elasticity in the municipalities.
Many of the municipalities in that region (Sirinhaém portion) are quite elastic (Figure 9), especially the municipalities toward the end of the Ipojuca basin, a region that had already been characterized as critical in terms of demand management (Section Diagnosis).
As already seen, elasticity values >1 are associated with efficiency losses. In the case of aggregation by municipalities, these losses occur when the allocation instrument, network and availability reduce water locally, so that the resulting proportional reallocation among the aggregate economic sectors within the municipality favors the least efficient sectors. This is because the efficiency of a municipality is given by the weighted average of the aggregated sectors' efficiencies, with the weight being given by the proportions of water use. Losses can also occur with efficiency reductions within the aggregated sectors in the municipality, especially those that use higher proportions of water. It is possible to visualize, through (Figure 6), the efficiencies of the aggregated economic sectors by municipality in the base year. The municipalities in the Sirinhaém portion, especially those in the final part of the Ipojuca basin, have low efficiencies in agriculture and industry, and high efficiencies in Services.
It is possible to evaluate the change in the efficiency of each municipality, imposed by the relative reduction required of water through Figure 10. The values of elasticities of the WUE [Δ%WUE (% 2011)/Δ%Water used (RW + TW) (% 2011)] in the same figure show the relative gains or losses of efficiency in relation to the water reductions. These positive elasticities, >1, show that water reductions required by the regulatory instrument in the region have led to reductions in efficiency caused by an undue proportional reallocation among the municipality's economic sectors or by efficiency reductions in the most intensive aggregated sectors. In this region, as seen in Figure 6, the sugar and alcohol industry uses the highest proportion of water, and has low efficiency. The results of loss of efficiency, especially those associated with municipalities in the region with industrial plants, show inefficient reallocation. As we have already seen, despite reductions required by the instrument in the sugar and alcohol industry (Figure 8) the proportion of water use by the sugar and alcohol industry for the entire study area increased. The resulting new proportions among the other sectors, within each municipality and variations in efficiency of the largest water user in these municipalities, are not sufficient to avoid the losses of efficiency shown in many municipalities in the region.
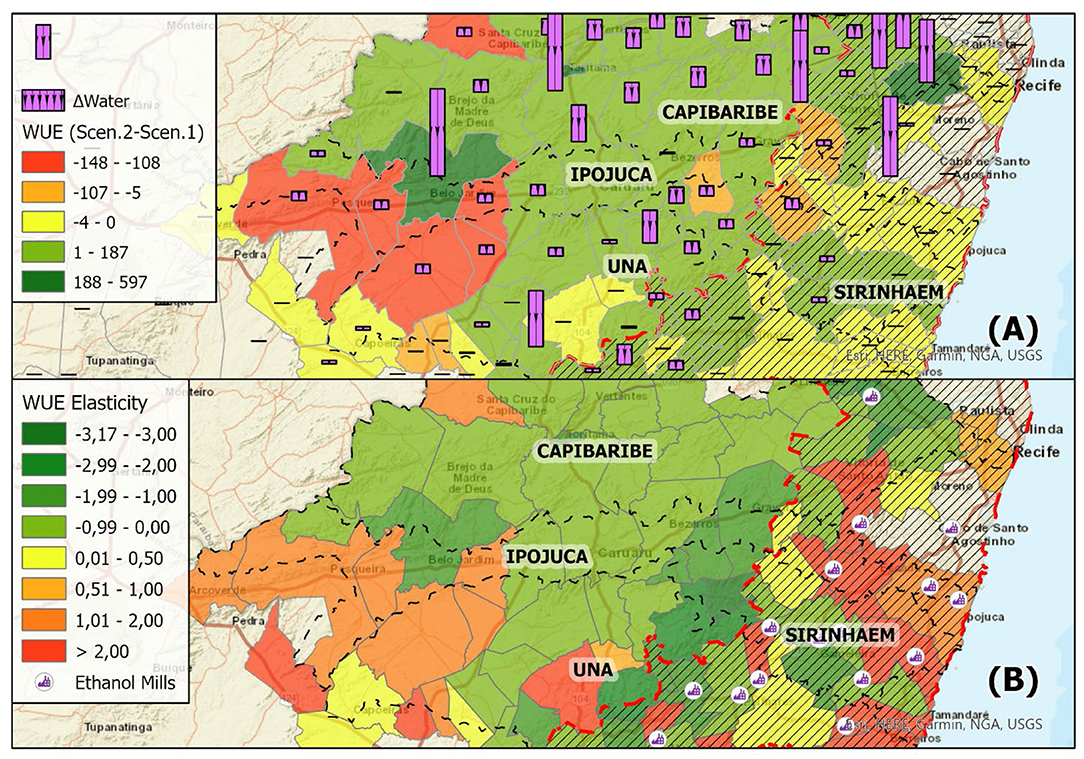
Figure 10. (A) Relative water reduction (bar chart) and WUE change (color scale) of municipalities; (B) WUE Elasticity, Sugar, and Ethanol Mills.
This is a worrying result, given that this region, for the base year, has a major part characterized as critical for management (low efficiency, high stress) (Figure 7). Moreover, most municipalities that consume huge amounts of water are in those economic sectors with already low WUEs.
The Capibaribe portion, presents very distinct characteristics in relation to the previous region discussed. In the drier area of that portion, (excepting the Zona da Mata area), water consumption, in absolute terms (2011), is much lower and mainly used in the Services, which includes livestock and some industrial sectors supplied with treated water, as well as in Industry itself. This latter sector is low water intensive (Manufacture of clothing and accessories, livestock slaughter, construction, manufacture of glass and glass products and other non-metallic mineral products). These represent significant percentage proportions of GDP and significant water use in the municipalities with the highest GDPs in the region and surroundings, including Caruaru, an important regional center. Concentrated around Caruaru with characteristics of water use and efficiency quite different from the sugar and alcohol industry (lower proportions of water use within industrial sector and much higher efficiency values), these types of industries are required, as a trade-off for storage, greater proportional reductions with proportionally higher economic and social losses (Figure 8). In the whole study area, as already seen, unlike the sugar and alcohol industry, the regulatory instrument imposes a water reduction on this manufacturing industry reducing its percentage share of water use and its water use efficiency. These reductions also occur in this Capibaribe portion, where this type of industry is concentrated.
Proportional reductions in water required for Agriculture by the regulatory instrument are also high, in this region, even though the sector's efficiency values in the Capibaribe portion, are higher than the average efficiency of agriculture in the whole study area (Figure 6). Proportional impacts on the GDP of this sector in some municipalities in the Capibaribe dry area are significant (e.g., Brejo da Madre de Deus), but do not strongly affect this region due to the low participation of the agricultural sector in its GDP. The smallest proportional reductions required occur in the Services sector (Figure 8), which result in the smallest relative reductions in GDP among the three sectors (Agriculture, MIMEC, Services). These reductions imposed by the regulatory instrument still lead to significant economic losses to the region, given that the Services sector is responsible for most of the GDP of this drier area, presenting above-average efficiency values in many municipalities. In fact, in an aggregate way, Figure 9 shows that the largest proportion of economic losses in the 4-interlinked basins a occur in this drier area. These losses are associated with the greater relative reductions required in water resources in the 4 basins, which in this dry region cause great damage to the economy, especially in the most industrialized municipalities with the highest GDPs. It is worth noting that the municipalities most penalized by the regulatory instrument are in the Diagnosis (base year), those with the highest efficiency values in the entire study area. In the three economic sectors, the aggregate efficiencies of most of the municipalities in this dry region are greater than the averages obtained for the whole study area (Figure 6 and Table 2).
Among the municipalities, water reductions required by the regulatory instruments have different impacts. The ratio between economic losses proportionate to the reductions imposed on a municipality can be measured through the elasticities calculated for each municipality. These reductions attest to how each municipality is affected and to what extent this is due to the water management instrument. For example, Caruaru suffers a more severe water reduction in the industrial sector than in the services sector, which reduces its proportional economic losses (elasticity <1), given that the municipality has much higher efficiency values in the Services sector (Figure 6). Thus, the water reductions lead to an efficient reallocation among the most important sectors of that municipality, which results in an efficiency gain. This also occurs in Brejo da Madre de Deus, where the proportional water reductions in existing agriculture are much greater than in services sector. Given that the efficiency values of Services are much higher than agriculture in this municipality, the proportional reallocation results in elasticities >1, leading to significant efficiency gains.
In the case of Santa Cruz do Capibaribe, the highest proportional reductions occur in industry and the lowest value in services sector, leading to greater economic losses in proportion to the total water reductions for the municipality (elasticities >1). An important part of a textile hub in the region with a low water intensive use and an efficient industrial sector, with WUEs well-above those in the Services sector, the municipality has additional efficiency losses due to industry reductions in water favoring services sector, which means that the reallocation imposed by the regulatory instrument is not efficient.
Overall, for the 4 interconnected basins, as already analyzed in the previous section by economic sector, the industrial sector lost efficiency (Table 3) due to the water reductions imposed, including low-water intensive industry; and the Service sector gained efficiency to a small extent. These efficiency values by sector can also be calculated for each municipality, which in addition to the efficient or inefficient water reallocation occurring between sectors within a municipality, can help justify the impact of the water instrument in that same level.
Municipalities such as Belo Jardim, which were subject to significant water reductions in its industrial sector compared to the Services sector, managed to have proportionally less economic losses (elasticities of socioeconomic impacts <1). Base year industrial efficiency values of that municipality were higher than Services. However, Services sector's efficiency values raised significantly by the allocation strategy implemented by the regulatory instrument. This offset the inefficient reallocation, in principle. As a result, this municipality presented the greatest efficiency gains for the entire Capibaribe dry area, in both relative and absolute values.
In terms of jobs, the results can be analyzed in the same way, making the model an appropriate tool for assessing the social impacts of the water management instruments and physical conditions, in view of the need for water reductions.
Using a water resource specific Decision Support System (HEAL) (Souza da Silva and Alcoforado de Moraes, 2021), non-linear optimization models were built based on a node-link network, including more than 700 nodes, representing 4-interlinked basins in Northeastern Brazil. These were developed and linked with an interregional I-O Matrix based on a Brazilian input-output matrix for 2011, (Guilhoto et al., 2010) representing the 76 economic sectors in each of the 75 regions of interest. The integrated modeling was able to measure sectorial and regional socioeconomic impacts linked to water allocation decisions for each user. A 3-year time period (2011–2013) was used to represent an extreme water supply context in the study area. Hydrological criteria were employed as most representative of regulatory water instruments. These could, in an innovative way, be evaluated through socioeconomic as well as water efficiency indicators associated with goals of SDG 6, according to FAO recommendations (FAO, 2018).
The platform, by linking water allocation data by user to detailed economic information, objectively answers critical policy issues, such as the following: (i) what are the regional and sectorial socioeconomic impacts of the water instrument's allocation by user; (ii) in cases of reduced water availability or need to increase resource reserves how the water instruments differentiate allocation to water users: to those sectors/ regions who value water more or less ?; to those that contributes more or less to the pressure on water availability? These are indicators mentioned in United Nations (2012) as required for improving water management and its instruments. Furthermore, the platform supports the design of water management instruments, by furnishing information on how a particular type of instrument is able or not to decrease pressure on water resources and improve water efficiency on a regional scale. This aids the analysis of a decision to use a particular water instrument by measuring the economic and social impacts of its use, including its impact on water use efficiencies of the aggregated economic sectors and municipalities.
The impacts obtained were related to changes in water allocations and not to how efficiently each sector and municipality uses water (more or less efficient). This, under the IOM, does not change for the whole period (Leontief technology). However, when the economic sectors and regions are aggregated, socioeconomic impacts and WUE associated to those, due to those water reallocations, changed. Results, such as the ones presented in this case study, show the effects of water allocation strategies when economic criteria is not considered, in a critical region from the water management point of view. Allocation reduction using a regulatory water instrument simulated by hydrological optimization criteria, fails to differentiate between users, economic sectors nor regions, and whether they are more or less efficient water users. This results in greater economic and social losses, as well as providing inadequate incentives to sectors and agents that use water. In water-scarce regions and with growing transfer needs, such as the 4 interconnected basins, adequate incentives, through management instruments based on economic theory, are essential to promote sustainable development.
This circumstance is even more important, as our study area will receive new water supply from a large inter-basin water transfer project, the Transboundary Project of the São Francisco River (PISF) (Souza da Silva and Alcoforado de Moraes, 2021). Because of this project, additional public irrigation schemes are being planned, indicating that irrigated agriculture areas can increase significantly. This is the sector that presented the lowest WUE in the study area. Moreover, existing legal impediments (Federal Law no. 6,961, 2009) to sugarcane irrigation in the Northeast region, have recently been removed by a recently signed federal decree (November 11th, 2019).
Keeping more water in storage (storage preference), at the expense of some cutbacks in water supply (allocation preference), can help reduce economic impacts during prolonged droughts. Reservoirs can shift water in time (with some tradeoffs like evaporation losses) to improve water security, nevertheless, it is important to guide water management decisions already in early response stages or normal conditions, as time extend of droughts are highly unpredictable. Resilience of water resource systems (Wang and Blackmore, 2009) are given by improving performance and adaptive capacities to disturbances; therefore, the obtained trade-offs are a crucial aspect to consider in planning and operation of the water resource system.
Water managers often have access to information about water use from end-users, but these are not easily linked to analysis of economic and regional impacts. In order to improve water management, indicators need to identify the effects of water instruments on a broader scale, whether the instruments are favoring the economic sectors/ regions that in fact contribute to scarcity or environmental problems or to losses in water efficiency and productivity.
As our integrated modeling measures socioeconomic impacts associated with water allocations, the platform produces indicators in conformity with FAO recommendations, thus making them comparable to other national and international indicators. As the UN highlighted in its report cited above, there are increasing demands from countries for harmonization on water indicators.
Following the recommendations by Ge et al. (2018) our integrated modeling, thus, is aligned with the objective of building “bridges between decision-making and sustainable development.” Making assessments of different water allocation strategies in a regional scale, based on sustainability indicators, is a way of not only improving the integrated river basin management but also promoting the implementation of SDGs.
As a recommendation of this study, we emphasize the need to simulate and evaluate other water management instruments, for example more flexible ones, on the same supply conditions, representing economic water allocation mechanism (Callan, 2013), which is also allowed by Brazilian water law (9433/97), such as charging. According to Griffin (2016), despite the increasing number of countries that apply economic instruments, these instruments continue to be used inappropriately. The presented platform can do this, being necessary, for this, to identify demand curves of each user and through them, establish an economic criterion one of the objective functions of the optimization model, keeping the same constraints and IOM parameters. Environmental constraints also can be included and can be evaluated. Furthermore, the water supply context can be modified to represent different conditions of initial storage, inflows and period lengths. The results such as the ones presented in this paper, as well as others possible to be obtained with this integrated platform can be a basis for the establishment of well-designed water management instruments, avoiding the negative consequences of conflicts arising from a supply-oriented approach to water management.
The original contributions presented in the study are included in the article/Supplementary Material, further inquiries can be directed to the corresponding author/s.
MA and MC: conceptualization, methodology, and funding acquisition. MC, GS, and ND: software. ND, TC, GS, and LC: validation. GS, TC, and ND: formal analysis. MA, TC, GS, and ND: investigation. JG and GS: resources. ND, LC, and RS: data curation. MA: writing—original draft preparation, writing—review and editing, supervision, and project administration. GS: visualization. All authors have read and agreed to the published version of the manuscript.
Financial support for this research has been provided by ANA/CAPES (16/2017) and CT-HIDRO/CNPq project (nr. 35/2013).
The authors declare that the research was conducted in the absence of any commercial or financial relationships that could be considered as a potential conflict of interest.
All claims expressed in this article are solely those of the authors and do not necessarily represent those of their affiliated organizations, or those of the publisher, the editors and the reviewers. Any product that may be evaluated in this article, or claim that may be made by its manufacturer, is not guaranteed or endorsed by the publisher.
The authors would like to thank the ANA/CAPES project team for the contributions. Also we would like to thank Sidney Pratt for the English revision of the manuscript.
The Supplementary Material for this article can be found online at: https://www.frontiersin.org/articles/10.3389/frwa.2021.681723/full#supplementary-material
1. ^Candido, L. A., Coêlho, G. A., Alcoforado de Moraes, M. M., and Florêncio, M. L. (under review). Review of decision support systems and allocation models for integrated water resources management focusing on joint water quality-quantity. J. Water Resourc. Plan. Manage. doi: 10.1061/(ASCE)WR.1943-5452.0001496.
2. ^MIMEC comprise the sectors: Mining and quarrying; Manufacturing; Electricity, gas, steam, and air conditioning supply; Construction.
Ahmadaali, J., Barani, G. A., Qaderi, K., and Hessari, B. (2018). Analysis of the effects of water management strategies and climate change on the environmental and agricultural sustainability of Urmia Lake Basin, Iran. Water 10:160. doi: 10.3390/w10020160
Alcoforado de Moraes, M. M., Carneiro, A. C., Biewald, A., Souza da Silva, G. N., Lotze-Campen, H., and Popp, A. (2018). The impact of global changes on economic values of water for public irrigation schemes at the São Francisco River Basin in Brazil. Reg. Environ. Change 18, 1943–1955. doi: 10.1007/s10113-018-1291-0
ANA (2020). National Information System on Water Ressources. Sistema Nacional de Informações sobre Recursos Hídricos. Available online at: http://www.snirh.gov.br/
Araújo, E. F. (2020). Brazilian Water Resource Impact Under Global Climate and Biofuel Demand Changes. (Doctorate Thesis), UFPE, Recife (Brazil).
Baker, J. S., Cai, Y., Moreda, F. G., Van Houtven, G., Callihan, R. J., Escurra, J., et al. (2016). Pernambuco Food-Energy-Water Nexus: Integrating Hydro-BID Into an Economic Valuation Framework. Washington, DC: RTI.
Bekchanov, M., Sood, A., Pinto, A., and Jeuland, M. (2017). Systematic review of water-economy modeling applications. J. Water Resourc. Plan. Manage. 8:143. doi: 10.1061/(ASCE)WR.1943-5452.0000793
Brouwer, R., and Hofkes, M. (2008). Integrated hydro-economic modelling: approaches, key issues and future research directions. Ecol. Econ. 66, 16–22. doi: 10.1016/j.ecolecon.2008.02.009
Bunsen, J., Berger, M., and Finkbeiner, M. (2021). Planetary boundariesfor water - a review. Ecol. Indicat. 121:107022. doi: 10.1016/j.ecolind.2020.107022
Cai, X. (2008). Implementation of holistic water resources–economic optimization models for river basin management – reflective experiences. Environ. Model. Softw. 23, 2–18. doi: 10.1016/j.envsoft.2007.03.005
Cai, X., McKinney, D. C., and Lasdon, L. S. (2001). Solving nonlinear water management models using a combined genetic algorithm and linear programming approach. Adv. Water Resourc. 24, 667–676. doi: 10.1016/S0309-1708(00)00069-5
Callan, S. J. (2013). Environmental Economics and Management: Theory, Policy, and Applications. Boston, MA: Cengage Learning.
Chakroun, H., Chabaane, Z. L., and Benabdallah, S. (2015). Concept and prototype of a spatial decision support system for integrated water management applied to ichkeul Basin, Tunisia. Water Environ. J. 29, 169–179. doi: 10.1111/wej.12095
FAO (2018). Progress on Water-Use Efficiency - Global Baseline for SDG 6 Indicator 6.4.1. Rome: FAO.
FAO (2019). GEMI - Integrated Monitoring Initiative for SDG 6 - Step-by-Step Monitoring Methodology for Indicator 6.4.2. Rome: Food and Agriculture Organization.
Garbe, J., and Beevers, L. (2017). Modelling the impacts of a water trading scheme on freshwater habitats. Ecol. Eng. 105, 284–295. doi: 10.1016/j.ecoleng.2017.04.057
Ge, Y., Li, X., Cai, X., Deng, X., Wu, F., Li, Z., et al. (2018). Converting UN sustainable development goals (SDGs) to decision-making objectives and implementation options at the river basin scale. Sustainability 10, 1–17. doi: 10.3390/su10041056
Ghosh, S., Ibarrarán, M. E., Willett, K. D., and Sanchez Torres Esqueda, G. (2017). Water allocation and management along the Santa Cruz border region. Water Resourc. Econ. 19, 1–17. doi: 10.1016/j.wre.2017.09.004
Giri, S., Arbab, N. N., and Lathrop, R. G. (2018). Water security assessment of current and future scenarios through an integrated modeling framework in the Neshanic River Watershed. J. Hydrol. 563, 1025–1041. doi: 10.1016/j.jhydrol.2018.05.046
Griffin, R. C. (2016). Water Resource Economics: The Analysis of Scarcity, Policies and Projects. Cambridge: MIT Press.
Guilhoto, J. J., Azzoni, C. R., Ichihara, S. M., Kadota, D. K., and Haddad, E. A. (2010). Matriz de Insumo-Produto do Nordeste e Estados: Metodologia e Resultados (Input-Output Matrix of the Brazilian Northeast Region: Methodology and Results)”. Fortaleza: Ssrn. doi: 10.2139/ssrn.1853629
Guilhoto, J. J., Gonçalves Jr, C. A., Visentim, J. C., Imori, D., and Ussami, K. A. (2017). Construção da Matriz Inter-Regional de Insumo-Produto Para o Brasil : Uma Aplicação do TUPI. São Paulo: NEREUS.
Gunawardena, A., White, B., Hailu, A., Wijeratne, E. M., and Pandit, R. (2018). Policy choice and riverine water quality in developing countries: An integrated hydro-economic modelling approach. J. Environ. Manage. 227, 44–54. doi: 10.1016/j.jenvman.2018.08.065
GWP. (2004). Catalyzing Change: A Handbook for Developing Integrated Water Resources Management (IWRM) and Water Efficiency Strategies Produced by the Global Water Partnership (GWP) Technical Committee With Support From Norway's Ministry of Foreign Affairs. Stockholm: GWP Secretariat.
Harou, J. J., Pulido-Velazquez, M., Rosenberg, D. E., Medellín-Azuara, J., Lund, J. R., and Howitt, R. E. (2009). Hydro-economic models: concepts, design, applications, and future prospects. J. Hydrol. 375, 627–643. doi: 10.1016/j.jhydrol.2009.06.037
IBGE (2007). CONCLA. Available online at: https://cnae.ibge.gov.br/
IBGE (2011). Contas Nacionais. Available online at: https://www.ibge.gov.br/estatisticas/economicas/contas-nacionais.html
IBGE Censo (2006). SIDRA. Available online at: https://sidra.ibge.gov.br/pesquisa/censo-agropecuario/censo-agropecuario-2006/segunda-apuracao
Kahil, M. T., Dinar, A., and Albiac, J. (2015). Modeling water scarcity and droughts for policy adaptation to climate change in arid and semiarid regions. J. Hydrol. 522, 95–109. doi: 10.1016/j.jhydrol.2014.12.042
Lenzen, M., and Foran, B. (2001). An input-output analysis of Australian water usage. Water Policy 3, 321-340. doi: 10.1016/S1366-7017(01)00072-1
Leontief, W. (1986). Input-Output Economics. New York, NY: Oxford University Press. doi: 10.1057/978-1-349-95121-5_1072-1
Li, H., Li, K., Liang, Y., and Yang, Z. (2021). Uncovering the structure of virtual multi-regional grey water network in China. Resourc. Conserv. Recycl. 172:105668. doi: 10.1016/j.resconrec.2021.105668
Llop, M. (2013). Water reallocation in the input-outpu model. Ecol. Econ. 86, 21–27. doi: 10.1016/j.ecolecon.2012.10.020
Llop, M., and Ponce Alifonso, X. (2015). Identifying the role of final consumption in structural path analysis: an application to water uses. Ecol. Econ. 109, 203–210. doi: 10.1016/j.ecolecon.2014.11.011
Maneta, M. P., Torres, M. O., Wallender, W. W., Vosti, S., Howitt, R., Rodrigues, L., et al. (2009). A spatially distributed hydro-economic model to assess the effects of drought on land use, farm profits, and agricultural employment. Water Resourc. Res. 45:W11412. doi: 10.1029/2008WR007534
Manzardo, A., Loss, A., Fialkiewicz, W., Rauch, W., and Scipioni, A. (2016). Methodological proposal to assess the water footprint accounting of direct water use at an urban level: a case study of the Municipality of Vicenza. Ecol. Indicat. 69, 165–175. doi: 10.1016/j.ecolind.2016.04.016
MAPA. (2016). Brasil Projeções do Agronegócio 2015/2016 a 2025/2026. Brasilia: Ministério da Agricultura, Pecuária e Abastecimento.
Maria, M. B. M., Expósito, A., and Berbel, J. (2020). A simplified hydro-economic model of guadalquivir river basin for analysis of water-pricing scenarios. Water 12:04017037. doi: 10.3390/w12071879
Mayer, A., and Muñoz-Hernandez, A. (2009). Integrated water resources optimization models: an assessment of a multidisciplinary tool for sustainable water resources management strategies. Geogr. Compass 3, 1176–1195. doi: 10.1111/j.1749-8198.2009.00239.x
Miller, R. E., and Blair, P. D. (2009). Input-Output Analysis: Foundations and Extensions. Cambridge: Cambridge University Press. doi: 10.1017/CBO9780511626982
Montoya, M. A., and Finamore, E. B. (2020). Os recursos hidrícos no agronegócio brasileiro: Uma análise insumo-produto do uso, consumo, eficiência e intensidade. Rev. Brasil. Econ. 74, 441-464. doi: 10.5935/0034-7140.20200021
Munoz Castillo, R., Feng, K., Hubacek, K., Sun, L., Guilhoto, J., and Miralles-Wilhelm, F. (2017). Uncovering the green, blue and grey water footprint and virtual water of biofuel production in Brazil: a nexus perspective. Sustainability 9:2049. doi: 10.3390/su9112049
Munoz Castillo, R., Feng, K., Sun, L., Guilhoto, J. J., Pfister, S., Miralles-Wilhelm, F., et al. (2019). The land-water nexus of biofuel production in Brazil: analysis of synergies and trade-offs using a multiregional input-output model. J. Clean. Product. 214, 52–61. doi: 10.1016/j.jclepro.2018.12.264
PERH-PE (1998). Water Resource Plan of Pernambuco State (Plano Estadual de Recursos Hídricos do Estado de Pernambuco). Recife: Secretaria de Recursos Hídricos.
Qi, H., Zeng, S., Shi, L., and Dong, X. (2021). What the reclaimed water use can change: From a perspective of inter-provincial virtual water network. J. Environ. Manage. 287:112350. doi: 10.1016/j.jenvman.2021.112350
Rosegrant, M. W., and Binswanger, H. (1994). Markets in tradable water rights: potential for efficiency gains in developing country irrigation. World Dev. 22, 1613–1625. doi: 10.1016/0305-750X(94)00075-1
Salla, M. R., Paredes-Arquiola, J., Solera, A., Álvarez, J. A., Pereira, C. E., Alamy Filho, J. E., et al. (2014). Integrated modeling of water quantity and quality in the Araguari River basin, Brazil. Latin Am. J. Aquat. Res. 42, 224–244. doi: 10.3856/vol42-issue1-fulltext-19
Souza da Silva, G. N., and Alcoforado de Moraes, M. M. (2021). Decision support for the (inter-)basin management of water resources using integrated hydro-economic modeling. Hydrology 8:42. doi: 10.3390/hydrology8010042
Sun, Y., Mao, X., Gao, T., Liu, H., and Zhao, Y. (2020). Potential water withdrawal reduction to mitigate riverine ecosystem degradation under hydropower development: a computable general equilibrium model analysis. River Res. Applic. 1–8. doi: 10.1002/rra.3705
The World Bank Group (2016). High and Dry: Climate Change, Water, and the Economy. Executive Summary. Washington, DC. Available online at: http://documents.worldbank.org/curated/en/862571468196731247/High-and-dry-climate-change-water-and-the-economy (accessed June 4, 2019).
Wang, C., and Blackmore, J. (2009). Resilience concepts for water resource systems. J. Water Resourc. Plan. Manage. 135:528. doi: 10.1061/(ASCE)0733-9496(2009)135:6(528)
Yu, Y., Hubacek, K., Feng, K., and Guan, D. (2010). Assessing regional and global water footprints for the UK. Ecol. Econ. 69, 1140–1147. doi: 10.1016/j.ecolecon.2009.12.008
Keywords: integrated economic modeling, water allocation, water use efficiency, economic impacts, network-based model, input-output-model, spatial decision support systems
Citation: Alcoforado de Moraes MMG, Souza da Silva GN, Cunha MP da, Dias NBM, Cardoso TF, Guilhoto JJM, Candido LA and Santos RRS (2021) Integration of a Network-Based and an Economy-Wide Water Model to Support Decision Making on Water Resources Planning and Management in Northeastern Brazil. Front. Water 3:681723. doi: 10.3389/frwa.2021.681723
Received: 17 March 2021; Accepted: 31 August 2021;
Published: 05 October 2021.
Edited by:
Manuel Pulido-Velazquez, Universitat Politècnica de València, SpainReviewed by:
Jorge Bielsa, University of Zaragoza, SpainCopyright © 2021 Alcoforado de Moraes, Souza da Silva, Cunha, Dias, Cardoso, Guilhoto, Candido and Santos. This is an open-access article distributed under the terms of the Creative Commons Attribution License (CC BY). The use, distribution or reproduction in other forums is permitted, provided the original author(s) and the copyright owner(s) are credited and that the original publication in this journal is cited, in accordance with accepted academic practice. No use, distribution or reproduction is permitted which does not comply with these terms.
*Correspondence: Márcia M. G. Alcoforado de Moraes, bWFyY2lhLmFsY29mb3JhZG9AdWZwZS5icg==
Disclaimer: All claims expressed in this article are solely those of the authors and do not necessarily represent those of their affiliated organizations, or those of the publisher, the editors and the reviewers. Any product that may be evaluated in this article or claim that may be made by its manufacturer is not guaranteed or endorsed by the publisher.
Research integrity at Frontiers
Learn more about the work of our research integrity team to safeguard the quality of each article we publish.