 Travis Nielson
 John Bradford1†
 W. Steven Holbrook
- 1Department of Geoscience, Boise State University, Boise, ID, United States
- 2Virginia Tech, Blacksburg, VA, United States
- 3University of Wyoming, Laramie, WY, United States
- 4Department of Agriculture–Agricultural Research Service, Boise, ID, United States
In the northern hemisphere within snow-dominated mountainous watersheds north-facing slopes are commonly more deeply weathered than south-facing slopes. This has been attributed to a more persistent snowpack on the north facing aspects. A persistent snowpack releases its water into the subsurface in a single large pulse, which propagates the water deeper into the subsurface than the series of small pulses characteristic of the intermittent snowpack on south-facing slopes. Johnston Draw is an east-draining catchment in the Reynolds Creek Critical Zone Observatory, Idaho that spans a 300 m elevation gradient. The north-facing slope hosts a persistent snowpack that increases in volume up drainage, while the south-facing slope has intermittent snowpack throughout the drainage. We hypothesize that the largest difference in weathering depth between the two aspects will occur where the difference in snow accumulation between the aspects is also greatest. To test this hypothesis, we conducted four seismic refraction tomography surveys within Johnston Draw from inlet to outlet and perpendicular to drainage direction. From these measurements, we calculate the weathering zone thickness from the P-wave velocity profiles. We conclude that the maximum difference in weathering between aspects occurs ¾ of the way up the drainage from the outlet, where the difference in snow accumulation is highest. Above and below this point, the subsurface is more equally weathered and the snow accumulations are more similar. We also observed that the thickness of the weathering zone increased with decreasing elevation and interpret this to be related to the observed increase soil moisture at lower elevations. Our observations support the hypothesis that deeper snow accumulation leads to deeper weathering when all other variables are held equal. One caveat is the possibility that the denser vegetation contributes to deeper weathering on north-facing slopes via soil retention or higher rates of biological weathering.
Introduction
The critical zone (CZ) extends from bedrock to the top of the tree canopy, it is also where bedrock is weathered into soil (White et al., 2015). This transformation encompasses intricate interactions of physical, chemical, and biological processes that lead to structural and compositional heterogeneity both vertically and laterally. Generally the CZ can be broken into distinguishable vertically arranged layers of soil, saprolite, and fractured bedrock (Anderson et al., 2007; Brantley et al., 2007). The shapes, thicknesses, and landscape-scale distribution of those layers depends on a number of factors and processes (Riebe et al., 2016), including climate (Millot et al., 2002; Riebe et al., 2004a), altitude (Riebe et al., 2004b), hydrology (Dunne, 1998; Lebedeva and Brantley, 2013; Hinckley et al., 2014; Rempe and Dietrich, 2014; Langston et al., 2015), biological processes (Moulton and Berner, 1998; Amundson et al., 2007; Gabet and Mudd, 2010; Roering et al., 2010), and the regional and topographic stress field (St. Clair et al., 2015). Some of these factors vary with aspect and elevation, i.e., climate, hydrology, and biology. Thus, the conditions that control CZ structure vary in sufficiently large catchments. In this study, we investigate the effects of elevation, aspect, and snow accumulation on CZ structure using seismic methods in an east-draining catchment.
Chemical weathering is controlled by the ability to replace chemically stagnant pore-water with reactive water and the reactivity of the minerals being weathered (Maher, 2010; Rempe and Dietrich, 2014). The rate of fluid exchange is a function of the conductivity and density of fractures that act as fluid conduits (Molnar et al., 2007; St. Clair et al., 2015) and the rate of fluid input into the hillslopes. The complexity of chemical weathering within hillslopes has led to the development of several models of critical zone evolution. Rempe and Dietrich (2014) modeled the depth to undrained bedrock by modeling the lateral flow of fluids in a hillslope along with the regolith flux. Lebedeva and Brantley (2013) presented a 2D model that predicted weathering extent using reactive transport equations. More recently Braun et al. (2016), coupled a 2D hydrologic model, chemical weathering model, and a surface process model to predict the regolith geometry and evolution in both anorogenic and orogenic environments. Rempe and Dietrich (2014) and Lebedeva and Brantley (2013) both predict that the weathering zone is thickest under the ridge tops, while Braun et al. (2016) suggest that whether the regolith is thicker beneath topographic highs or topographic lows depends on surface slope, hydraulic conductivity, and precipitation.
Hillslopes of different aspects have different morphologies and microclimates that effect weathering extent. Typically within the northern hemisphere north-facing slopes are steeper and more densely vegetated at low elevations and low latitudes, while at high elevations and high latitudes it is the south-facing slope that is steeper and more vegetated (Poulos et al., 2012). Pelletier et al. (2018) has described two end member cases to describe this asymmetry. First, that at low elevations or latitudes the hillslopes are water-limited. Thus, the south-facing hillslopes are less steep because their lower soil moisture leads to lower soil production rates and smaller vegetation communities to resist erosion and entrap dust. At higher elevations or latitudes, the hillslopes are temperature limited, thus the north-facing hillslopes are less steep due to their cooler soil temperature reducing soil production rates and limiting vegetation communities. These same microclimatic factors that affect slope angle are also some of the factors that control weathering rates.
Vegetation community, soil temperature, soil production rate, and snow accumulation all differ across aspect, leading to different weathering environments on varying aspects within a catchment. Whether these hydrologic differences leads to more extensive weathering on the northerly or southerly aspects is a function of whether a site is limited by the reactivity or availability of meteoric water (Ma et al., 2013), as chemical weathering is controlled by both the rate in which stagnant pore fluids are flushed and the reaction rate of the weathering process (Maher, 2010; Rempe and Dietrich, 2014). In regions where water is input equally into all aspects, the higher solar radiation input to the south-facing slopes increasing soil temperature leading higher rates and degrees of weathering (Rech et al., 2001; Ma et al., 2013). However, in snow dominated catchments the aspects with persistent snowpack are observed to have more extensive weathering than hillslopes with intermittent snowpack (Hunckler and Schaetzl, 1997; Egli et al., 2006; Befus et al., 2011; Anderson et al., 2014). Hunckler and Schaetzl (1997) and Egli et al. (2006) posited that the aspect weathering difference is due to snow acting as an insulating layer, allowing for more continuous infiltration during the winter. Befus et al. (2011) suggested that the higher soil moisture retention and denser vegetation increases the rate of weathering and soil retention on the northerly aspect. Anderson et al. (2013) proposed that the persistent snow on the north-facing slopes dampens the diel temperature fluctuations, which increases the time in which the soils are within the temperature range in which frost cracking damage occurs. The damage by frost cracking in turn promotes downslope transport of soils and generates fluid flow paths, leading to greater weathering on the north-facing slopes. When the frost cracking process was modeled, Anderson et al. (2013) showed that frost cracking led to deeper weathering on the north-facing slopes over the 10 to 100 ka time scales. Observations of soil water infiltration in the snow-dominated Gordon Gulch in the Boulder Creek Critical Zone Observatory (BCCZO) showed that the persistent snowpack on north-facing slopes led to a single sustained infiltration pulse in the spring, while the intermittent snowpack on south-facing slopes lead to periodic infiltration pulses through the winter (Hinckley et al., 2014; Langston et al., 2015). Numerical modeling of unsaturated flow through a granitic CZ model, suggested that a sustained single infiltration pulse characteristic of persistent snowpack leads to more water infiltrating into the deeper CZ than the episodic recharge events, thus increasing the relative rate of chemical weathering (Langston et al., 2011, 2015). Snow insulation (Hunckler and Schaetzl, 1997; Egli et al., 2006), frost cracking (Anderson et al., 2013), and recharge pulse characteristics hypotheses (Hinckley et al., 2014; Langston et al., 2015) provide plausible explanations for deeper weathering on north-facing slopes, but without measurements of how CZ depth varies in conjunction with snow accumulation, precipitation phase, and soil temperature, it is not possible to determine conclusively how snow affects the weathering process. However, there is ample evidence to suggest that snow-related processes drive deeper weather on hillslopes that maintain persistent snowpack.
Elevation has been shown to affect weathering extent and rate in soils. Above the snow line at the Santa Rosa Mountains, Riebe et al. (2004a) attributed the decrease in chemical weathering rates of the soils at higher elevations to the decrease in mean soil temperature, in combination with decreases in vegetative cover, and an increase in snow cover. Dahlgren et al. (1997) and Rasmussen et al. (2010) observed an increase in soil development with elevation that peaked at the rain-snow transition, above and below which the soil development decreased. Rasmussen et al. (2010) postulated that below the rain-snow transition the weathering is limited by water and above it is limited by soil temperature, thus at the rain-snow transition soil development is maximized.
With the myriad of potential controls on weathering within a single catchment, the depth of weathering will change both with aspect and elevation. However, measuring weathering depth at the catchment scale is challenging. Hand auguring and soil pits can provide measurements of weathering extent for the upper two meters and have been applied to the catchment scale (Hunckler and Schaetzl, 1997; Egli et al., 2006). Cored wells provides information on the deeper CZ (Jin et al., 2010; Olona et al., 2010; Buss et al., 2013), but due to the cost it is difficult to apply at sufficient density and scale to provide a broad scale image of the deeper CZ. Geophysical methods, such as seismic refraction tomography (SRT) and electrical resistivity tomography (ERT), trade the fine detail of the direct sampling methods for a spatially broad image of physical parameters such as seismic velocity or electrical resistivity, respectively. SRT is particularly well-suited for providing a constraint on regolith thickness since the weathering process reduces P-wave velocity (Vp), thus for a uniform geology, the velocity typically increases with depth, which is a first order assumption in most refraction methods (Parsekian et al., 2015). Further, granitic weathering studies have shown relatively consistent correlations between seismic velocity and weathering degree across several sites making the interpretation of SRT straightforward (Olona et al., 2010; Yamakawa et al., 2012; Holbrook et al., 2014).
The application of geophysical methods to characterize the CZ for geomorphic analysis (Thomas, 1966) and to apply weathering correction to seismograms (Balachandran, 1975) is long standing. Recently the increasing affordability and accessibility of geophysical methods has spurred researchers to apply geophysics to a number of CZ related phenomena. Studies have used geophysical methods to extrapolate engineering parameters (Olona et al., 2010), to discern soil thickness (Yamakawa et al., 2012), bedrock depth (Vignoli et al., 2012; Holbrook et al., 2014), and to characterize CZ architecture (Befus et al., 2011; Leopold et al., 2013; St. Clair et al., 2015; Flinchum et al., 2018). Most of these studies are limited to a handful of slope-parallel surveys that characterize a single hillslope. However, Befus et al. (2011) and Leopold et al. (2013) conducted multiple geophysical surveys spanning the width of catchments within the BCCZO, creating a catchment-scale image of CZ architecture that indicated fundamental contrasts in CZ architecture on north- vs. south-facing slopes (For the sake of brevity in this paper, the difference in depth to a weathering horizon between the north and south aspects will be referred to as north-south (N-S) weathering depth asymmetry). These contrasts were interpreted as the consequence of aspect-dependent frost cracking (Anderson et al., 2013).
In this study, SRT is used to investigate the CZ architecture of Johnston Draw, a sub-catchment of the Reynolds Creek Critical Zone Observatory (RCCZO) in southwestern Idaho. Johnston Draw is east-west trending, almost completely granitic, has had no recorded Pleistocene glaciation or peri-glaciation, and its north-facing slope host to a persistent winter snow drift that increases in both width and depth up drainage. Because of these factors, Johnston Draw offers a unique opportunity to study the effect of aspect, elevation, snow accumulation, and soil temperature on CZ architecture with minimal complicating factors. We aim to investigate how variations in snow accumulation and soil temperature reflect weathering depths. The survey presented here adds to the growing body of geophysical data in mountainous critical zone sites and provides a more comprehensive picture of catchment-wide weathering architecture than has come out of the critical zone literature to date.
Site Description
The Reynold Creek Critical Zone Observatory (RCCZO) is in the Owyhee Mountains of southwestern Idaho, ~80 km southwest of Boise, Idaho. Elevation ranges from 1,100 to 2,200 m, with regions of flat alluvial valleys and steep mountain slopes (Figure 1). Due to the range in topography and elevation, the RCCZO has a strong climatic gradient along different aspects and elevations. This climatic range is expressed in the variety of plant communities spanning desert shrubs in the low elevations to dense conifers at higher elevations (Seyfried et al., 2000). The surficial geology of the RCCZO consists of Cenozoic volcanic rocks underlain by Cretaceous granite of the Idaho Batholith (McIntyre, 1972). There are no regional stress measurements in the Owyhee region, however Payne et al. (2012) showed that the Snake River Plain and Owyhee-Oregon Plateau experience very low rates of deformation.
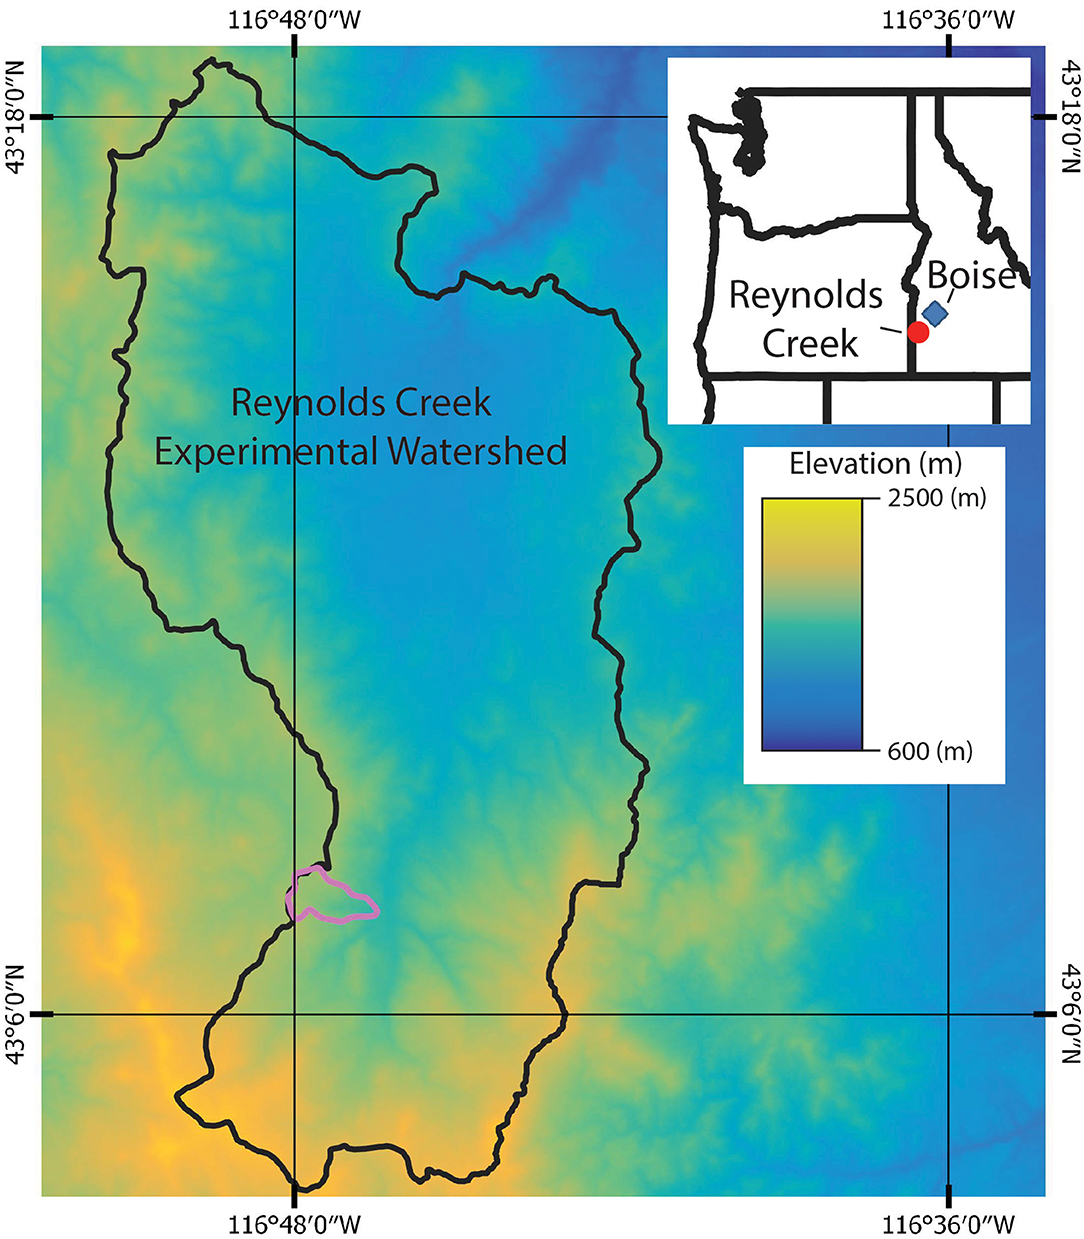
Figure 1. Overview of the Reynolds Creek Critical Zone Observatory and its location in southwestern Idaho. The study site is outlined in purple and a digital elevation model overlays a satellite image of the Reynolds Creek watershed.
Johnston Draw is on the western flank of the RCCZO (Figure 1). The draw trends east-west with an ephemeral stream draining toward the east. The stream bed varies in elevation from 1,490 m at the outlet to 1,800 m at the headwaters; the ridges to the north and the south have a topographic high of 1,840 and 1,860 m, respectively. Johnston Draw is primarily composed of granite but includes rhyolite to the east and west (Ekren et al., 1981). The seismic lines in this study do not intersect the rhyolite (Figure 2). During a typical winter, a snow drift forms on the north-facing slope of Johnston Draw; the drift increases in size higher in the drainage while the south-facing slope hosts only intermittent snow that increases in persistence up drainage. Both the north- and south-facing slopes nearer to the outlet are dominated by junipers, sage, and grasses; higher in the drainage the north-facing slope becomes vegetated by shrubs and aspens, while the southern aspects are dominated by junipers, sages, and grass. Measured and modeled depths of total mobile regolith have found little variation in soil depth with either aspect or elevation within the catchment (Patton, 2016).
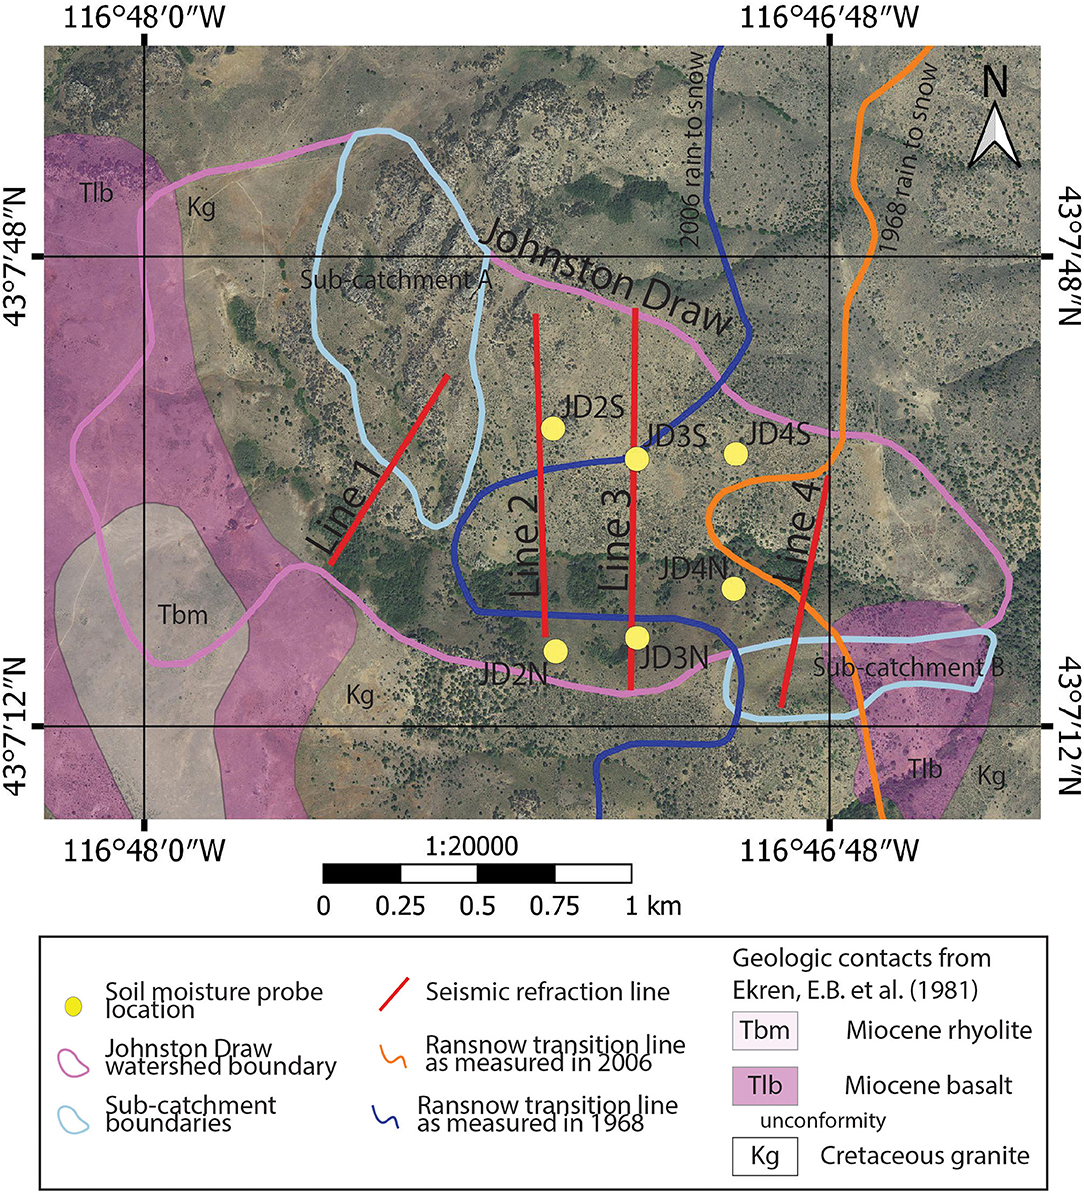
Figure 2. Satellite map of the Johnston Draw watershed seismic survey in the Reynolds Creek Critical Zone Observatory. The yellow circles are the locations of the soil moisture, snow depth and soil temperature paired instrument (Figures 3, 4, 11) sites, and the red lines are the locations of the seismic surveys (Figures 7, 8). Also shown are: the 1968 and 2006 rain/snow transition as blue and green lines, respectively, and the outlines of the Johnston Draw watershed and sub-catchments A and B. The pink areas are the surficial exposures of volcanic rock and the transparent areas granitic rock. Note that the numbering of the paired instrument sites is reversed of the numbering used by the RCCZO (Godsey et al., 2018).
Measurements of snow depth and volumetric water content of the upper 20 cm indicate that the snow accumulation and shallow soil moisture of the two aspects is highly variable (Figures 3, 4). The locations of the instruments are shown in Figure 2 and are paired sites, each pair located at equal elevation on opposite aspects. In this paper, so that the numbering of the paired instrument sites is aligned with the numbering of the seismic lines, the instrument sites numbering is the reverse of the instrument numbering typically used by the RCCZO (Godsey et al., 2018).
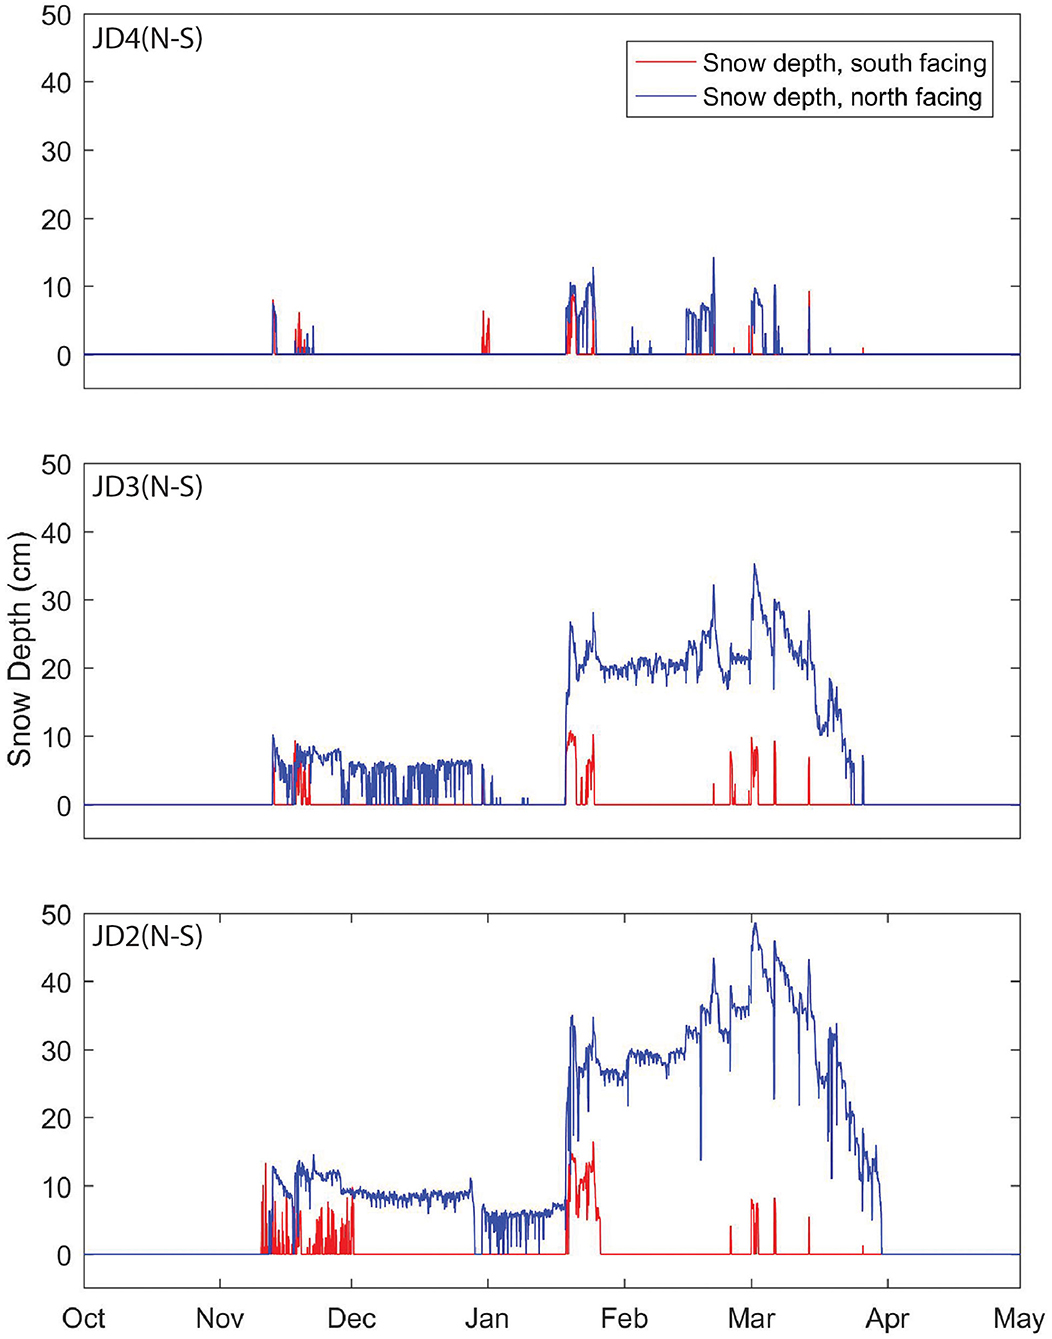
Figure 3. Snow depth measured with acoustic sensors at the JD2(N–S), JD3(N–S), and JD4(N–S) instrument sites for the 2012 water year. The blue and red lines indicate the instruments on the north and south facing slopes, respectively. The amount of snow and time it covers the ground increases up drainage for both aspects, however the difference in snow accumulation between the aspects increases higher in the drainage.
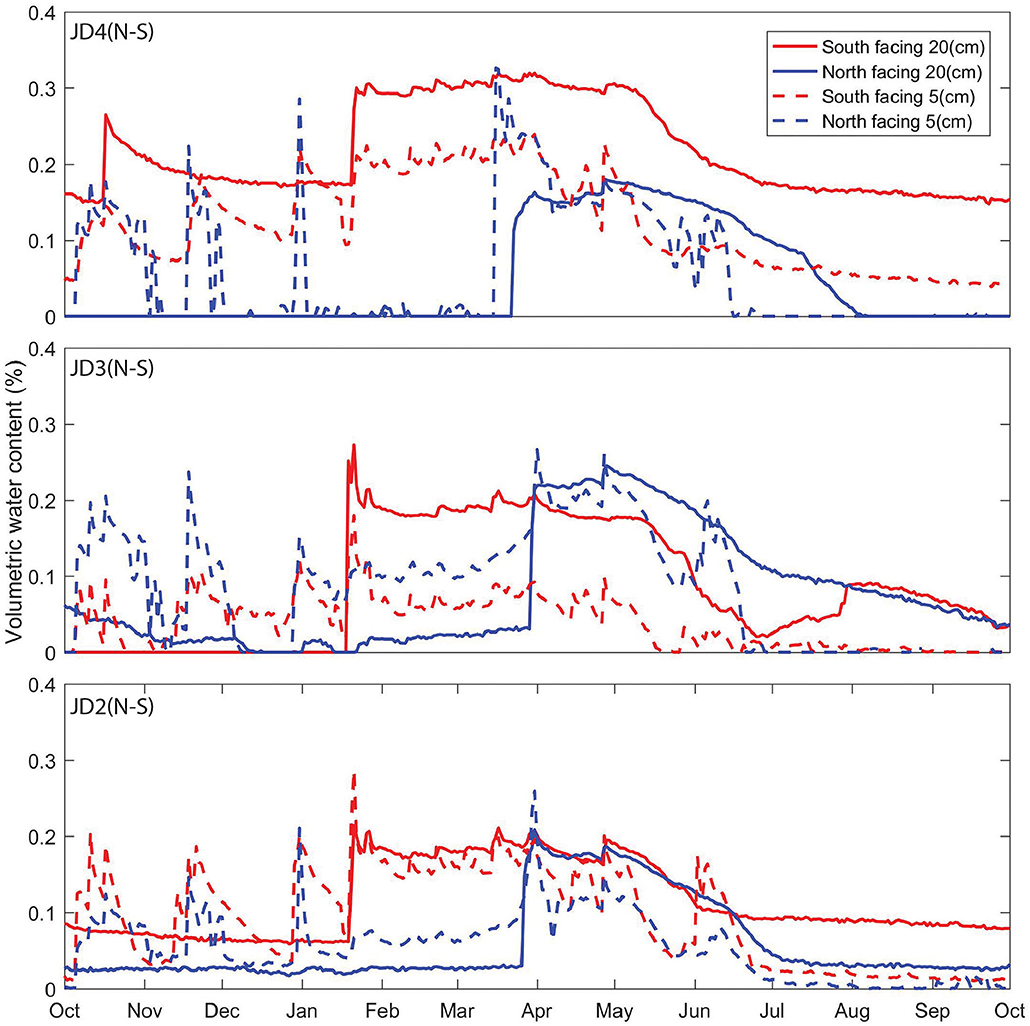
Figure 4. Volumetric water content at 5 and 20 cm depth measured at the JD2(N–S), JD3(N–S), and JD4(N–S) instrument sites for the 2012 water year. The blue and red lines indicate the instruments on the north and south facing slopes, respectively; and the solid and dashed lines indicate 20 and 5 cm depth, respectively. In the winter months the south facing slope are continuously wet, while the north facing slopes remain dry until late March, when moisture infiltrates into the soil column in a single large pulse.
Methods
To investigate CZ architecture within Johnston Draw four seismic lines were gathered in the summers of 2014, 2015, and 2016. The seismic lines start at or near the top of the south ridges of the draw and extend to the north ridge (Figure 2). The lines were set to be perpendicular to the direction of drainage and placed such that they avoided bedrock outcrops and dense vegetation. Care was taken to ensure that they remained as straight as possible so that the seismic profiles were continuous. Line 1, at the top of the draw, was gathered by the Wyoming Center for Environmental Hydrology and Geophysics, University of Wyoming in the summer of 2014 using four 24-channel Geometric Geodes systems with a receiver spacing 2.5 m and shot spacing of 10 m. Because the spread of the array is less than the width of the draw, the array was deployed twice with shots off the end of the line performed for 50 m to re-occupy shot locations from other arrays, this maintained the ray coverage across the seam between consecutive array deployments. Lines 3 and 4 were gathered in the late summer and fall of 2015 and Line 2 in the summer of 2016 by the Center for Geophysical Investigation of the Shallow Surface, Boise State University using five 24-channel Geometric Geode systems with a 5 m receiver spacing and 20 m shot spacing, creating an array of five 120 m segments. In order to span the width of the draw, 24-channel segments of the line were rolled, i.e., shots were performed on the southernmost segment which was then moved to the northern end of the line, shots were then performed on the new southernmost segment which was then moved to the northern end of the line. This process was repeated until the array reached the opposite ridge at which point shots were performed through the array. The seismic source was a 10 lb sledgehammer swung against an aluminum plate and nine strikes were stacked into one shot.
First arrivals were picked as the first motion that could be confidently attributed to either the refracted or direct seismic wave arrival. An example shot gather for Line 3 with the picked first arrivals is shown in Figure 5. We then estimated the subsurface seismic velocities by inverting first-arrival times using the commercial software Rayfract, which employs a wavepath eikonal traveltime (WET) inversion to partially account for band-limited frequency effects (Schuster and Quintus-Bosz, 1993). The initial models for the inversion were derived by taking a Delta t-V for each receiver location and averaging the velocities at common depths, creating a pseudo-2D Delta t-V inversion (Jansen, 2010). WET inversion with the pseudo-2D Delta t-V initial model has proven to be an effective inversion schema at resolving large scale near-surface velocity features (Zelt et al., 2013) and for the estimation of smooth critical zone velocity structures (Nielson and Bradford, 2015). The inversions were carried out for 150 iterations, long enough for the RMS error to reduce to <3% of the maximum travel time of the modeled traces for all the inversion. The observed and modeled travel times for Line 4 are plotted in Figure 6, which shows the observed arrivals as red dots and the modeled arrivals as blue lines. As can be seen, the near and far offset picks do not fit as well as the medium offset picks. This residual arises because at geophones adjacent to the shot location, it becomes difficult to discern the seismic arrivals from the air wave arrival thus reducing the accuracy. At far offsets the seismic wave has dispersed and attenuated, thereby reducing the signal to noise ratio making it difficult to confidently pick the seismic arrival.
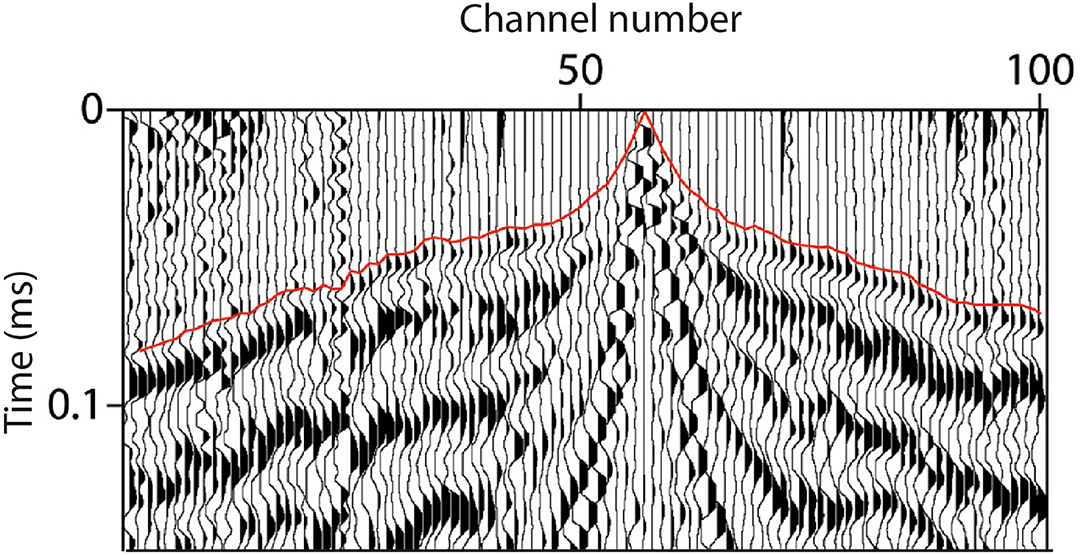
Figure 5. An example shot break from Line 3 with the picked first arrivals shown as a red line. The shot was located midway up the south facing slope, at ~100 m mark in Figure 8C.
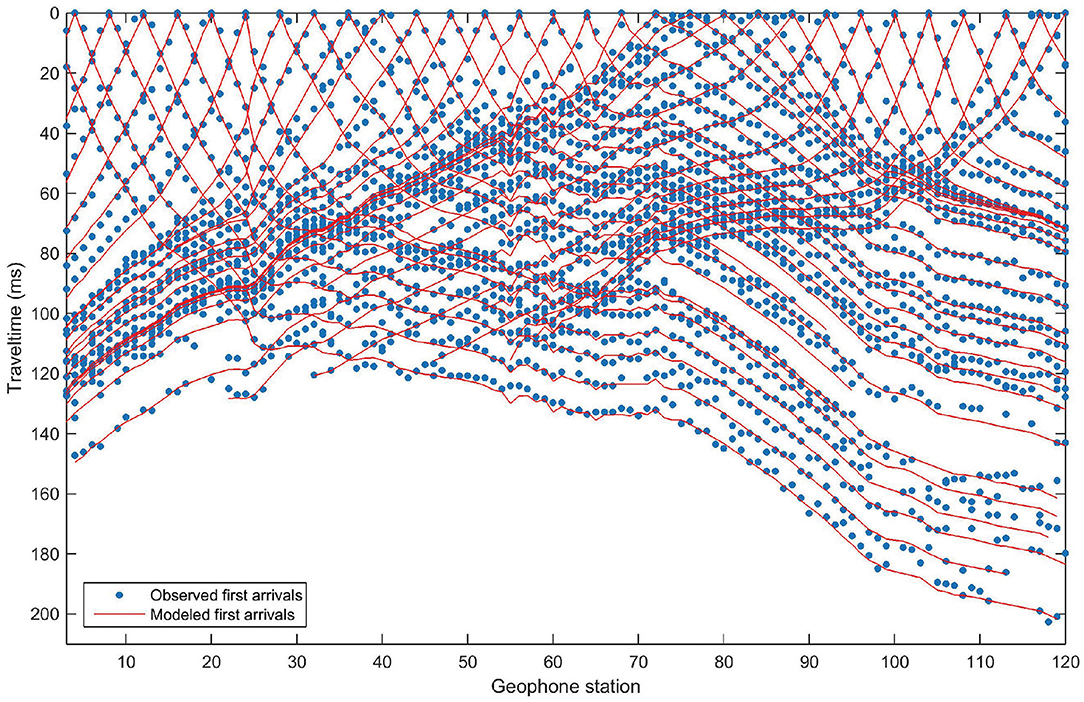
Figure 6. Observed and modeled first arrival travel times for Line 4. Generally the observed and modeled travel times from the final model are in good agreement; however, at the far and near offset receivers the fit is worse as the first arrivals are more difficult to pick.
The resulting velocity profiles were then interpreted using the weathering degree seismic velocity relationship from Olona et al. (2010); see Table 1. The mean depths to seismic contours that correspond to the tops of weathering horizons were calculated for each seismic line and the individual hillslopes. The resulting Vp profiles of the four seismic lines were analyzed to estimate depth to fractured and fresh bedrock. The depth to saprolite (700 m/s) was also calculated, but as discussed later, is biased and incomplete. The depth to fractured (2,000 m/s) and fresh bedrock (3,500 m/s) is taken as the depth to the Vp contour that corresponds to the saprolite-fractured bedrock and fractured-fresh bedrock interfaces, respectively. The velocities for these interfaces were taken from Befus et al. (2011) and Olona et al. (2010) and are shown Table 1, though we note that a recent study in a similar granite terrain found that 1,200 m/s corresponded to fractured bedrock and 4,000 m/s to the top of fresh bedrock (Flinchum et al., 2018). To compare the weathering between the north and south-facing hillslopes the Vp profiles are split by the current drainage location. The mean depth and standard deviation of the mean to the weathering horizon is calculated for each hillslope and each seismic line, the results are shown in Table 2. It should be noted that the standard deviation in the mean depths is not a reflection of the error in depth measurement but the square root of the variance in the depths.
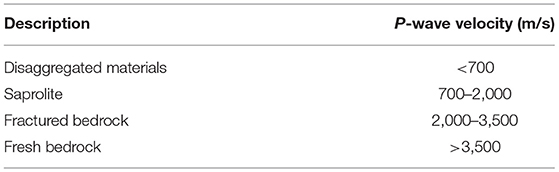
Table 1. P-wave velocities for the weathering stages of granite as measured by Olona et al. (2010).
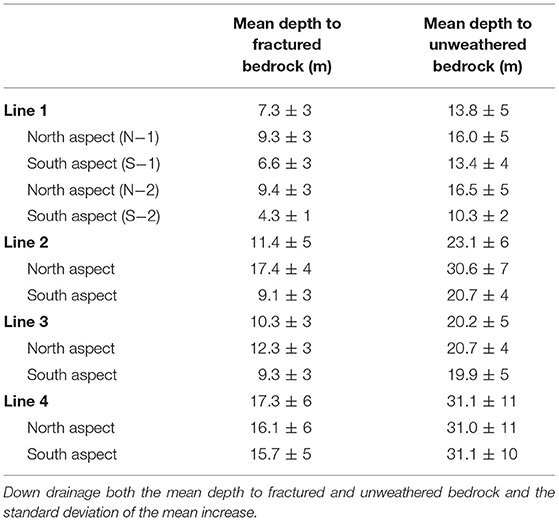
Table 2. Mean depth and standard deviation of the mean to fractured and fresh bedrock measured at each seismic line and hillslope.
Results
The Vp profiles are shown as an orthographically correct fence plot in Figure 7, with the top of fresh bedrock velocity (3,500 m/s) contour shown. The Vp profiles are shown again in Figure 8 with the soil-saprolite (700 m/s), saprolite-fractured bedrock (2,000 m/s), and fractured-fresh bedrock (3,500 m/s) velocity contours shown; note that a 3× vertical exaggeration is applied to Line 1 in Figure 8A so that the velocity contours can be distinguished. As can be seen in Figures 2, 7, 8, the highest elevation seismic profile Line 1 covers two catchments, the primary drainage and sub-catchment A; thus, there are two sets of hillslopes to compare. The different hillslopes are given the names N1, S1, N2, and S2 (see Figure 8A) for labeling. Line 4 intersects a small drainage on the south ridge, sub-catchment B, and as seen in Figure 2 sub-catchment B drains into Dobson Creek and not Johnston Draw. The portion of the seismic profile underlying sub-catchment B is excluded from this analysis, as it accumulates meteoric water that does not contribute to the weathering of the hillslopes within Johnston Draw. Later we discuss that the weathering zone under sub-catchment B is anomalously deep and is likely caused by a pre-existing weakness, so its inclusion in the analysis would introduce a control on weathering other than aspect, elevation, and snow accumulation. Thus, for the north-facing slope of Line 4 the mean depth to a weathering horizon is calculated from −115 m to the drainage (Figure 8).
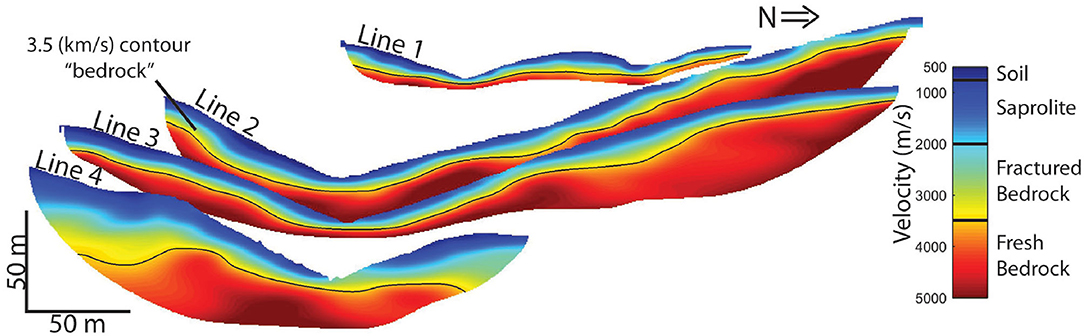
Figure 7. Fence diagram looking up drainage of the inverted velocity profiles within Johnston Draw with no vertical exaggeration. The black lines are the 3.5 km/s velocity contour which we interpret as the top of unweathered bedrock.
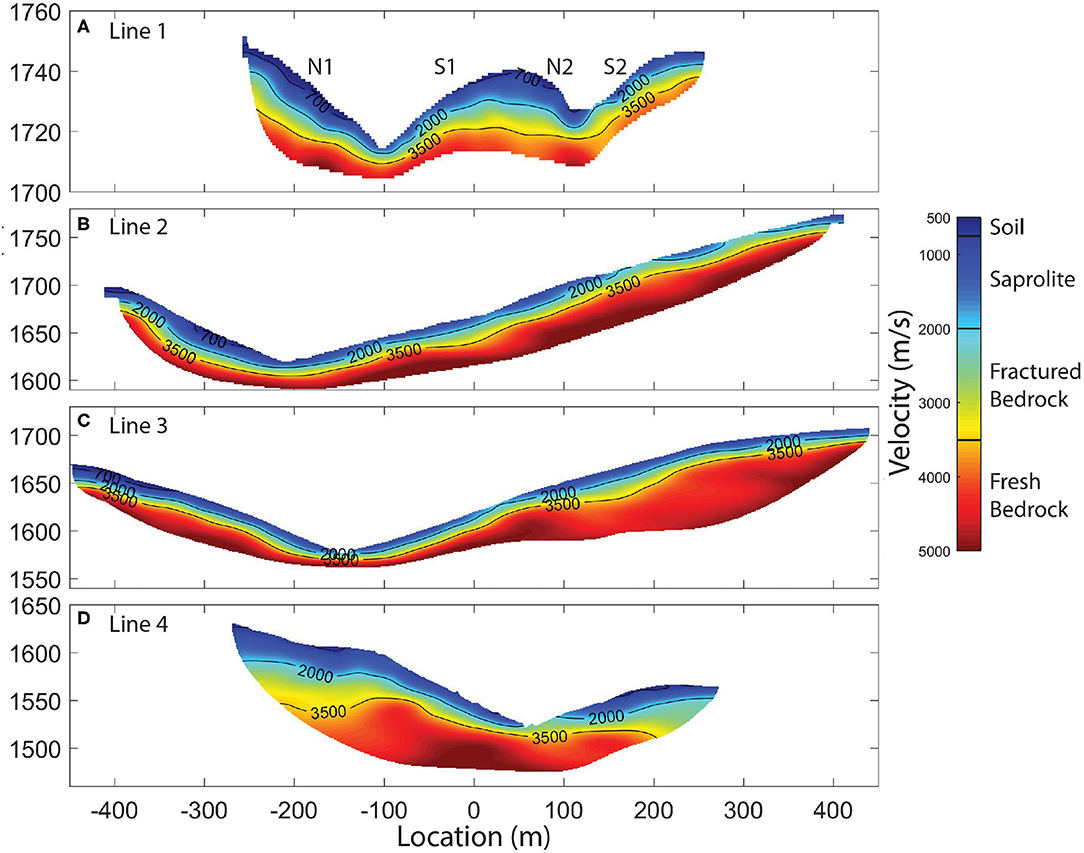
Figure 8. Inverted velocity profiles for the seismic refraction surveys conducted in Johnston Draw with the 700, 2,000, and 3,500 m/s velocity contours shown as black lines. The velocity contours correspond to the top of saprolite, fractured bedrock, and unweathered bedrock, the velocity ranges for these layers is shown in Table 1. Line 1 (A) is vertically exaggerated by 3 times while all the other profiles have no vertical exaggeration. (B) Line 2, (C) Line 3, and (D) Line 4.
The mean depths to various velocity contours and the standard deviations of the mean for each seismic line are depicted in Table 2 and Figure 9. Within Johnston Draw, the depth to fractured and unweathered bedrock increases lower in the drainage. The mean depth to bedrock is 31.1 m on Line 4 and 13.8 m on Line 1, and the mean depth to fractured rock on Line 4 is 17.3 m and on Line 1 is 7.3 m. Unlike with the other horizons, soil depth does not increase down drainage; rather, the largest mean depth to the 700 m/s contour is on Line 3 at 4.4 m, while on Line 1, 2, and 4 the soil is on average 2.3, 3.6, and 2.1 m thick, respectively. However, the top of saprolite contour, 700 m/s, is not continuous across all the profiles. This is because the receiver spacing is too large to receive distinct arrivals from the refracted or diving rays traveling through the relatively thin low velocity media near the surface.
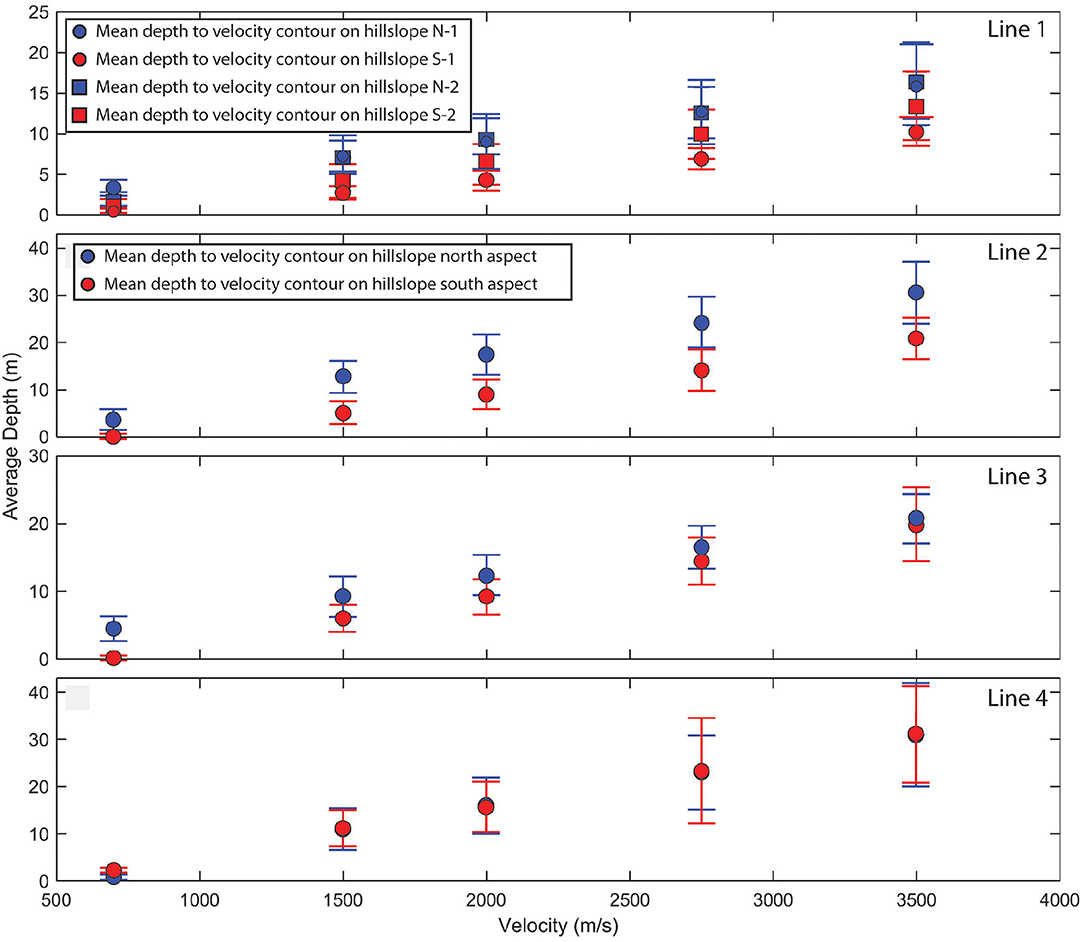
Figure 9. Mean depth and standard deviation of the mean of various velocity contours for the north and south facing aspects, shown in blue and red, for each velocity profile. The 700, 2,000, and 3,500 m/s velocities correspond to the depth to top of saprolite, fractured bedrock, and fresh bedrock, respectively. In every line except Line 4 the mean depth of all velocity contours is greater on the north-facing slope and the depths to fractured bedrock.
On every seismic profile except Line 4, the north-facing slope is more deeply weathered than the south-facing slope; on Line 4 the N–S weathering depth asymmetry is insignificant. The maximum N-S weathering depth asymmetry is observed on Line 2, where the unweathered and fractured bedrock are about 10 and 8 m deeper, respectively, on the north-facing slopes than the south-facing. At the highest elevation, Line 1, the N–S weathering depth asymmetry for unweathered and fractured bedrock is N−1 and S−1 is 6 and 5 m, respectively. Down-drainage at Line 3 the N–S weathering depth asymmetry for unweathered and fractured bedrock decreases to 1 m and 3 m and essentially vanishes for both horizons at Line 4. This asymmetry in weathering depth is paralleled in the snow accumulation, e.g., where the snow accumulation is most asymmetric is where the depth to bedrock is most asymmetric. We unfortunately do not have snow accumulation measurements at Line 1; however, because the hillslopes face northeast and southwest, the snow accumulation between the hillslopes is likely greater, even than at Line 2. Interestingly, the mean depth to bedrock decreases with increasing elevation, which would suggest that a microclimatic factor that varies with elevation controls the across aspect mean depth to bedrock not snow accumulation. As can be seen in Figure 10, the mean soil temperature does not very significantly in between lines 2 and 4, however we do see an increase in mean volumetric water content at lower elevations. Hence, we propose that, within Johnston Draw, the variation of soil moisture with elevation is the primary control of weathering depth and that differences in snow accumulation across aspects is a secondary control.
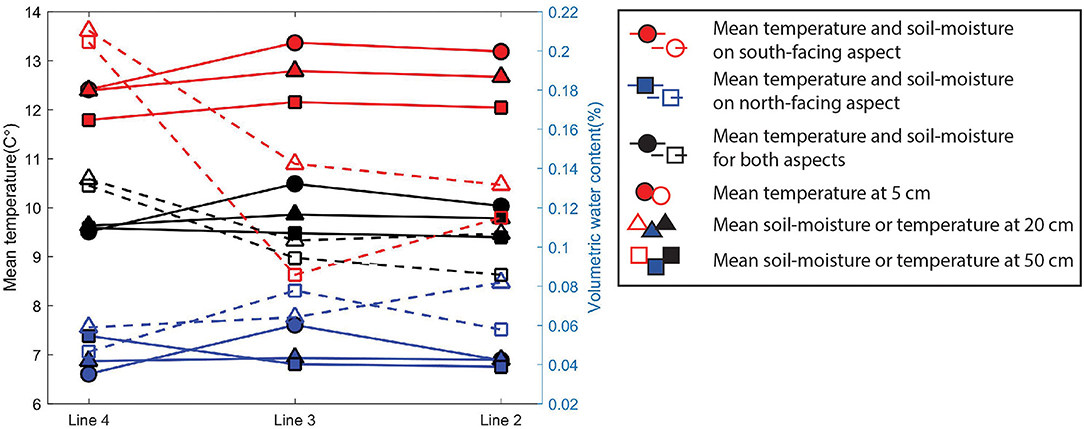
Figure 10. The mean volumetric water content and temperature for the 2012 water year at 5, 20, and 50 cm for both aspects and as an average of the aspects. The dotted lines and hollow shapes indicate volumetric water content, while the solid lines and shapes are temperature. Blue lines and shapes indicate the north-facing aspect, red the south-facing, and black the mean of the measurements of both aspects. The mean volumetric water content and temperature for both aspects, black lines and shapes, was calculated by averaging the measured volumetric water content and soil temperature at each paired instrument site. For the sake of clarity the volumetric water content at 5 cm is not shown.
Acoustic snow depth sensors adjacent to the soil moisture sensors show that for the 2012 water year the first measurable snow accumulation was on November 12th at all sites (Figure 3). The snowpack is most persistent at the JD2N site, where snow covers the ground from November 12th to March 30th, with a small gap in snow coverage from the afternoon December 29th to the evening of December 30th. While at the JD3N the snow is not persistent until a large snowstorm on January 18th, after which the snow persists until March 24th. The snow is not persistent at any of the measurement locations on the south-facing slope or at either the JD4N or JD4S locations.
While the two slopes may have similar shallow soil moistures, they may have different rates of infiltration to the deeper CZ. From the beginning of the water year to around July the soil moisture measured at 5 cm depth can be seen increasing and decreasing in response to precipitation events at all sites regardless of aspect. On the other hand, the soil moisture measured at 20 cm depth stays relatively constant through the beginning of the water year. On January 18th, a snowstorm deposited several cm of snow throughout the catchment (Figure 3) and several days later on January 20th the soil moisture at 20 cm on at the instrument sites on the south-facing slope spikes, but not at the instrument sites on the north-facing slope (Figure 4). The soil moisture at the north-facing instrument sites stays at constant low volumetric water content until late March at which the soil moisture at 20 cm spikes. This late March spike in soil moisture coincides with the final spring snowmelt and several rain on snow events. This spike in soil moisture is similar to what was observed by Langston et al. (2015) in the BCCZO, northerly aspects within Johnston Draw experience recharge in a single continuous pulse at the end of March, while the south-facing slope experienced a primary recharge event in mid-January followed by several smaller events (Figure 4).
The soil temperature was also recorded at all the sites (Figure 11). The temperature measurements show that the soils at all of the north-facing measurement locations have temperatures within the frost cracking window of −8 and −3°C (Anderson et al., 2013) throughout the winter for water year 2012. Table 3 shows the time each soil temperature probe measured temperatures within the frost cracking window. The measurement site in which the soils are within the frost cracking window the longest is JD4N, at which the soils at 5 cm, 20 cm, 50 cm depths are within the frost cracking window for 300, 180, and 185 h, respectively. The soils are within the frost cracking window for a similar amount of time at JD3N, but are significantly lower at JD2N with the probes at 5 cm, 20 cm, and 50 cm depth measuring frost cracking temperatures for 110, 40, and 25 h. The only probe on south-facing slope to measure frost fracking temperatures was JD3S at 5 cm depth and only for 14 h for the whole winter. Even if we arbitrarily increase the frost cracking window to −8 and 0°C, the maximum time spent within the frost cracking window occurs at the lowest elevation north-facing slope.
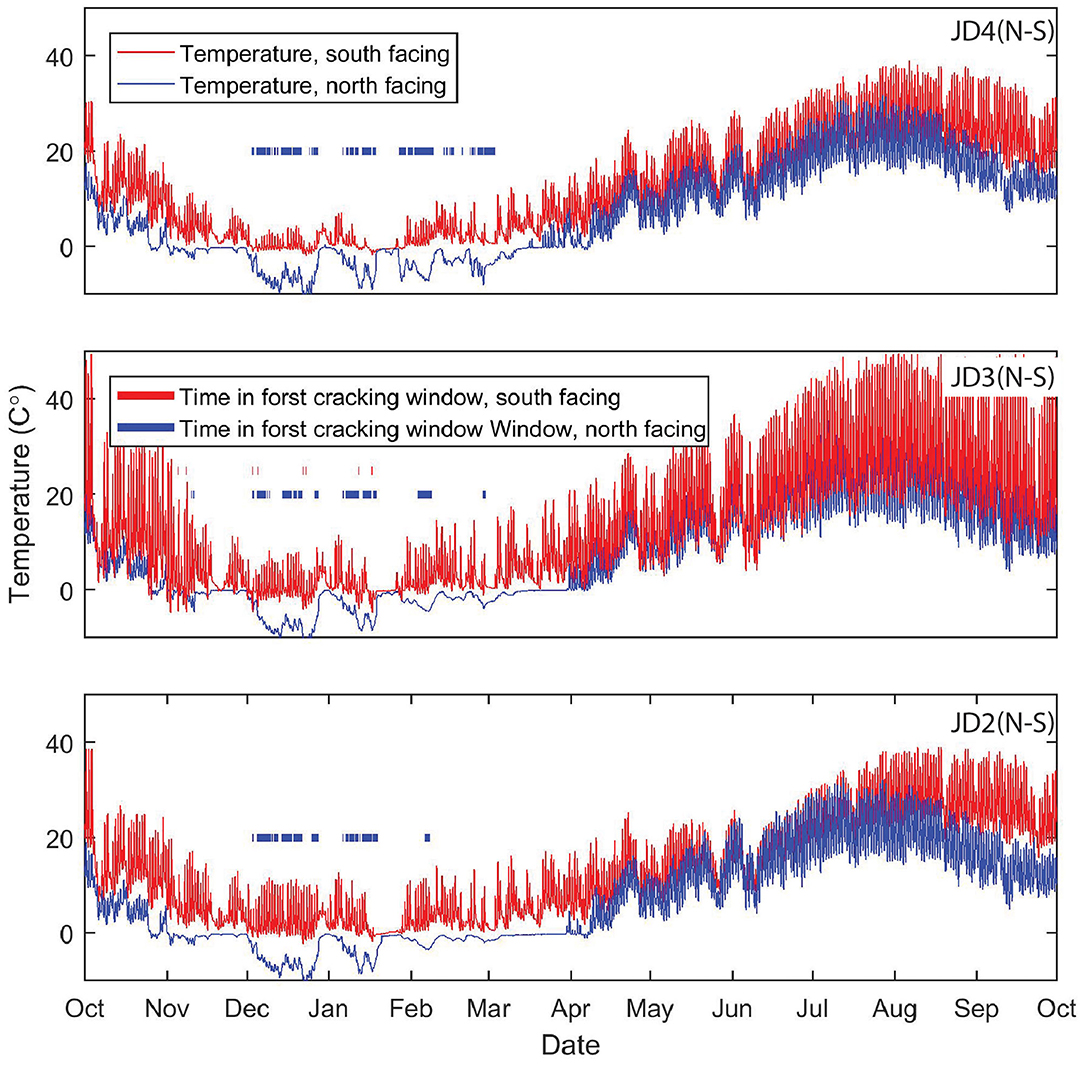
Figure 11. Soil temperature measured at 5 cm depth with TDR probes at the JD2(N–S), JD3(N–S), and JD4(N–S) instrument sites for the 2012 water year. The blue and red lines indicate the instruments on the north and south facing slopes, the thick red and blue lines indicate times then the sensors were between −3 and −8°C.
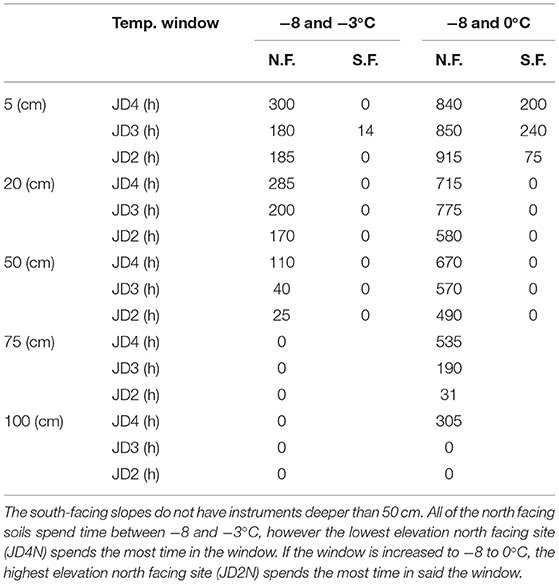
Table 3. The time in hours that the soils at 5, 20, 50, 75, and 100 cm depth spend in various temperature windows, measured at the north-facing (N.F.) and south-facing (S.F.) paired instrument sites during the 2012 water year.
Discussion
CZ Architecture
The bedrock topography generally parallels the surface topography similar to what was observed by St. Clair et al. (2015) in regions with low compressive stress. However, Lines 1 and 4 have deeper bedrock under underneath the ridge top, similar to what is predicted by both Rempe and Dietrich (2014) and Lebedeva and Brantley (2013). The bedrock topography observed within the BCCZO by both Befus et al. (2011) and Leopold et al. (2013) is very similar to what was observed within Johnston Draw, with deeper weathering on the north-facing slopes and the bedrock surface roughly parallels the ground surface. This suggests the weathering processes are similar between the two watersheds.
There are several notable velocity anomalies in the Vp profiles: the low velocity anomaly in Line 3 at location 150 m, and to a lesser extent Line 2 at location 0 m; and the low velocity anomaly under sub-catchment B in Line 4, location −150 m. As can be seen in Figure 7 the low-velocity anomalies in Lines 2 and 3 are relatively close to each other, suggesting that it is a continuous feature such as a set of fractures. Fractures would increase the weathering proximal to the fractures, creating a low-velocity anomaly like to one seen in Lines 2 and 3 (Novitsky et al., 2018).
The weathering zone under sub-catchment B is unusually thick with the top of unweathered bedrock being ~65 m deep. This is much thicker than the weathering zone in the other profiles (Figures 7, 8D). A possible interpretation is that it is due to pre-existing fractures or weakness in the bedrock that has created an area of deeper weathering that increased erosion causing a depression. Further as discussed earlier, sub-catchment B drains into Dobson Creek, thus precipitation falling in the sub-catchment does not contribute to the weathering of Johnston Draw.
For the majority of the catchment, Lines 2–4, the N-S weathering depth asymmetry increases higher in the drainage. However, from Line 2 to Line 1 the N-S weather depth asymmetry decreases (Figure 12). Between Lines 2 and 1 the direction of drainage shifts from east to southeast. Thus, the hillslopes spanned by Line 1 face northeast and southwest rather than north and south as the rest of Johnston Draw does. Additionally (as can be seen in Figure 7) the slope gradient is less at Line 1 than it is at the other lines. Befus et al. (2011) observed a similar decrease in N-S weathering depth asymmetry at the headwater of Gordon Gulch and similarly attributed it to the lower relief hillslopes higher in the catchment. This shift in aspect and slope gradient reduces the radiative difference between the hillslopes, which likely leads to more equal distribution of snow between the aspects and more equal weathering. Unfortunately, at Line 1 there are no paired instrument stations to measure snow depth, soil moisture, and soil temperature as there are at the other lines.
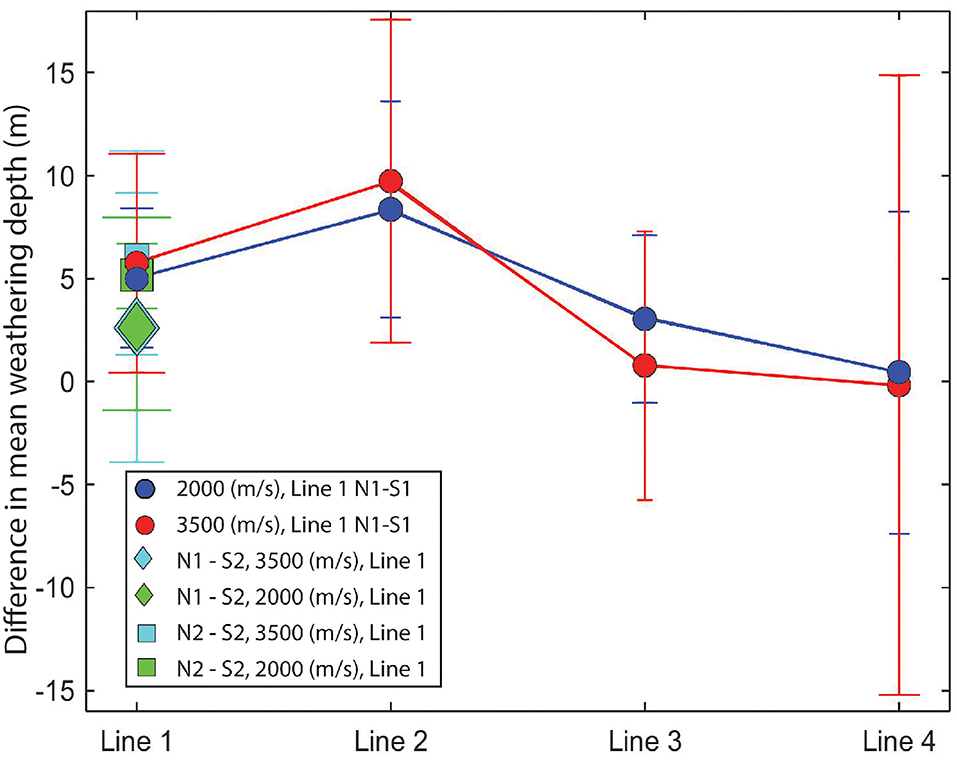
Figure 12. The N–S weathering depth asymmetry, i.e., the difference in mean depth to fractured (2,000 m/s) and fresh (3,500 m/s) bedrock between the north and south facing slopes. Because Line 1 spans two catchments there are two sets of hillslopes to analyze: they are shown as circles for the difference between hillslopes N1 and S1, diamonds for hillslopes N1 and S2, and squares for hillslopes N2 and S2. The highest N-S weathering depth asymmetry occurs at Line 2; above and below this the asymmetry decreases.
The water table can influence the seismic velocities in the near surface. Because the Vp of water is roughly 1,500 m/s, a high saturation in a low-velocity, high-porosity medium can increase the bulk seismic velocity. However, within the CZ porosity decreases and dry seismic velocity increase rapidly with depth, decreasing the effect of water content on bulk Vp (e.g., Holbrook et al., 2014). Within the fractured and fresh bedrock, the porosity is low, so the effect of pore-water is small.
Weathering and Elevation
Within Johnston Draw the depth to unweathered bedrock increases lower in the drainage. Similar trends have been observed across elevation gradients with higher soil weathering rates (Riebe et al., 2004b) and more soil development (Dahlgren et al., 1997; Rasmussen et al., 2010) at lower elevations. Unlike in the Santa Rosa Mountains (Riebe et al., 2004a), within Johnston Draw we do not see a strong correlation between elevation and soil temperature, but we do see a decrease in mean soil moisture at higher elevations (Figure 10). In Johnston Draw the 1968 rain/snow transition occurred at about the same elevation as Line 4 (Figure 2), which is where the greatest average depth to unweathered bedrock and fractured bedrock occurs (Table 2). This suggests that elevation and dominant precipitation phase are a control on the depth to unweathered bedrock within Johnston Draw, similar to what was observed for soil weathering and development by Dahlgren et al. (1997), Riebe et al. (2004a), and Rasmussen et al. (2010). However, the percent of precipitation falling as snow at the elevations of the instrumented sites within Johnston Draw have been decreasing within the RCCZO since at least 1962 (Nayak et al., 2010). This can be seen within Johnston Draw as the 2006 rain/snow transition is about a 100 m higher than the 1968 transition. We do not know where the rain/snow was before 1960's, but we cannot assume that the 1968 rain/snow transition is representative of the past. Further, no work has been done linking soil weathering degree to bedrock weathering depth. It is conceivable that more chemically depleted soils would react less with incoming meteoric water, increasing the reactivity of the water propagated into the deep CZ and the rate of weathering in the deep CZ. However, some caution should be applied when comparing the deep weathering depths measured in Johnston Draw to the soil weathering and development measured at other sites, as both the magnitude of the depth of measurements and methods applied are very different.
While we do see correlation between near-surface soil moisture and weathering depth, Table 2 and Figure 10, some caution needs to be applied before inferring a causal link. Unlike with aspect driven variations in weathering depth, where the more persistent snow on the north-facing aspect has been modeled to promote deeper weathering (Langston et al., 2015), we currently do not have a mechanism that relates near-surface volumetric water content to deeper weathering. Thus, while we do have a nice correlation between near-surface soil moisture and weathering depth, we are currently unable to discern if there is a causal link.
North–South Asymmetry
Within Johnston Draw the north-facing slopes are generally steeper than the south-facing slopes (Figure 7). The north-facing slopes are densely vegetated with mountain sagebrush, snowberry, and several aspen communities, while the south-facing slope feature Wyoming sagebrush and bitterbrush at the lower elevations and sagebrush and mahogany at the higher elevations. Differences in slope angle can be attributed to denser vegetation communities on the north-facing slope, increasing soil retention relative to the less densely vegetated south-facing slopes (Poulos et al., 2012; Pelletier et al., 2018).
Our observations do not exclude the possibility that the factors that control snow accumulation patterns, i.e., vegetation and radiation, are the factors that cause deeper weathering on the north-facing aspects and that the snow accumulation is coincidental. It is well-documented that plants increase the rate of chemical weathering in soils (Moulton and Berner, 1998) and that deep taproots can fracture bedrock, creating hydraulic pathways as well as detach bedrock blocks when bedrock rooted trees are overturned (Gabet and Mudd, 2010; Roering et al., 2010). Aspens have been seen to root as deeply as 3 m (Jones and Debyle, 1985), and within Johnston Draw they are clustered higher in the catchment on the north-facing slope, so they could contribute to the up-drainage increase in N-S weathering depth asymmetry. At the adjacent Reynolds Mountain East site within the RCCZO it has been shown that tree groves both influence the location of a snowdrift (Marks et al., 2002) and rely on the water derived from snowdrifts (Robinson et al., 2008). Hence it could be that the snowdrift allows for the aspen community to exist and the deep rooting allows for more moisture to propagate into the deeper CZ. The persistent snow drift within Johnston Draw is centered roughly with Line 1 and could also be influencing the weathering on the north-facing slope of the upper drainage.
Radiation has been shown to affect soil weathering rates by increasing soil temperature, thus in non-water limited environments leading to deeper weathering on the south-facing slopes (Rech et al., 2001; Ma et al., 2013; Pelletier et al., 2018). Within Johnston Draw we observe both deeper weathering and cooler soil temperatures (Table 2, Figure 11) on the north facing slopes, suggesting that radiation and its effect on soil temperature are not the cause of the N-S weathering asymmetry. However, Johnston Draw is primarily above the historic rain-snow transition and radiation is a direct control on snow distribution, which as discussed later likely does cause the N–S weathering asymmetry.
The soil moisture data for the 2012 water year showed that the north-facing slope recharged in a single pulse at the end of March, while the south-facing slope experienced a primary recharge event in mid-January followed by several smaller events (Figure 4). Numerical modeling of moisture infiltration into the deep CZ has shown that the single sustained pulse characteristic of the north-facing slope of Johnston Draw leads to more recharge in the deeper CZ than the episodic pulses characteristic of the southern aspect (Langston et al., 2011, 2015). This phenomenon has been proposed as a mechanism to explain N-S weathering depth asymmetry within Gordon Gulch in the BCCZO (Langston et al., 2015), and could also explain the asymmetry observed within Johnston Draw. The difference in snow accumulation between the two aspects higher in the catchment would lead to a difference in the amount of water infiltrating into the deep CZ. This difference in infiltration would decrease down drainage as the snow accumulation becomes more equal between the aspects. As the ability to flush and replace chemically stagnant water from bedrock pores is a control on deep chemical weathering (Maher, 2010; Rempe and Dietrich, 2014), then the chemical weathering rates will parallel the infiltration rates. This would result in deeper weathering where the snowpack is deeper and more persistent. Therefore, as the difference in snow accumulation between the aspects decreases down drainage the difference in the rate of weathering between the two aspects would also decrease, leading to the observed N-S weathering depth pattern within Johnston Draw.
It is apparent that all the north-facing slopes spend time within the frost cracking window (Table 3, Figure 11). However, if we assume the more time spent within the frost cracking window the greater the weathering depth, then our temperature observations suggest that the lower portions of the draw would have the greatest N–S weathering depth asymmetry. Instead, we observe insignificant N-S weathering depth asymmetry where our temperature observations and frost cracking would predict the high asymmetry (Figure 12). Further we do not observe the soils deeper than 50 cm spending time within the frost cracking window. The exact range in which frost cracking is most efficient is dependent on the hydraulic and fracture mechanical characteristics of the rock (Walder and Hallet, 1986). This suggests that the ideal frost cracking window for the granite within Johnston Draw could be different than −8 and −3°C. Even if, for the sake of argument, if we expand the frost cracking window to −8 and 0°C, we do not see the time spent within the frost cracking window mirror the N-S weathering asymmetry for most depths. Additionally expanding the frost cracking window to 0°C is dubious, as the van der Waal and electrostatic forces that cause frost cracking are weakened at that temperature (Hales and Roering, 2007). Further even if the frost cracking window is expanded the time spent in the expanded window (Table 3) still indicates that at Line 4, the north-facing slope should be more deeply weathered than the south-facing slope. Thus, the aspect paired soil temperature measurements suggest that the frost cracking is not the primary driver of the weathering pattern that is observed with Johnston Draw.
The soil moisture patterns at the paired instrument sites (Figure 4) within Johnston Draw suggest that the north-facing slopes receive deeper infiltration than the south-facing slopes. The temperature sensors indicate the soils are within the frost cracking window (Table 3, Figure 11). But the time spent within the window (Table 3) is not reflective of the weathering pattern within Johnston Draw (Figure 12). While it does appear the snow accumulation is the primary driver of the N–S weathering depth asymmetry observed, we propose that frost cracking could still play a role in the weathering pattern observed within Johnston Draw. Since frost cracking creates preferential flow paths on the northerly aspects, these preferential flow paths would exacerbate the difference in infiltration caused by the more persistent snowpack on the north-facing. Before snow accumulation both aspects are in low flux state soil moisture. During the winter a persistent snowpack accumulates on the north-facing slope. However, the frozen soils and stable snow limit moisture infiltration. On the south-facing slope the periodic accumulation and melt of snow leads to moderate and shallow moisture flux. In spring the snow on the north-facing slope melts in a single sustained event, leading to a pulse of moisture infiltration on the north-facing slope, while the south-facing slope maintains moderate infiltration.
Conclusion
To explore the critical zone architecture within Johnston Draw, we collected four seismic refraction lines throughout the catchment perpendicular to the direction of drainage. From the resulting Vp profiles the depth to fractured and unweathered bedrock were identified and show a dynamic critical zone structure throughout Johnston Draw. The average depth to the top of unweathered bedrock changes from 14 m deep at the headwater to 31 m at the outlet, the depth to the top of fractured bedrock follows a similar trend. Higher in the draw the north-facing slope is more deeply weathered than the south-facing slope, but this asymmetry decreases down drainage, leading to nearly equal weathering depths on both aspects at the drainage. The largest difference in weathering depth between the two aspects occurs ¾ up the draw, where the greatest difference in snow-accumulation occurs. Above this point the drainage direction shifts from east to southeast, so the snow accumulation on the aspects likely becomes more equal. Soil moisture measurements on the north-facing slopes of Johnston Draw show that the soils are recharged by a single pulse in the late spring, while the south-facing slopes with their intermittent snowpack experience periodic soil recharge events throughout the winter and spring. Numerical modeling studies [see Langston et al. (2011), Langston et al. (2015)] have shown the single pulse recharge characteristic of the north-facing slope is more effective at propagating moisture into the deep critical zone than the periodic recharge events seen on the south-facing slopes.
During the winter soil temperature on north-facing slopes are within the temperature window in which frost cracking occurs. However, the time the hillslopes spend within the frost cracking window suggests that the maximum difference in weathering depth between the aspects should occur at lower elevations, where the observed difference between the aspects is insignificant. This does not mean that frost cracking does not play a role in the weathering of Johnston Draw. Preferential flow paths generated by the frost cracking process would only amplify the difference in infiltration caused by the snow accumulation pattern. It is also likely that differences in vegetation density also contribute to the difference in weathering depth between the aspects. Higher in the catchment the north-facing slope is more densely vegetated and hosts an aspen colony which could contribute to both the chemical and physical weathering on the north-facing slope.
Both elevation and aspect play a role in the weathering pattern observed within Johnston Draw. Elevation effects weathering depth throughout Johnston Draw, while the effects of aspect are greatest high in the catchment. Of course, it is not that elevation and aspect themselves affect weathering depth, but the climatic parameters such as temperature, precipitation, and radiation that vary with them. Within Johnston Draw, snow and its unique water storage characteristics has a strong role in the weathering differences between the north and south aspects; however, the role of temperature cannot be ruled out.
Data Availability Statement
The raw data supporting the conclusions of this article will be made available by the authors, without undue reservation.
Author Contributions
TN led the collection of three of the seismic lines, did the geophysical processing and hydrologic data analysis, and prepared the first draft of the manuscript. JB secured the funding for the project, advised the data acquisition and processing, and was heavily involved in the manuscripts drafting. WH led the acquisition of one of the seismic lines and was involved in the manuscripts drafting. MS provided the hydrologic data, advised the interpretation of the hydrologic data, and was involved in drafting the manuscript. All authors contributed to the article and approved the submitted version.
Funding
This study was conducted in collaboration and cooperation with the USDA Agriculture Research Service, Northwest Watershed Research Center, Boise, Idaho, and landowners within the Reynolds Creek Critical Zone Observatory (RC CZO). Support for this research was provided by the NSF via RC CZO Cooperative agreement NSF EAR-1331872 and NSF grant EPS-1208909.
Conflict of Interest
The authors declare that the research was conducted in the absence of any commercial or financial relationships that could be construed as a potential conflict of interest.
Acknowledgments
We thank the crew of the Wyoming Center for Environmental Hydrology and Geophysics and the volunteers from Boise State University for their efforts in the field.
References
Amundson, R., Richter, D. D., Humphreys, G. S., Jobbágy, E. G., and Gaillardet, J. (2007). Coupling between biota and earth materials in the critical zone. Elements 3, 327–332. doi: 10.2113/gselements.3.5.327
Anderson, R. S., Anderson, S. P., and Tucker, G. E. (2013). Rock damage and regolith transport by frost: an example of climate modulation of the geomorphology of the critical zone. Earth Surf. Process. Landf. 38, 299–316. doi: 10.1002/esp.3330
Anderson, S. P., Hinckley, E.-L., Kelly, P., and Langston, A. (2014). Variation in critical zone processes and architecture across slope aspects. Proc. Earth Planet. Sci. 10, 28–33. doi: 10.1016/j.proeps.2014.08.006
Anderson, S. P., von Blackenburg, F., and White, A. F. (2007). Physical and chemical controls on the critical zone. Elements 3, 315–319. doi: 10.2113/gselements.3.5.315
Balachandran, K. (1975). Determination of weathering thickness by a seismic P-S delay technique. Geophysics 6, 1073–1075. doi: 10.1190/1.1440584
Befus, K. M., Sheehan, A. F., Leopold, M., Anderson, S. P., and Anderson, R. S. (2011). Seismic constraints on critical zone architecture, boulder creek watershed, Front Range, Colorado. Vadose Zone J. 10:915. doi: 10.2136/vzj2010.0108
Brantley, S. L., Goldhaber, M. B., and Ragnarsdottir, K. V. (2007). Crossing disciplines and scales to understand the critical zone. Elements 3, 307–314. doi: 10.2113/gselements.3.5.307
Braun, J., Mercier, J., Guillocheau, F., and Robin, C. (2016). A simple model for regolith formation by chemical weathering: regolith formation. J. Geophys. Res. Earth Surf. 121, 2140–2171. doi: 10.1002/2016JF003914
Buss, H. L., Brantley, S. L., Scatena, F. N., Bazilievskaya, E. A., Blum, A., Schulz, M., et al. (2013). Probing the deep critical zone beneath the luquillo experimental forest, puerto rico: luquillo deep critical zone. Earth Surf. Process. Landf. 38, 1170–1186. doi: 10.1002/esp.3409
Dahlgren, R. A., Boettinger, J. L., Huntington, G. L., and Amundson, R. G. (1997). Soil development along an elevational transect in the western Sierra Nevada, California. Geoderma 78, 207–236. doi: 10.1016/S0016-7061(97)00034-7
Dunne, T. (1998). Critical data requirements for prediction of erosion and sedimentation in mountain drainage basins. J. Am. Water Res. Assoc. 34, 795–808. doi: 10.1111/j.1752-1688.1998.tb01516.x
Egli, M., Mirabella, A., Sartori, G., Zanelli, R., and Bischof, S. (2006). Effect of north and south exposure on weathering rates and clay mineral formation in alpine soils. Catena 67, 155–174. doi: 10.1016/j.catena.2006.02.010
Ekren, E. B., McIntyre, D. H., Bennet, E. H., and Malde, H. E. (1981). “Geologic map of Owyhee County, Idaho, west of longitude 116° W. I,” in Map. USGS (Denver, CO). doi: 10.3133/i1256
Flinchum, B. A., Steven Holbrook, W., Rempe, D., Moon, S., Riebe, C. S., Carr, B. J., et al. (2018). Critical zone structure under a granite ridge inferred from drilling and three-dimensional seismic refraction data. J. Geophys. Res. Earth Surf. 123, 1317–1343. doi: 10.1029/2017JF004280
Gabet, E. J., and Mudd, S. M. (2010). Bedrock erosion by root fracture and tree throw: a coupled biogeomorphic model to explore the humped soil production function and the persistence of hillslope soils. J. Geophys. Res. 115:F04005. doi: 10.1029/2009JF001526
Godsey, S. E., Marks, D., Kormos, P. R., Seyfried, M. S., Enslin, C. L., Winstral, A. H., et al. (2018). Eleven years of mountain weather, snow, soil moisture and streamflow data from the rain–snow transition zone – the johnston draw catchment, reynolds creek experimental watershed and critical zone observatory, USA. Earth Syst. Sci. Data 10, 1207–1216. doi: 10.5194/essd-10-1207-2018
Hales, T. C., and Roering, J. J. (2007). Climatic controls on frost cracking and implications for the evolution of bedrock landscapes. J. Geophys. Res. 112. doi: 10.1029/2006JF000616
Hinckley, E.-L. S., Ebel, B. A., Barnes, R. T., Anderson, R. S., Williams, M. W., and Anderson, S. P. (2014). Aspect control of water movement on hillslopes near the rain-snow transition of the Colorado Front range: snowmelt and hydrological flow paths on opposing hillslope aspects. Hydrol. Process. 28, 74–85. doi: 10.1002/hyp.9549
Holbrook, W. S., Riebe, C. S., Elwaseif, M. L, Hayes, J., Basler-Reeder, K., et al. (2014). Geophysical constraints on deep weathering and water storage potential in the Southern sierra critical zone observatory: geophysical constraints on weathering in the Southern Sierra CZO. Earth Surf. Process. Landf. 39, 366–380. doi: 10.1002/esp.3502
Hunckler, R. V., and Schaetzl, R. J. (1997). Spodosol development as affected by geomorphic aspect, Baraga County, Michigan. Soil Sci. Soc. Am. J. 61, 1105–1115. doi: 10.2136/sssaj1997.03615995006100040017x
Jin, L., Ravella, R., Ketchum, B., Bierman, P. R., Heaney, P., White, T., et al. (2010). Mineral weathering and elemental transport during hillslope evolution at the Susquehanna/Shale hills critical zone observatory. Geochim. Cosmochim. Acta 74, 3669–3691. doi: 10.1016/j.gca.2010.03.036
Langston, A. L., Tucker, G. E., Anderson, R. S., and Anderson, S. P. (2011). Exploring links between vadose zone hydrology and chemical weathering in the boulder creek critical zone observatory. Appl. Geochem. 26, S70–S71. doi: 10.1016/j.apgeochem.2011.03.033
Langston, A. L., Tucker, G. E., Anderson, R. S., and Anderson, S. P. (2015). Evidence for climatic and hillslope-aspect controls on vadose zone hydrology and implications for saprolite weathering: climatic control on vadose zone moisture. Earth Surf. Process. Landf. 40, 1254–1269. doi: 10.1002/esp.3718
Lebedeva, M. I., and Brantley, S. L. (2013). Exploring geochemical controls on weathering and erosion of convex hillslopes: beyond the empirical regolith production function: hillslope evolution and regolith-thickness. Earth Surf. Process. Landf. 38, 1793–1807. doi: 10.1002/esp.3424
Leopold, M., Völkel, J., Huber, J., and Dethier, D. (2013). Subsurface architecture of the boulder creek critical zone observatory from electrical resistivity tomography: critical zone architecture at boulder creek critical zone observatory. Earth Surf. Process. Landf. 38, 1417–1431. doi: 10.1002/esp.3420
Ma, L., Chabaux, F., West, N., Kirby, E., Jin, L., and Brantley, S. (2013). Regolith production and transport in the susquehanna shale hills critical zone observatory, part 1: insights from U-series isotopes: hillslope aspect and regolith production. J. Geophys. Res. Earth Surf. 118, 722–740. doi: 10.1002/jgrf.20037
Maher, K. (2010). The dependence of chemical weathering rates on fluid residence time. Earth Planet. Sci. Lett. 294, 101–110. doi: 10.1016/j.epsl.2010.03.010
Marks, D., Winstral, A., and Seyfried, M. (2002). Simulation of terrain and forest shelter effects on patterns of snow deposition, snowmelt and runoff over a semi-arid mountain catchment. Hydrol. Process. 16, 3605–3626. doi: 10.1002/hyp.1237
McIntyre, D. H. (1972). Cenozoic Geology of the Reynolds Creek Experimental Watershed, Owyhee County, Idaho. Moscow, ID: Idaho Buraeu of Mines and Geology Pamphlet.
Millot, R., Gaillardet, J., Dupr,é, B., and Allègre, C. J. (2002). The global control of silicate weathering rates and the coupling with physical erosion: new insights from rivers of the Canadian Shield. Earth Planet. Sci. Lett. 196, 83–98. doi: 10.1016/S0012-821X(01)00599-4
Molnar, P., Anderson, R. S., and Anderson, S. P. (2007). Tectonics, fracturing of rock, and erosion. J. Geophys. Res. 112. doi: 10.1029/2005JF000433
Moulton, K. L., and Berner, R. A. (1998). Quantification of the effect of plants on weathering: studies in Iceland. Geology 26, 895–898. doi: 10.1130/0091-7613(1998)026<0895:QOTEOP>2.3.CO;2
Nayak, A., Marks, D., Chandler, D. G., and Seyfried, M. (2010). Long-term snow, climate, and streamflow trends at the reynolds creek experimental watershed, owyhee mountains, Idaho, United States: climate trends at RCEW. Water Resour. Res. 46. doi: 10.1029/2008WR007525
Nielson, T., and Bradford, J. (2015). Sensitivity of Seismic Refraction Inversion to Smooth and Blocky Velocity Gradients, ed R. V. Schneider (Tulsa, OK: Society of Exploration Geophysicists), 2313–2317. doi: 10.1190/segam2015-5931741.1
Novitsky, C. G., Holbrook, W. S., Carr, B. J., Pasquet, S., Okaya, D., and Flinchum, B. A. (2018). Mapping inherited fractures in the critical zone using seismic anisotropy from circular surveys. Geophys. Res. Lett. 45, 3126–3135. doi: 10.1002/2017GL075976
Olona, J., Pulgar, J. A., Fernández-Viejo, G., López-Fernández, C., and González-Cortina, J. M. (2010). Weathering variations in a granitic massif and related geotechnical properties through seismic and electrical resistivity methods. Near Surface Geophys. 8, 585–599. doi: 10.3997/1873-0604.2010043
Parsekian, A. D., Singha, K., Minsley, B. J., Holbrook, W. S., and Slater, L. (2015). Multiscale geophysical imaging of the critical zone: geophysical imaging of the critical zone. Rev. Geophys. 53, 1–26. doi: 10.1002/2014RG000465
Patton, N. R. (2016). Topographic Controls on Total Mobile Regolith and Total Soil Organic Carbon in Complex Terrain. Pocatello, ID: Idaho State University.
Payne, S. J., McCaffrey, R., King, R. W., and Kattenhorn, S. A. (2012). A new interpretation of deformation rates in the snake river plain and adjacent basin and range regions based on GPS measurements: deformation rates in the snake river plain. Geophys. J. Int. 189, 101–122. doi: 10.1111/j.1365-246X.2012.05370.x
Pelletier, J. D., Barron-Gafford, G. A., Gutiérrez-Jurado, H., Hinckley, E.-L. S., Istanbulluoglu, E., McGuire, L. A., et al. (2018). Which way do you lean? Using slope aspect variations to understand critical zone processes and feedbacks: which way do you lean? Earth Surf. Process. Landf. 43, 1133–1154. doi: 10.1002/esp.4306
Poulos, M. J., Pierce, J. L., Flores, A. N., and Benner, S. G. (2012). Hillslope asymmetry maps reveal widespread, multi-scale organization: Mapping hillslope asymmetry. Geophys. Res. Lett. 39, L06406. doi: 10.1029/2012GL051283
Rasmussen, C., Dahlgren, R. A., and Southard, R. J. (2010). Basalt weathering and pedogenesis across an environmental gradient in the southern cascade range, California, USA. Geoderma 154, 473–485. doi: 10.1016/j.geoderma.2009.05.019
Rech, J. A., Reeves, R. W., and Hendricks, D. M. (2001). The influence of slope aspect on soil weathering processes in the springerville volcanic field, Arizona. Catena 43, 49–62. doi: 10.1016/S0341-8162(00)00118-1
Rempe, D. M., and Dietrich, W. E. (2014). A bottom-up control on fresh-bedrock topography under landscapes. Proc. Nat. Acad. Sci. U.S.A. 111, 6576–6581. doi: 10.1073/pnas.1404763111
Riebe, C. S., Hahm, W. J., and Brantley, S. L. (2016). Controls on deep critical zone architecture: a historical review and four testable hypotheses: Four testable hypotheses about the deep critical zone. Earth Surf. Process. Landf. 42, 128–156. doi: 10.1002/esp.4052
Riebe, C. S., Kirchner, J. W., and Finkel, R. C. (2004a). Erosional and climatic effects on long-term chemical weathering rates in granitic landscapes spanning diverse climate regimes. Earth Planet. Sci. Lett. 224, 547–562. doi: 10.1016/j.epsl.2004.05.019
Riebe, C. S., Kirchner, J. W., and Finkel, R. C. (2004b). Sharp decrease in long-term chemical weathering rates along an altitudinal transect. Earth Planet. Sci. Lett. 218, 421–434. doi: 10.1016/S0012-821X(03)00673-3
Robinson, D. A., Binley, A., Crook, N., Day-Lewis, F. D., Ferr,é, T. P. A., Grauch, V. J. S., et al. (2008). Advancing process-based watershed hydrological research using near-surface geophysics: a vision for, and review of, electrical and magnetic geophysical methods. Hydrol. Process. 22, 3604–3635. doi: 10.1002/hyp.6963
Roering, J. J., Marshall, J., Booth, A. M., Mort, M., and Jin, Q. (2010). Evidence for biotic controls on topography and soil production. Earth Planet. Sci. Lett. 298, 183–190. doi: 10.1016/j.epsl.2010.07.040
Schuster, G., and Quintus-Bosz, A. (1993). Wavepath eikonal traveltime inversion: theory. Geophysics 58, 1314–1323. doi: 10.1190/1.1443514
Seyfried, M. S., Harris, R. C., Marks, D., and Jacob, B. (2000). A geographic database for watershed research, reynolds creek experimental watershed, Idaho, USA. Tech. Bull. 3:26. doi: 10.1029/2001WR000414
St. Clair, J., Moon, S., Holbrook, W. S., Perron, J. T., Riebe, C. S., Martel, S. J., et al. (2015). Geophysical imaging reveals topographic stress control of bedrock weathering. Science 350, 534–538. doi: 10.1126/science.aab2210
Thomas, M. F. (1966). Some geomorphological implications of deep weathering patterns in crystalline rocks in Nigeria. Trans. Instit. Br. Geograp. 40, 173–193. doi: 10.2307/621576
Vignoli, G., Cassiani, G., Rossi, M., Deiana, R., Boaga, J., and Fabbri, P. (2012). Geophysical characterization of a small pre-Alpine catchment. J. Appl. Geophys. 80, 32–42. doi: 10.1016/j.jappgeo.2012.01.007
Walder, J. S., and Hallet, B. (1986). The physical basis of frost weathering: toward a more fundamental and unified perspective. Arctic Alpine Res. 18:27. doi: 10.2307/1551211
White, T., Brantley, S., Banwart, S., Chorover, J., Dietrich, W., Derry, L., et al. (2015). “Chapter 2 - the role of critical zone observatories in critical zone science,” in Developments in Earth Surface Processes, eds J. R. Giardino and C. Houser (Amsterdam: Elsevier), 15–78. doi: 10.1016/B978-0-444-63369-9.00002-1
Yamakawa, Y., Kosugi, K., Masaoka, N., Sumida, J., Tani, M., and Mizuyama, T. (2012). Combined geophysical methods for detecting soil thickness distribution on a weathered granitic hillslope. Geomorphology 145–146, 56–69. doi: 10.1016/j.geomorph.2011.12.035
Keywords: geophysics, weathering, aspect, seismic refraction, critical zone, moisture infiltration, microclimates and weathering
Citation: Nielson T, Bradford J, Holbrook WS and Seyfried M (2021) The Effect of Aspect and Elevation on Critical Zone Architecture in the Reynolds Creek Critical Zone Observatory: A Seismic Refraction Study. Front. Water 3:670524. doi: 10.3389/frwa.2021.670524
Received: 21 February 2021; Accepted: 16 June 2021;
Published: 19 July 2021.
Edited by:
Ludovic Bodet, Sorbonne Université, FranceReviewed by:
Eve-Lyn S. Hinckley, University of Colorado Boulder, United StatesManuela Mendes, Universidade de Lisboa, Portugal
Copyright © 2021 Nielson, Bradford, Holbrook and Seyfried. This is an open-access article distributed under the terms of the Creative Commons Attribution License (CC BY). The use, distribution or reproduction in other forums is permitted, provided the original author(s) and the copyright owner(s) are credited and that the original publication in this journal is cited, in accordance with accepted academic practice. No use, distribution or reproduction is permitted which does not comply with these terms.
*Correspondence: Travis Nielson, dHJhdmlzbmllbHNvbkB1LmJvaXNlc3RhdGUuZWR1
†Present address: Travis Nielson, Olson Engineering, Wheat Ridge, CO, United States
John Bradford, Department of Geophysics, Colorado School of Mines, Golden, CO, United States