 Eilif Kurnia Deda Djamres
 Daisuke Komori
 So Kazama2
- 1Department of Civil and Earth Resources Engineering, Graduate School of Engineering, Kyoto University, Kyoto, Japan
- 2Department of Civil Engineering and Architecture, Graduate School of Engineering, Tohoku University, Sendai, Japan
The methodology examined for this study was based on statistical analyses and GIS computations of frequent inland water flooding areas in Tangerang city, Indonesia during 2008–2015. Primary data used for this study were inland water flooding records from Tangerang city government and an approximately 90 m Merit DEM. We extracted the topographical characteristics of frequent inland water flooding areas and used principal component analysis to find its main characteristics. Results show that frequent inland water flooding areas in Tangerang emerged because of a slope in the upstream condition, the correlation between concave and flow length conditions, correlation of the slope condition and distance to a river, and relations among flow length in upstream characteristics and distance to a pond. Furthermore, a principal component score of frequent inland water flooding areas and other areas in the city was compared with measure similarity. This method correctly identified 71% of frequent inland water flooding areas. Also, 74% of one-time inland water flooding areas were classified as locations with high topographical similarity. Furthermore, field surveys indicated that the remaining 29% of frequent inland water flooding areas had low topographical similarity because of anthropogenic factors.
Introduction
Urban inundation has strongly and adversely affected many cities worldwide for much of human history, and certainly in recent decades (Hammond et al., 2015; Lowe et al., 2017; Wang et al., 2018). Recorded catastrophic floods in 2007 inundated 144,914 properties in Greater Jakarta (Jakarta, Bogor, Depok, Tangerang, and Bekasi), causing an estimated economic loss of 5.1 trillion rupiahs (USD 346 million) (The Ministry of National Development Planning of the Republic Indonesia, 2017). In Beijing, the flood event of July 2012 killed 79 and led to estimated economic losses of 11.64 billion yuan (US$1.78 billion) (Yin et al., 2016). Some studies have found that increased flood frequencies are related to increasingly urbanized populations, storm and hurricane frequency, and a lack of measures to restrict building in flood-prone zones (Youssef et al., 2011; Bathrellos et al., 2012; Papadopoulou-Vrynioti et al., 2013; Jourde et al., 2014). Furthermore, economic losses in urban areas are worse because urban areas have concentrated population and assets (Jha et al., 2012). In 2016, 54.5% of the world's population lived in urban settlements. The figure is projected to be 60% in 2030 (United Nations, 2016). Therefore, urban inundation is likely to lead to greater losses in the coming decades.
Because topographical and meteorological factors mainly determine rainfall inundation in rural areas, its related mechanisms can be clarified using two-dimensional (2D) inundation models (Hromadka and Lai, 1985; Wasantha Lal, 2008). By contrast, urban inundation is more complex because it incorporates many urban factors such as land use, infrastructure, and drainage systems (Hsu et al., 2000). These urban factors elevate the surface run-off rate, affect the volume, and change the flow direction of the water surface. These flow changes alter surface run-off phenomena in urbanized areas, making them different and more complicated to predict compared with those in rural areas.
To elucidate urban inundation, many scholars have developed a physical model: one uses a topographical index model (Manfreda et al., 2011). Using the employed rainfall-runoff and flood inundation model, Moe et al. (2016) found that 79.6% inundations in Jakarta were attributable to a shortage of river discharge capacity. The remaining 20.4% came from urbanization and land subsidence. However, that study did not incorporate consideration of the artificial structures. It cannot explain more details related to urban factors of the inundations. Using a numerical model compiled by building arrangement, Farid et al. (2012) elucidated general mechanisms of inundations in the city. The reported inundation map and his calculated map were similar. However, some reported inundations were severer than the calculated results. These mismatched inundation results are probably attributable to insufficient modeling of local drainage systems in the model and some unknown urban parameters. The physical model expresses flooding mechanisms through known physical analysis. Therefore, the accuracy is low if the unknown parameters were primarily important ones related to flooding mechanisms. However, statistical analysis approaches can examine such unknown parameters to elucidate more details about the flooding mechanism.
Statistical analytical approaches have been developed to a great degree by exploiting multiple pertinent input factors such as bedrock geology, soil characteristics, land use, drainage network, road networks, building formation, and precipitation. Some earlier studies clarified flood mechanisms. For example, Murayama (1987) and Fukushima (1988) used flood statistics to select areas that have been prone to inland inundation in the past. They described processes by examining its topographical characteristics. However, ascertaining inundation characteristics for a whole city cannot be done by the emphasis on its local characteristics; the characteristics must be explained generally.
It is therefore important to analyze a broader scale such as an entire urban area. Fariza et al. (2019) used fuzzy multicriteria decision making (FMCDM) to assess the level of urban flood risk in Sidoarjo city, Indonesia. By comparison with the inundation-observed map compiled by the local government, their research accuracy reached 66%. Sato and Hayashi (2014) used principal component analysis (PCA) to analyze the main topographical characteristics of inundations of the Musashino plateau in Tokyo and Saitama. However, no report of an earlier study describes the quantitative assessment of the universal characteristics of inundation-prone areas because they have analyzed areas where inundation has occurred at least once.
Nakaguchi et al. (2018) used 20 years of inland water flooding records to define “frequent inland water flooding areas” that have experienced more frequent inundation. They analyzed such areas in Osaka city. Inland water flooding records recorded inundation recorded in the past by government. That study revealed frequent inundations in Osaka, which was distributed to flat areas over a low slope. Moreover, a tendency was apparent by which inundated areas were located near buildings, roads, and railways. Presumably, inundation waters were impeded from flowing properly to the drainage system. Frequent inland water flooding areas involve primary parameters related to inundation mechanisms. Therefore, statistical analyses of frequent inland water flooding areas might reveal heretofore unknown parameters such as urban parameters and their relative influences on inundation mechanisms. Particularly, megacities in economically developing countries undergoing rapid economic growth have insufficient infrastructure and facilities. Application of work by Nakaguchi et al. (2018) to a megacity in an economically developing country is important not only to elucidate topographical characteristics but also non-topographical characteristics and their relative effects on inundation mechanisms. Therefore, the objectives of this study were to elucidate the primary parameters and their weighted effects on urban inundation mechanisms in Tangerang city, a populous metropolitan area in Indonesia undergoing rapid growth and development, by applying methods reported by Nakaguchi et al. (2018).
Study Area, Materials, and Methods
Study Area
Tangerang city, a city in the Banten province, is part of the Jabodetabek (Greater Jakarta metropolitan area). The city is located in the western part of Jakarta, the Indonesian capital. With a population of more than 2 million, Tangerang is mainly a commuter city for Jakarta. The vast majority of the city consists of extensive new housing developments. The city is also considered the main gateway of Indonesia because Soekarno–Hatta International Airport is part of the city.
Topographically, the city is located in western Banten province and western Jakarta province. It is situated at 6°6′S to 6°6′S latitude and 106°36′E to 106°42′E longitudes. The city is ~60 km from Serang city, the capital city of Banten province, and 27 km from Jakarta province. Its area of 184.24 km2 comprises 13 districts and 104 subdistricts. Tangerang city lies 10–18 m above sea level (m.a.s.l.). The northern part of the city has an altitude of about 10 m.a.s.l.; the southern part is 18 m.a.s.l. Tangerang is situated on a low-lying area with a slope of 0–3%. Just a small area in the southern part of the city has a slope of 3–8%. Visually, it can be presented as shown in Figure 1.

Figure 1. Location map of the study area.
Materials and Methods
The researchmethod used for this research is shown in Figure 2. First, we collected inland water flooding records of Tangerang city for 2008–2015. The maps are based on eyewitness reports by government officers during inundation events and on interviews with residents after the event. After the maps were digitalized on GIS data, all topographic parameters were extracted from its meshes. Here, the digital elevation model (MERIT-DEM) by Yamazaki et al. (2017) was used as a high-accuracy global DEM at 3-arcsec resolution (approximately 90 m at the equator).

Figure 2. Research methodology.
To select “frequent inland water flooding areas,” we examined their relative frequencies among all inundations. The areas of inundation varied in size: each inundation included different meshes. Therefore, determining an appropriate mesh size is important for obtaining objective results. Rescaling the mesh size multiple times to reduce differences in the number of meshes among inundations can prevent domination of large inundations in the analyses. Frequently inundated areas should be more frequent than other inundations.
Furthermore, we analyzed a set of topographical elements based on work reported by Sato and Hayashi (2014): elevation, slope, depth of concavity, capacity of concavity, slope upstream, slope downstream, the difference of slopes, flow length upstream, flow length downstream, flow length difference, and distance to a river. Additionally, we added distance to a pond because many inundations in Tangerang city are near artificial ponds. Table 1 presents an explanation of how the topographical dataset was created.
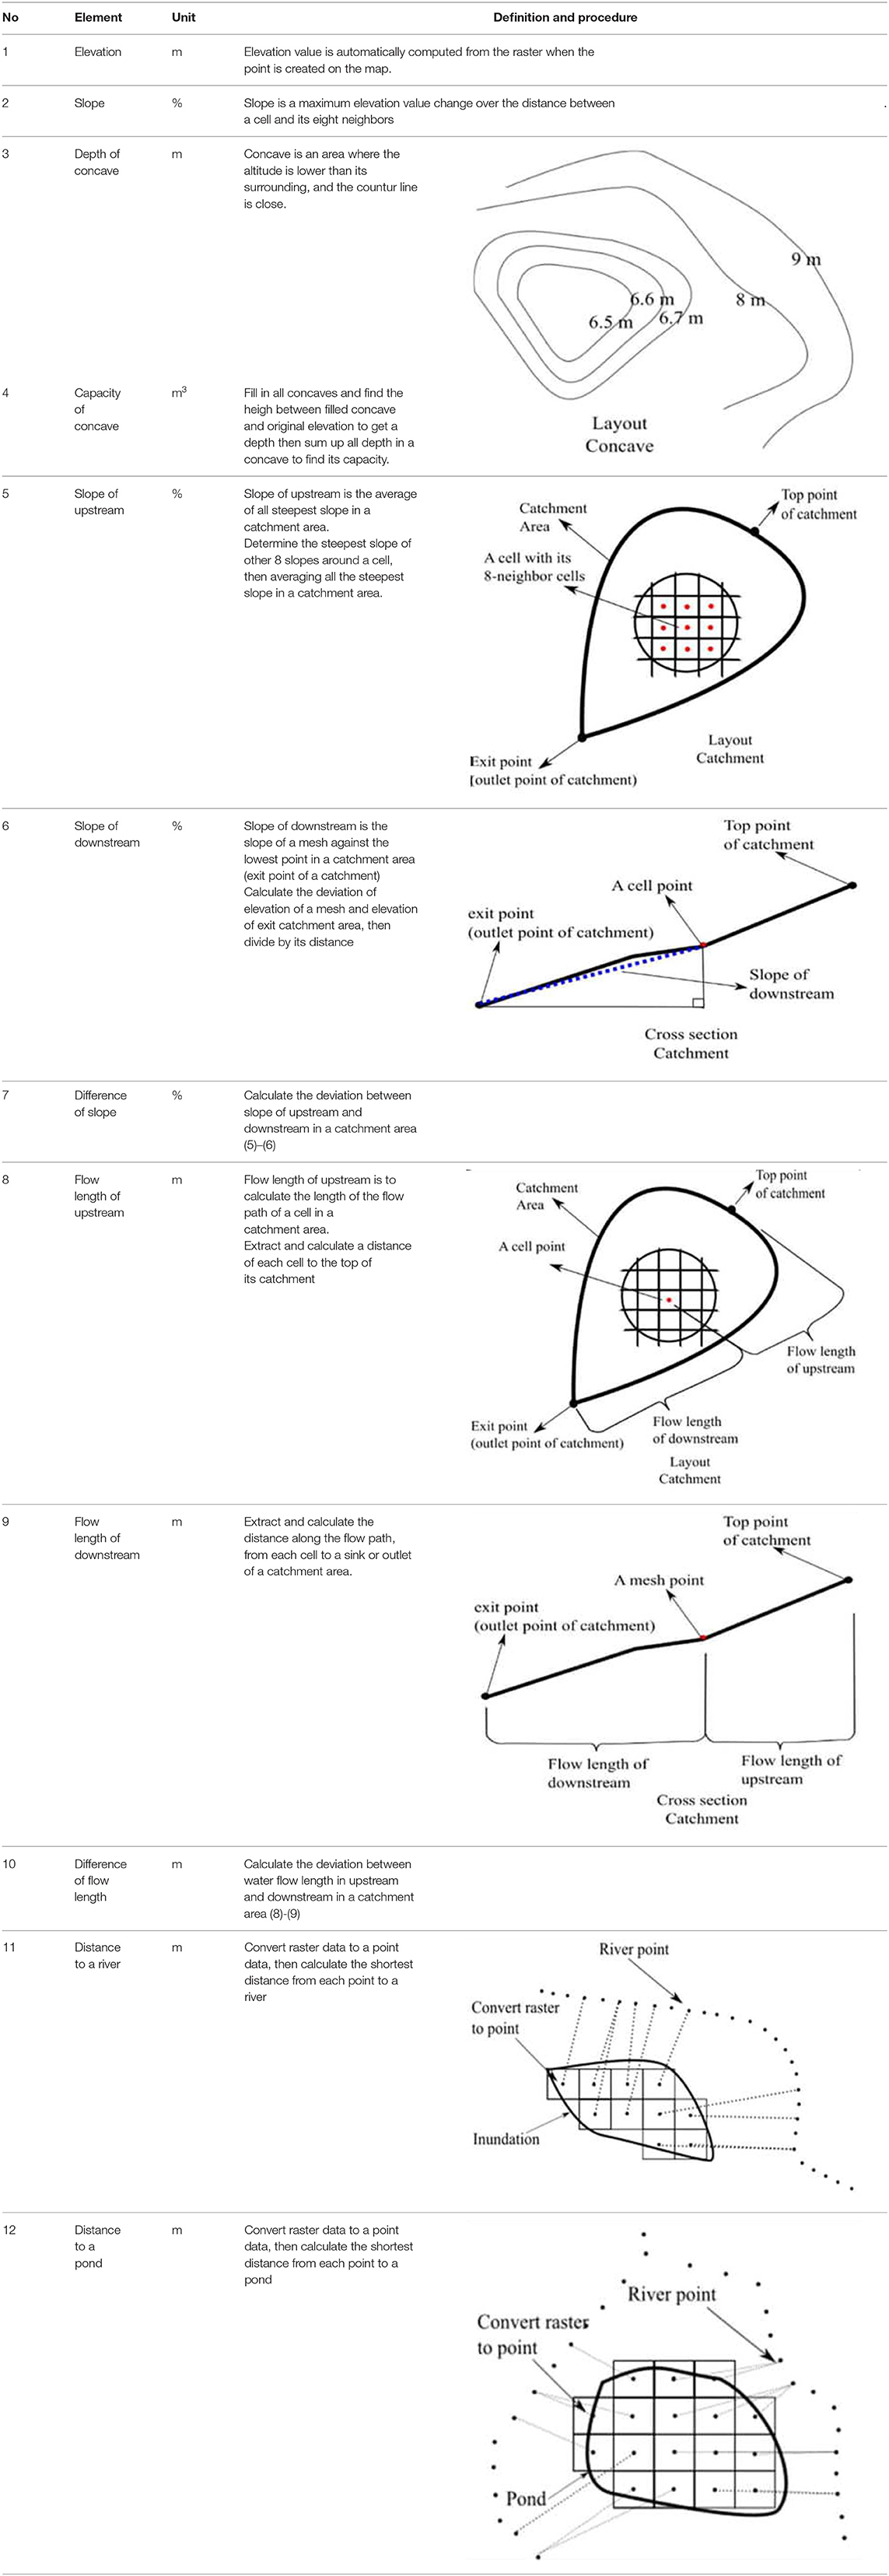
Table 1. Data creation methods.
After obtaning all topographic values from all frequent inundation area samples, we analyzed its main topographical characteristics using PCA based on an earlier report by Sato and Hayashi (2014). Based on principal components we inferred from PCA, we calculated a set of principal component scores for each cell. The scores can be interpreted geometrically as projections of the results of principal components. To obtain the score, the following equation was used.
Pn(i, j) where is the principal component score of number n at mesh (i, j); am(i, j) is the standardized value of m factor at mesh (i, j); and lm is the factor loading of m factor.
Conceptually, to assess similarity rates of topographical characteristics in frequent inland water flooding areas and in other areas in the city, we computed the deviation value of the averaged principal component score of frequent inundation meshes and scores of every mesh in the targeted areas using Equation 2.
where H(i, j) is the indicator of how similar topographical characteristics at mesh (i, j) are; Pn(i, j) is the principal component score of number n at mesh (i, j); is the average principal component score of number n at frequent inundation area mesh (i, j); wn and is the contribution ratio of number n.
In other words, a smaller deviation value between the principal component score at a cell and average principal component score of frequent inundations indicates that cells share strong topographical similarities and vice versa. By the deviation value of the principal component score, one can visualize similarity rates on a map. Using the map, a cell with higher and fewer similarities will be easier to differentiate and to understand. Frequent inland water flooding areas that are laid on less topographical similarity can then be considered because other factors are primary. Then by field surveys, one can obtain other causes of inundation.
Results and Discussion
Comparison of Numbers of Inundation and Numbers of Meshes in Varying Mesh Size
Inland water flooding records replicated using approximately 90 m DEM data generated 888 meshes from 40 inundations of 8-year recorded inundations. Moreover, this mesh size produced an unbalanced mesh ratio among inundation frequencies. The mesh ratio was the ratio of the number of meshes in an inundation frequency. For instance, the three-time inundation frequency had mesh ratio of 12.8, which means that there were 12–13 meshes in an inundation. As might be apparent from Table 2, the ratios of four-, five-, and six-time inundation were mesh ratios of 24: one inundation had 24 meshes or in the other words through 90 m DEM, four-, five-, and six-time inundation were almost two times stronger than three-time inundation. All topographical parameters were extracted from each mesh and calculated using PCA. The unbalances of the ratio will then produce a biased result because of the dominance of several inundations with numerous meshes against inundations with fewer meshes.
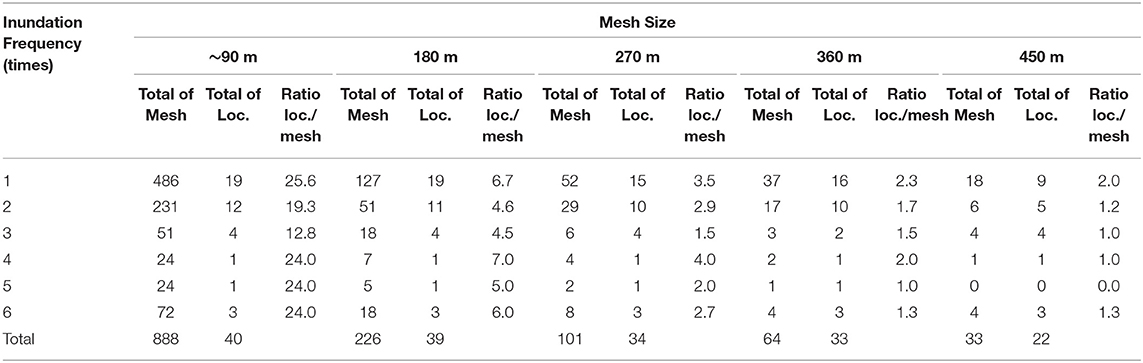
Table 2. Mesh size comparison.
Therefore, rescaling the mesh size multiple times to obtain an appropriate mesh size was necessary to avoid biased results. As shown in Table 2, 180 and 270 m mesh sizes still leave an unbalanced ratio between its frequencies, with the highest ratio differences at 1.6 to 2.7 consecutively. The 450-m mesh size was larger than some inundations. Using it, five-time inundations cannot be captured. The mesh ratios among inundation frequencies of 360 m mesh were not overly large differences. The range of ratios is 1–2.3; the meshes in all inundations can represent parameters adequately. Even though the numbers of locations and meshes in this large mesh size were reduced, in PCA calculations, it was reasonable because it can avoid the dominant topographical characteristics from some vast inundations.
After determining the mesh size, the “frequent inland water flooding areas” must be clarified based on the inundation portion of each frequency in 360 m mesh size (Table 2). The percentages of one-time to six-time frequencies were 48, 30, 6, 3, 3, and 9% successively. For representing frequent inundations, summing the percentages must be done from most-frequent to least-frequent inland water flooding areas to get at least 50%. The total two-time to six-time inundations were 17 inundated spots, equal to 52% of the total inundations. Therefore, results clarified that areas facing inundation two to six times during an 8-year recording period were frequent inland water flooding areas.
Principal Component Analysis Results
Details of the results of PCA analyses of topographical parameters from frequent inland water flooding areas are shown in Table 3. Four principal components (PCs) had eigenvalues exceeding 1 and had 77.5% cumulative contribution ratios. The first principal component (PC1) accounted for 30.8% of the total variance. The variables correlated the most with the PC1 were slope upstream (0.427) and difference of slope (0.421) in positive values. One can infer that frequent inland water flooding areas had an upstream slope that was higher than the downstream slope.
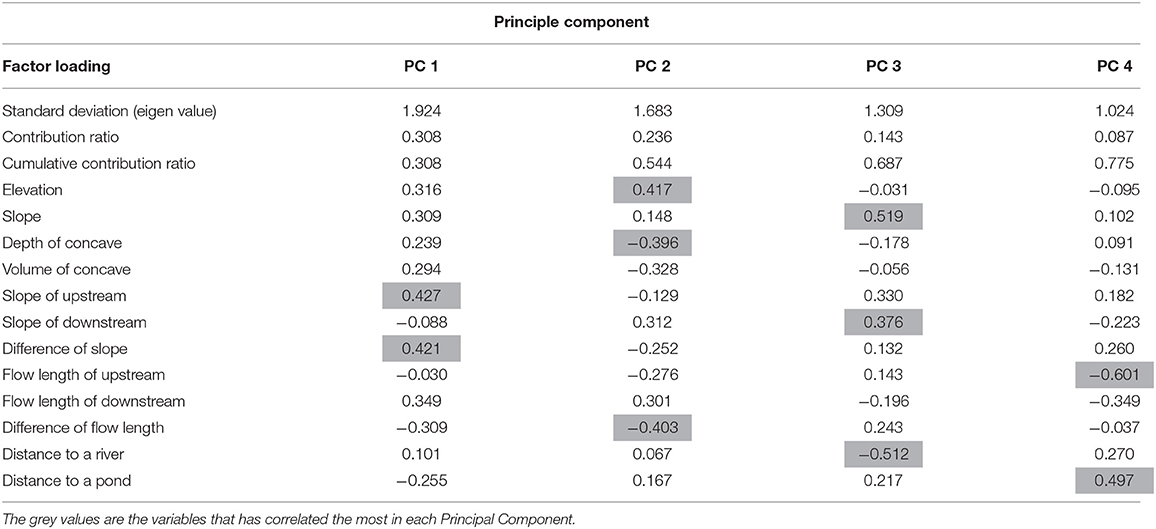
Table 3. Principal component result.
Principal component 2 (PC2) was strongly correlated with three variables: elevation, depth of concavity, and flow length difference. Elevation had a different pattern from the others. It had a positive value, whereas the two others had negative values. These results suggested that frequent inland water flooding areas were correlated with the contrary condition between the depth of concavity, flow length difference, and elevation. Therefore, one can conclude that frequent inland water flooding areas had downstream flow length longer than upstream, low concavity depth, and location at a high elevation.
The third component (PC3) showed a large opposition association between slope and distance to a river. One can assume that if an area was close to a river and that its slope was steep, then it was likely to be a frequent inundation area.
Principal component 4 (PC4) had a contrary value between flow length upstream and distance to a pond. An area with a short of flow length upstream and a nearby pond showed similar characteristics to those of frequent inland water flooding areas.
Visualization of Topographical Inundation Rates Map
Figure 3 presented the distribution of the H(i, j) value in Tangerang city. The rates of H(i, j) were 0.13–3.76. Almost all areas in Tangerang city had high and medium similarity rates. In other words, no high topographical difference was found among the city areas. Moreover, from 4,158 calculated meshes, 432 meshes had low similarity rates, 1,902 meshes had medium similarity rates, and 1,824 meshes had high similarity rates.

Figure 3. Topographical inundation rates map.
Of 21 frequent inland water flooding areas in the city, 15 were in the high topographical similarity area. Furthermore, even though in the PCA calculation topographical parameters of one-time inundation areas were not included, the result was still capable of capturing those inundations. In other words, 14 one-time inundations, representing 74% of total one-time inundations, belonged to a high topographical similarity area. The remaining six frequent inland water flooding areas had no close relation with the topographic conditions. Therefore, topography itself cannot explained its mechanisms. Those inundations tend to be caused by urban factors. For that reason, identifying the phenomenon requires further analysis by direct field observation.
Field observations were conducted at six frequent inland water flooding areas that had no close relation with topographic conditions. A conceptual diagram of the surface water direction and structure barrier of these locations was shown in Figure 4. On the diagram, each inundated location was separated to be eight cells, with an inundated spot in the center. Those six inundations were located near a river. Moreover, five were equipped with flood control structures such as dikes, watergates, and a pumping station. The latter helps to protect the areas from inundation by pumping away the disturbance of flow downstream to a river or main drainage system. However, its flow downstream hitting the dike then cannot be pumped efficiently by the pump because of a lack of capacity. This condition made water flow become an inundation. Furthermore, the water flow of another inundation failed to flow to the river because of obstruction by a bridge. It then becomes inundated. Finally, it can be stated that 29% of frequent inland water flooding areas were found to be related to artificial structures and urban factors.
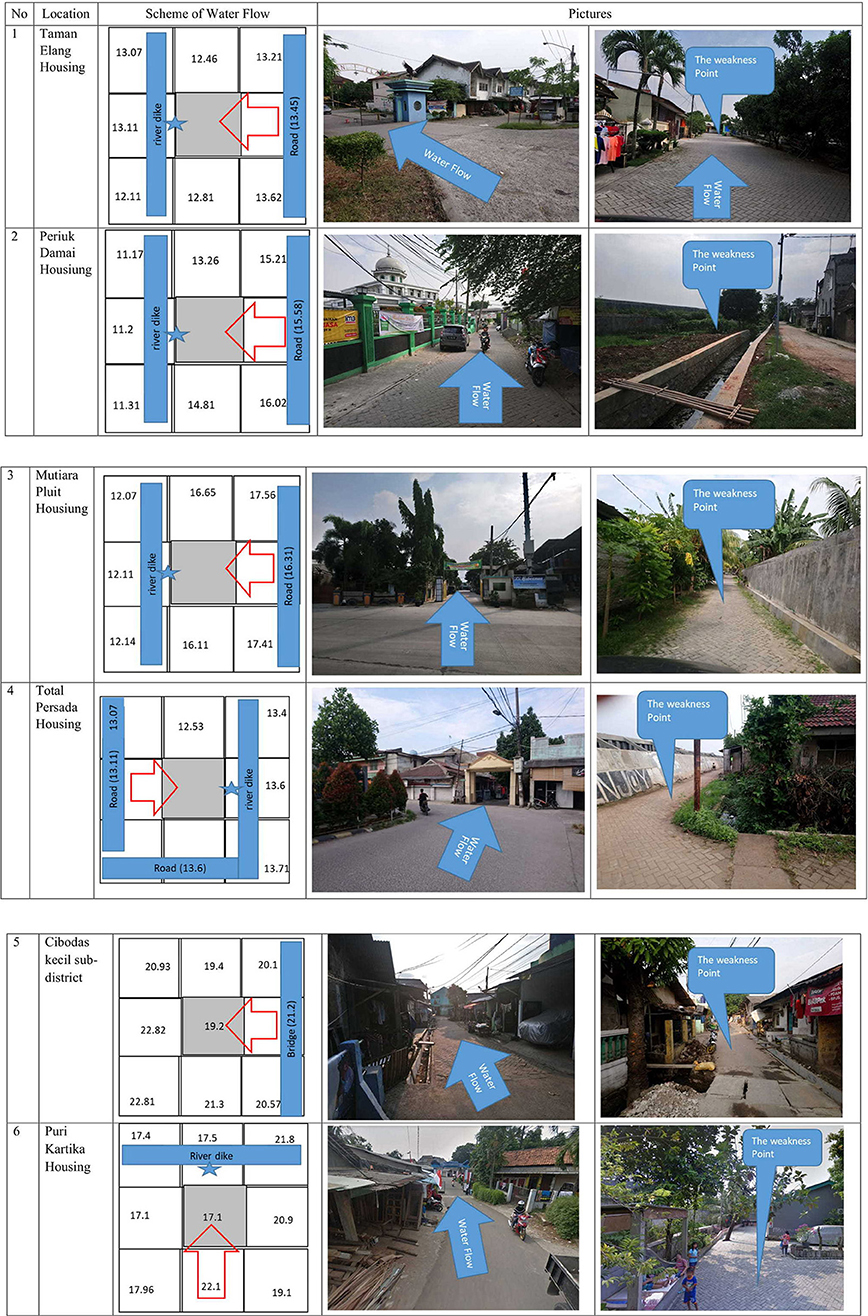
Figure 4. Classification of frequent inland inundation areas by the position of its surrounding structure and flow direction.  , Water pump;
  , Water surface direction;
  , Structure barrier;
  , Inundated area.
Conclusion
From PCA results, one can infer that the main characteristics of frequent rainfall inundation areas in Tangerang city were its upstream slope steeper than its downstream slope, the correlation between the concave condition and flow length condition, the correlation between the slope condition and distance from an area to a river, and the correlation between upstream flow length and distance to a pond.
This study quantitatively evaluated influences of topographical characteristics on the formation of frequent inland water flooding areas in Tangerang city because the average value of H(i, j) for frequent inundation was 0.66; the average value of H(i, j) in all areas was 0.89. Therefore, topographical characteristics remained as main issues affecting frequent inundation of Tangerang. Among all factors, 71.4% (15 inundations) were attributable to its topographical conditions; another 28.6% (six inundations) were attributable to anthropogenic factors such as change overland flow directions in these areas and trapping of water by facilities.
Data Availability Statement
The original contributions presented in the study are included in the article/supplementary material, further inquiries can be directed to the corresponding author/s.
Author Contributions
ED and DK: conceptualization, methodology, field investigations, analysis, and writing—review and editing. ED: writing—original draft preparation and visualization. DK and SK: supervision. All authors contributed to the article and approved the submitted version.
Funding
This research was conducted with support by the Professional Human Resources Development-IV, Ministry of National Development Planning Republic of Indonesia, and International Post-Graduate Program in Human Security, Tohoku University.
Conflict of Interest
The authors declare that the research was conducted in the absence of any commercial or financial relationships that could be construed as a potential conflict of interest.
Publisher's Note
All claims expressed in this article are solely those of the authors and do not necessarily represent those of their affiliated organizations, or those of the publisher, the editors and the reviewers. Any product that may be evaluated in this article, or claim that may be made by its manufacturer, is not guaranteed or endorsed by the publisher.
Acknowledgments
For this study, inundation area maps were provided as a crucially important material by the Tangerang Municipality Government.
References
Bathrellos, G. D., Gaki-Papanastassiou, K., Skilodimou, H. D., Papanastassiou, D., and Chousianitis, K. G. (2012). Potential suitability for urban planning and industry development by using natural hazard maps and geological–geomorphological parameters. Environ. Earth Sci. 66, 537–48. doi: 10.1007/s12665-011-1263-x
Farid, M., Mano, A., and Udo, K. (2012). Urban flood inundation model for high density building area. J. Disaster Res. 7, 5. doi: 10.20965/jdr.2012.p0554
Fariza, A., Basofi, A., Prasetyaningrum, I., and Pratiwi, V. I. (2019). Urban flood risk assessment in sidoarjo, indonesia, using fuzzy multi-criteria decision making. J. Phys.: Conf. Ser. 1444, 012027. doi: 10.1088/1742-6596/1444/1/012027
Fukushima, Y. (1988). Mechanism of formation of urban flood-prone areas—a case study in Koshigaya city—saitama prefecture (in Japanese). Ochanomizu Geography 29, 43–46. Available online at: https://teapot.lib.ocha.ac.jp/records/36343#.YPciRpMzY-R
Hammond, M. J., Chen, A. S., Djordjevic‘, S., Butler, D., and Mark, O. (2015). Urban flood impact assessment: a state-of-the-art review. Urban Water J. 12, 14e29. doi: 10.1080/1573062X.2013.857421
Hromadka, T. V., and Lai, C. (1985). “Solving the two-dimensional diffusion flow model” in Presented at the Hydraulics and Hydrology in the Small Computer Age, ASCE. New York, NY. 555–56.
Hsu, M., Chen, S., and Chang, T. (2000). Inundation simulation for urban drainage basin with storm sewer system. J. Hydrol. 234, 21–37. doi: 10.1016/S0022-1694(00)00237-7
Jha, A. K., Bloch, R., and Lamond, J. (2012). Cities and Flooding: A Guide to Integrated Urban Flood Risk Management for the 21st Century. Washington, DC. Available online at: https://openknowledge.worldbank.org/handle/10986/2241
Jourde, H., Lafare, A., Mazzilli, N., Belaud, G., Neppel, L., Dorfliger, N., et al. (2014). Flash flood mitigation as a positive consequence of anthropogenic forcing on the groundwater resource in a karst catchment. Environ. Earth Sci. 71, 573–83. doi: 10.1007/s12665-013-2678-3
Lowe, R., Urich, C., Domingo, N. S., Mark, O., Deletic, A., and Arnbjerg-Nielsen, K. (2017). Assessment of urban pluvial flood risk and efficiency of adaptation options through simulationse a new generation of urban planning tools. J. Hydrol. 550, 355–67. doi: 10.1016/j.jhydrol.2017.05.009
Manfreda, S., Leo, M., and Di Sole, A. (2011). Detection of Flood-Prone Areas Using Digital Elevation Models. J. Hydrol. Eng. 16, 781–90. doi: 10.1061/(ASCE)HE.1943-5584.0000367
Moe, I. R., Kure, S., Farid, M., Udo, K., Kazama, S., and Koshimura, S. (2016). Evaluating of flood inundation in jakarta using flood inundation model calibrated by radar rainfall. J. Japan Soc. Civil Eng. Ser. B1. 72, I_1243–I_1248 2016. doi: 10.2208/jscejhe.72.I_1243
Murayama, Y. (1987). Formation of flood-prone areas due to urbanization—Example of Kawasaki City (in Japanese). Tohoku Geogr. 39, 147–60. doi: 10.5190/tga1948.39.147
Nakaguchi, K., Komori, D., Inoue, R., and Kazama, S. (2018). Distribution and Characteristics of Frequent Inland Inundation Areas in Osaka City (in Japanese). J Japan Soc Hydrol Water Resour. 31, 9–16. doi: 10.3178/jjshwr.31.9
Papadopoulou-Vrynioti, K., Bathrellos, G. D., Skilodimou, H. D., Kaviris, G., and Makropoulos, K. (2013). Karst collapse susceptibility mapping using seismic hazard in a rapid urban growing area. Eng. Geol. 158, 77–88. doi: 10.1016/j.enggeo.2013.02.009
Sato, R., and Hayashi, T. (2014). Topographical and topographical characteristics of flooded areas and visualization of potential for pluvial flooding (in Japanese). J Japan Soc Hydrol Water Resour. 27, 158–69. doi: 10.3178/jjshwr.27.158
The Ministry of National Development Planning of the Republic Indonesia (2017). Report of Estimation of Damages and Losses Post Flood Disaster on Early February 2007 in the Jakarta Greater Area (Jakarta, Bogor, Depok, Tangerang, and Bekasi) (In Bahasa). The Ministry of National Development Planning of the Republic Indonesia.
Wang, Y., Chen, A. S., Fu, G., Djordjevic̀, S., Zhang, C., and Savic‘, D. A. (2018). An integrated framework for high-resolution urban flood modelling considering multiple information sources and urban features. Environ. Model. Softw. 107, 85–95. doi: 10.1016/j.envsoft.2018.06.010
Wasantha Lal, A. M. (2008). Performance comparison of overland flow algorithms. J. Hydraul. Eng. 124, 342–9. doi: 10.1061/(ASCE)0733-9429(1998)124:4(342)
Yamazaki, D., Ikeshima, D., Tawatari, R., Yamaguchi, T., O'Loughlin, F., Neal, J. C., et al. (2017). A high-accuracy map of global terrain elevations. Geophys Res Lett. 44, 5844–53. doi: 10.1002/2017GL072874
Yin, J., Yu, D., and Wilby, R. (2016). Modelling the impact of land subsidence on urban pluvial flooding: a case study of downtown Shanghai, China. Sci. Total Environ. 544, 744–53. doi: 10.1016/j.scitotenv.2015.11.159
Keywords: statistical analysis, GIS computation, frequent inland water flooding, principal component analysis, topographical analysis
Citation: Djamres EKD, Komori D and Kazama S (2021) Topographical Characteristics of Frequent Inland Water Flooding Areas in Tangerang City, Indonesia. Front. Water 3:661299. doi: 10.3389/frwa.2021.661299
Received: 30 January 2021; Accepted: 30 June 2021;
Published: 13 August 2021.
Edited by:
Jitendra Kumar, Oak Ridge National Laboratory (DOE), United StatesReviewed by:
Xi Chen, University of Cincinnati, United StatesSubimal Ghosh, Indian Institute of Technology Bombay, India
Copyright © 2021 Djamres, Komori and Kazama. This is an open-access article distributed under the terms of the Creative Commons Attribution License (CC BY). The use, distribution or reproduction in other forums is permitted, provided the original author(s) and the copyright owner(s) are credited and that the original publication in this journal is cited, in accordance with accepted academic practice. No use, distribution or reproduction is permitted which does not comply with these terms.
*Correspondence: Eilif Kurnia Deda Djamres, ZWlsaWYuZGphbXJlcy44NXhAc3Qua3lvdG8tdS5hYy5qcA==