 Matteo Camporese
 Silvio J. Gumiere
 Mario Putti3
- 1Department of Civil, Environmental and Architectural Engineering, University of Padova, Padova, Italy
- 2Department of Soils and Agri-Food Engineering, Laval University, Québec, QC, Canada
- 3Department of Mathematics, University of Padova, Padova, Italy
Agriculture is the major user of water resources, accounting for 70% of global freshwater demand. As the demand for clean water increases, so does the need to implement more efficient strategies for water management in irrigated agriculture. While the benefits of precision irrigation in high-value crops, such as cannabis, tomatoes, and potatoes, are fully recognized, there is still need to investigate and implement cheap and efficient irrigation strategies for widespread low-value crops such as maize. In this study, the soil moisture dynamics in a sprinkler-irrigated maize field in Veneto (Northeastern Italy) was monitored using six time domain reflectometry (TDR) probes for the entire growing season. The TDR sensors were positioned at different depths into two separate sites: an Uninformed Site irrigated based on the farmer's experience and an Informed Site in which a water balance irrigation strategy was applied based on soil moisture measurements. A parsimonious hydrological model was then implemented and calibrated to quantify the different water balance terms (precipitation, evapotranspiration, lateral fluxes, and deep percolation). The comparison between the water budget terms in the two sites highlights that soil moisture monitoring during agriculture activities leads to substantial savings in terms of irrigation water volumes requirements and cost, without compromising the productivity of the crop field. A simplified upscaling of the results at the regional scale, assuming average conditions as in this study site and growing season, reveals that potentially significant economic savings, compared to the total profits linked to maize crops, could be possible.
1. Introduction
Agriculture accounts for around 70% of global freshwater withdrawals, reaching up to 90% in some fast-growing economies, irrigation and food production representing one of the major uses of freshwater resources, with about 3,100 km3 of annual water consumption (World Water Assessment Programme, 2012). About 40% of the total food production is relying on irrigated agriculture, which represents less than 20% of the total cultivated lands (World Water Assessment Programme, 2009), while global population growth projections of 2–3 billion people over the next 40 years, combined with changing diets, are estimated to result in a food demand increase of 70% by 2050 (World Water Assessment Programme, 2012). Therefore, efficient and responsible methods for agriculture water management are of paramount importance for global environmental preservation and securing human food needs.
Water resources management largely depends on climatic and soil factors as well as freshwater availability, with rainfall representing the primary source of uncertainty in quantifying the productivity and profitability of crop fields (Vico and Porporato, 2011). When natural rainfall intermittency is too large, irrigation has the function of supplementing the soil water needs. Local climatic conditions cannot be controlled by farmers in order to increase crop productivity, but proper water resources management may significantly increase the overall efficiency of irrigation and water productivity (crop yield per unit applied water). Micro-irrigation is one of the newest and most efficient irrigation schemes for water use optimization, but its installation and maintenance cost is very high compared to surface and sprinkler irrigation schemes. The latter are the most diffuse worldwide and balance sustainability, yield and profitability with lower cost for farmers (Vico and Porporato, 2011).
Identifying optimal irrigation strategies is not trivial, due to multiple variables involved: soil and vegetation features, climate and rainfall variability, water cost, and crop sale price. Soil water content and its dynamics, in particular, play a crucial role by influencing many hydrological processes relevant for the root zone, such as partitioning of rainfall into infiltration and runoff and the partitioning of net radiation into sensible and latent heat fluxes (Hupet and Vanclooster, 2002). In addition, soil moisture dynamics have an impact on subsurface drainage and thereby losses by deep percolation. The rate of transpiration, carbon assimilation and biomass production are often limited by the soil water content during the plant growing season. In water-stressed conditions, plants undergo a state of limited transpiration that depends on the plant physiology and the local pedological and climate characteristics (Porporato et al., 2002) and induces a negative impact on the plant's health and productivity. Water management applied to agricultural activities has the objective of minimizing water losses through percolation and maximizing plant's carbon assimilation through an optimization of irrigation application. A proper knowledge of the processes that control soil water dynamics proves essential to achieve this target. Hydrological models can thus play a crucial role in the understanding of the dynamic interactions among climate, soil, water and vegetation (Milly, 2001), with relevant implications for agriculture (e.g., Albano et al., 2017).
Within this context, various researchers have developed decision support tools based on real-time monitoring of the soil water status (soil moisture and/or matric potential) to increase crop productivity and improve irrigation water use efficiency compared to conventional irrigation management. For instance, Létourneau et al. (2015) have shown that strawberry yields increased on average by 6.2% when controlling irrigation using real-time observations of soil matric potential in the root zone, with an associated increase of water use efficiency varying from 7 to 15%. Muñoz-Carpena et al. (2003) have shown analogous results for tomato production, with water use efficiency increasing by 7%, while Pelletier et al. (2015) reported a 25% increase in cranberry yields in Canada. Rallo et al. (2014), for mature olive groves, and Rekika et al. (2014), for celery, onions, and spinach, have also shown water use efficiency increases in a range from 16 to 25% when using irrigation scheduling controlled by sensors. Besides the yields-related financial benefits, irrigation controlled by field soil measurements helps to reduce the environmental impact of crop production. Sensor-controlled irrigation may also reduce energy consumption for pumping, resulting in a reduction of greenhouse gas emissions (Trost et al., 2013) and energy savings (Hedley et al., 2009), as well as reduced runoff and deep percolation, including nitrate and others nutrients leaching (Daccache et al., 2015; González Perea et al., 2018).
On the other hand, monitoring systems, especially the ones based on tensiometers (Muñoz-Carpena et al., 2003) or even more sophisticated sensors (Rallo et al., 2014), may require high installation costs and routine maintenance. Therefore, while it is well-established that precision irrigation is beneficial for high-value crops, it is still unclear whether the installation and maintenance costs of sensor-based irrigation strategies are convenient for widespread low-value crops such as maize, especially in relatively wet regions (Daccache et al., 2015).
The goal of this study is to present and test a modeling and experimental framework for efficient sprinkler irrigation of maize, a widespread crop in Italy, especially in the North, and in other regions of the world. The framework is based on field monitoring of soil moisture dynamics, based on low-maintenance and affordable time domain reflectometry (TDR) sensors, integrated with a parsimonious hydrological model for the estimation of the water balance terms at the daily time scale. The proposed irrigation strategy is applied to a maize field in Northeastern Italy, whereby two sites were compared: an “Uninformed Site,” irrigated based on farmer's experience, and an “Informed Site,” where the crop was watered based on soil moisture monitoring.
The paper is organized as follows. This Introduction is followed by a section 2, describing the study area and the monitoring instruments, together with the modeling framework. Section 3 reports on the data collected, model results, and water balance analysis and comparison. Then, a comprehensive discussion of the benefits of informed irrigation is presented in section 4, including estimations of water savings obtained by extrapolation to a larger regional scale. Finally, we draw conclusions in section 5.
2. Materials and Methods
2.1. Study Area
This study was conducted in an agricultural field located in Albettone, province of Vicenza, Northeastern Italy (Figure 1), during the 2013 growing season. On April 17, 2013, the field was sowed with a hybrid corn variety labeled “P1758,” provided by Pioneer Hi-Bred Italia S.r.l. and rated as FAO (Food and Agriculture Organization of the United Nations) class 700, indicating a late maturity hybrid with a maturation period ranging from 130 to 140 days. In particular, the hybrid used in this study has an average maturation period of 132 days and a plant density of about 7 plants per square meter. Harvesting was carried out in mid September, 2013.
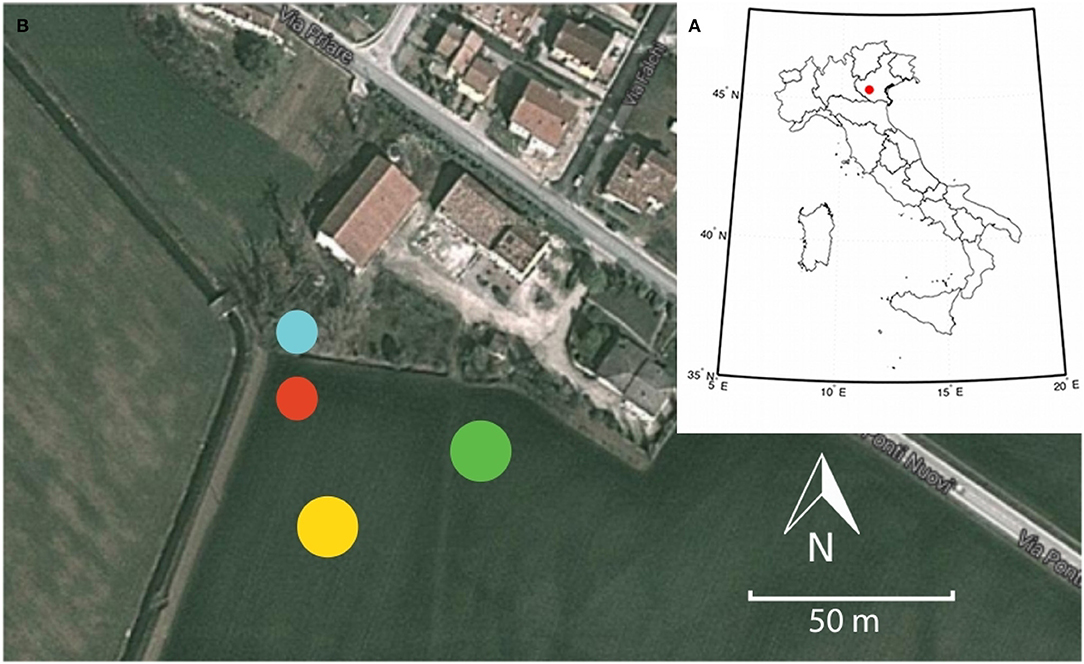
Figure 1. (A) Location of the study area within Italy. (B) Position of the TDR probes in the uninformed site (yellow dot) and in the informed site (green dot), TDR data logger (blue dot), and rain gauge (red dot).
Soils in the study area are classified as Gley-Fluvic Cambisols, with a relatively homogeneous profile and occasional organic horizons. They are moderately deep (50–100 cm), with fine or moderately fine texture, slow drainage capability, low permeability, and very high available water capacity. The typical horizons sequence is Ap-Bg-(H)-Cg (ARPAV, 2005). In particular, the soil in the experimental site can be classified as clay loam, with percentages of sand, silt, and clay of 24.7, 44.5, and 30.7%, respectively. Due to the relatively high content of clay, the soil is prone to cracking as a consequence of shrinkage when soil moisture decreases (e.g., Bronswijk, 1988). The depth to the water table in the field is typically larger than 2 m, as inferred from observing the water level in the side ditches.
2.1.1. Informed vs. Uninformed Site
The maize field is irrigated by means of a traditional sprinkler system, the most common technique in Italy, which typically consists in spraying water over the crop by fixed sprinklers and/or moving hose reels. In this study, in particular, a small portion of the maize field was selected as our “informed site,” where irrigation was applied by a fixed sprinkler, with timing and volumes based on the concept of “readily available water,” RAW:
where n is porosity, Zr is rooting depth, and θfc and θ* are soil water content at field capacity and incipient water stress, respectively, which are related to their corresponding water saturation values, sfc and s*, through the porosity (θfc = n × sfc and θ* = n × s*). Porosity is around 0.50, as estimated in the laboratory, while the rooting depth was assumed equal to the depth at which the field was plowed, i.e., 400 mm. Even though this is less than the maximum effective rooting depth for maize recommended by FAO (Allen et al., 1998) (1.0–1.7 m), the soil in the study area has a high clay content, resulting in a restriction of the root elongation (Schneider and Don, 2019). Parameters sfc and s* were estimated on the basis of a preliminary analysis on soil moisture data collected as described in section 2.4, resulting in values of 0.82 and 0.65, respectively. These correspond to soil water content at field capacity and incipient water stress equal to 0.41 and 0.325, respectively. As a result, the estimated RAW in our study is 34 mm, which corresponds to the target water amount applied over the field whenever the measured soil moisture decreased under the threshold θ* = 0.325. The actual amount of water provided to the informed site may differ from the target value, as it was only possible to monitor irrigation by means of a simple rain gauge with manual reading.
In the remaining part of the field, the “uninformed site,” sprinkler irrigation was performed by means of a hose reel. Irrigation here usually relies on the farmer's experience, whereby timing and volumes of water application are decided by observing the leaves of the maize plants and sometimes taking into account the air temperature and weather forecasts. However, in this study we deliberately chose to irrigate the two sites with approximately the same timing, to make watering operations simpler for the farmer and prevent the formation of significant soil moisture gradients from one site to the other. On the other hand, the target water amount in the uninformed site (40 mm for each irrigation event) was decided by the farmer independently, based on their habit, and the actual amount of water released basically matched this value, thanks to a flow meter installed on the supply pipe. Table 1 summarizes the timing and volumes of irrigation events in the two sites during the study period.
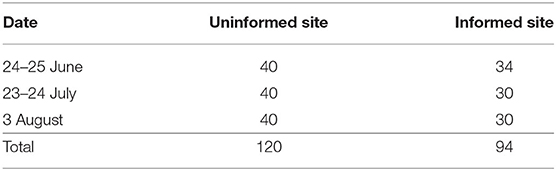
Table 1. Amount of water (mm) applied to the uninformed and informed sites during the study period.
2.2. Instruments and Hydrologic Data
On June 10, 2013, six time domain reflectometry (TDR) probes were installed in the field, in two different locations about 30 m apart (Figure 1). Each probe consisted of three stainless steel 20 cm-long rods connected to a coaxial cable. The first three probes (1, 2, and 3) were located in the informed irrigation site, while the other three (probes 4, 5, and 6) were placed in the uninformed site. In both sites, the probes were installed horizontally at three different depths: probes 1 and 4 at 10 cm, probes 2 and 5 at 20 cm, and probes 3 and 6 at 35 cm. The uninformed site is located slightly downslope from the informed site. This is due to a small slope in the field that allows water (including possible runoff) to flow toward the side ditches. However, we note here that surface runoff was never observed during the 2013 growing season.
A TDR data logger was wired to the probes and set up to collect measurements at a 2-h interval, which reduced to 15 min during irrigation events, in order to capture the soil water content response to infiltration with a higher time resolution. The raw data recorded by the logger consist of the typical TDR waveform, which was subsequently elaborated to estimate the soil bulk dielectric constant. This was then converted into water content, θ, by means of the widely accepted empirical calibration relationship proposed by Topp et al. (1980).
Rainfall and irrigation rates were measured in the study site as described in the previous section. Additional weather data, namely solar radiation, air temperature, relative humidity, and wind speed, were collected at a daily resolution from the meteorological station of Teolo, less than 7 km from the study site and managed by the Veneto Region Environmental Protection Agency (ARPAV), in order to compute the reference crop evapotranspiration, ET0, using the FAO-Penman-Monteith formula (Allen et al., 1998).
2.3. Yield Data
In order to compare the productivity of the two sites, right after the end of the soil moisture data collection period, two samples of corn were collected from each site. Harvesting was carried out by collecting the maize row directly above the probes as well as two adjacent rows, so as to cover an area, A, of about 4 m2, with approximately the same number of full-grown plants. The plants were weighed separately for the two sites, before removing and weighing the corncobs. The kernels of a representative number of corncobs were counted for each site, after which the corncobs were removed and the kernels weighed. A sample of kernels for each site was analyzed in the laboratory to estimate their specific weight and moisture content. The harvest data were used to estimate the crop yield, Ya = Wg/A, in the two sites, where Wg is the weight of the corn kernels.
The crop yield was then used to assess the water productivity, WP, of each site:
where TWU is the total water used, which accounts for irrigation, rainfall and lateral flow. From a farmer point of view, referring only to irrigation water used, IWU, is more relevant, as it represents an actual cost. Therefore, we also compute irrigation water productivity, WPI, as:
2.4. Soil Moisture Model
We used here a vertically averaged approach to describe the soil water dynamics over a representative soil rooting zone of depth Zr (e.g., Rodriguez-Iturbe et al., 1999; Laio et al., 2001; Settin et al., 2007; Porporato et al., 2015):
where n is porosity, s is the spatially averaged water saturation (or relative soil moisture), and t is time. The right-hand side input and output terms are infiltration, I, actual evapotranspiration, ET, and percolation to deeper soil layers, L. We elected to use a parsimonious model, instead of a detailed physics-based Richards equation solver, to keep a balanced tradeoff between accuracy of the water budget estimation and number of parameters to calibrate. Also, the use of a parsimonious model allowed us to speed up the computation of uncertainty using a Markov Chain Monte Carlo method, as described later on in this section.
The infiltration rate is computed starting from Ps, i.e., the sum of rainfall, P, and irrigation rates, R, through the expression:
where Ksat is the saturated hydraulic conductivity.
Starting from the reference crop evapotranspiration, ET0, actual evapotranspiration, ET, is computed using:
where ks is the water stress coefficient, which depends on water saturation, vegetation, and soil properties, while kc is the crop coefficient, which is a function of the season and the crop. In particular, the FAO (Allen et al., 1998) identifies four different periods during the growing season: initial, crop development, mid-season, and late-season, whose lenghts vary with crop variety and crop conditions from region to region. The kc function is further defined by three parameters: kc,ini for the initial stage, kc,mid for the middle season and kc,end at the end of the late season stage, for a total of seven parameters (four lengths and three coefficients). However, to keep the number of tuning parameters limited, in this study we fixed the ratios of kc,mid/kc,ini and kc,end/kc,ini at values of 1.6 and 1.2, respectively. Moreover, we considered the kc values as constant over three growth periods instead of linearly variable, corresponding to period lenghts of 15, 66, and 20 days, for the initial growth, mid-season, and late season, respectively. Note that the model simulations start from June 10, when the TDR probes were installed, and not April 17, when the field was sowed. This explains the difference between the sum of the three growth periods in the model (101 days) and the maturation period of the hybrid corn used in the study (130–140 days).
The water stress reduction function depends on the pressure head according to the formulation by Feddes et al. (1978), but here it is expressed in terms of water saturation: ks is equal to 1 in well-watered conditions, i.e., for s greater than the incipient stress point, s*, and then decreases linearly, reaching zero at the wilting point, swp. As a result, ET is maximum and equal to the potential evapotranspiration when the soil moisture is higher than the incipient stress point, while, when water content decreases under s*, the plant stomata gradually start to close, reducing ET to zero when soil moisture is lower than the wilting point.
Deep percolation, L, is computed assuming free drainage at the bottom of the rooting zone. This is a reasonable assumption, as the water table is deep enough to ensure it does not have an influence on the soil moisture dynamics in the first 40 cm of soil. The relative hydraulic conductivity is computed as suggested by Clapp and Hornberger (1978), resulting in:
where b is an empirical fitting parameter.
At this point, all the terms appearing in the soil water balance are expressed as a function of water saturation, s, and Equation (4) is solved using a forward finite difference scheme with a discrete time step of 1 h, which ensures stability at all times.
In Equation (4), it is initially assumed that lateral water fluxes from surrounding areas are negligible. This is a reasonable assumption, because, in normal conditions, despite the small slope of the maize field, the product of horizontal hydraulic conductivity and hydraulic head gradient is relatively small and does not allow for significant quantities of water to move laterally between the sites and from upslope areas to the sites. However, it was observed that, after approximately t1 = 54 d from the beginning of data collection, subsequent to a dry period with no rainfall events, soil cracks started to appear on the field surface, especially in the informed site. Such cracks were quite shallow, extending to a depth not exceeding 20 cm. However, this probably led to the formation of macropores and thus an increased capacity of the soil to transfer water laterally in the field. For this reason, for times t > t1, the model takes into account additional water contributions from upslope areas, in both sites, and from the informed to the uninformed site. This is done by replacing Ps(t) in Equation (5) with the following terms, Ps,inf for the informed site and Ps,uninf for the uninformed site:
where P is rainfall, Rinf and Runinf are irrigation rates in the informed and uninformed sites, respectively, and α is a fraction of the total input from upslope areas. For simplicity, time dependence has been dropped in Equations (9) and (10), where α is represented as a constant value, even though the actual coefficient in the informed site is likely different from the one in the uninformed site. Also, note that the uninformed site receives an additional water input, αRinf, as it is located downslope from the informed site. This could also explain why the informed site exhibited more cracks than the uninformed one, due to its slightly higher elevation and thus susceptibility to being dryer.
Model calibration was performed separately for the two sites. Initially, we considered the informed site only, as its soil moisture dataset is complete, whereas some data gaps occurred for probe 6 in the uninformed site. Based on a preliminary one-at-a-time sensitivity analysis, we elected to keep most of the parameters fixed (Table 2), and to tune only Ksat, b, kcin, and α. Parameter optimization was carried out through the Markov Chain Monte Carlo (MCMC) method. In particular, the DREAM algorithm (Vrugt et al., 2009) was chosen, due to its high computational efficiency. A uniform prior distribution for each parameter was used with ranges specified in Table 3. To keep the computational effort low, we used 10 parallel chains and a maximum number of model runs equal to 5,000.
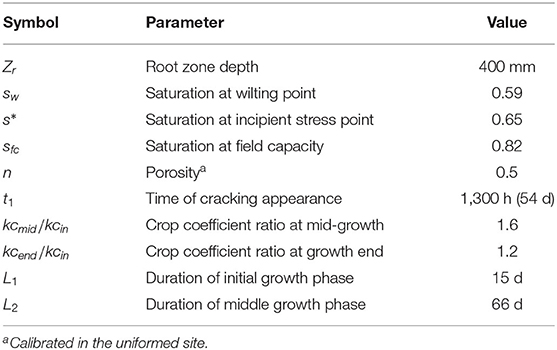
Table 2. List of constant parameters used for modeling soil moisture dynamics.
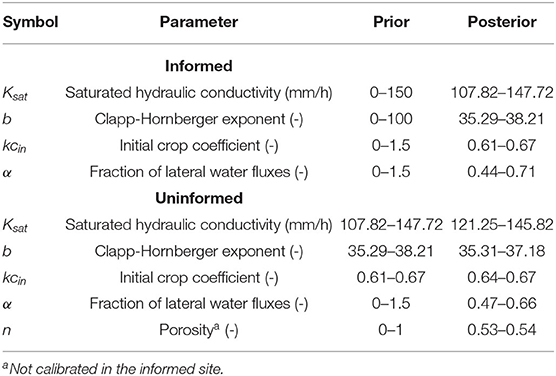
Table 3. List of calibrated parameters used for modeling soil moisture dynamics, including their prior and posterior uncertainty intervals (minimum–maximum values) derived with DREAM.
After calibration in the informed site, the model was also tuned in the uninformed site. However, to maintain as much physical consistency as possible between the two sites, the prior distribution of Ksat, b, and kcin were set equal to the posterior distribution found by DREAM in the informed site. On the other hand, α and n were sampled from prior uniform distributions with full uncertainty ranges, as reported in Table 3. This was done to allow for some limited spatial variability of the porosity between the two sites and to properly take into account the uncertainty of parameter α.
Due to the time resolution of the weather data and to increase numerical robustness, the parameter calibration was performed in both sites by minimizing the discrepancy (in terms of sum of squared errors) between model predictions and measured soil moisture data averaged at the daily time scale.
3. Results
3.1. Observed Data
Figure 2 reports the measured data in the two sites: rainfall (uniform over the whole maize field), irrigation rates, soil moisture content as recorded for every single TDR probe, and the daily averages of water content in both informed and uninformed sites. Consistent with irrigation data in Table 1, the top plot shows that the informed site received less irrigation water than the uninformed site. During the monitoring period, several rainfall events occurred, but only rainfall rates larger than about 10 mm/d led to a significant water content response, as shown by TDR data in Figures 2B,C. Also, the two-hourly TDR data clearly exhibit diurnal fluctuations, due to the daily cycle of root water uptake by the corn plants. Such fluctuations are no longer visible in Figure 2D, which reports the daily averages, i.e., the data used for the calibration of the soil moisture dynamic model.
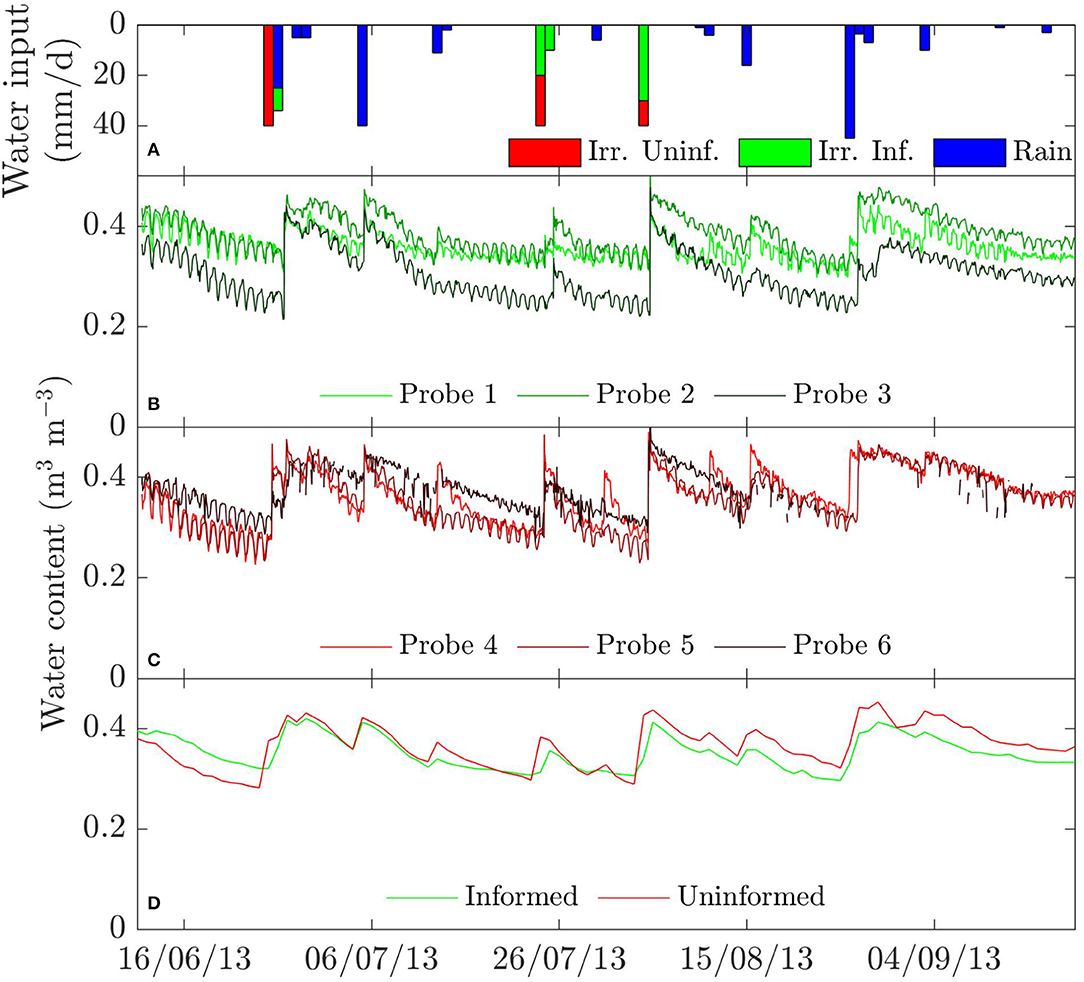
Figure 2. (A) Water inputs as rainfall and irrigation in the informed and uninformed sites; water content measured by the TDR probes in (B) the informed site and (C) the uniformed site; (D) daily averages of soil moisture in both sites.
From the end of June to the end of July 2013, the average soil moisture dynamics was very similar in the two sites, even though during that period the informed site received 16 mm less irrigation water than the uninformed site (Table 1). This is a first clue that soil moisture stress was avoided in the informed site, despite the smaller amount of irrigation water applied there.
However, starting from the beginning of August, the two daily soil moisture time series slightly diverge, with the uninformed site displaying a larger water content compared to the informed site. This is probably due to the formation of soil cracking, which was observed precisely in that period. Soil cracks, acting as macropores, likely increased the capability of water to be transferred laterally within the field. As the uninformed site is located downslope from the informed site, it was likely to receive more lateral contributions from upslope areas in the field, resulting in higher soil moisture values.
Finally, we note that the probes at different depths do not show significant discrepancies in soil moisture, except for probe 3 (35 cm depth in the informed site), which is characterized by consistently smaller water content values. This is probably due to some small-scale inherent variability in soil texture, horizonation or drainage characteristics. Note also that TDR probe 6 was affected by technical issues, starting from August 15th, with many data gaps in the last month of the monitoring period.
3.2. Model Performance
Overall, the DREAM algorithm achieved a satisfactory performance and was able to narrow down the posterior parameter distributions quite significantly (Table 3). In both sites, the only parameter with a relatively large posterior uncertainty compared to the prior is α, suggesting that the fraction of lateral water fluxes is difficult to estimate accurately without distributed information within the maize field.
The results of the calibrated model simulations, which refer to the ten final sets of parameters the MCMC chains converged to, are shown in Figure 3A for the informed site, together with daily averaged soil moisture observations. The fit between model and data is very good, with a root mean square error, RMSE, ranging from 0.0092 to 0.0095 m3/m3 and a Kling-Gupta efficiency (Gupta et al., 2009), KGE, ranging from 0.95 to 0.96 (a value of 1 representing a perfect fit). For comparison, we note that the typical accuracy of TDR soil moisture measurements without any soil-specific calibration is about 2% of the measured value (Skierucha, 2000), corresponding here to errors ranging from about 4×10⁻³ to 1×10⁻² m3/m3. The figure also highlights the soil moisture ranges where (i) plants are completely water-stressed (red zone), i.e., ET = 0, (ii) plants are partially water-stressed (yellow zone), (iii) evapotranspiration occurs at the potential rate (green zone), and (iv) deep percolation losses occur due to excess of water availability. Model and data agree that soil moisture never fell below the wilting point and deep percolation occurred only four times, mostly corresponding to significant rainfall events, except for the third peak, on August 3, which was caused by irrigation.
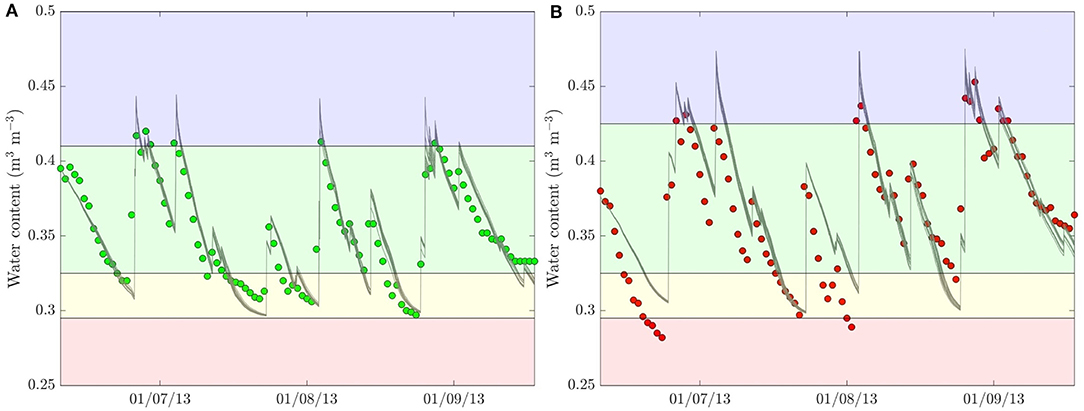
Figure 3. Measured (circles) and simulated (solid lines) daily water content in (A) the informed site and (B) the uninformed site. The simulation results refer to the final 10 sets of parameters derived with DREAM. The blue, green, yellow, and red regions indicate soil moisture ranges where percolation, optimal ET, partially stressed ET, and no ET occur, respectively. The soil moisture thresholds delimiting the four regions are field capacity, stress point, and wilting points, respectively.
The match between model simulations and observed data is also satisfactory (RMSE = 0.0178–0.0185 m3/m3 and KGE = 0.88–0.91) in the uninformed site, although not as good as in the informed site (Figure 3B). This is likely due to the fact that only porosity and the fraction of lateral water fluxes were allowed to vary within a large range in their prior distribution, whereas Ksat, b, and kcin were constrained within the posterior distribution found in the informed site, to maintain a reasonable consistency between the two sites. This could have prevented the model from taking into account additional possible heterogeneities within the maize field. However, we observe that the posterior distribution of the porosity is very close to the value measured in the informed site, indicating that the model is able to properly capture the soil moisture dynamics also in the uninformed site. Indeed, the RMSE range resulting from the MCMC procedure is still close to the TDR data accuracy, meaning that the goodness of fit of the model predictions is still sufficient to give us confidence that the water balance terms calculated by the model (section 3.3) are accurate enough for the scopes of this study. Overall, both the observed and simulated soil moisture time series display a larger range of variability compared to the informed site.
3.3. Water Balance
Once calibrated, the soil moisture dynamic model was used to compute the different water balance terms in the informed and uninformed sites. Figure 4A shows that the median total water input (total infiltration) estimated by the model in the uninformed site is 35 mm more than in the informed site, broadly consistent with the difference in irrigation rates between the two sites. This can be seen in Figure 4B, which shows the partitioning of the overall water input among rainfall, irrigation and lateral water fluxes. The latter are characterized by large uncertainty intervals, especially in the uninformed site, with a significant overlapping of the box plots, indicating that the difference between the two sites is not significant. This is confirmation that irrigation rates are the dominant factor explaining the overall water input differences between the two sites.
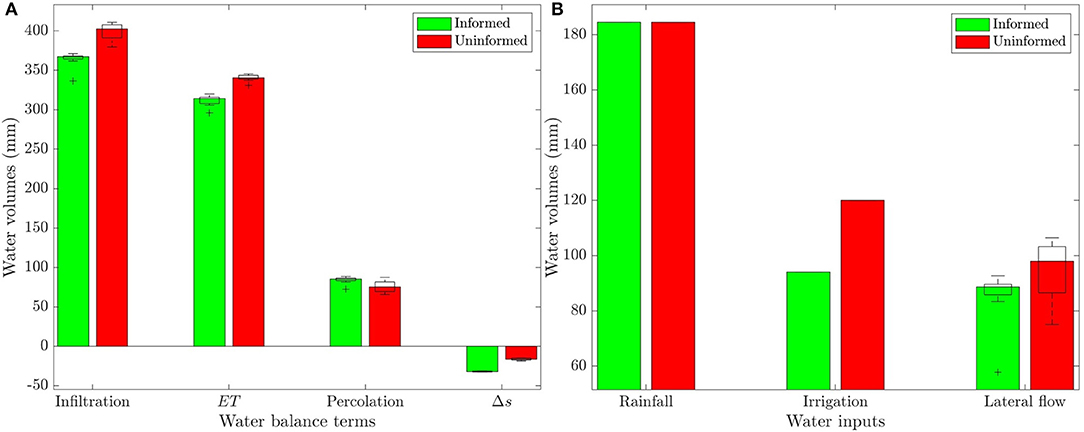
Figure 4. Comparison between (A) the water balance terms and (B) the different sources of water input (total infiltration) in the informed and uninformed sites as computed with the calibrated soil moisture dynamics model (ET and Δs are evapotranspiration and water storage change, respectively). The box plots of the simulations with the ten final sets of parameters derived with DREAM overlap the colored bars (median values). The bottom and top edges of the boxes indicate the 25th and 75th percentiles, respectively, the whiskers extend to the maximum and minimum values not considered outliers, and the outliers are marked by the “+” symbol. Note that rainfall and irrigation were not considered uncertain in the model.
Figure 4A also shows that not all of the excess input water in the uninformed site (35 mm) was converted to evapotranspiration, whose median is 26 mm higher than in the informed site (340 vs. 314 mm). The smaller than expected difference in ET can be mainly explained by the informed site relying to water stored in the soil to support evapotranspiration, as apparent from the analysis of the water storage change, Δs, whose median is −32 mm in the informed site and −16 mm in the uninformed site, with no overlapping of the two uncertainty intervals. The remaining fraction of input water left the root zone via deep percolation; interestingly, the median value is larger in the informed site (85 vs. 75 mm). However, there is a certain overlap of the box plots for the two sites, suggesting that the difference in percolation is not significant.
In summary, the comparison between water budget terms in the two sites demonstrates that more irrigation water does not necessarily lead to an equivalent increase in crop evapotranspiration (and thus yield, see following section 3.4).
3.4. Productivity
An analysis that is limited to the water balance terms, albeit useful to stress that irrigation water can be used more efficiently, has little meaning if not combined with yield data. Based on the harvest data reported in Table 4, the crop yields of the informed and uninformed sites were 18250 and 18500 kg ha−1, i.e., a very small difference of about 1%, while irrigation water applied to the informed site was 21.7% less than in the uninformed site. Applying Equations (2) and (3), the total water productivity and irrigation water productivity resulted in median values of 49.7 (informed site) vs. 46.0 (uninformed site) kg ha−1 mm−1 and 194.1 (informed site) vs. 154.2 kg ha−1 mm−1 (uninformed site), respectively. The latter index, WPI, is strictly linked to the economic return of the crop, as irrigation represents one of the major costs of agricultural activities for farmers. Therefore, the resulting 26% increase of WPI in the informed site compared to the uninformed site suggests that significant economic savings can be achieved by farmers with a data-driven irrigation strategy without compromising productivity.
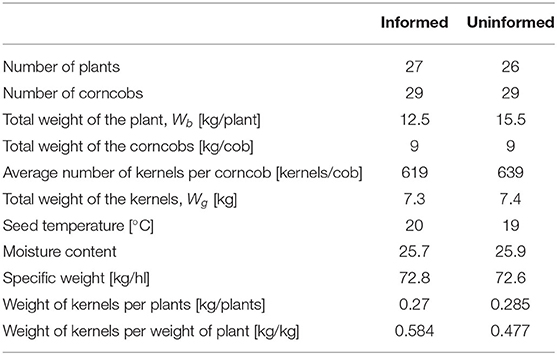
Table 4. Summary of yield data.
4. Discussion
In order to quantify the real possible saving, the cost of equipping the fields with TDR sensors and data logger must be taken into account. Here we carry out a simple cost-benefit analysis and then extrapolate the results at larger scales.
The cost associated to sprinkler irrigation is mainly related to the energy needed for conveying water from the withdrawal point to the field at the required minimum pressure and can be assumed equal to 5 EUR ha−1 mm−1, i.e., 0.5 EUR/m3 (Berruto et al., 2008). With a total field size of 10 ha, the irrigation cost difference between the informed and uninformed sites in the 2013 growing season was equal to (120–94) mm × 5 EUR ha−1 mm−1 = 130 EUR ha−1. To this, we must subtract the cost of installation and maintenance of the TDR probes, which can be reasonably quantified at 100 EUR per year for a 10 ha field like the one considered in this paper, i.e., 10 EUR ha−1. This would lead to 120 EUR ha−1 year−1 savings, i.e., about 20% less than the cost of irrigation in the uninformed site in the 2013 growing season. Were this technological improvement extended to all the crops owned by the farmer's company (about 100 ha in this case) the estimated economic benefit at the company level would be of the order of 12,000 EUR per year.
A note of caution is necessary at this point. We acknowledge that our study is case-specific, in the light of the fact that we only have data from one growing season and one study area. Therefore, upscaling our results to larger scales necessarily requires significant simplifications. In particular, large-scale economic evaluations of the advantages related to informed irrigation would need to account for several potential sources of spatial and temporal variability, such as soil type and texture, the maize type, the sowing period, and the rainfall variability. Moreover, the maize price, the irrigation water costs, the amount of maize-cropped land, irrigation water volumes and techniques could be characterized by important interannual variability, as a function of the market fluctuations and meteorological events. However, despite all these uncertainties, we speculate that the farm in the study site is representative, by size and economic value, of the typical farms in the Veneto Region. For this reason, well aware of the limitations implied by this exercise, we decided to perform a simple extrapolation also at the regional scale, which we believe would still provide a reasonable first-order estimate of the potential savings in the hypothetic scenario in which all the environmental conditions remained as in our study site.
In 2010, in the Veneto region, approximately 90,000 ha of land were used as irrigated maize crops, 75% of which were irrigated through sprinklers, for a total of 67,346 ha (Istituto Nazionale di Statistica, 2010). The total amount of irrigation water applied was 192.8×10⁶ m3 (Istituto Nazionale di Statistica, 2010), for a total cost of 96.4×10⁶ EUR. Upscaling our calculated savings to the entire Veneto region would thus lead to an estimated saving of more than 8 million EUR per year in irrigation water costs. To assess how this figure compares with profits, we should consider that, in 2010, the average maize yield in Veneto was about 10 tons per hectare, and the price of maize was about 160 EUR per ton. Assuming, as shown in this study, no significant change in field productivity due to reduced irrigation, the total amount of profit obtainable in Veneto from sprinkler-irrigated maize crops would thus be 10 tons/ha × 67,346 ha × 160 EUR/ton, i.e., almost 108 million EUR. In summary, water cost savings related to a more efficient data-driven irrigation strategy would amount to almost 8% of the total profits, considering also the costs associated to soil moisture monitoring.
We reiterate that our goal here is not to provide an accurate estimate of the possible savings at the regional scale, but rather to show that, potentially, an informed management of irrigation water can lead to economic and environmental advantages, also in view of the increasing competition between different water uses, e.g., food production, ecological functions of rivers, energy production, etc. Nevertheless, we suggest that a detailed regional study should be carried out to provide a more reliable evaluation of the economic benefits and the water savings implied by data-driven irrigation strategies of the type investigated in this study. The implications should be important not only at the regional level, but also from a global perspective. In fact, our study was carried out in a relatively water-rich region of Northeast Italy and we expect that the economic and environmental benefits of data-driven irrigation would be larger in regions with a drier climate, such as Southern Italy and other countries characterized by a Mediterranean climate.
5. Conclusions
An efficient management of irrigation water in agriculture will be more important than ever, in view of future predictions of increased demand in global food production and climate change effects. In this study, soil moisture in a maize field in the Veneto region (Northeastern Italy) was continuously monitored during the 2013 growing season by six time domain reflectometry (TDR) probes installed at two different locations and three different depths. In the first location, the uninformed site, irrigation was applied based on the farmer's experience, while in the second location, the informed site, the amount of water and application timing were decided based on the observed soil moisture data and a water balance scheme. A parsimonious soil moisture dynamics model was then implemented and calibrated against the available water content data. The model allowed us to estimate the relevant water budget terms (infiltration, evapotranspiration, deep percolation losses) in the two sites, showing that not all the excess irrigation water applied to the uninformed site was converted to evapotranspiration. Combined with maize yield data, we found that significant irrigation water savings are possible without compromising the crop productivity.
Despite being limited to one growing season and one experimental plot, our study demonstrates that significant economic and environmental advantages could be gained by applying efficient data-driven irrigation strategies also to widespread low-value crops such as maize and relatively water-rich regions like Northeast Italy. Of course, further research is needed to corroborate our results and we hope that this study will be just one of many going in this direction.
Finally, it is worth highlighting the added value of the integration between field data and a properly calibrated hydrological model. This integration represents a potentially significant advance over current practices provided by agricultural services companies that typically consider only observed soil moisture or at best make use of general purpose models not calibrated to the site. As an interesting future development, a one-dimensional Richards equation solver could be used to compare the water budget terms derived from a more physics-based model with the ones estimated in this study with a zero-dimensional vertically averaged approach.
Data Availability Statement
The raw data supporting the conclusions of this article will be made available by the authors, without undue reservation.
Author Contributions
MC: writing—original draft and validation. SG: writing—review and editing. MP and GB: conceptualization, investigation, and writing—review and editing. All authors contributed to the article and approved the submitted version.
Conflict of Interest
The authors declare that the research was conducted in the absence of any commercial or financial relationships that could be construed as a potential conflict of interest.
Acknowledgments
We gratefully acknowledge the contributions of former students Gianandrea Lorenzin and Elisa Negretto from the University of Padova, who collected data and ran preliminary simulations for the current study as part of their master's theses.
References
Albano, R., Manfreda, S., and Celano, G. (2017). MY SIRR: Minimalist agro-hYdrological model for Sustainable IRRigation management-Soil moisture and crop dynamics. SoftwareX 6, 107–117. doi: 10.1016/j.softx.2017.04.005
Allen, R. G., Pereira, L. S., Raes, D., and Smith, M. (1998). Crop Evapotranspiration - Guidelines for Computing Crop Water Requirements. Irrigation and drainage paper 56, FAO, Rome.
ARPAV (2005). Carta dei suoli del veneto. Technical report, Servizio Osservatorio Suoli e Rifiuti - Dipartimento Prov. di Treviso - Agenzia Regionale per la Prevenzione e Protezione Ambientale del Veneto.
Berruto, R., Busato, P., Ghiotti, G., Landorno, F., Sacco, D., Sanino, N., et al. (2008). Irrigare il Mais: Efficienza D'uso, Consumi Energetici, Risparmio Idrico. Schede di Assistenza tecnica. Quaderni della Regione Piemonte - Agricoltura, Supplemento al n. 62.
Bronswijk, J. (1988). Modeling of water balance, cracking and subsidence of clay soils. J. Hydrol. 97, 199–212. doi: 10.1016/0022-1694(88)90115-1
Clapp, R. B., and Hornberger, G. M. (1978). Empirical equations for some soil hydraulic properties. Water Resour. Res. 14, 601–604. doi: 10.1029/WR014i004p00601
Daccache, A., Knox, J., Weatherhead, E., Daneshkhah, A., and Hess, T. (2015). Implementing precision irrigation in a humid climate-Recent experiences and on-going challenges. Agric. Water Manage. 147, 135–143. doi: 10.1016/j.agwat.2014.05.018
Feddes, R. A., Kowalik, P. J., and Zaradny, H. (1978). Simulation of Field Water Use and Crop Yield. New York, NY: John Wiley Sons.
González Perea, R., Daccache, A., Rodriguez Diaz, J., Camacho Poyato, E., and Knox, J. (2018). Modelling impacts of precision irrigation on crop yield and in-field water management. Precis. Agric. 19, 497–512. doi: 10.1007/s11119-017-9535-4
Gupta, H. V., Kling, H., Yilmaz, K. K., and Martinez, G. F. (2009). Decomposition of the mean squared error and NSE performance criteria: Implications for improving hydrological modelling. J. Hydrol. 377, 80–91. doi: 10.1016/j.jhydrol.2009.08.003
Hedley, C., Yule, I., Tuohy, M., and Vogeler, I. (2009). Key performance indicators for simulated variable-rate irrigation of variable soils in humid regions. Trans. ASABE 52, 1575–1584. doi: 10.13031/2013.29146
Hupet, F., and Vanclooster, M. (2002). Intraseasonal dynamics of soil moisture variability within a small agricultural maize cropped field. J. Hydrol. 261, 86–101. doi: 10.1016/S0022-1694(02)00016-1
Istituto Nazionale di Statistica (2010). 6° Censimento Generale dell'agricoltura 2010- Caratteristiche Strutturali delle Aziende Agricole. Technical report, Istat, Roma.
Laio, F., Porporato, A., Ridolfi, L., and Rodriguez-Iturbe, I. (2001). Plants in water-controlled ecosystems: active role in hydrologie processes and responce to water stress II. Probabilistic soil moisture dynamics. Adv. Water Resour. 24, 707–723. doi: 10.1016/S0309-1708(01)00005-7
Létourneau, G., Caron, J., Anderson, L., and Cormier, J. (2015). Matric potential-based irrigation management of field-grown strawberry: effects on yield and water use efficiency. Agric. Water Manage. 161, 102–113. doi: 10.1016/j.agwat.2015.07.005
Milly, P. C. D. (2001). A minimalist probabilistic description of root zone soil water. Water Resour. Res. 37, 457–463. doi: 10.1029/2000WR900337
Muñoz-Carpena, R., Bryan, H., Klassen, W., and Dukes, M. D. (2003). Automatic soil moisture-based drip irrigation for improving tomato production. Proc. Florida State Hortic. Soc. 116, 80–85.
Pelletier, V., Gallichand, J., Gumiere, S., Pepin, S., and Caron, J. (2015). Water table control for increasing yield and saving water in cranberry production. Sustainability 7, 10602–10619. doi: 10.3390/su70810602
Porporato, A., D'Odorico, P., Laio, F., Ridolfi, L., and Rodriguez-Iturbe, I. (2002). Ecohydrology of water-controlled ecosystems. Adv. Water Resour. 25, 1335–1348. doi: 10.1016/S0309-1708(02)00058-1
Porporato, A., Feng, X., Manzoni, S., Mau, Y., Parolari, A. J., and Vico, G. (2015). Ecohydrological modeling in agroecosystems: examples and challenges. Water Resour. Res. 51, 5081–5099. doi: 10.1002/2015WR017289
Rallo, G., Minacapilli, M., Ciraolo, G., and Provenzano, G. (2014). Detecting crop water status in mature olive groves using vegetation spectral measurements. Biosyst. Eng. 128, 52–68. doi: 10.1016/j.biosystemseng.2014.08.012
Rekika, D., Caron, J., Rancourt, G. T., Lafond, J. A., Gumiere, S. J., Jenni, S., et al. (2014). Optimal irrigation for onion and celery production and spinach seed germination in histosols. Agron. J. 106, 981–994. doi: 10.2134/agronj2013.0235
Rodriguez-Iturbe, I., Porporato, A., Ridolfi, L., Isham, V., and Coxi, D. R. (1999). Probabilistic modelling of water balance at a point: the role of climate, soil and vegetation. Proc. R. Soc. Lond. Ser. A Math. Phys. Eng. Sci. 455, 3789–3805. doi: 10.1098/rspa.1999.0477
Schneider, F., and Don, A. (2019). Root-restricting layers in German agricultural soils. Part I: extent and cause. Plant Soil 442, 433–451. doi: 10.1007/s11104-019-04185-9
Settin, T., Botter, G., Rodriguez-Iturbe, I., and Rinaldo, A. (2007). Numerical studies on soil moisture distributions in heterogeneous catchments. Water Resour. Res. 43, W05425. doi: 10.1029/2006WR005737
Skierucha, W. (2000). Accuracy of soil moisture measurement by TDR technique. Int. Agrophys. 14, 417–426.
Topp, G., Davis, J., and Annan, A. (1980). Electromagnetic determination of soil water content: measurements in coaxial transmission lines. Water Resour. Res. 16, 574–582. doi: 10.1029/WR016i003p00574
Trost, B., Prochnow, A., Drastig, K., Meyer-Aurich, A., Ellmer, F., and Baumecker, M. (2013). Irrigation, soil organic carbon and N2O emissions. A review. Agron. Sustain. Dev. 33, 733–749. doi: 10.1007/s13593-013-0134-0
Vico, G., and Porporato, A. (2011). From rainfed agriculture to stress-avoidance irrigation: II. Sustainability, crop yield, and profitability. Adv. Water Resour. 34, 272–281. doi: 10.1016/j.advwatres.2010.11.011
Vrugt, J. A., ter Braak, C., Diks, C., Robinson, B. A., Hyman, J. M., and Higdon, D. (2009). Accelerating Markov chain Monte Carlo simulation by differential evolution with self-adaptive randomized subspace sampling. Int. J. Nonlinear Sci. Num. Simul. 10, 273–290. doi: 10.1515/IJNSNS.2009.10.3.273
World Water Assessment Programme (2009). The United Nations World Water Development Report 3: Water in a Changing World. Technical report, UNESCO, Paris.
Keywords: time domain reflectometry, hydrological modeling, Markov chain Monte Carlo, water balance, irrigation costs
Citation: Camporese M, Gumiere SJ, Putti M and Botter G (2021) Efficient Irrigation of Maize Through Soil Moisture Monitoring and Modeling. Front. Water 3:627551. doi: 10.3389/frwa.2021.627551
Received: 09 November 2020; Accepted: 25 February 2021;
Published: 24 March 2021.
Edited by:
Luca Brocca, National Research Council (CNR), ItalyReviewed by:
Hongxiang Yan, Pacific Northwest National Laboratory (DOE), United StatesAngelo Basile, National Research Council (CNR), Italy
Copyright © 2021 Camporese, Gumiere, Putti and Botter. This is an open-access article distributed under the terms of the Creative Commons Attribution License (CC BY). The use, distribution or reproduction in other forums is permitted, provided the original author(s) and the copyright owner(s) are credited and that the original publication in this journal is cited, in accordance with accepted academic practice. No use, distribution or reproduction is permitted which does not comply with these terms.
*Correspondence: Matteo Camporese, bWF0dGVvLmNhbXBvcmVzZUB1bmlwZC5pdA==