 Neal E. Blair1,2*
 Elmer Arthur Bettis III3
 Timothy R. Filley4
 Jessie A. Moravek5†
 A. N. Thanos Papanicolaou6‡
 Adam S. Ward7Christopher G. Wilson6Nina Zhou8†Breanna Kazmierczak1
 Jieun Kim1
- 1Department of Civil and Environmental Engineering, Northwestern University, Evanston, IL, United States
- 2Department of Earth and Planetary Sciences, Northwestern University, Evanston, IL, United States
- 3Earth and Environmental Sciences, The University of Iowa, Iowa City, IA, United States
- 4Department of Earth, Atmospheric, and Planetary Sciences, Purdue University, West Lafayette, IN, United States
- 5The Environmental Sciences Program, Northwestern University, Evanston, IL, United States
- 6Department of Civil and Environmental Engineering, University of Tennessee, Knoxville, Knoxville, TN, United States
- 7O'Neill School of Public and Environmental Affairs, Indiana University, Bloomington, IN, United States
- 8Biological Sciences, Northwestern University, Evanston, IL, United States
Streams and rivers integrate and transport particulate organic carbon (POC) from an array of aquatic and terrestrial sources. Storm events greatly accelerate the transport of POC. The sequences by which individual POC inputs are mobilized and transported are not well-documented but are predicted to be temporally transient and spatially dependent because of changes in forcing functions, such as precipitation, discharge, and watershed morphology. In this study, the 3rd−4th order agricultural stream network, Clear Creek in Iowa, U.S.A., was sampled at a nested series of stations through storm events to determine how suspended POC changes over time and with distance downstream. Carbon and nitrogen stable isotope ratios were used to identify changes in POC. A temporal sequence of inputs was identified: in-channel algal production prior to heavy precipitation, row crop surface soils mobilized during peak precipitation, and material associated with the peak hydrograph that is hypothesized to be an integrated product from upstream. Tile drains delivered relatively 13C- and 15N-depleted particulate organic carbon that is a small contribution to the total POC inventory in the return to baseflow. The storm POC signal evolved with passage downstream, the principal transformation being the diminution of the early flush surface soil peak in response to a loss of connectivity between the hillslope and channel. Bank erosion is hypothesized to become increasingly important as the signal propagates downstream. The longitudinal evolution of the POC signal has implications for C-budgets associated with soil erosion and for interpreting the organic geochemical sedimentary record.
Introduction
Substantial loss of soil organic carbon (SOC) results from land use associated with agriculture and deforestation (Lal, 2009; Amundson et al., 2015). Initial perceptions were that the loss represented a major net source of CO2 to the atmosphere (Lal, 2003). Instead, the loss may be part of a landscape-wide sink when C-budgets are broadened to include material that is transported away from the original source, and the reloading of newly exposed C-poor particle surfaces with fresh organic C (Harden et al., 1999; Berhe et al., 2007; Aufdenkampe et al., 2011; Papanicolaou et al., 2015; Doetterl et al., 2016; Wang et al., 2017). Most relevant studies have focused on the landscape itself and its response to the erosion of surface soils. However, waterways provide connectivity between many terrestrial C sources and their eventual sinks. As a result, C-transport within the river corridor may be a critical control in determining whether anthropogenic land use becomes a net source or sink of atmospheric CO2.
Rivers and their tributaries have been portrayed in descriptions of the C-cycle as both reactors that foster in-channel primary and secondary production, and pipes that transport material (Cole et al., 2007; Bouillon et al., 2009; Raymond et al., 2016). Combined, these two functions produce the biogeochemical spiraling of biogenic elements, including carbon (Newbold et al., 1982; Richey et al., 1990). Rivers also integrate diverse forms of organic C (OC) from in-channel production and the adjacent landscape, and then deliver that mixture to downstream depocenters and ecosystems, such as floodplains, lakes, and the ocean (Blair and Aller, 2012; Wohl, 2017). Particulate OC specifically has been shown to be a mixture of materials with a broad range of ages derived from its sources. Insofar as age often influences reactivity (Blair and Aller, 2012), the downstream fate of POC in terms of whether it is likely to be remineralized to CO2 or sequestered in depocenters is dependent on integrated mixture composition.
It follows that POC composition changes as it moves downstream because of its interactions with the river corridor. The degree of change per distance traveled, or even the factors that might control that metric, are poorly documented due to a paucity of longitudinal studies. The extent of change is most profound in large watersheds (Hedges et al., 2000; Blair et al., 2004; Aufdenkampe et al., 2007; Leithold et al., 2016). Given sufficient transit and storage time, upland POC can be completely lost to oxidation within river corridor soils and replaced by lower reach primary and secondary production (Bouchez et al., 2010; Blair and Aller, 2012). In contrast, the replacement of upland POC is incomplete in many small, mountainous river systems because of the limited interaction of sediment with the lower reaches of the watershed (Hilton et al., 2011; Galy et al., 2015; Leithold et al., 2016). The upland POC is overprinted by lowland sources but not replaced.
Low temporal-resolution measurements of riverine POC further limit our understanding of the POC transformations (Hope et al., 1994; Galy et al., 2015; Yang et al., 2016; Li et al., 2017). Large storm events in small systems transport significant quantities of sediment and POC within hours to a few days (Dalzell et al., 2005; Jeong et al., 2012; Jung et al., 2012; Gellis, 2013; Rowland et al., 2017). Storms may be responsible for up to 80% of riverine POC transport (Oeurng et al., 2011; Dhillon and Inamdar, 2013, 2014). Temporal resolution on the scale of hours is required for measurements in such situations to capture intra-event changes in POC fluxes and composition. For instance, studies of dissolved OC (DOC) have indicated compositional changes on an hourly time scale during storm events in which aliphatic-rich materials were present at the storm onset and aromatic OC was more prevalent at peak discharge (Wagner et al., 2019). Comparable behavior might occur with POC. Only a small number of high-resolution POC studies that include compositional information exist for either steep-sloped mountainous systems (Jeong et al., 2012; Jung et al., 2012) or lower-gradient settings (Dalzell et al., 2005, 2007; Rowland et al., 2017; Blair et al., 2018; Kim et al., 2020).
Given the combined spatial and temporal limitations of datasets, we are unable to predict in detail how the composition of fluvial POC might evolve in most watersheds as a function of time in response to a storm event or how any response might vary with travel downstream. At the very least, this poses a challenge when designing sampling protocols. More importantly though, it severely limits our ability to interpret the storm pulse compositional “signal” as it moves through the system. A proposed conceptual model based on a storm event in the agricultural stream network of Clear Creek (Iowa, U.S.A.) suggests that a time-resolved sequence of inputs can occur (Kim et al., 2020). The sequence starts with easily suspended in-channel debris including algal material, transitions to surface soils delivered by heavy precipitation, and then culminates with an integrated mixture of sources transported with the rise and fall of the hydrograph. In this study we evaluate the conceptual model over multiple storm events to determine if it is a robust description of POC behavior in the same watershed. The longitudinal behavior is of particular interest because it offers a perspective on how environmental signals are propagated and modified within a watershed (Romans et al., 2016). The results may thus direct future studies concerning the fate of the exported POC.
Clear Creek contributes to the Upper Mississippi River watershed and is part of the U.S. National Science Foundation's Intensively Managed Landscapes Critical Zone Observatory (IML-CZO; Kumar et al., 2018). As such, it is well-poised as an outdoor laboratory to investigate agriculturally induced surface soil erosion (Wilson et al., 2018). Most of the erosion research, which includes both field and modeling studies, has focused on the upland reach where connectivity between hillslopes and the stream channel is high (Wilson et al., 2012; Papanicolaou et al., 2015). We hypothesize the relative importance of surface soil erosion as a direct POC input decreases in the lower reaches due to the interception of eroded materials by lower gradient portions of the landscape adjacent to the Clear Creek channel. To test that hypothesis and the conceptual model described above, suspended sediment samples were collected through storm events at three stations located in the upper, middle and lower reaches of the watershed. Changes in POC composition were monitored using stable isotope (13C/12C, 15N/14N) ratios. Those measurements were chosen because of their well-demonstrated utility as source indicators (Fry and Sherr, 1984) and small sample size requirements. They also allow direct comparison to previously published elemental and isotopic data from Clear Creek soils that are potential sources of POC (Hou et al., 2018). In addition, tile drains, a ubiquitous hydrologic control and dissolved nutrient transporter in flat agricultural settings (Skaggs et al., 1994), were investigated as a previously unexplored source of POC.
Methods
Site Description
The 270-km2 Clear Creek watershed (Figure 1; Table 1; HUC-10: 0708020904) is in the agriculturally productive loess-mantled Southern Iowa Drift Plain, where the soils rapidly erode when disturbed (Ruhe, 1969; Prior, 1991). Approximately 75% of the annual precipitation (average ~890 mm/year) occurs during the growing season (Wacha et al., 2018). Intense storms at the beginning of the growing season can produce flash floods because of the bare surfaces in the row crop fields and channelization of the stream (Wilson et al., 2012). Erosion rates in Clear Creek fields are high, averaging 20 Mt/ha/yr in some cases (Abaci and Papanicolaou, 2009; Wilson et al., 2016; Wacha et al., 2018). Erosion has been attenuated by the adoption of soil conservation practices in the 1990's (Abaci and Papanicolaou, 2009; Papanicolaou et al., 2015). These include rotations of corn (Zea mays L.)—soybean (Glycine max L.) crops and no-till, spring shallow-till, and fall deep-till practices. Grassed and forested riparian buffers are often present but range in widths up to 10's of meters.
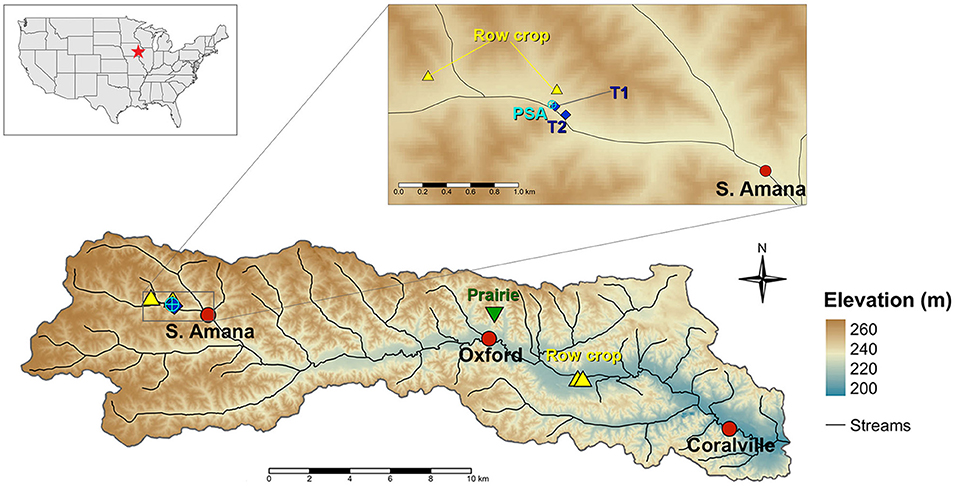
Figure 1. Location of Clear Creek watershed in Iowa, U.S.A. Stream sampling stations are denoted by red circles. Tile drains (T1 and T2) and the alluvial soil core (PSA) are blue symbols. Row crop (yellow triangle) and Prairie (green inverted triangle) are sampling locations for surface soils reported in Hou et al. (2018).
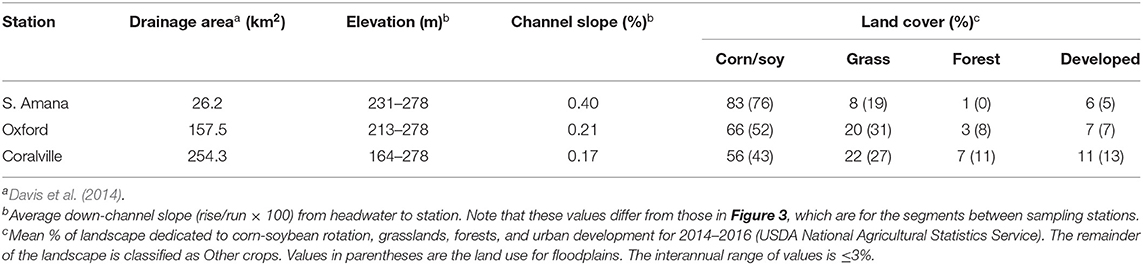
Table 1. Characteristics of Clear Creek subbasins.
Soils in the Clear Creek watershed are silty clay to silt loam Mollisols and Alfisols (Hou et al., 2018; Wilson et al., 2018). Conventionally tilled surface soils have SOC contents of ~2 wt% and C/N (wt) ratios of ~10. In contrast, restored prairie site soils had nearly double the SOC content with similar (~11) C/N ratios (Hou et al., 2018). 13C/12C ratios reflected the presence or absence of contributions from corn, a C4 plant that expresses an enrichment in 13C (O'Leary, 1981). As a result, tilled row crop soils were significantly enriched in 13C relative to those from the restored prairie (Figure 2; Hou et al., 2018) thereby providing a potential indicator of row crop soil input to Clear Creek. The row crop soils were also enriched in 15N, a potential reflection of fertilizer use, and offering another source tracer.
Figure 2. POC δ13C vs. PN δ15N for suspended sediments from all events, stations and tile drains, as well as the alluvial soil core. Surface soil ranges are from local row crop fields and restored prairies (Hou et al., 2018). The algal data shown are measurements from suspended sediment filter samples in which algal mat fragments appeared to dominate the organic material.
Three stream sites were sampled to capture material exported from the upper, middle and lower reaches (Figure 1; described also by Davis et al., 2014). The upper reach stream site near South Amana has been studied previously in terms of sediment/ POC sources and delivery processes (Wilson et al., 2012; Papanicolaou et al., 2015; Abban et al., 2016; Hou et al., 2018). The middle site is co-located with the U.S. Geological Survey gaging station near Oxford, IA (#05454220) and the lower reach is located near the USGS stream gage (#05454300) in Coralville. The valley cross-section at South Amana is V-shaped (Figure 3). The valley cross-sections at Oxford and Coralville are more U- or box-shaped (Yan et al., 2018).
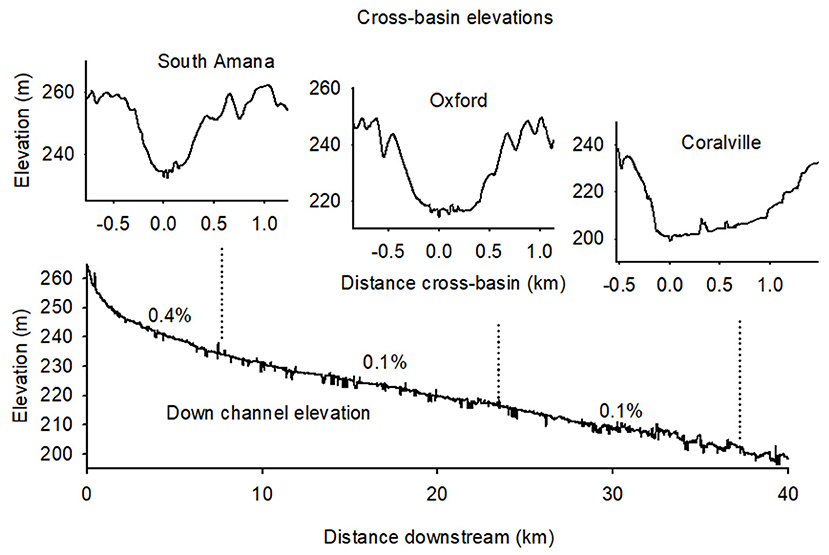
Figure 3. Valley cross-sections at sampling stations (top) and mid-channel elevations as a function of distance from headwaters (bottom). The V-shaped cross-basin profile of the upper reach near Oxford permits a more effective transfer of material from hillslope to channel relative to the box-shape of the lower reach. The percent values on the lower graph are the elevational gradients between the headwaters and South Amana, South Amana–Oxford, and Oxford-Coralville.
Though corn-soybean fields dominate the landscape overall (~56%), their greatest concentration is in the upper reach (Table 1). The average slope of the upper reach is ~6%, which enhances surface runoff and erosion, thereby providing significant connectivity between sediment sources and the channel (Abaci and Papanicolaou, 2009; Abban et al., 2016). The channel banks are a secondary source of sediment especially where the stream has been channelized (Sutarto et al., 2014; Papanicolaou et al., 2017). Channel bank erosion becomes proportionately more important downstream. The middle reach is a transition zone where either surface or bank sources can dominate depending on conditions (Abban et al., 2016). Channels are wider and deeper in this reach (Wacha et al., 2018; Figure 3) and land cover shifts to more grassland and forest (Table 1). The urban areas, while small (7%), are more concentrated in the lower portion of the watershed. Bank erosion is more prevalent in this zone where the banks are higher and steeper, high flows are more sustained, and contributions from surface erosion are minimal due to more impervious surfaces (Papanicolaou et al., 2017).
Sample Collection
Suspended sediment samples were collected shortly before, during and after storm events (Table 2; Figure 4) using ISCO™ autosamplers equipped with 1-liter bottles. The sampling lines for the in-stream samplers were fixed in the water column and were co-located with water quality monitoring equipment deployed by the Iowa Flood Center. For the tile drain samples, the tubing was affixed to the inside of the tile drain along the bottom of the pipe to sample effluent when water was flowing through the tile. The autosamplers were programmed to collect samples at fixed time intervals, typically every 3 h. The sampling interval was chosen to define the storm peak at the three locations simultaneously while allowing a feasible sample load. For each sample, the autosampler triple-rinsed the sampling line with stream water immediately prior to collection of each sample, then an 800-mL sample was pumped into an open 1-L Nalgene bottle. The sample bottles were capped and frozen immediately after the hydrograph recession.

Table 2. Storm events sampled.
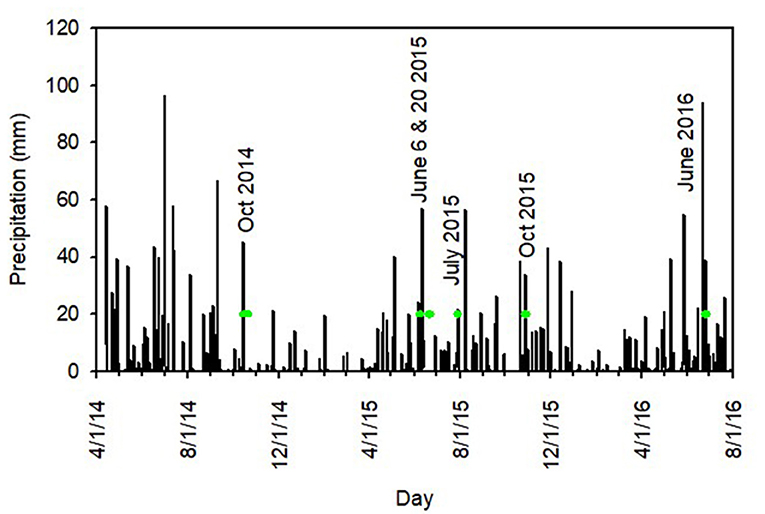
Figure 4. Daily precipitation at Coralville (NOAA NCDC Network GHCND: station US1IAJH0010) for the 2014–2016 period. Horizontal bars are sampling periods in this study.
In addition to in-stream sampling, two tile drains (T1, T2) were located on a farm upstream of the South Amana station (Figure 1). Both tile drains were slot-perforated ABS tubing with 8-inch diameter PVC outlets. The slots were ¼″ × 1″ (w × l) spaced 4–6 in number around the diameter and ~1 inch apart along the length of the tubing.
An intact, 7.6 cm diameter × 2.3 m long soil core (PSA-1) was collected as part of a hillslope erosion study using a Giddings™ coring machine (Yan et al., 2019). The core was at the base of the hillslope ~15 m from the channel within the South Amana subbasin thus it provides an example of the type of material that is exposed by erosion as the channel meanders (Figure 1). The core penetrated into the B soil horizon of a preserved pre-settlement soil profile buried beneath post-settlement alluvial material (Yan et al., 2019). The core was first wrapped in plastic wrap, then aluminum foil, and placed in a cardboard soil core box to preserve integrity and moisture content, then transported to the lab for description and analysis. Air-dried core samples collected in 4–5 cm intervals were lightly crushed with a mortar and pestle to pass through a 1 mm-mesh sieve where roots, stones, and large particulate matter were removed. A subsample was then ground into fine powder using a steel ball mill (Retsch Inc., Haan, Germany).
Water Discharge and Precipitation
Water discharge for the sampling periods at South Amana was determined from a stage-discharge rating curve. Continuous stage measurements at 15-min intervals were collected with a Global Water WL16 Data Logger. The pressure transducer has a ± 0.1% of full scale accuracy at constant temperature and a ± 0.2% accuracy over 1.7 to 21.1°C temperature range. To minimize the effects of waves and water current on the measurements, the pressure transducer was installed within a stilling well. Flow velocity was measured with an Acoustic Doppler Velocimeter FlowTracker by Sontek every 30 cm along the channel width. The FlowTracker has a velocity range ±0.001–5 m/s and an accuracy ±1% of the measured velocity. During the measurements no bedforms (e.g., dunes) were present that could affect stage estimation as the bed remained near-flat during the development of the curve with minimal effects in changes in Manning's n roughness value. The developed stage–discharge relationship for the South Amana outlet was:
where the units of discharge and stage are m3/s and m, respectively (Abaci and Papanicolaou, 2009). Stream discharge at the Oxford and Coralville stations was retrieved from the USGS website (https://waterdata.usgs.gov/ia/nwis/).
The spatial distribution of daily averaged precipitation for the storm events were derived from quality-controlled, multi-sensor (radar and rain gauge) precipitation estimates obtained from National Weather Service River Forecast Centers (https://water.weather.gov/precip/). The U.S. continental precipitation maps were downloaded and georeferenced in ArcGIS Pro software (version 2.5.1), after which they were clipped to the subbasin areas. Daily precipitation was integrated in each subbasin for each sampling day.
Daily precipitation records for the 2014–2016 period were obtained for Coralville from the NOAA National Centers for Environmental Information (https://www.ncdc.noaa.gov/cdo-web/datasets#GHCND). Hourly precipitation rates for nearby Iowa City (~6 km SE of Coralville) were obtained from the Iowa State University Iowa Environmental Mesonet (https://mesonet.agron.iastate.edu/).
POC, PN Concentrations, Fluxes, and Stable Isotope Measurements
Particulate organic C and particulate total N concentrations (mass/water volume) were estimated by first measuring suspended sediment concentrations and then determining the %C and %N on a dry weight basis of the sediment. Water samples were thawed shortly before being filtered on pre-weighed 47 mm o.d. glass fiber filters (0.7 micron nominal pore size, Millipore™). Filters were cleaned before use by roasting at 500°C overnight to remove trace organic matter. Filters and sediment were lyophilized and then weighed. The weights in combination with the measured volumes of filtered water were used to determine sediment concentrations.
The sediment on the filters was fumigated with gaseous HCl for 1–4 days to remove carbonate C. Carbonate removal was verified via transflectance FTIR (Cui et al., 2016) using a Bruker Tensor 37 FTIR [NIR/MIR] equipped with a Hyperion microscope and MCT detectors and monitoring an absorbance peak at 2513 cm−1. Sediment was either analyzed directly on the glass fiber filters, or a small aliquot of the powdered sediment was spread on Aluminum weighing boats. The soil core samples were similarly fumigated with HCl using the method described by Harris et al. (2001).
Decarbonated sediment samples were analyzed for POC and PN contents, as well as their 13C/12C and 15N/14N ratios using a Costech Elemental Analyzer-Conflo IV interface-Thermo Delta V Plus isotope ratio mass spectrometer (IRMS) combination. This includes those filter samples identified as having captured algal mat fragments. The PSA-1 soil core organic C, PN, and δ13C and δ15N stable isotope values were measured using a Sercon Ltd. (Crewe, UK) flash combustion elemental analyzer interfaced to Sercon Ltd. 20/22 IRMS. Isotopic compositions were related to international standards (VPDB, air) through calibrated laboratory reference materials (Coplen, 2011; Leithold et al., 2013) and reported using the δ13C and δ15N notations (Craig, 1953). Analytical precision of δ13C and δ15N values of the laboratory working standards of NIST 1547 Peach Leaves (NIST, Gaithersburg, MD) and LECO #502-062 soil (ISO Guide 34:2009) was <0.2%0.
POC fluxes at each station were estimated via
The total quantity of POC (kg C) that passed the sampling stations was determined by integrating the flux as a function of time over the duration of the sampling period. The integrated quantity of early flush C (see section The POC Components of Storm Responses) was estimated by considering only the time period in which that peak appeared. The δ13C and δ15N values of the exported material were calculated via the integration of flux-weighted isotopic signatures over time normalized to the total integrated flux,
where δint is the flux-weighted integrated isotopic signature. Fluxt and δt are the POC flux and isotopic composition at time t.
Results
Precipitation Patterns
Six storm events were captured between October 2014 and June 2016 (Table 2; Supplementary Table 1; Figure 4). The storms were small-to-intermediate in size with precipitation quantities of 28–59 mm (Figure 4). June-July storms fell within a cluster of events that were separated by days to several weeks. The October events were preceded by a much drier period 1–2 months long, depending on the year. These observations are consistent with the general pattern of wet springs (June average precipitation ~120 mm) and drier falls (October mean ~75 mm, National Weather Service). In most cases, the precipitation occurred over a 1–2 day period (Figure 4).
The spatial coverage of precipitation varied among the events (Figure 5). Coverage was relatively uniform (±10 mm) across the watershed in June 2015 and Oct 2015. Precipitation was heavier in the South Amana subbasin (peak precipitation 57 ± 7 mm) than Coralville (32 ± 7 mm; Figure 5) during the July 2015 storm. In contrast, the heaviest downfall bypassed South Amana (9.6 ± 3 mm) and fell on Coralville (32 ± 7 mm) in June 2016. The remaining events had patterns that bridged the extremes (Figure 5).
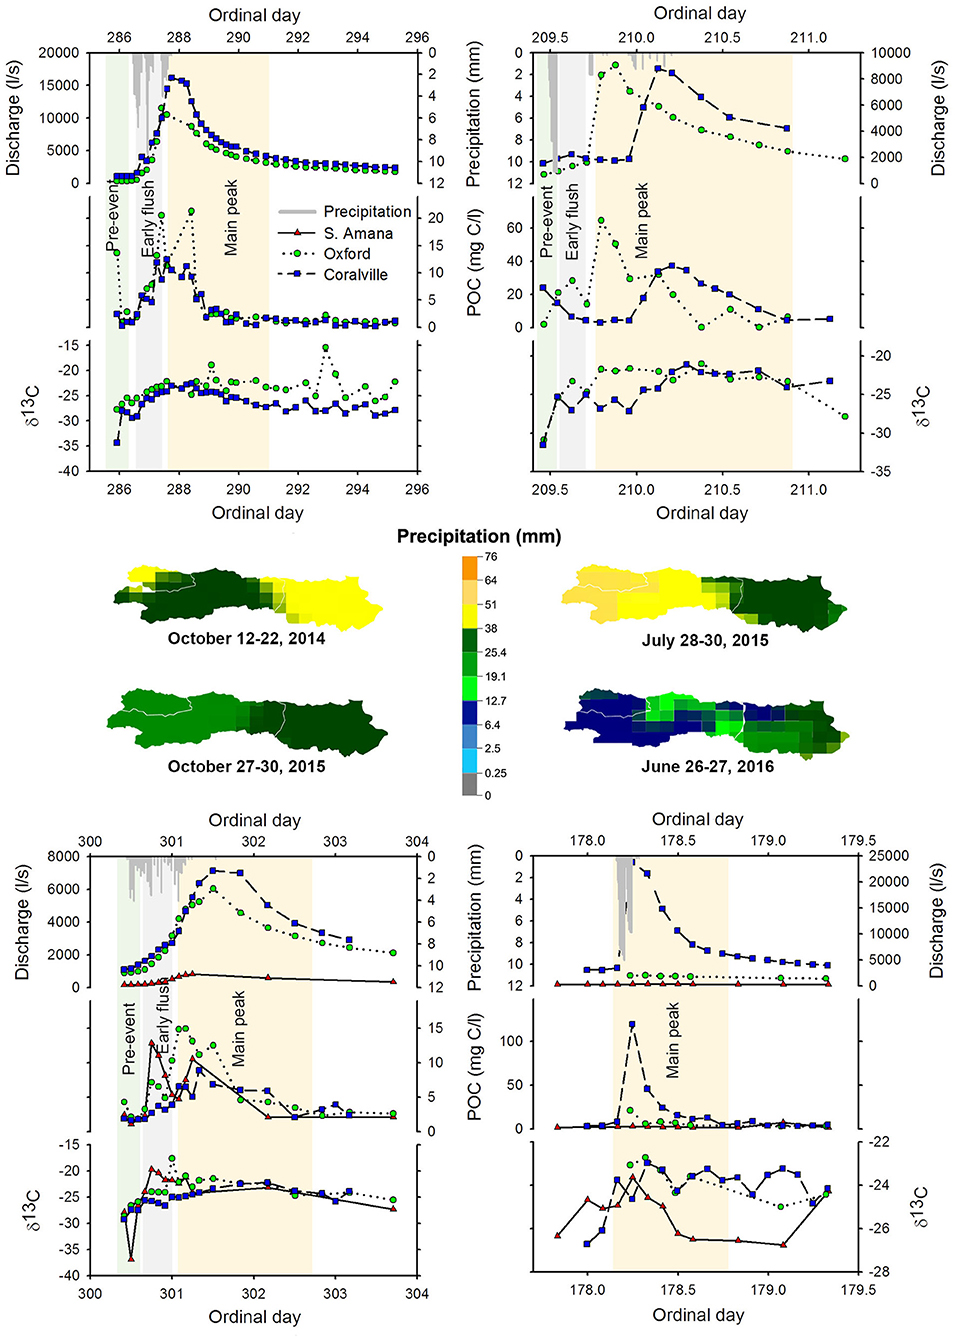
Figure 5. Time series data for storm events at South Amana ( ), Oxford (
 ), and Coralville (
 ). Data shown include precipitation in millimeters at Coralville (gray bars), discharge (liters/s), POC (mg C/liter), and POC δ13C. The three phases of POC input (pre-event, early sediment flush, and main peak) are highlighted. Watershed maps depict the spatial coverage of precipitation for the day recording the heaviest rainfall in each event.
Sediment Character and Concentrations
ISCO deployments were done only at Oxford and Coralville in Oct 2014. In 2015–2016, some stations or samples are missing due to equipment failure. The event in October 2015 offers the most complete view of Clear Creek behavior because all stations were in operation throughout the storm. The June 2016 storm yielded the second-best sample coverage, though the beginning of the event was missed at the Oxford station.
Based on visual inspection, sediment color and texture changed throughout events at the three sites. Early sediment tended to be light brown colored, silty in texture, and disaggregated. As discharge increased and sediment concentrations peaked, the sediment transitioned to darker colored, mm-sized fluffy aggregates that were stable to vigorous shaking. Suspended load returned to a lighter colored, siltier material after the sediment concentration peaked. Plant debris, algal mat fragments, and insects were found in some samples. The algal material was the most obvious visually in the pre-storm samples from October.
For the most part, suspended sediment concentrations increased with discharge, which was below flood stage in all cases. In some events, sediment concentrations peaked before water discharge (Supplementary Table 1; Oct 2014, July 2015, Oct 2015). Multiple peaks in sediment concentration were often evident within one storm event.
The concentrations of sediment in the tile drain effluent were typically low (~0.05–0.15 g/l) with occasional spikes (~0.25 g/l; Supplementary Table 1). The spikes in concentration were attributed to run-off into surface inlets.
POC Concentrations, Isotopic Compositions, and Fluxes
POC concentrations in the channel typically paralleled those of the sediment, as expected given the dependence of the POC concentration on that of the sediment (Figure 5, Supplementary Table 1). However, small pre-event peaks (2.4–24 mg C/l) occurred in three events (Oct 2014, 2015, July 2015) when there was little or no measured increase in sediment. The elevated POC was due to higher %C values (2.6–12.9%) at those times (Supplementary Table 1), which was ascribed to algal material in the stream (see section The POC Components of Storm Responses). Tile drain sediment had low %C (<2%), though occasional spikes (3–11%) were observed (Supplementary Table 1). POC/PN (C/N) ratios were soil-like (6–18, Hedges and Oades, 1997). Higher values (>12) in C/N during an event are thought to result from the inclusion of plant debris which can have values of 25–400 (Hedges and Oades, 1997; Supplementary Table 1).
The cultivation of the C4 plant, corn, provides a sharp contrast in δ13C (~-10 to −13%0) relative to more ubiquitous C3 plants (~-25 to −35; O'Leary, 1981; Farquhar, 1983). Not surprisingly, POC δ13C values ranged between purely C3 values and those of mixtures of C3–C4 sources (−15 to −23%0; Figures 2, 5). A consistent 13C-enrichment occurs on the rising limb of the hydrograph (Figure 5). Similar 13C-enrichments have been observed in the Sangamon River (Illinois) and the Schwabach River (Germany) and like Iowa, these results were attributed to corn cultivation (Lee et al., 2017; Blair et al., 2018).
The PSA-1 core samples had δ13C values that ranged from ~-18 to ~-25%0 reflecting variable mixes of C3 and C4 plant material (Figure 2). The organic material at this site is the product of erosional inputs from upslope, inputs from colonizing vegetation (i.e., new soil formation on the alluvial-colluvial deposition), and diagenetic alteration of those inputs (Yan et al., 2019). The isotopic variability indicates changes in the mixtures of plant sources and presumably land use over time. Of most relevance to this study, the wide range of values demonstrates the potential variability in isotopic signatures associated with erosion of alluvial deposits as they are exposed by channel migration.
δ15N values of stream PN were typically positive (+1–9%0, Figure 2) and within the range for many soils (Amundson et al., 2003; Fox and Papanicolaou, 2007; Abban et al., 2016; Hou et al., 2018). The PSA-1 core δ15N values were in the nearly identical range. Row crop soils, the alluvial core, and the algal samples were distinctly 15N-enriched relative to the prairie soils (Figure 2). The 15N-enriched sources share the characteristic that their N is likely derived from applied fertilizers, whereas the prairie N would be far less so. The common interpretation of the 15N-enrichment in soils is that denitrification selectively converts 14N-nitrate to N2 thereby concentrating the 15N in the soil pool (Amundson et al., 2003).
Tile drains exported a wide range of δ13C and δ15N values (Figure 2). The few values near those of the row crops are interpreted to reflect surface run-off that entered the drains via their surface inlets. The bulk of the samples were depleted in 13C and 15N relative to the stream suspended sediments and the agriculturally dominated sources. The potential origin of the isotopic ratios is discussed later.
POC export from the subbasins varied in response to subbasin area and local rain fall amounts (Table 3, Figure 6). The 8- to 9-fold higher POC export at Oxford relative to South Amana is commensurate with the 6-fold increase in subbasin area. In contrast, a small decrease (2–17%) was observed between Oxford and Coralville in three of four storm events. It is not clear if these small differences rise above the uncertainty of the estimates, but if they do, they signal a loss of POC between the two stations. The deposition of coarse-grained sediment is one potential mechanism. What can be concluded is that the ~38% increase in subbasin area between Oxford and Coralville does not lead to a similar net increase in POC flux. This is a potential indicator of the lower erodibility of the landscape in the lowest reach.
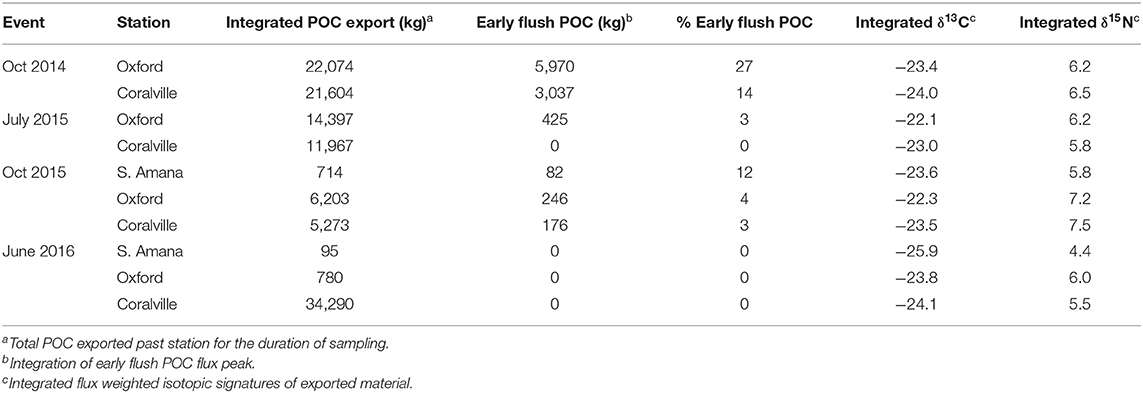
Table 3. Integrated POC export and isotopic signatures.
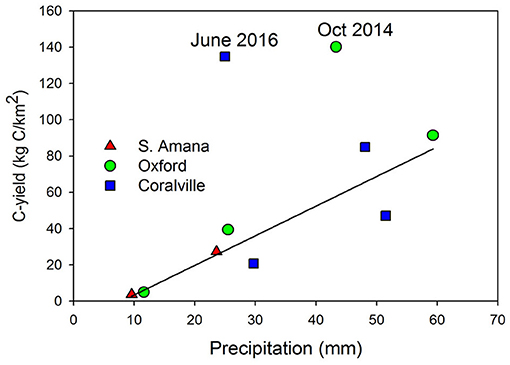
Figure 6. POC yield as a function of precipitation quantity for the three subbasins. Regression excludes the June 2016 (Coralville) and Oct 2014 (Oxford) data points.
The exported δ13C and δ15N values were −25.9 to −22.1 and 4.4–7.5%0, respectively. As discussed previously, the isotopic compositions reflect mixtures of corn and C3 vegetation, as well as soils that have experienced varying degrees of fertilizer application and/or denitrification.
X-Q Relationships
Concentration-discharge (C-Q) relationships result from a balance of supply, reaction, transport and dilution of solutes and particulates (Rose et al., 2018). Hysteresis in the C-Q trajectory is common as the result of changing balances between material inputs and losses over the course of storm events. The POC concentration- and δ13C -discharge relationships (X-Q) in this study, which we believe are the first of their kind to be reported, exhibited a range of hysteresis patterns (e.g., clockwise, counterclockwise; Gellis, 2013; Rose et al., 2018) over the different events (Table 4). POC-Q trajectories were predominantly clockwise and paralleled those displayed by sediment (not shown). δ13C-Q trajectories in contrast were more variable, and as will be discussed later, likely reflect variations in the arrival times of different POC sources.
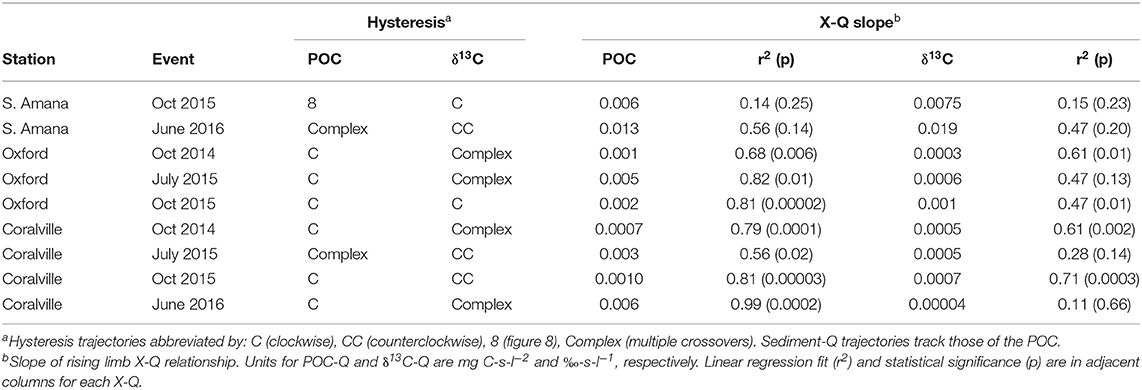
Table 4. X-Q relationships.
To better understand the timing of POC inputs, we focused on the rising limb of the hydrograph, reasoning that the effects of POC supply (as opposed to loss or dilution) would be most obvious for particulates during that period (Rose et al., 2018). The rising limb POC concentration- and δ13C -discharge relationships were parameterized by their slopes obtained from linear regressions. In some situations, and especially at South Amana, linear correlations were poor or non-existent (Table 4). POC concentration-Q slopes were statistically significantly for the lower reaches and ranged from 0.0007 to 0.005 mg C-s-l−2. The lower reach δ13C-Q slopes were 0.00004–0.0017%0-s-l−1 with a mixture of statistically significant and insignificant values (Table 4). X-Q regression values varied among events at individual stations (Table 4) and POC-Q slopes appeared to decrease with distance downstream (Table 4, Figure 7).
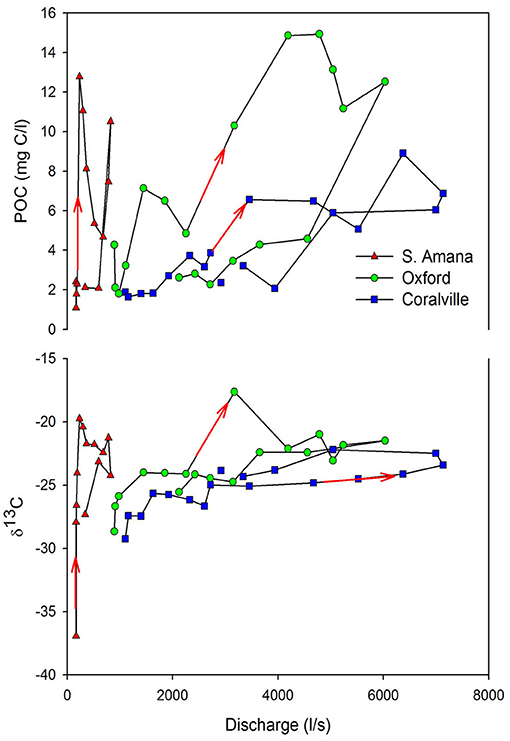
Figure 7. POC concentration (top) and POC δ13C (bottom) as functions of water discharge for the October 2015 event at the sampling stations. The arrows show the direction of the rising limb. The hysteresis is clockwise in all cases in this example except for the POC δ13C at the Coralville (CCC) lower reach location.
Discussion
Inter-storm Variability
No two storm responses were identical in terms of POC temporal or spatial behavior. Multiple factors likely contribute to the variability. Antecedent precipitation and management cycles are two factors known to influence solute and particulate fluxes (Wilson et al., 2012; Davis et al., 2014). Our sampling falls into two general categories in that regard—the wet late spring/early summer following planting and the dry fall seasons following harvest (Figure 4). Agricultural field run-off is expected to be more prevalent in the drier fall and in post-harvest fields (Abaci and Papanicolaou, 2009) and evidence is seen for this in Oct 2014 and 2015 when prominent early flush POC peaks attributed to surface erosion occurred (section The POC Components of Storm Responses). Note though that our sampling was less complete in the June-July events thus we can only argue that our results are consistent with the hypothesis that the antecedent conditions have an impact on POC export.
Several end-member scenarios in storm trajectory generated specific responses. When rainfall covers the watershed approximately evenly, the main POC peaks associated with the rise and fall of the hydrograph are nearly contemporaneous with each other at each station because of the small size of the basin (Figure 5). This did not happen in July 2015 when the water discharge and POC peaks arrived at Coralville ~4–5 h after passage in Oxford. In this situation precipitation was heavier in the upper reach (51–64 mm) relative to near Coralville (25–38 mm). It is hypothesized that local inputs in the lower portion of the watershed were muted and that the upland-generated response that traveled downstream dominated the signal at Coralville. In contrast, the lower portion of the watershed received the heaviest rainfall in June 2016. The response in this situation was small POC peaks at South Amana and Oxford, and a much larger POC peak at Coralville. In this case, the upland source was attenuated relative to the local inputs near Coralville. These scenarios aptly illustrate an obvious but important point when understanding the POC composition at a specific time and place—the POC is a mixture of material locally and distally sourced in varying proportions. This observation can explain aspects of X-Q behaviors (section X-Q Relationships).
POC yield, the quantity of exported POC (Table 3) normalized to subbasin area (kg C/km2), has a dependency on precipitation quantity (Figure 6). Excluding the two outlier data points (Oxford—Oct 2014, Coralville—June 2016), there is a linear relationship between the POC yield and the precipitation that fell on the subbasin (r2 = 0.83, p = 0.002). The outliers, both high POC yields, occurred during storms in which the precipitation was spatially heterogeneous. Localized rainfall if sufficiently intense might have produced such non-linear behavior. We are unaware of similar observations of POC yield and precipitation. The relationship between sediment yield and precipitation is well-established (Kao and Milliman, 2008) however and it is expected to parallel that of POC.
The POC Components of Storm Responses
Surface soils and in-channel sources (algae, vascular plant debris, accumulated sediments, and channel walls) are commonly cited POC inputs to streams and rivers, including those in agricultural watersheds (Griffiths et al., 2012; Abban et al., 2016; Dolph et al., 2017; Le Meur et al., 2017; Rowland et al., 2017; Blair et al., 2018). Previous studies in the South Amana subbasin of Clear Creek identified parallel categories of sediment and POC sources, i.e., algal/detritus, terrestrial, and in-stream (Abaci and Papanicolaou, 2009; Wilson et al., 2012; Abban et al., 2016). The current compilation of past and present data indicate Clear Creek suspended sediment δ13C and δ15N values from the three sampling stations are bracketed by those of algal material, surface soils (row crop, prairie), alluvial deposition, and tile drain suspended sediment (Figure 2). This suggests that we have captured the major inputs of POC, or at least the dominant isotopic endmembers. The restored prairie that was sampled in a previous study (Hou et al., 2018) is not likely to be a major source of POC because of its limited area, however as a C3 plant dominated ecosystem it may serve as an isotopic proxy for other C3 vegetative covers, such as forests and pastures. Those sources are important land covers (9–29%), especially along floodplain corridors (Table 1).
Algal OC is the first component of the proposed sequence of inputs (Kim et al., 2020). Algal growth is obvious in the eutrophied Clear Creek during the late summer and early autumn, due to ample nutrients from field run-off, periods of low water velocity and low sediment load, and high light availability (Dolph et al., 2017). Abban et al. (2016) estimated that the algal and detrital source contributed ~10–40% to the Clear Creek POC depending on stream conditions; a finding similar to that observed in an agricultural watershed in Indiana (Dalzell et al., 2005). The most direct evidence that algal POC was captured with the samplers is the visual observation of algal mat debris on some early filters. The combined geochemical measurements eliminate substantial contributions from other potential sources. Elevated POC concentrations were found at the beginning of sample collection in the Oct 2014–2015, and July 2015 at some but not all stations (Figure 5). In some cases (e.g., Oxford, Oct 2014; Coralville, July 2015), the %C contents of the materials were higher than typical Clear Creek suspended sediments (8–12 vs. 1–2%), thus arguing against a previously deposited sediment source. 13C-depleted POC (δ13C < −25%0) indicative of C3-autotrophy was observed at the beginning of sampling during the same events (Figure 5; Fry and Sherr, 1984; Delong and Thorp, 2006; Abban et al., 2016). Row crop debris in contrast would have a significantly more positive value (>-20%0). Lipid biomarker measurements revealed a high C16-C18 fatty acid/lignin ratio at the onset of the Oct 2015 event indicating that non-vascular plant OC dominates over vascular plant debris (Kim et al., 2020). We argue that for at least certain times and locations, algal production dominates the standing crop of POC in the channel.
The most prominent peaks of POC mirror the behavior of sediment and track the rise and fall of the water discharge (Figure 5, Supplementary Table 1). Multiple POC peaks, most only partially resolved in time, are prevalent within a storm event. One explanation for the multiple peaks is that they represent inputs of materials that have arrived at different times. These inputs need not be in the same categories outlined earlier but instead may be packets of sediment and POC arriving by different mechanisms or flow paths. Tributary inputs are an example. The challenge is to decode the complex signal within this portion of the storm response.
To begin parsing the signal, we follow the convention of characterizing the first set of peaks that occur on the rising limb of the hydrograph as early flush peaks (Gellis, 2013; Figure 5). Early flush peaks of sediment have been attributed to the activation of easily erodible material in channels or on soil surfaces followed by exhaustion of the source (Wilson et al., 2012; Gellis, 2013). Such peaks are most pronounced in the Oct 2014 and 2015 storms (Figure 5). A small peak is seen at Oxford in the July 2015 event (Figure 5). We argue that the POC is derived predominantly from the erosion of row crop soils driven by precipitation. We propose that the cessation of rainfall turns off the source if exhaustion of the supply of soil does not occur first. The timing in which the peaks occur during rainfall or shortly thereafter is consistent with that premise. Early flush peaks of sediment have been observed previously at South Amana and attributed to precipitation-driven erosion of surface soils based on 7Be measurements (Wilson et al., 2012). They were responsible for 21–67% of the sediment load from the South Amana subbasin, the range being dependent on antecedent conditions (Wilson et al., 2012). The relative importance of the early flush material decreased as successive storms depleted the supply of easily erodible soil thus demonstrating one aspect of the conditional behavior of this source. There also may be a seasonality in the appearance of the early flush material as noted earlier (Abaci and Papanicolaou, 2009). The row crop fields were bare of vegetation but covered by crop debris after early October harvests. This primes the fields for surface erosion (Abaci and Papanicolaou, 2009; Hou et al., 2018; Xu et al., 2019).
The distinctive change in appearance of sediment from largely disaggregated silt at the beginning of storm events to darker-colored, millimeter-scale, stable aggregates at peak sediment concentrations provides visual evidence of an influx of surface soils. Rainfall simulation experiments using Clear Creek soils indicate that such small aggregates (0.2–2 mm) were sufficiently stable to rain-drop impact to be transported off-site (Hou et al., 2018; Wacha et al., 2018). Surface soils (0–5 cm) from Clear Creek fields used for corn-soybean rotations contain SOC with δ13C values between −16.5 and −19.5%0 (Hou et al., 2018). The stream POC approaches the 13C/12C ratios of the corn-soybean soils during the early flush period and afterwards (Figures 2, 5). Lignin phenol biomarker measurements from Oct 2015 early flush samples also indicate that the POC is derived from vascular plants and soils (Kim et al., 2020). The early flush POC bears the expected organic geochemical signatures of a row crop source.
Soil erosion models predict the loss of connectivity between surface soil sources and the channel as the basin area grows and valley morphology changes. Within the V-shaped South Amana subbasin, the sediment delivery ratio (SDR, the sediment yield from an area normalized to gross erosion) decreases from >0.9 for the hillslope scale (< 1 km2) to ~0.2 for sub-drainage areas of 10–20 km2 based on a soil erosion model (Abaci and Papanicolaou, 2009). As the watershed widens to a U- shape at Oxford and Coralville, eroded surface soils are more likely to be intercepted by the lower gradient portion of the landscape (Ferro and Minacapilli, 1995; Abaci and Papanicolaou, 2009). Sediment delivery ratios are ~0.1 based on the model extrapolations, approximately half of what is estimated for South Amana (Abaci and Papanicolaou, 2009). The implication of the model results is that if indeed the early flush peak is from a surface soil source, its contribution to the total POC inventory should decrease longitudinally. This is observed. The early flush POC was 12% of the total flux at South Amana in the Oct 2015 event (Table 3; Kim et al., 2020). The contribution to the total POC decreased to 4.0% at Oxford and 3.5% at Coralville. Further evidence of this downstream trend is seen between Oxford and Coralville in Oct 2014 (27% decreasing to 14%) and July 2015 (3 to 0%).
The last series of POC peaks arrive as the stream approaches and passes peak discharge (Figure 5). The POC within this series is quantitatively the most important component of the storm response as it is responsible for 73–100% of the total POC flux (Table 3). This is a complex region in terms of timing and discharge dependence—peaks occur near the end of the rising limb, near the apex and on the falling limb. The POC is also compositionally complex. C- and N-isotope ratios vary between endmember values as a function of time and location (Figure 5, Supplementary Table 1). Biomarker measurements of the Oct 2015 event indicate vascular plant, microbial and soil sources (Kim et al., 2020). Diagenetic indicators, such as lignin phenol acid/aldehyde ratios and hydroxy benzoic acids, indicate a range of degradation states within the POC (Kim et al., 2020).
The geochemical indicators are consistent with a partially homogenized mixture of sources that are an integration of upstream inputs. Within this mix would be products of channel wall erosion. Bank erosion can contribute as much as 80% of sediment in Midwestern U.S.A. agricultural watersheds (Lamba et al., 2015). Historical changes in channel meanders and radiochemical studies are evidence that bank erosion is active in Clear Creek (Wilson et al., 2012; Sutarto et al., 2014). Mechanistically, channel wall erosion fits within the context of when the POC peaks appear, i.e., the fluvial entrainment of bank deposits should track the hydrograph as water height and velocity waxes and wanes (Simon et al., 2000; Langendoen and Simon, 2008). The bank deposits in Clear Creek are primarily accumulations of alluvial sediments. As illustrated by the PSA-1 core, this material records a range of POC inputs as land use has evolved (δ13C ~-25 to −18.5%0, Figure 2). Consequently, the erosion of alluvial deposits adds considerable complexity to the stream POC in terms of composition and age. The bank source of POC should increase in importance downstream just as it has been demonstrated for sediments (Sutarto et al., 2014; Papanicolaou et al., 2017).
Tile drains were sampled to determine if they could be an important contribution. The tile drain contribution of water to streams is substantial, with estimates ranging from 15% to over 50% (Schilling et al., 2012; Amado et al., 2017). Tile drain inputs appear to be especially important at baseflow (Schilling and Helmers, 2008). The role of tile drains in the expedited export of solutes, such as N, P, and even DOC, from agricultural landscapes is well-known (Skaggs et al., 1994; Schilling and Helmers, 2008; Ruark et al., 2009; Schilling et al., 2012, 2015; Amado et al., 2017). However, the contribution of sediment from tile drains to streams has been barely studied. In Canada, tile-derived sediment comprised 1 to 8% of the total (overland plus tile) annual sediment load (Coelho et al., 2010). On an event basis, the tile-derived sediment contributions from plot studies in New York contributed between 6 and 46% of the total event load (Klaiber et al., 2020) for similar sized storms. Potential sediment and POC contributions in Clear Creek were estimated via:
where F is the fraction of sediment or POC derived from tile drains; fw is the fraction of water from tile drains (0.15–0.5); CTD is the concentration of sediment or POC in the tile drain effluent (g/l); and Cs is the concentration in the stream. Using values from the end of sampling periods as the system approached baseflow for the tile drains and the nearest stream site, South Amana, we estimate that ~4–38% of the suspended sediment in upper Clear Creek and ~4–16% of the POC could have a tile drain source.
The tile drain δ13C and δ15N values were generally more negative than those of stream sediments or surface soils (Figure 2). The source of the 13C- and 15N-depleted materials is unknown, but we offer two hypotheses. In one, the tile drains in the upper reach may be drawing water from late-glacial loess and the material exiting the drains are likely fines derived from it (Skaggs et al., 1994). The POC would be expected to have a C3 plant signature based on paleo-ecological records (Baker et al., 1996). Alternatively, the 13C- and 15N-depletions may signal the presence of microbial communities adapted to an environment in which O2 is injected into subsurface soils via the drains. Chemoautotrophic ammonia oxidizers are examples of organisms that could generate such isotope effects (Hadas et al., 2009). Regardless of source, the differences between tile drain particulates and the Clear Creek suspended sediment argue against the drains being a major source of POC, even as the system returns to baseflow. During that stage, much of the POC is likely derived from residual material in the channel plus bank failure as the hydrograph recedes (Simon et al., 2000; Langendoen and Simon, 2008).
High resolution mass spectrometric analyses of DOC from nested sites in the Passumpsic River catchment (Vermont, USA) revealed an enrichment of aliphatic molecular structures at storm onset followed by an increase in aromatic functionality at peak discharge (Wagner et al., 2019). The aliphatic and aromatic moieties were attributed to lipid-rich and lignin-derived polyphenolic materials, respectively. This parallels the Clear Creek progression from fatty acid-enrich algal POC to soil and vascular plant sources that have high lignin and hydroxy benzoic acid contents (Kim et al., 2020). This commonality is proposed to be an outgrowth of the reactor-pipe duality of fluvial systems (Cole et al., 2007). Storms not only switch modes from reaction (algal productivity) to transport, but also deliver terrestrial POC (i.e., soils and vascular plant debris) to the channel ensuring the observed change in POC and DOC compositions.
X-Q Relationships
The dependencies of POC concentration and δ13C on discharge provide additional metrics by which to test aspects of our conceptual model. South Amana exhibited poor correlations between POC and discharge, whereas they were significantly correlated at Oxford and Coralville (Table 4). Furthermore, the rising limb slope of the POC-Q relationship decreases as one moves from Oxford to Coralville in each event that the slope could be estimated (Figure 7, Table 4). The observations illustrate the fundamental differences between how POC can behave in the upper and lower reaches. In upland regions, where surface erosion and over-land transport have the potential to be flux limiting, rainfall intensity and duration, not discharge, should be a major control of POC delivery. In contrast, as one moves away from upland sources, stream discharge takes over as the predominant transporting agent. The decrease in slope signals an attenuation of net POC inputs relative to water. Though there may be multiple factors that influence that change, it is consistent with the loss of connectivity between hillslopes and the channel as the valley broadens, as well as transitions in land cover. In essence, the channel may be starved of surface POC inputs from the landscape in the lower reaches because the POC is intercepted by the stream corridor.
The clockwise hysteresis displayed by the POC-Q pair in Clear Creek (Figure 7, Table 4) is the most frequently observed pattern for sediments in streams and thus it is not surprising that it is seen with POC (Allen, 1974; Gellis, 2013). The delivery of easy-to-mobilize sediment during the rising limb of the hydrograph followed by exhaustion of the source is the most common explanation for the clockwise pattern, though other mechanisms have been invoked for individual systems (Gellis, 2013). Pre-event (algal) and early flush (row crop surface soil) inputs in Clear Creek would certainly contribute to a clockwise pattern. Furthermore, the arrival sequence of local POC inputs followed by broadened (and thus more dilute) peaks with upstream origins could also drive the clockwise pattern.
Changes in POC δ13C values are primarily driven by the mixing of C3 and C4 plant sources. The POC δ13C -Q slope can be viewed as a discharge-driven mixing line between corn (as a surrogate for row crops) and C3 sources. The hysteresis of the POC δ13C -Q relationship is highly variable with few discernable patterns. The cause is unknown but it is reasonable to speculate that spatial patterns in vegetative cover could create a sensitivity to storm track and intensity, and the other previously discussed antecedent and seasonal factors. An illustration of a potential mechanism is provided by POC δ13C exported from the South Amana subbasin during the Oct 2015 and June 2016 events. The rainfall was 24 mm and 10 mm for the respective dates. The Oct 2015 period exhibited a more positive δ13C value (−23.6%0, Table 3) than June 2016 (−25.9%0), reflecting a greater row crop soil contribution in the more intense storm. Notably the early flush POC contribution to the total was greater (12 vs. 0%) in Oct 2015 as well. Turning the row crop source on and off, either by rainfall or seasonal vegetative cover, may be the greatest driver of isotopic variability in the system.
The one C-isotope hysteresis pattern that did emerge occurred in the Oct 2015 event (Figure 7). A clockwise pattern was observed in the upper part of the watershed where row crops were most concentrated and thus the 13C-enriched (more positive δ13C values) corn signal arrived early as part of the early flush peak. The hysteresis flattened moving downstream, and ultimately became counterclockwise at Coralville. The delayed arrival of upland 13C-enriched POC is likely the driver of the counterclockwise pattern. What may have started out as an early flush peak of POC in the uplands ultimately contributes to the trailing portion of the main peak in the lowlands. This is another illustration of how proximal and distal components combine to create the total storm pulse signal.
Conclusions
Changing POC compositions were captured as functions of time, location and discharge in Clear Creek in response to passing storms. The nested longitudinal sampling approach employed with a multi-hour sampling frequency allowed us to dissect a storm pulse in unprecedented detail and identify a sequence of inputs (Kim et al., 2020). The analysis of multiple storms allowed us to assess the variability of storm responses. Organic-rich material dominated by algal debris was the first to be mobilized. Small changes in water velocity may have been sufficient to trigger its transport. Generically, any easily suspended POC source, such as vascular plant debris, could be moved at this stage. Eroded surface soils, principally from row crop fields, followed the algal pulse. This source was closely associated with the timing of the precipitation. It also required connectivity between the fields and the channel as illustrated by its diminishing importance with the broadening of the valley's morphology. Both the in-channel and surface soil POC inputs were conditional in the sense that they were dependent on specific environmental conditions. For example, nutrients, light, and low water velocities are requisite conditions for algal growth, thus algal inputs would be expected to be most dominant between storms in eutrophied systems during summer-early fall. Similarly, bare fields shortly after harvest or tillage would be most vulnerable to erosion.
The most complex and ubiquitous POC component is associated with the primary wave of sediment delivered from upstream. As such, it is a mix of materials that accumulates with transport. Based on prior geomorphological and radiochemical studies in Clear Creek and elsewhere, bank erosion is hypothesized to contribute to this mixture. The contribution of bank erosion should increase with a lengthening reach (Sutarto et al., 2014; Lamba et al., 2015; Gellis et al., 2017). Tile drain POC, while projected to be at its greatest importance at or near base flow, is a relatively minor contributor to the temporal series of inputs.
The conceptual model presented here is best fit to small, low gradient, agricultural streams like Clear Creek. Deviations from the model will occur in other systems, such as small, mountainous watersheds, where POC sources and delivery mechanisms differ (Blair et al., 2010; Hilton et al., 2011; Hovius et al., 2011). Nevertheless, we can extract some general principles from our study. A storm-generated pulse can be viewed as a signal that encodes environmental information. Its information content can be altered by interactions within the river corridor as it propagates. At some point the signal may be “shredded” by the trapping and release of alluvial sediment as occurs in active floodplains (Jerolmack and Paola, 2010; Romans et al., 2016). The capture and long-term sequestration of the pulse in downstream depocenters archives the signal's information. Understanding how the signal propagates is thus critical to interpreting those portions of the sedimentological record that are derived from fluvial deposition (Romans et al., 2016). Particulate OC is a particularly useful component to consider from this perspective as its information content is high due to its sensitivity to source and its preservability in sedimentary archives (Castaneda et al., 2009). The Clear Creek data suggest that a temporally resolved portion of the signal, the early flush POC, is progressively lost with propagation and this is hypothesized to be partially due to changing valley geomorphology. A logical question to ask going forward is whether this is a universal response to increasing basin size.
The erosion of bank alluvia, while not the original target in this study, has emerged as a potential focus of future research in terms of its contribution to fluvial POC budgets and geochemical compositions. This is especially relevant now because of the anthropogenic acceleration of alluvial sediment formation and sequestration (Syvitski et al., 2005; Kemp et al., 2020). Erosion of the alluvial deposition injects a mixture of aged POC sources. This adds a level of noise that is expected to grow in importance with increasing reach length. At some point however, the noise becomes the signal, especially in the lower gradient portions of the watershed. The Amazon River system is an endmember example of this phenomenon where geochemical signals generated in the Andes are erased and replaced by its massive floodplain before export to the ocean (Bouchez et al., 2010). The contribution of the lowland reactor has implications for tracking the fate of eroded soil OC from source to sink, and for balancing C ledgers across landscapes. The routing of POC through alluvial deposits lengthens the timescale over which C-budgets must be considered. The quest to ascertain whether soil OC erosion is a net C-source or sink to the atmosphere may need to go through transient alluvial POC traps, such as floodplains.
Data Availability Statement
Original Clear Creek data are archived on the IMLCZO’s Clowder database system. A spreadsheet can be downloaded from http://data.imlczo.org/clowder/datasets/5d922de44f0c55584a21a55b. Accession numbers can be found in the Supplementary Material.
Author Contributions
NB, EB, AP, TF, CW, and AW developed the proposal for this project and oversaw various aspects of the field sample collection, analyses, and data interpretation. JM, NZ, and BK performed the analyses and assisted with data management. JK assisted with data interpretation and manuscript preparation. All authors contributed to the article and approved the submitted version.
Funding
Financial support was provided by the U.S. National Science Foundation (NSF) Grant # EAR-1331906 for the Critical Zone Observatory for Intensively Managed Landscapes (IML-CZO), a multi-institutional collaborative effort. A portion of time for Ward, Davis, and Prior was supported by NSF Grant EAR-1360276.
Conflict of Interest
The authors declare that the research was conducted in the absence of any commercial or financial relationships that could be construed as a potential conflict of interest.
Acknowledgments
Caroline Davis, Katie Goff, Kara Prior, and Courtney Cappalli assisted with field sampling. Paul Roots, Yue Zeng, Dana Cooperberg, and Koushik Dutta assisted with analyses. Special thanks to Praveen Kumar for his leadership of the IML-CZO project. We thank two reviewers for their detailed constructive comments.
Supplementary Material
The Supplementary Material for this article can be found online at: https://www.frontiersin.org/articles/10.3389/frwa.2021.600649/full#supplementary-material
References
Abaci, O., and Papanicolaou, A. N. T. (2009). Long-term effects of management practices on water-driven soil erosion in an intense agricultural sub-watershed: monitoring and modelling. Hydrol. Process. 23, 2818–2837. doi: 10.1002/hyp.7380
Abban, B., Papanicolaou, A. N., Cowles, M. K., Wilson, C. G., Abaci, O., Wacha, K., et al. (2016). An enhanced Bayesian fingerprinting framework for studying sediment source dynamics in intensively managed landscapes. Water Resour. Res. 52, 4646–4673. doi: 10.1002/2015wr018030
Allen, J. R. L. (1974). Reaction, relaxation and lag in natural sedimentary systems–general principles, examples and lessons. Earth Sci. Rev. 10, 263–342. doi: 10.1016/0012-8252(74)90109-3
Amado, A. A., Schilling, K. E., Jones, C. S., Thomas, N., and Weber, L. J. (2017). Estimation of tile drainage contribution to streamflow and nutrient loads at the watershed scale based on continuously monitored data. Environ. Monit. Assess. 189:13. doi: 10.1007/s10661-017-6139-4
Amundson, R., Austin, A. T., Schuur, E. A. G., Yoo, K., Matzek, V., Kendall, C., et al. (2003). Global patterns of the isotopic composition of soil and plant nitrogen. Glob. Biogeochem. Cycles 17:1031. doi: 10.1029/2002gb001903
Amundson, R., Berhe, A. A., Hopmans, J. W., Olson, C., Sztein, A. E., and Sparks, D. L. (2015). Soil and human security in the 21st century. Science 348. doi: 10.1126/science.1261071
Aufdenkampe, A. K., Mayorga, E., Hedges, J. I., Llerena, C., Quay, P. D., Gudeman, J., et al. (2007). Organic matter in the Peruvian headwaters of the Amazon: compositional evolution from the Andes to the lowland Amazon mainstem. Org. Geochem. 38, 337–364. doi: 10.1016/j.orggeochem.2006.06.003
Aufdenkampe, A. K., Mayorga, E., Raymond, P. A., Melack, J. M., Doney, S. C., Alin, S. R., et al. (2011). Riverine coupling of biogeochemical cycles between land, oceans, and atmosphere. Front. Ecol. Environ. 9, 53–60. doi: 10.1890/100014
Baker, R. G., Bettis, E. A., Schwert, D. P., Horton, D. G., Chumbley, C. A., Gonzalez, L. A., et al. (1996). Holocene paleoenvironments of northeast Iowa. Ecol. Monogr. 66, 203–234. doi: 10.2307/2963475
Berhe, A. A., Harte, J., Harden, J. W., and Torn, M. S. (2007). The significance of the erosion-induced terrestrial carbon sink. Bioscience 57, 337–346. doi: 10.1641/b570408
Blair, N. E., and Aller, R. C. (2012). The fate of terrestrial organic carbon in the marine environment. Annu. Rev. Mar. Sci. 4, 401–423. doi: 10.1146/annurev-marine-120709-142717
Blair, N. E., Leithold, E. L., and Aller, R. C. (2004). From bedrock to burial: the evolution of particulate organic carbon across coupled watershed-continental margin systems. Mar. Chem. 92, 141–156. doi: 10.1016/j.marchem.2004.06.023
Blair, N. E., Leithold, E. L., Brackley, H., Trustrum, N., Page, M., and Childress, L. (2010). Terrestrial sources and export of particulate organic carbon in the Waipaoa sedimentary system: problems, progress and processes. Mar. Geol. 270, 108–118. doi: 10.1016/j.margeo.2009.10.016
Blair, N. E., Leithold, E. L., Papanicolaou, A. N. T., Wilson, C. G., Keefer, L., Kirton, E., et al. (2018). The C-biogeochemistry of a Midwestern USA agricultural impoundment in context: Lake Decatur in the intensively managed landscape critical zone observatory. Biogeochemistry 138, 171–195. doi: 10.1007/s10533-018-0439-9
Bouchez, J., Beyssac, O., Galy, V., Gaillardet, J., France-Lanord, C., Maurice, L., et al. (2010). Oxidation of petrogenic organic carbon in the Amazon floodplain as a source of atmospheric CO2. Geology 38, 255–258. doi: 10.1130/g30608.1
Bouillon, S., Abril, G., Borges, A. V., Dehairs, F., Govers, G., Hughes, H. J., et al. (2009). Distribution, origin and cycling of carbon in the Tana River (Kenya): a dry season basin-scale survey from headwaters to the delta. Biogeosciences 6, 2475–2493. doi: 10.5194/bg-6-2475-2009
Castaneda, I. S., Werne, J. P., Johnson, T. C., and Filley, T. R. (2009). Late Quaternary vegetation history of southeast Africa: the molecular isotopic record from Lake Malawi. Palaeogeogr. Palaeoclimatol. Palaeoecol. 275, 100–112. doi: 10.1016/j.palaeo.2009.02.008
Coelho, B. B., Bruin, A. J., Staton, S., and Hayman, D. (2010). Sediment and nutrient contributions from subsurface drains and point sources to an agricultural watershed. Air Soil Water Res. 3, 1–21. doi: 10.4137/ASWR.S4471
Cole, J. J., Prairie, Y. T., Caraco, N. F., McDowell, W. H., Tranvik, L. J., Striegl, R. G., et al. (2007). Plumbing the global carbon cycle: Integrating inland waters into the terrestrial carbon budget. Ecosystems 10, 171–184. doi: 10.1007/s10021-006-9013-8
Coplen, T. B. (2011). Guidelines and recommended terms for expression of stable-isotope-ratio and gas-ratio measurement results. Rapid Commun. Mass Spectrom. 25, 2538–2560. doi: 10.1002/rcm.5129
Craig, H. (1953). The geochemistry of the stable carbon isotopes. Geochim. Cosmochim. Acta 3, 53–92. doi: 10.1016/0016-7037(53)90001-5
Cui, L., Butler, H. J., Martin-Hirsch, P. L., and Martin, F. L. (2016). Aluminium foil as a potential substrate for ATR-FTIR, transflection FTIR or Raman spectrochemical analysis of biological specimens. Anal. Methods 8, 481–487. doi: 10.1039/c5ay02638e
Dalzell, B. J., Filley, T. R., and Harbor, J. M. (2005). Flood pulse influences on terrestrial organic matter export from an agricultural watershed. J. Geophys. Res. Biogeosci. 110:G02011. doi: 10.1029/2005jg000043
Dalzell, B. J., Filley, T. R., and Harbor, J. M. (2007). The role of hydrology in annual organic carbon loads and terrestrial organic matter export from a midwestern agricultural watershed. Geochim. Cosmochim. Acta 71, 1448–1462. doi: 10.1016/j.gca.2006.12.009
Davis, C. A., Ward, A. S., Burgin, A. J., Loecke, T. D., Riveros-Iregui, D. A., Schnoebelen, D. J., et al. (2014). Antecedent moisture controls on stream nitrate flux in an agricultural watershed. J. Environ. Qual. 43, 1494–1503. doi: 10.2134/jeq2013.11.0438
Delong, M. D., and Thorp, J. H. (2006). Significance of instream autotrophs in trophic dynamics of the Upper Mississippi River. Oecologia 147, 76–85. doi: 10.1007/s00442-005-0241-y
Dhillon, G. S., and Inamdar, S. (2013). Extreme storms and changes in particulate and dissolved organic carbon in runoff: entering uncharted waters? Geophys. Res. Lett. 40, 1322–1327. doi: 10.1002/grl.50306
Dhillon, G. S., and Inamdar, S. (2014). Storm event patterns of particulate organic carbon (POC) for large storms and differences with dissolved organic carbon (DOC). Biogeochemistry 118, 61–81. doi: 10.1007/s10533-013-9905-6
Doetterl, S., Berhe, A. A., Nadeu, E., Wang, Z. G., Sommer, M., and Fiener, P. (2016). Erosion, deposition and soil carbon: a review of process-level controls, experimental tools and models to address C cycling in dynamic landscapes. Earth Sci. Rev. 154, 102–122. doi: 10.1016/j.earscirev.2015.12.005
Dolph, C. L., Hansen, A. T., and Finlay, J. C. (2017). Flow-related dynamics in suspended algal biomass and its contribution to suspended particulate matter in an agricultural river network of the Minnesota River Basin, USA. Hydrobiologia 785, 127–147. doi: 10.1007/s10750-016-2911-7
Farquhar, G. D. (1983). On the nature of carbon isotope discrimination in C-4 species. Aust. J. Plant Physiol. 10, 205–226.
Ferro, V., and Minacapilli, M. (1995). Sediment delivery processes at basin scale. Hydrol. Sci. J. 40, 703–717.
Fox, J. F., and Papanicolaou, A. N. (2007). The use of carbon and nitrogen isotopes to study watershed erosion processes. J. Am. Water Resour. Assoc. 43, 1047–1064. doi: 10.1111/j.1752-1688.2007.00087.x
Fry, B., and Sherr, E. B. (1984). Delta-C-13 measurements as indicators of carbon flow in marine and fresh-water ecosystems. Contrib. Mar. Sci. 27, 13–47.
Galy, V., Peucker-Ehrenbrink, B., and Eglinton, T. (2015). Global carbon export from the terrestrial biosphere controlled by erosion. Nature 521, 204–207. doi: 10.1038/nature14400
Gellis, A. C. (2013). Factors influencing storm-generated suspended-sediment concentrations and loads in four basins of contrasting land use, humid-tropical Puerto Rico. Catena 104, 39–57. doi: 10.1016/j.catena.2012.10.018
Gellis, A. C., Fuller, C. C., and Van Metre, P. C. (2017). Sources and ages of fine-grained sediment to streams using fallout radionuclides in the Midwestern United States. J. Environ. Manage. 194, 73–85. doi: 10.1016/j.jenvman.2016.06.018
Griffiths, N. A., Tank, J. L., Royer, T. V., Warrner, T. J., Frauendorf, T. C., Rosi-Marshall, E. J., et al. (2012). Temporal variation in organic carbon spiraling in Midwestern agricultural streams. Biogeochemistry 108, 149–169. doi: 10.1007/s10533-011-9585-z
Hadas, O., Altabet, M. A., and Agnihotri, R. (2009). Seasonally varying nitrogen isotope biogeochemistry of particulate organic matter in Lake Kinneret, Israel. Limnol. Oceanogr. 54, 75–85. doi: 10.4319/lo.2009.54.1.0075
Harden, J. W., Sharpe, J. M., Parton, W. J., Ojima, D. S., Fries, T. L., Huntington, T. G., et al. (1999). Dynamic replacement and loss of soil carbon on eroding cropland. Glob. Biogeochem. Cycles 13, 885–901. doi: 10.1029/1999gb900061
Harris, D., Horwath, W. R., and van Kessel, C. (2001). Acid fumigation of soils to remove carbonates prior to total organic carbon or carbon-13 isotopic analysis. Soil Sci. Soc. Am. J. 65, 1853–1856. doi: 10.2136/sssaj2001.1853
Hedges, J. I., Mayorga, E., Tsamakis, E., McClain, M. E., Aufdenkampe, A., Quay, P., et al. (2000). Organic matter in Bolivian tributaries of the Amazon River: a comparison to the lower mainstream. Limnol. Oceanogr. 45, 1449–1466. doi: 10.4319/lo.2000.45.7.1449
Hedges, J. I., and Oades, J. M. (1997). Comparative organic geochemistries of soils and marine sediments. Org. Geochem. 27, 319–361.
Hilton, R. G., Galy, A., Hovius, N., Horng, M. J., and Chen, H. (2011). Efficient transport of fossil organic carbon to the ocean by steep mountain rivers: an orogenic carbon sequestration mechanism. Geology 39, 71–74. doi: 10.1130/g31352.1
Hope, D., Billett, M. F., and Cresser, M. S. (1994). A review of the export of carbon in river water–fluxes and processes. Environ. Pollut. 84, 301–324. doi: 10.1016/0269-7491(94)90142-2
Hou, T., Berry, T. D., Singh, S., Hughes, M. N., Tong, Y., Thanos Papanicolaou, A. N., et al. (2018). Control of tillage disturbance on the chemistry and proportion of raindrop-liberated particles from soil aggregates. Geoderma 330, 19–29. doi: 10.1016/j.geoderma.2018.05.013
Hovius, N., Galy, A., Hilton, R. G., Sparkes, R., Smith, J., Shuh-Ji, K., et al. (2011). Erosion-driven drawdown of atmospheric carbon dioxide: the organic pathway. Appl. Geochem. 26, S285–S287. doi: 10.1016/j.apgeochem.2011.03.082
Jeong, J. J., Bartsch, S., Fleckenstein, J. H., Matzner, E., Tenhunen, J. D., Lee, S. D., et al. (2012). Differential storm responses of dissolved and particulate organic carbon in a mountainous headwater stream, investigated by high-frequency, in situ optical measurements. J. Geophys. Res. Biogeosci. 117:G03013. doi: 10.1029/2012jg001999
Jerolmack, D. J., and Paola, C. (2010). Shredding of environmental signals by sediment transport. Geophys. Res. Lett. 37:L19401. doi: 10.1029/2010gl044638
Jung, B. J., Lee, H. J., Jeong, J. J., Owen, J., Kim, B., Meusburger, K., et al. (2012). Storm pulses and varying sources of hydrologic carbon export from a mountainous watershed. J. Hydrol. 440, 90–101. doi: 10.1016/j.jhydrol.2012.03.030
Kao, S. J., and Milliman, J. D. (2008). Water and sediment discharge from small mountainous rivers, Taiwan: the roles of lithology, episodic events, and human activities. J. Geol. 116, 431–448. doi: 10.1086/590921
Kemp, D. B., Sadler, P. M., and Vanacker, V. (2020). The human impact on North American erosion, sediment transfer, and storage in a geologic context. Nat. Commun. 11:6012. doi: 10.1038/s41467-020-19744-3
Kim, J., Blair, N. E., Ward, A. S., and Goff, K. (2020). Storm-induced dynamics of particulate organic carbon in Clear Creek, Iowa: an intensively managed landscape critical zone observatory story. Front. Water 2:578261. doi: 10.3389/frwa.2020.578261
Klaiber, L. B., Kramer, S. R., and Young, E. O. (2020). Impacts of tile drainage on phosphorus losses from edge-of-field plots in the Lake Champlain basin of New York. Water 12:328. doi: 10.3390/w12020328
Kumar, P., Le, P. V. V., Papanicolaou, A. N. T., Rhoads, B. L., Anders, A. M., Stumpf, A., et al. (2018). Critical transition in critical zone of intensively managed landscapes. Anthropocene 22, 10–19. doi: 10.1016/j.ancene.2018.04.002
Lal, R. (2003). Soil erosion and the global carbon budget. Environ. Int. 29, 437–450. doi: 10.1016/s0160-4120(02)00192-7
Lal, R. (2009). Challenges and opportunities in soil organic matter research. Eur. J. Soil Sci. 60, 158–169. doi: 10.1111/j.1365-2389.2008.01114.x
Lamba, J., Thompson, A. M., Karthikeyan, K. G., and Fitzpatrick, F. A. (2015). Sources of fine sediment stored in agricultural lowland streams, Midwest, USA. Geomorphology 236, 44–53. doi: 10.1016/j.geomorph.2015.02.001
Langendoen, E. J., and Simon, A. (2008). Modeling the evolution of incised streams. II: Streambank erosion. J. Hydraul. Eng. ASCE 134, 905–915. doi: 10.1061/(asce)0733-9429(2008)134:7(905)
Le Meur, M., Mansuy-Huault, L., Lorgeoux, C., Bauer, A., Gley, R., Vantelon, D., et al. (2017). Spatial and temporal variations of particulate organic matter from Moselle River and tributaries: a multimolecular investigation. Org. Geochem. 110, 45–56. doi: 10.1016/j.orggeochem.2017.04.003
Lee, K. Y., van Geldern, R., and Barth, J. A. C. (2017). A high-resolution carbon balance in a small temperate catchment: insights from the Schwabach River, Germany. Appl. Geochem. 85, 86–96. doi: 10.1016/j.apgeochem.2017.08.007
Leithold, E. L., Blair, N. E., Childress, L. B., Brulet, B. R., Marden, M., Orpin, A. R., et al. (2013). Signals of watershed change preserved in organic carbon buried on the continental margin seaward of the Waipaoa River, New Zealand. Mar. Geol. 346, 355–365. doi: 10.1016/j.margeo.2013.10.007
Leithold, E. L., Blair, N. E., and Wegmann, K. W. (2016). Source-to-sink sedimentary systems and global carbon burial: a river runs through it. Earth Sci. Rev. 153, 30–42. doi: 10.1016/j.earscirev.2015.10.011
Li, M. X., Peng, C. H., Wang, M., Xue, W., Zhang, K. R., Wang, K. F., et al. (2017). The carbon flux of global rivers: a re-evaluation of amount and spatial patterns. Ecol. Indic. 80, 40–51. doi: 10.1016/j.ecolind.2017.04.049
Newbold, J. D., Mulholland, P. J., Elwood, J. W., and Oneill, R. V. (1982). Organic-carbon spiralling in stream ecosystems. Oikos 38, 266–272. doi: 10.2307/3544663
Oeurng, C., Sauvage, S., Coynel, A., Maneux, E., Etcheber, H., and Sanchez-Perez, J. M. (2011). Fluvial transport of suspended sediment and organic carbon during flood events in a large agricultural catchment in southwest France. Hydrol. Process. 25, 2365–2378. doi: 10.1002/hyp.7999
O'Leary, M. H. (1981). Carbon isotope fractionation in plants. Phytochemistry 20, 553–567. doi: 10.1016/0031-9422(81)85134-5
Papanicolaou, A. N., Wacha, K. M., Abban, B. K., Wilson, C. G., Hatfield, J. L., Stanier, C. O., et al. (2015). From soilscapes to landscapes: a landscape-oriented approach to simulate soil organic carbon dynamics in intensively managed landscapes. J. Geophys. Res. Biogeosci. 120, 2375–2401. doi: 10.1002/2015jg003078
Papanicolaou, A. N. T., Wilson, C. G., Tsakiris, A. G., Sutarto, T. E., Bertrand, F., Rinaldi, M., et al. (2017). Understanding mass fluvial erosion along a bank profile: using PEEP technology for quantifying retreat lengths and identifying event timing. Earth Surf. Process. Landf. 42, 1717–1732. doi: 10.1002/esp.4138
Raymond, P. A., Saiers, J. E., and Sobczak, W. V. (2016). Hydrological and biogeochemical controls on watershed dissolved organic matter transport: pulse-shunt concept. Ecology 97, 5–16. doi: 10.1890/14-1684.1
Richey, J. E., Hedges, J. I., Devol, A. H., Quay, P. D., Victoria, R., Martinelli, L., et al. (1990). Biogeochemistry of carbon in the Amazon river. Limnol. Oceanogr. 35, 352–371.
Romans, B. W., Castelltort, S., Covault, J. A., Fildani, A., and Walsh, J. P. (2016). Environmental signal propagation in sedimentary systems across timescales. Earth Sci. Rev. 153, 7–29. doi: 10.1016/j.earscirev.2015.07.012
Rose, L. A., Karwan, D. L., and Godsey, S. E. (2018). Concentration-discharge relationships describe solute and sediment mobilization, reaction, and transport at event and longer timescales. Hydrol. Process. 32, 2829–2844. doi: 10.1002/hyp.13235
Rowland, R., Inamdar, S., and Parr, T. (2017). Evolution of particulate organic matter (POM) along a headwater drainage: role of sources, particle size class, and storm magnitude. Biogeochemistry 133, 181–200. doi: 10.1007/s10533-017-0325-x
Ruark, M. D., Brouder, S. M., and Turco, R. F. (2009). Dissolved organic carbon losses from tile drained agroecosystems. J. Environ. Qual. 38, 1205–1215. doi: 10.2134/jeq2008.0121
Schilling, K. E., and Helmers, M. (2008). Effects of subsurface drainage tiles on streamflow in Iowa agricultural watersheds: exploratory hydrograph analysis. Hydrol. Process. 22, 4497–4506. doi: 10.1002/hyp.7052
Schilling, K. E., Jindal, P., Basu, N. B., and Helmers, M. J. (2012). Impact of artificial subsurface drainage on groundwater travel times and baseflow discharge in an agricultural watershed, Iowa (USA). Hydrol. Process. 26, 3092–3100. doi: 10.1002/hyp.8337
Schilling, K. E., Wolter, C. F., Isenhart, T. M., and Schultz, R. C. (2015). Tile drainage density reduces groundwater travel times and compromises Riparian buffer effectiveness. J. Environ. Qual. 44, 1754–1763. doi: 10.2134/jeq2015.02.0105
Simon, A., Curini, A., Darby, S. E., and Langendoen, E. J. (2000). Bank and near-bank processes in an incised channel. Geomorphology 35, 193–217. doi: 10.1016/s0169-555x(00)00036-2
Skaggs, R. W., Breve, M. A., and Gilliam, J. W. (1994). Hydrologic and water-quality impacts of agricultural drainage. Crit. Rev. Environ. Sci. Technol. 24, 1–32. doi: 10.1080/10643389409388459
Sutarto, T., Papanicolaou, A. N., Wilson, C. G., and Langendoen, E. J. (2014). Stability analysis of semicohesive streambanks with CONCEPTS: coupling field and laboratory investigations to quantify the onset of fluvial erosion and mass failure. J. Hydraul. Eng. 140:04014041. doi: 10.1061/(asce)hy.1943-7900.0000899
Syvitski, J. P. M., Vorosmarty, C. J., Kettner, A. J., and Green, P. (2005). Impact of humans on the flux of terrestrial sediment to the global coastal ocean. Science 308, 376–380. doi: 10.1126/science.1109454
Wacha, K. M., Papanicolaou, A. N. T., Giannopoulos, C. P., Abban, B. K., Wilson, C. G., Zhou, S. N., et al. (2018). The role of hydraulic connectivity and management on soil aggregate size and stability in the Clear Creek Watershed, Iowa. Geosciences 8:470. doi: 10.3390/geosciences8120470
Wagner, S., Fair, J. H., Matt, S., Hosen, J. D., Raymond, P., Saiers, J., et al. (2019). Molecular hysteresis: hydrologically driven changes in riverine dissolved organic matter chemistry during a storm event. J. Geophys. Res. Biogeosci. 124, 759–774. doi: 10.1029/2018jg004817
Wang, Z. G., Hoffmann, T., Six, J., Kaplan, J. O., Govers, G., Doetterl, S., et al. (2017). Human-induced erosion has offset one-third of carbon emissions from land cover change. Nat. Clim. Change 7, 345–349. doi: 10.1038/nclimate3263
Wilson, C. G., Abban, B., Keefer, L. L., Wacha, K., Dermisis, D., Giannopoulos, C., et al. (2018). The intensively managed landscape critical zone observatory: a scientific testbed for understanding critical zone processes in agroecosystems. Vadose Zone J. 17:180088. doi: 10.2136/vzj2018.04.0088
Wilson, C. G., Papanicolaou, A. N. T., and Denn, K. D. (2012). Partitioning fine sediment loads in a headwater system with intensive agriculture. J. Soils Sediments 12, 966–981. doi: 10.1007/s11368-012-0504-2
Wilson, C. G., Wacha, K. M., Thanos Papanicolaou, A. N., Sander, H. A., Freudenberg, V. B., Abban, B. K. B., et al. (2016). Dynamic assessment of current management in an intensively managed agroecosystem. J. Contemp. Water Res. Educ. 158, 148–171. doi: 10.1111/j.1936-704X.2016.03225.x
Wohl, E. (2017). Connectivity in rivers. Prog. Phys. Geogr. 41, 345–362. doi: 10.1177/0309133317714972
Xu, C., Yang, Z., Qian, W., Chen, S., Liu, X., Lin, W., et al. (2019). Runoff and soil erosion responses to rainfall and vegetation cover under various afforestation management regimes in subtropical montane forest. Land Degrad. Dev. 30, 1711–1724. doi: 10.1002/ldr.3377
Yan, Q. N., Iwasaki, T., Stumpf, A., Belmont, P., Parker, G., and Kumar, P. (2018). Hydrogeomorphological differentiation between floodplains and terraces. Earth Surf. Process. Landf. 43, 218–228. doi: 10.1002/esp.4234
Yan, Q. N., Le, P. V. V., Woo, D. K., Hou, T. Y., Filley, T., and Kumar, P. (2019). Three-dimensional modeling of the coevolution of landscape and soil organic carbon. Water Resour. Res. 55, 1218–1241. doi: 10.1029/2018wr023634
Keywords: organic carbon, streams, erosion, storms, watershed, agriculture, land use, source-to-sink
Citation: Blair NE, Bettis III EA, Filley TR, Moravek JA, Papanicolaou ANT, Ward AS, Wilson CG, Zhou N, Kazmierczak B and Kim J (2021) The Spatiotemporal Evolution of Storm Pulse Particulate Organic Carbon in a Low Gradient, Agriculturally Dominated Watershed. Front. Water 3:600649. doi: 10.3389/frwa.2021.600649
Received: 30 August 2020; Accepted: 22 January 2021;
Published: 17 February 2021.
Edited by:
Alexis Navarre-Sitchler, Colorado School of Mines, United StatesReviewed by:
Eve-Lyn S. Hinckley, University of Colorado Boulder, United StatesJoel Moore, Towson University, United States
Copyright © 2021 Blair, Bettis III, Filley, Moravek, Papanicolaou, Ward, Wilson, Zhou, Kazmierczak and Kim. This is an open-access article distributed under the terms of the Creative Commons Attribution License (CC BY). The use, distribution or reproduction in other forums is permitted, provided the original author(s) and the copyright owner(s) are credited and that the original publication in this journal is cited, in accordance with accepted academic practice. No use, distribution or reproduction is permitted which does not comply with these terms.
*Correspondence: Neal E. Blair, bi1ibGFpckBub3J0aHdlc3Rlcm4uZWR1 orcid.org/0000-0002-3449-3371
†Present address: Jessie Moravek, Department of Environmental Science, Policy, and Management, University of California, Berkeley, Berkeley, CA, United States
Nina Zhou, Feinberg School of Medicine, Chicago, IL, United States
‡Currently unaffiliated