
94% of researchers rate our articles as excellent or good
Learn more about the work of our research integrity team to safeguard the quality of each article we publish.
Find out more
ORIGINAL RESEARCH article
Front. Water , 23 December 2020
Sec. Water and Critical Zone
Volume 2 - 2020 | https://doi.org/10.3389/frwa.2020.597810
This article is part of the Research Topic Advances in Pollutant Transport in Critical Zone Environments View all 6 articles
 Dawit N. Bekele1,2*
 Yanju Liu1,2Mark Donaghey2
 Anthony Umeh1,2Chamila S. V. Arachchige1Sreenivasulu Chadalavada1,2
 Ravi Naidu1,2*
Perfluoroalkyl and polyfluoroalkyl substances (PFAS) are persistent organic contaminants of concern to human and environmental health. Several literature reviews and laboratory column experiments have been conducted to determine the transport parameters and to describe the fate of PFAS as they migrate in subsurface environments. However, there are very few case studies focusing on contaminated sites with high-resolution field data. Such studies are crucial for the validation of transport simulation models that have been developed from experimental studies, prior to their broader applications. The key purpose of this research was to evaluate lithological separations of PFAS fractions as they are transported in the vadose zone of a historically (1979) contaminated site where Aqueous Film Forming Foam (AFFF) formulations (3M Lightwater™ and Ansulite™) have been used for fire training exercises. Surface and subsurface soils, and groundwater samples were collected across the site and a total of 29 PFAS compounds were selected as target analytes. The results indicated a distinct profile of PFAS concentration with depth at most of the test bores, exhibiting separation of PFAS as transported in vadose zone soils. Perfluorooctanoic acid (PFOA), Perfluorooctane sulfonic acid (PFOS), and Perfluorohexane sulfonic acid (PFHxS) were the predominant compounds detected in the site samples and they have been found in near-surface soils (<3 m) with concentrations declining with depth. The concentration of the 6:2 fluorotelomer sulfonate showed little change with depth in most of the test bore wells. The percentage concentration of each compound relative to the sum of PFAS, and the ratio of PFHxS/PFOS with depth, suggested transformation processes. Despite the relatively high solubility of PFAS, and that the application of AFFF has been ceased for some years at the site, there were still significant concentrations of PFAS adsorbed to the vadose zone soils that acted as ongoing sources of contamination to groundwater.
Advances in the fate and transport of perfluoroalkyl and polyfluoroalkyl substances (PFAS) in the vadose zone soil:
- The detection of a suite of PFAS as they migrated from surface soil to the groundwater.
- Determination of separation of PFAS precursors in the vadose zone which are statistically distinguishable among environmental media.
- Critical evaluation of vadose zone precursor transport and transformation is key for remediation and management strategies.
- Evaluation of soil geochemistry as it related to PFAS in environmental media.
Perfluoroalkyl and polyfluoroalkyl substances (PFAS) are persistent organic contaminants that have been increasingly reported for their adverse effects on ecological systems and human health. They are listed in the Stockholm Convention on Persistent Organic Pollutants as chemicals of concern to human health (McCarthy et al., 2017; Naidu et al., 2020). PFAS are a class of synthetic fluorinated hydrocarbons that have been used in many industrial and consumer products since the 1950s. PFAS-based aqueous film-forming foam (AFFF) has been widely used without emission control by municipalities, the oil and gas industry, airport facilities, and defense in extinguishing hydrocarbon-based fires due to its efficiency from the early 1970s (Moody and Field, 2000). The repeated use of AFFF, particularly at military sites during fire training and emergency response, has led to AFFF-contaminated groundwater and soil, which is a significant source of environmental PFAS. A broad range of these substances has been detected in the environment, wildlife, and humans worldwide (Buck et al., 2011; Das et al., 2015).
The vadose zone contamination could be a potential source of long-term PFAS influx to the groundwater. It is critical to attain improved insight into the fundamental processes that control the fate and transport of PFAS as it migrates from surface soil to groundwater (Weber et al., 2017). This problem is exacerbated when sites are contaminated with complex mixtures such as the fluorinated-organic compounds present in AFFF. The failure to fully understand the fate and transport mechanism in the subsurface has implications on the development of remedial solutions to address all forms of contamination present and on the accurate evaluation of risk.
Typically, AFFF is used in either a 3 or 6% aqueous solution by volume and is potentially released to the environment during training, emergency response, or maintenance and testing at those concentrations (Anderson et al., 2016; Weber et al., 2017). Polyfluoroalkyl substances, often a major constituent of AFFFs and other products, can transform into perfluoroalkyl acids (PFAAs), which are extremely recalcitrant to further transformation (Weber et al., 2017). PFAAs include both perfluorinated sulfonates and carboxylates which are relatively mobile in groundwater but tend to associate with the organic carbon fraction of soil and sediment (Zareitalabad et al., 2013; Xiao et al., 2017). The exact composition of each AFFF formulation is proprietary and is retained as confidential information by the various companies that manufactured and supplied AFFF. AFFF originally sold by 3M contained PFAS synthesized by electrochemical fluorination (manufactured by 3M) and synthesized via telomerisation (all other manufacturers). The 3M products contained fully fluorinated perfluoroalkyl sulfonic acids (PFSAs), and for all other manufacturers the carbon chains are not fully fluorinated (Anderson et al., 2016). The fluorotelomers have been shown to exclusively degrade to perfluorooctanoic acid (PFOA) and other perfluoroalkyl carboxylic acids (PFCAs) in microcosm and computational studies (Ellis et al., 2004). Perfluoroalkyl sulfonamides and their derivatives can degrade to PFOS and other PFSAs (Avendaño and Liu, 2015). The unknown chemical composition in AFFF and their potential degradation pathways makes it challenging to predict the fate and transport of PFAS based on laboratory investigations (Anderson et al., 2020).
PFAS have one of the strongest chemical bonds (C–F) known, which makes them resistant to degradation in the environment (Miralles-Marco and Harrad, 2015; Mahinroosta and Senevirathna, 2020). The C-F chain and head groups in the molecules of PFAS could induce binding of PFAS to soils which makes them difficult to eliminate from soil environments. Traditional methods of soil remediation have not been successful in their reduction or removal from the environment (Das et al., 2013; Mahinroosta and Senevirathna, 2020). Given the unique surfactant properties of PFAS, and heterogeneous subsurface environments, multiple partitioning mechanisms should be considered when characterizing the fate and transport of PFAS. The partitioning mechanisms which affect PFAS include hydrophobic and lipophobic effects, electrostatic interactions, and interfacial behaviors. PFSAs are more strongly sorbed than their PFCA homologs and longer chain PFAAs are more strongly sorbed than shorter chain PFAAs (ITRC Environmental Fate and Transport for Per- and Polyfluoroalkyl Substances, 2020). These compounds are persistent in the environment, transfer easily through water flow (water-soluble), can travel long distances in both saturated and unsaturated soil environments, and contaminate both groundwater and soil (Miralles-Marco and Harrad, 2015; Mahinroosta and Senevirathna, 2020).
In addition to the above mentioned uncertainties in understanding the fate and transport of PFAS, studies reporting the occurrence and distribution of PFAS in environmental samples from AFFF impacted sites are still somewhat scarce. There is a lack of case studies with high resolution data, which is crucial for validation of laboratory investigations. Therefore, the purpose of this investigation was to evaluate PFAS separation in the vadose zone as it leached to the groundwater via rainfall recharge.
The study investigated the depth-wise distribution of PFAS in one particular site and provided insights on their fate and transport. Specific objectives addressed in this study are to: (1) report the detection frequency and environmentally-relevant concentrations for a suite of PFAS; (2) determine whether or not the various PFAS fractions, expressed as a percentage of the sum of PFAS, provides a way of investigating in situ transformation; and (3) critically evaluate the percentage reduction of PFAS compounds as they migrated from the surface soil zone as empirical evidence of separations of PFAS and precursor transformation. The research findings describe the fate and transport of PFAS in the vadose zone and inform future studies related to PFAS separations in unsaturated subsurface.
The site is located in New South Wales (NSW), Australia and is an established air force base with known historic AFFF release for fire training and emergency response (Figure 1). The 3M AFFF was used at the site from ~1976 to 2003/2004, which has been identified as the source of soil and groundwater contamination at the site. The site is located within the Cumberland Basin situated at the western margin of the Sydney basin and lies on an elevated terrace defined by the Clarendon formation (Clark and Jones, 1991). The main water-bearing lithology shows silty sand, coarse sand, and coarse gravels at a depth of ~12.5 m below ground surface (bgs). The regional formations of natural soil encountered within the investigation area were generally dominated by brown/light orange sands, and clayey sands with an average standing water table (SWT) of 12.5 m bgs. The general flow direction of the aquifer is northeast and has a horizontal hydraulic conductivity of 0.02–2.4 m/day and a high yield (Figure 1). The aquifer system can be considered as a continuous layer which has a base of dense thick clayey deposits. Recharge is due in part to subsurface contributions from the surrounding catchment and in part to direct local infiltration of precipitation from the surface. Based on the results of the site investigations, two hydrogeological units were identified in the study area. A shallow drainage channel “perched aquifer' was encountered at ~1.5 m bgs with a limited lateral extent within the investigation area (Figure 1). This variability is consistent with a flood plain depositional environment where channel and overbank deposits interacted over time. The perched aquifer refers to unconfined groundwater within the Holocene and Pleistocene to mid-Holocene formation. The 15 test bores were used to define the lateral extent of the perched aquifer, four of which were completed as groundwater monitoring bores to a bore depth of 7 m bgs within the perched aquifer where stiff dense clay was observed.
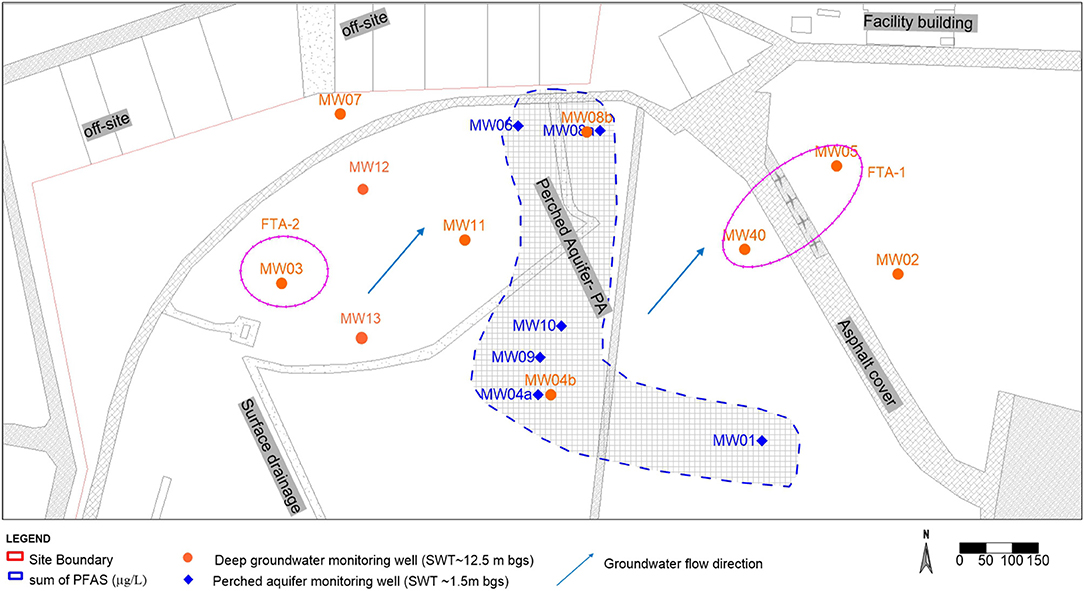
Figure 1. Aerial schematic of the former fire training area (FTA) at the site (near MW05), illustrating the location of soil test bores and groundwater wells. The extent of the shallow drainage channel (perched aquifer) is also delineated.
The subsurface lithological formations observed during the installations of groundwater monitoring wells and soil bores exhibited distinctive layer formations (Table 1). Detailed lithological/soil bore log data and cross-sectional profiles are presented in the Supplementary Figures 1–3.
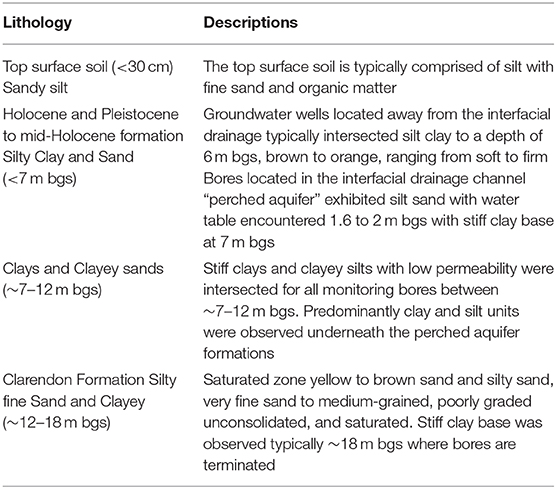
Table 1. General subsurface geology of the site.
The land use at the site is currently covered with grass paddocks, a large asphalt aircraft taxiway, and adjacent off-site residential blocks and on-site facility buildings (Figure 1). The climate, soil properties, land use and groundwater depth has a significant influence on the hydraulic conditions and the dispersal of contaminants to the groundwater and the perched aquifer (Renger et al., 1986). Consequently, the water table in the perched aquifer has significant seasonal variability, low in yield, flat hydraulic gradient, and a limited quantity of water in the formation due to its limited lateral extent. The climate at the site is slightly arid as the mean rainfall from records of ~24 years at the site is 741.2 mm per annum (Bureau of Meteorology, 2020). The groundwater recharge for the shallow drainage is directly from rainfall. The meteorological station at the site reported mean yearly average evapotranspiration of 600–700 mm and mean rainfall 719.1 mm (Bureau of Meteorology, 2020). The groundwater recharge for the shallow drainage is directly from rainfall.
The site investigation targeted evaluations of the spatial and vertical distribution of PFAS compounds in vadose zone soils, supplemented with samples of groundwater and aquifer solids. The vadose zone soil core samples were collected using the Comacchio GEO 405 drilling rig equipped with direct push technology (DPT). Groundwater samples were collected from an existing and newly installed network of monitoring-well clusters. Soil test bore locations and groundwater monitoring wells across the site are shown in Figure 1. A total of 14 groundwater samples were collected during 2018–20 from existing and newly installed wells. The 50 soil samples were collected at the discrete interval of 1 m and/or where a change in soil lithology was observed from surface soil to aquifer solids at the bottom of the monitoring well depth from DPT spilt core sampler. Each soil/aquifer solids sample consisted of a minimum of 100 g and the samples were collected into a 250 mL high-density polyethylene (HDPE) container. The soil properties were determined following standard methods documented in Rayment (1992). Briefly, for the determination of pH and EC, soil was equilibrated with deionized water at a 1: 5 (soil: water; w/v) ratio. Soil slurry was mechanically shaken for 60 min, and the pH and EC were measured in the suspension (The LAQUA benchtop data log meter, Australia). The total organic carbon (TOC) was measured by combustion method using the LECO CNS elemental analyser (Australia). Dissolved organic matter in soil was determined using the TOC analyser (Shimadzu, Japan). Cation exchange capacity of the soil was determined at the natural pH of the soil according to (Gillman and Sumpter, 1986).
Groundwater samples were analyzed for field water quality parameters using YSI® tools (dissolved oxygen, oxidation-reduction potential, temperature, pH, and specific conductance). The geochemical parameters (cations and anions) were measured by Inductively coupled plasma mass spectrometry (ICP-MS) and Ion Chromatography (IC), and total organic carbon (TOC) was analyzed using TOC analyser (TOC-LCSH Shimadzu). The groundwater samples were centrifuged at 5,000 rpm for 30 min and filtered using polypropylene syringes and filters prior to being diluted using Methanol before PFAS analysis. Duplicate measurements of ~30% of the groundwater samples produced good sample reproducibility (<20% relative standard deviation on average) for PFOS, PFHxS, PFOA, and PFHxA fractions. One field blank and one equipment blank were collected per sampling event, which exhibited near method detection limits. All known or suspected PFAS-containing materials were avoided during sample collection, handling, and transport. Supplementary Tables 4–7 summarizes groundwater analysis.
All analytical standards, such as perfluorinated carboxylates, perfluorinated sulfonates, perfluorooctane sulfonamide (FOSA), 6:2 fluorotelomer sulfonate (6:2 FTS), and 8:2 fluorotelomer sulfonate (8:2 FTS) were purchased from Wellington Laboratories (full list in Supplementary Table 1). All other solvents and chemicals were purchased from Sigma Aldrich or Fisher Scientific at the highest purity available.
Soil samples were extracted using a method similar to (Schröder, 2003; Higgins et al., 2005). In brief, 100 g soil samples in HDPE containers were homogenized manually before subsampling 15 g (n = 3) into a 50 mL centrifuge tube. A PFAS surrogate (13C-PFOS, 13C-PFOA) was added to the soil, and 2.5 mL 0.1% ammonium hydroxide in methanol was added to the tube, followed by vortexing and then sonication at 35°C for 30 min. The mixtures were further shaken at 200 rpm prior to centrifugation to obtain the extract. The procedure was repeated another two times and the extracts were combined. The volumes of extracts were below 1 mL after evaporation in a N2 drier after being neutralized using an excess amount of acetic acid. The extracts were made into 1 mL after drying. The concentrated extracts were transferred to 2 mL microcentrifuge tubes containing 0.25 mg Envirocarb. The mixtures were mixed by vortexing, and shaken at 150 rpm for 20 min and then centrifugation at 12,000 rpm. The extracts were filtered using polypropylene syringes and filters. After extraction, the samples were analyzed using high-performance liquid chromatography coupled with tandem mass spectrometry (LC-MS/MS, Agilent 1260 infinity, Agilent Triple Quad 6470) for PFAS. Groundwater samples were also analyed by LC-MS/MS. The limit of reporting (LOR) for each PFAS in each environmental matrix are presented in Supplementary Table 1. Of the 29 target PFAS, only those that exceeded the LOR are presented and discussed in detail (Supplementary Table 2). A simple linear regression was conducted to evaluate the depthwise relationships between soil properties and the concentrations of PFAS fractions for each monitoring well.
The soil lithology is described in Table 1. Typically, low pH values were observed with near surface soil samples (<3 m bgs) spatially representative of the site with pH ranging from 5.7 to 7.6, with an average pH of 6.5 ± 0.57. The soils from most test bores with depth >3 m bgs had neutral to slightly alkaline pH of 7.52 ± 0.32. The average cation exchange capacity (CEC) for the surface soils (up to 3 m bgs) was 3.08 ± 1.97 cmol/kg, and 5.75 ± 2.68 cmol/kg for the subsurface soils (>3 m). The lithology is generally classified as silty loam with organics and roots at the surface soil <30 cm. The vadose zone soil is characterized as sandy silt with low TOC content (0.29% ± 0.12%). The unconfined aquifer soil chemistry is characterized as neutral to slightly alkaline (average pH 8.12 ± 0.64) and the perched aquifer has a pH of 7.68 ± 0.17, and as low plasticity silty sand with TOC <1% and CEC of 4.78 ± 0.07 cmol(-)/kg.
The groundwater chemistry data (Supplementary Tables 4–7) for the perched aquifer and regional unconfined aquifer system indicates relatively equivalent calcium and sodium concentrations, as well as chloride concentrations, indicating that the aquifers are likely connected. The Na/Cl ratio in groundwater at the MW1, 4, and 6, compared with the unconfined aquifer, provides evidence of surface water infiltration to groundwater from surface recharge. The major ion composition (calcium, magnesium, sodium, potassium, sulfate, carbonate/bicarbonate, and chloride), with cations being dominated by sodium, indicated that more saline water is interacting with fresh water (Supplementary Tables 4, 6). Monitoring wells where PFAS concentrations were reported as less than the LOR were generally lower in sodium than at the wells at or near the inferred plume.
The groundwater field parameters indicated that the groundwater is lower in pH for both the perched aquifer (5.76 ± 0.60) and the unconfined aquifer (6.51 ± 0.46). The groundwater has fresh to brackish groundwater conditions with values ranging from 366 to 3,318 μS/cm for the unconfined aquifer (mean of 1,959 ± 1,218 μS/cm), and the shallow perched aquifer exhibiting freshwater conditions (mean of 546 ± 307 μS/cm). The unconfined aquifer is characterized as aerobic with high dissolved oxygen (DO) concentrations (i.e., 0.3 ± 0.21 mg/L), and variable oxidation-reduction potential (ORP) values (ranging from −108.3 to 218 mV with a mean value of −8.98 ± 153.5). The groundwater chemistry also revealed high sulfate concentrations for the unconfined aquifer (2.82 ± 1.79 mg/L) but lower values for the perched aquifer system (1.03 ± 0.44 mg/L).
Supplementary Table 2 lists the concentrations of only the PFAS, particularly major fractions including but not limited to PFHxS, PFHxA, PFOS, PFOA, and 6:2 FTS, whose concentrations were greater than LOR. The sum of individual PFAS that were measured at each test bore is also shown and is also referred to as total PFAS (Supplementary Table 2). Soil samples that were analyzed for non-volatile petroleum hydrocarbons were below the LOR. The source area for PFAS was identified by the groundwater data near the fire training area FTA-1 to the eastern side of the site close to MW05 and MW02 and FTA-2 around MW03, that is, an historical source zone. Elevated concentrations of most PFAAs were apparent across study sites. The spatially variable percentages of individual PFAS relative to total PFAS in the vadose zone soil suggest the possible use of 2 types of AFFF at the site (Figures 2, 5). For example, the maximum ratios of each of 6:2 FTS and PFHxS to total PFAS a near the source location FTA-1 (MW05) were 5.5 and 35%, respectively, whereas the respective ratios were 99 and 6.5% near FTA-2 (MW03). This result is in agreement with the historical report that two types of AFFF were used at the site. Similarly, the overall spatial and vertical distribution of PFAS at the investigation area demonstrated distinctive source zone characteristics (Figure 2).
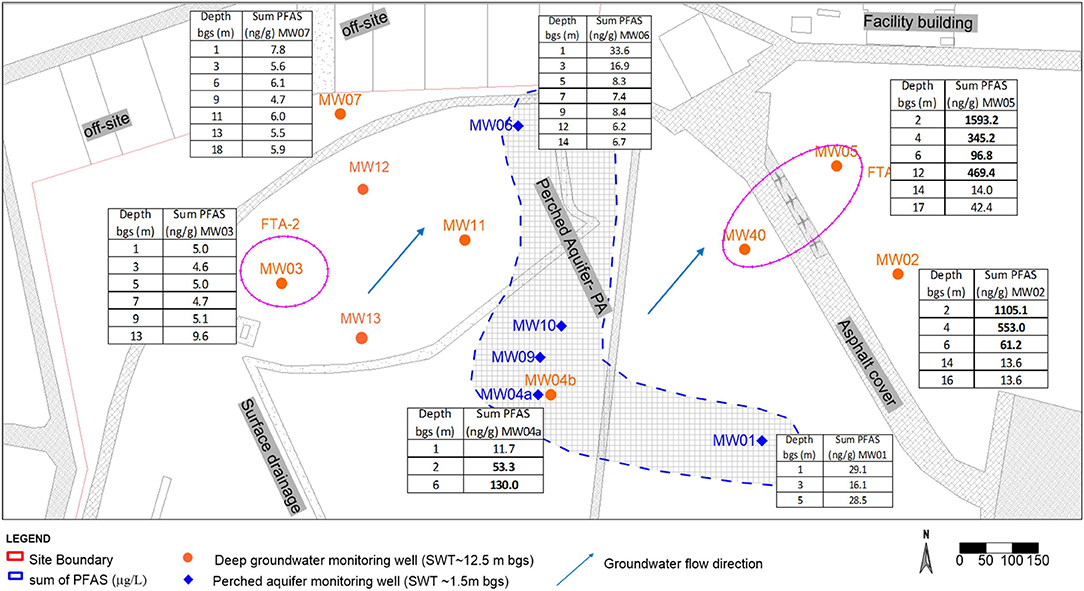
Figure 2. Sum of PFAS spatial distribution at the site.
Aquifer solids for the unconfined system were also collected at the water table during the installation of the monitoring wells, that is sample depth ~18.0 m bgs as shown in Figures 2, 3. The areal extent of contamination of the vadose zone and aquifer solids (Figure 2) was similar to the areal extent of contamination in the groundwater (Figure 3). The Sum of PFAS along the soil profile to the bottom groundwater bore depth is indicated in Figure 2.
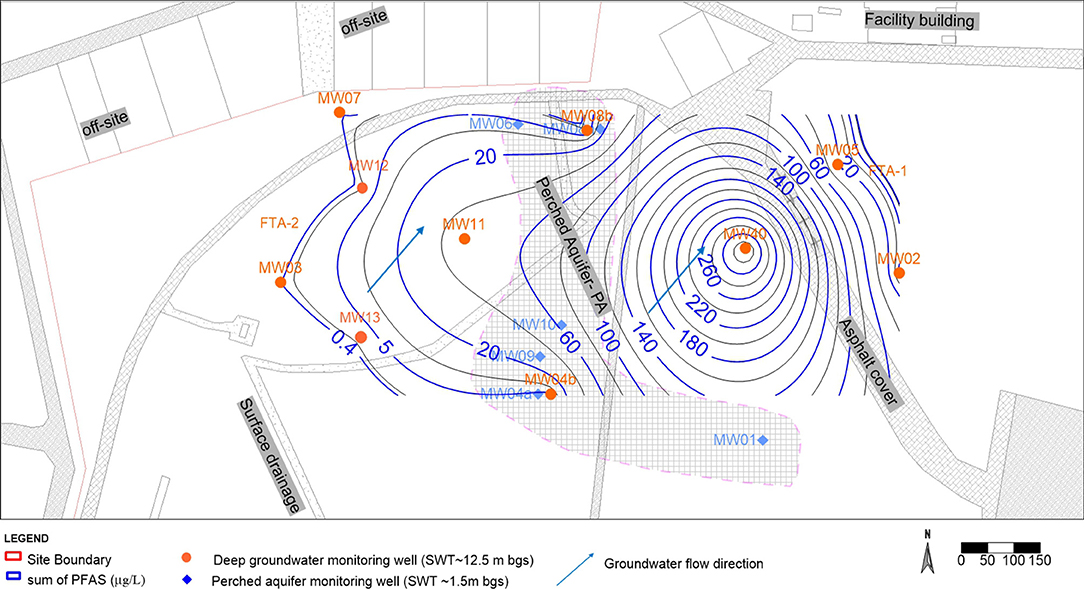
Figure 3. Unconfined aquifer sum of PFAS plume (μg/L).
The maximum sum of PFAS in subsurface soils reached 1593.24 μg/kg around the source zone (MW05). The highest values of total PFAS concentrations were observed near-surface soils (<3 m), particularly near the ground surface zones, with concentrations generally declining with depth (Figures 2, 4). Total PFAS at MW05 exhibited elevated concentrations near 12 m bgs, which may be attributed to air-water interfacial effects and likely from the groundwater table fluctuations (Lyu et al., 2018).
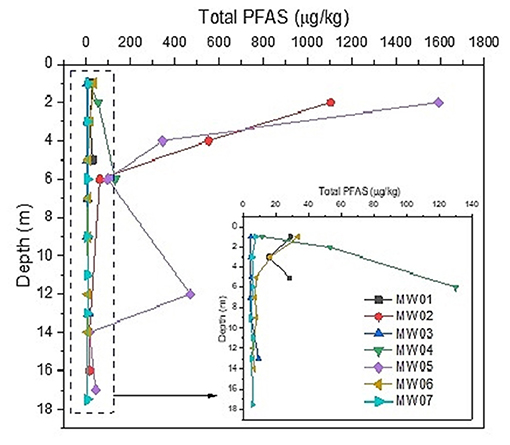
Figure 4. Sum of PFAS along soil profile to bottom groundwater bore depth. Standing water table in the formation is indicated.
In general, there was a significant reduction in the concentration of individual PFAS with depth (for example, PFOS reduced by 97% within the top 4 m layers at MW02), except 6:2 FTS which showed an increase within 4 m from the ground surface (Figure 5). This could be attributed to the different mobilities of PFAS compounds. For instance, PFHxS was heavily concentrated in the top profile of most test bores (e.g., MW06 and bores outside the confined aquifer regions) and then showed a sharp decline of 95% within the top 3 m bgs before remaining reasonably constant beyond 3 m bgs. Except for PFOS, the other PFAS in MW06 showed similar trends, although the decrease in concentrations from the ground surface to the subsurface was less marked. However, PFOS increased to 10.3 μg/kg at 3 m bgs in MW06, below which it showed a significant decline in its concentration. In contrast, the concentration of fluorotelomers, such as the 6:2 FTS, showed little change with depth in most of the test bore wells (Figure 5). The surface of metal oxides in soils would be expected to be positively charged at acidic pH ranges; hence, appreciable anion exchange capacity may result in soils with significant amounts of metal oxides, thereby favoring the sorption of anionic PFAS (Naidu et al., 1990; Oliver et al., 2020). The mass of each of the constituents of PFAS sum to a higher value in the upper zones of the vadose zone, with up to a 10-fold difference even after 16 years since the application of AFFF and with the FTA not in use at the site.
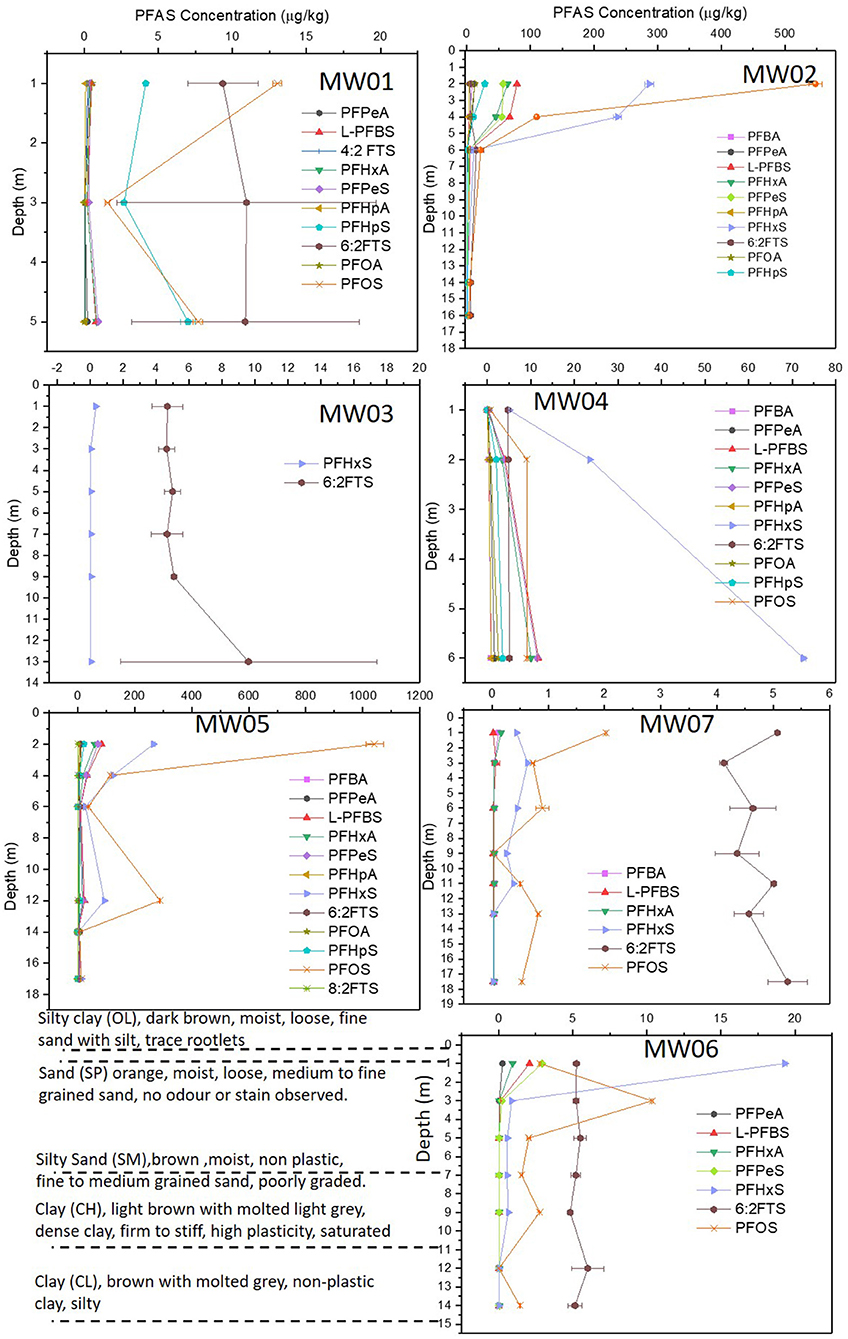
Figure 5. Distribution of PFAS along the depth of groundwater wells.
Furthermore, the depth-wise correlations between the concentration of individual PFAS and the geochemical properties of the vadose zone soil were examined for each of the seven test bores up to 17 m bgs. Only the results for MW02 and MW04 are shown in the Supplementary Table 3. At MW02, for example, there was generally a positive depth-wise correlation (r) between pH and the concentration of each PFAS, except for 6:2 FTS that showed exhibited a negative correlation. Overall, the relationships between soil properties and depth-wise PFAS distribution did not follow a consistent trend for all monitoring wells. Previous studies have reported that soil organic carbon (Higgins and Luthy, 2006; Li et al., 2019), pH and cation exchange capacity (CEC) (Campos Pereira et al., 2018), and some minerals (Johnson et al., 2007; Hellsing et al., 2016), have significant effects on the PFAS adsorption.
The different concentration of each PFAS along the vadose zone soil profile may also suggest competitive sorption effects as governed by soil properties, as shown in Figure 3. The higher residual concentration in the unsaturated zone near the source area demonstrated that PFAS is present and bound to the soil and could be a potential source of long-term PFAS influx to the groundwater even after 16 years of inactivity. Similarly, elevated concentrations were detected in the perched aquifer, which subsequently acted as ongoing contributions as sources at the site. Despite the limited lateral extent of the shallower standing water table depth, it is anticipated that the presence of PFAS in the perched groundwater (see section 4.4) is likely to contribute significantly to the overall groundwater impact and surface water drainage off-site as a major migration pathway. This finding determined the remediation strategy that was adopted for the site, where removing the top impacted soil will reduce the remediation cost of the groundwater plume. A full understanding of the fate and transport mechanisms in the subsurface has implications on the development of remedial solutions to address all forms of contamination present (Houtz et al., 2013).
The detection of 6:2 FTS and 8:2 FTS in the unsaturated subsurface soil and groundwater (Supplementary Table 2) indicated that the fluorotelomer-based AFFF Ansulite™ was also used at the site, which is supported by the historical evidence that showed the use of two different AFFF products at the site (Prevedouros et al., 2006). The signature of PFAS composition varied between test bores; however, there was a similarity between nearby bores such as MW02 and MW05 (Figure 5). The higher proportions of PFOS (61%), PFHxS (21%), PFOA (1%) and PFHxA (4%) relative to total PFAS concentrations were observed in aquifer solids near the burn pit (MW05). However, upgradient test bores comprised of 6:2 FTS constituting up to 88% with only 8.9% PFOS, 0.34% PFHxS, and 0.7% PFHxA. The perched aquifer solids had higher PFAS concentrations than the overlying unsaturated soil, caused by significant fluctuations of water tables and the relatively shallow standing water depth of 1.5 m bgs. In general, the compositions of PFAS in the perched and unconfined aquifer solids were similar, with PFOS, PFHxS, and PFHxA being the dominant fractions. It should be cautioned that the total PFAS reservoir may vary and there could be more PFAS on the site which are yet to be determined by TOP or total organic fluorine assays in this study.
While the observed spatial distributions of PFAS were likely due to a combination of factors, including differential transport and precursor transformation, the differences between the percentages of PFOS and PFPeA, PFHxA, PFHpA, and PFHxS suggested that differential transport was a primary factor determining vertical distributions. Each PFAS behaved slightly differently in the environment depending on the length of the fluorinated carbon chain and the alkyl group (Higgins and Luthy, 2006; McGuire et al., 2014). For example, longer chain PFAS are less soluble and can sorb to soil particles more readily than short chain PFAS. This means that the less soluble and longer chain PFAS may remain in the soil near a source area for longer periods than the more soluble and mobile fluorotelomer fractions of PFAS. This explains the higher composition of the longer chain PFAS, as a percentage of total PFAS near the ground surface zone (Figure 6), except for the relative concentration of 6:2 FTS which remained consistent with depth.
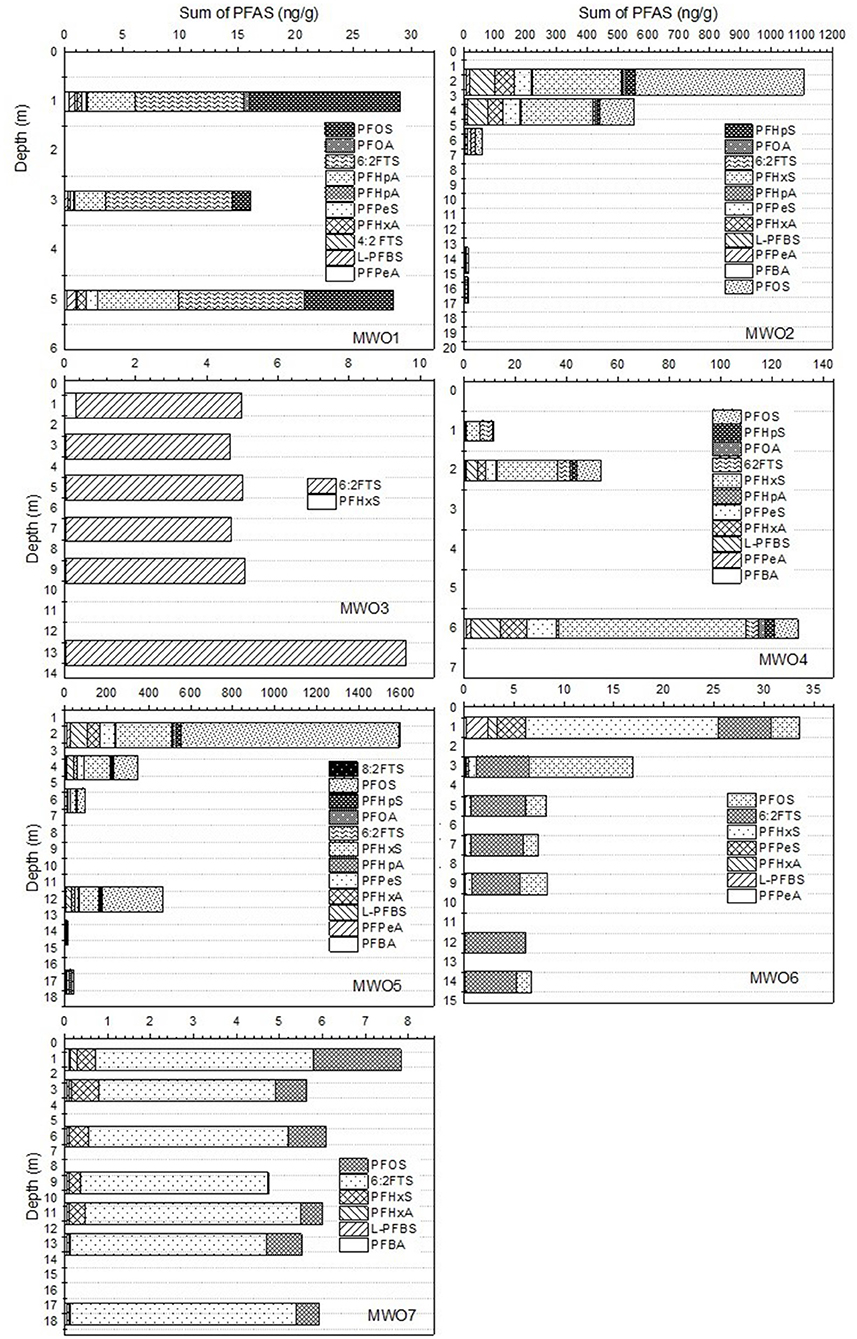
Figure 6. Subsurface soil and aquifer solid PFAS compositions along vertical profile.
The composition of PFAS fractions in the soil varied with the spatial location, with similar values for neighboring bores, such as MW03 and MW07 which had 6:2 FTS as a major constituent, compared to MW05 and MW02 where PFOS and PFHxS were dominant (Figure 6). Compared to the other complex mixtures, such as the fluorinated-organic compounds present in AFFF, the results showing a significant separation of fractions indicated that fluorotelomers were more vertically mobile than PFOS, PFHxA, and PFHxS. The separations of these compounds as they migrate along the vadose zone exhibited significant correlations with the soil pH, with increased PFAS retention expected in the zones with lower pH. Also, being a sandy silt, the vadose zone soil with low TOC (0.29 ± 0.12%) can be expected to play a minor role in sorption of dissolved PFAS. Similarly, despite the average soil CEC (5.75 ± 2.68 cmol/kg) reported for >3 m in the lithology, the pH in these zones was alkaline; hence, most soil oxides would be negatively charged which does not favor anion exchange capacity (Naidu et al., 1990).
The alteration in PFAS analyte concentrations could be from potentially natural in situ transformation. The PFHxS:PFOS ratio can be related to the degree of precursor transformation (Houtz et al., 2013; McGuire et al., 2014) electrochemical fluorination based AFFF formulations from 1988 to 2001 were shown to have ratios between 0.08 and 0.14. In situ generation of PFHxS could lead to an increase in the PFHxS:PFOS ratio (McGuire et al., 2014). The PFHxS:PFOS ratios observed in the vadose zone near the ground surface at the FTA was 0.25 (MW05, 2 m bgs), 0.52 (MW02, 2 m bgs), and increased to 0.72 (MW05, 6 m bgs), as well as decreased to 0.49 (MW02, 4 m bgs) for the wells 960 m apart, with no consistent trends to all bores and depths. There were minimal percentages of fluorotelomer precursors and elevated PFHxS:PFOS ratios in some locations (MW03 and MW07) vs. (MW02 and MW05), suggesting different sources or that precursor transformation contributed to the PFHxS concentrations. In addition, test bore MW07 had PFHxS:PFOS ratios up to 12.4 at 9 m bgs (Figure 4), suggesting preferential transport of PFHxS relative to PFOS, and mobile precursors (perhaps intermediates). Precursors retained in the unsaturated zone could also indicate transformation into more mobile PFAAs, which then migrate to the saturated zone. Similar processes of sorption and desorption, as well as precursor transformation, in the unsaturated and shallow saturated zones are likely occurring at the FTA/source area.
The PFAS concentration in the groundwater plume is briefly described to substantiate the contribution of the vadose zone as the source to groundwater contamination. Similar to the spatial distribution of PFAS in the vadose soil and aquifer solids, most of the contamination of PFAS in the groundwater was located within the historical source zone FTA (Figure 3). In both perched and unconfined aquifers, PFOS and PFHxS were present at high concentrations. In particular, the highest PFOS concentrations in the unconfined aquifer system was found to the east of the site (Figure 3). Monitoring well MW40 was exiting well prior to this research work. Consequently, vadose zone soil concentration at this location was not obtained. The groundwater concentration data at this location of the unconfined aquifer was the highest at the site and represented the hotspot for the groundwater plume which could be represented within soil source concentration area of FTA-1. Additional plumes are presented in the Supplementary Figure 1. In addition, based on the relative extent of the groundwater plumes alone, there was no strong evidence for differential transport of different chain length perfluorocarboxylates or perfluorinated sulfonates, given that the limited extent of delineation of the plume covered only 10,000 m2 with 300 m plume length.
In this study, the relationships between PFAS and the geochemical properties of soil in a real field contaminated site were investigated and insights were provided on the fate and transport of PFAS. The site investigated in this study was contaminated by PFAS, especially PFOS, PFOA, PFHxS, PFHxA, and 6:2 FTS. The separation of these compounds as they migrated along the vadose zone exhibited significant correlations with the soil properties, such as pH. The site is typically low in total organic carbon and dissolved organic carbon; hence, the associated relationships between these soil properties and PFAS sorption were not significant. The PFAS distribution along the soil profile could be influenced by both geochemical and hydrogeological parameters of the site. The higher proportion of PFAS in the vadose zone remained in near ground surface soil (<3 m bgs). The perched aquifer system defined with limited lateral extent and with an average standing water table of 1.5 m bgs exhibited higher groundwater PFAS concentration than the deeper regional unconfined aquifer system even after 16 years of not using the fire training area. There is a lack of case studies with high resolution data, which is crucial for validation of laboratory investigations. Therefore, the raw data from this research findings are presented in supporting informations to inform future studies related to PFAS separations in unsaturated subsurface. These findings will improve the strategies for the management of PFAS in soils and groundwater by: (i) improving the understanding of the fundamental fate and transport properties that impact the mobility of PFAS in the vadose zone; and (ii) allowing more accurate environmental and human health risk assessments.
The original contributions presented in the study are included in the article/Supplementary Materials, further inquiries can be directed to the corresponding author/s.
RN and DB conceived of the presented idea, developed the theory, and planned the experiments. DB, SC, and MD supervised the fieldwork and conducted sampling. DB, AU, and CA contributed to sample preparation, verified the analytical methods, and laboratory analysis. RN, YL, and DB provided critical feedback and helped shape the research, analysis, and contributed to the final manuscript. All authors contributed to the article and approved the submitted version.
This research was funded by CRC CARE Pty Ltd., Australia. The research was conducted in the laboratories of the GCER at the University of Newcastle.
The authors declare that the research was conducted in the absence of any commercial or financial relationships that could be construed as a potential conflict of interest.
The authors acknowledge the Cooperative Research Center for Contamination Assessment and Remediation of the Environment (CRC CARE) and the Global Centre for Environmental Remediation (GCER), University of Newcastle (UoN), Australia for providing support. The authors are grateful to the Australian Department of Defence for granting access to the site and support.
The Supplementary Material for this article can be found online at: https://www.frontiersin.org/articles/10.3389/frwa.2020.597810/full#supplementary-material
Anderson, R. H., Long, G. C., Porter, R. C., and Anderson, J. K. (2016). Occurrence of select perfluoroalkyl substances at US air force aqueous film-forming foam release sites other than fire-training areas: field-validation of critical fate and transport properties. Chemosphere 150, 678–685. doi: 10.1016/j.chemosphere.2016.01.014
Anderson, R. H., Thompson, T., Stroo, H. F., and Leeson, A. (2020). US department of defense-funded fate and transport research on per-and polyfluoroalkyl substances at aqueous film-forming foam-impacted sites. Environ. Toxicol. Chem. doi: 10.1002/etc.4694
Avendaño, S. M., and Liu, J. (2015). Production of PFOS from aerobic soil biotransformation of two perfluoroalkyl sulfonamide derivatives. Chemosphere 119, 1084–1090. doi: 10.1016/j.chemosphere.2014.09.059
Buck, R. C., Franklin, J., Berger, U., Conder, J. M., Cousins, I. T., de Voogt, P., et al. (2011). Perfluoroalkyl and polyfluoroalkyl substances in the environment: terminology, classification, and origins. Integr. Environ. Assessment Manage. 7, 513–541. doi: 10.1002/ieam.258
Bureau of Meteorology (2020). Australian Government Bureau of Meteorology. Available online at: http://www.bom.gov.au/web (accessed October 20, 2020).
Campos Pereira, H., Ullberg, M., Kleja, D. B., Gustafsson, J. P., and Ahrens, L. (2018). Sorption of perfluoroalkyl substances (PFASs) to an organic soil horizon – effect of cation composition and pH. Chemosphere 207, 183–191. doi: 10.1016/j.chemosphere.2018.05.012
Clark, N. R, and Jones, D.C (1991). Penrith 1:100 000 Geological Sheet 9030, 1st Edn. Sydney. NSW: Geological Survey of New South Wales; Department of Minerals and Energy.
Das, P., Kambala, V., Mallavarapu, M., and Naidu, R. (2013). Remediation of perfluorooctane sulfonate in contaminated soils by modified clay adsorbent—a risk-based approach. Water Air Soil Pollut. 224, 1–14. doi: 10.1007/s11270-013-1714-y
Das, P., Megharaj, M., and Naidu, R. (2015). Perfluorooctane sulfonate release pattern from soils of fire training areas in Australia and its bioaccumulation potential in the earthworm eisenia fetida. Environ. Sci. Pollut. Res. 22, 8902–8910. doi: 10.1007/s11356-013-1782-y
Ellis, D. A., Martin, J. W., De Silva, A. O., Mabury, S. A., Hurley, M. D., Sulbaek Andersen, M. P., et al. (2004). Degradation of fluorotelomer alcohols: a likely atmospheric source of perfluorinated carboxylic acids. Environ. Sci. Technol. 38, 3316–3321. doi: 10.1021/es049860w
Gillman, G., and Sumpter, E. (1986). Modification to the compulsive exchange method for measuring exchange characteristics of soils. Soil Res. 24, 61–66. doi: 10.1071/SR9860061
Hellsing, M. S., Josefsson, S., Hughes, A. V., and Ahrens, L. (2016). Sorption of perfluoroalkyl substances to two types of minerals. Chemosphere 159, 385–391. doi: 10.1016/j.chemosphere.2016.06.016
Higgins, C. P., Field, J. A., Criddle, C. S., and Luthy, R. G. (2005). Quantitative determination of perfluorochemicals in sediments and domestic sludge. Environ. Sci. Technol. 39, 3946–3956. doi: 10.1021/es048245p
Higgins, C. P., and Luthy, R. G. (2006). Sorption of perfluorinated surfactants on sediments. Environ. Sci. Technol. 40, 7251–7256. doi: 10.1021/es061000n
Houtz, E. F., Higgins, C. P., Field, J. A., and Sedlak, D. L. (2013). Persistence of perfluoroalkyl acid precursors in AFFF-impacted groundwater and soil. Environ. Sci. Technol. 47, 8187–8195. doi: 10.1021/es4018877
ITRC Environmental Fate and Transport for Per- and Polyfluoroalkyl Substances (2020). PFAS Technical and Regulatory Guidance Document, PFAS Fact Sheets. Washington, DC: Interstate Technology & Regulatory Council (ITRC).
Johnson, R. L., Anschutz, A. J., Smolen, J. M., Simcik, M. F., and Penn, R. L. (2007). The adsorption of perfluorooctane sulfonate onto sand, clay, and iron oxide surfaces. J. Chem. Eng. Data 52, 1165–1170. doi: 10.1021/je060285g
Li, F., Fang, X., Zhou, Z., Liao, X., Zou, J., Yuan, B., et al. (2019). Adsorption of perfluorinated acids onto soils: kinetics, isotherms, and influences of soil properties. Sci. Total Environ. 649, 504–514. doi: 10.1016/j.scitotenv.2018.08.209
Lyu, Y., Brusseau, M. L., Chen, W., Yan, N., Fu, X., and Lin, X. (2018). Adsorption of PFOA at the air–water interface during transport in unsaturated porous media. Environ. Sci. Technol. 52, 7745–7753. doi: 10.1021/acs.est.8b02348
Mahinroosta, R., and Senevirathna, L. (2020). A review of the emerging treatment technologies for PFAS contaminated soils. J. Environ. Manage. 255:109896. doi: 10.1016/j.jenvman.2019.109896
McCarthy, C., Kappleman, W., and DiGuiseppi, W. (2017). Ecological considerations of per- and polyfluoroalkyl substances (PFAS). Curr. Pollut. Rep. 3, 289–301. doi: 10.1007/s40726-017-0070-8
McGuire, M. E., Schaefer, C., Richards, T., Backe, W. J., Field, J. A., Houtz, E., et al. (2014). Evidence of remediation-induced alteration of subsurface poly- and perfluoroalkyl substance distribution at a former firefighter training area. Environ. Sci. Technol. 48, 6644–6652. doi: 10.1021/es5006187
Miralles-Marco, A., and Harrad, S. (2015). Perfluorooctane sulfonate: a review of human exposure, biomonitoring and the environmental forensics utility of its chirality and isomer distribution. Environ. Int. 77, 148–159. doi: 10.1016/j.envint.2015.02.002
Moody, C. A., and Field, J. A. (2000). Perfluorinated surfactants and the environmental implications of their use in fire-fighting foams. Environ. Sci. Technol. 34, 3864–3870. doi: 10.1021/es991359u
Naidu, R., Nadebaum, P., Fang, C., Cousins, I., Pennell, K., Conder, J., et al. (2020). Per- and poly-fluoroalkyl substances (PFAS): current status and research needs. Environ. Technol. Innov. 19:100915. doi: 10.1016/j.eti.2020.100915
Naidu, R., Syers, J. K., Tillman, R. W., and Kirkman, J. H. (1990). Effect of liming and added phosphate on charge characteristics of acid soils. J. Soil Sci. 41, 157–164. doi: 10.1111/j.1365-2389.1990.tb00053.x
Oliver, D. P., Li, Y., Orr, R., Nelson, P., Barnes, M., McLaughlin, M. J., et al. (2020). Sorption behaviour of per- and polyfluoroalkyl substances (PFASs) in tropical soils. Environ. Pollut. 258:113726. doi: 10.1016/j.envpol.2019.113726
Prevedouros, K., Cousins, I. T., Buck, R. C., and Korzeniowski, S. H. (2006). Sources, fate and transport of perfluorocarboxylates. Environ. Sci. Technol. 40, 32–44. doi: 10.1021/es0512475
Rayment, G. E. (1992). Australian Laboratory Handbook of Soil and Water Chemical Methods, eds, G. E. Rayment and F. R. Higginson (Melbourne, VIC: Inkata Press).
Renger, M., Strebel, O., Wessolek, G., and Duynisveld, H. M. (1986). Evapotranspiration and groundwater recharge – A case study for different climate, crop patterns, soil properties and groundwater depth conditions. Zeitschrift Pflanzenernährung Bodenkunde 149, 371–381. doi: 10.1002/jpln.19861490403
Schröder, H. F. (2003). Determination of fluorinated surfactants and their metabolites in sewage sludge samples by liquid chromatography with mass spectrometry and tandem mass spectrometry after pressurised liquid extraction and separation on fluorine-modified reversed-phase sorbents. J. Chromatogr. A 1020, 131–151. doi: 10.1016/S0021-9673(03)00936-1
Weber, A. K., Barber, L. B., LeBlanc, D. R., Sunderland, E. M., and Vecitis, C. D. (2017). Geochemical and hydrologic factors controlling subsurface transport of poly- and perfluoroalkyl substances, cape cod, massachusetts. Environ. Sci. Technol. 51, 4269–4279. doi: 10.1021/acs.est.6b05573
Xiao, X., Ulrich, B. A., Chen, B., and Higgins, C. P. (2017). Sorption of poly- and perfluoroalkyl substances (PFASs) relevant to aqueous film-forming foam (AFFF)-impacted groundwater by biochars and activated carbon. Environ. Sci. Technol. 51, 6342–6351. doi: 10.1021/acs.est.7b00970
Zareitalabad, P., Siemens, J., Hamer, M., and Amelung, W. (2013). Perfluorooctanoic acid (PFOA) and perfluorooctanesulfonic acid (PFOS) in surface waters, sediments, soils and wastewater - A review on concentrations and distribution coefficients. Chemosphere 91, 725–732. doi: 10.1016/j.chemosphere.2013.02.024
Keywords: PFAS, Perfluoroalkyl and polyfluoroalkyl substances, vadose zone, remediation, site characterization
Citation: Bekele DN, Liu Y, Donaghey M, Umeh A, Arachchige CSV, Chadalavada S and Naidu R (2020) Separation and Lithological Mapping of PFAS Mixtures in the Vadose Zone at a Contaminated Site. Front. Water 2:597810. doi: 10.3389/frwa.2020.597810
Received: 22 August 2020; Accepted: 07 December 2020;
Published: 23 December 2020.
Edited by:
Huilian Ma, The University of Utah, United StatesReviewed by:
Hans Peter Heinrich Arp, Norwegian Geotechnical Institute, NorwayCopyright © 2020 Bekele, Liu, Donaghey, Umeh, Arachchige, Chadalavada and Naidu. This is an open-access article distributed under the terms of the Creative Commons Attribution License (CC BY). The use, distribution or reproduction in other forums is permitted, provided the original author(s) and the copyright owner(s) are credited and that the original publication in this journal is cited, in accordance with accepted academic practice. No use, distribution or reproduction is permitted which does not comply with these terms.
*Correspondence: Dawit N. Bekele, ZGF3aXQuYmVrZWxlQG5ld2Nhc3RsZS5lZHUuYXU=; Ravi Naidu, cmF2aS5uYWlkdUBuZXdjYXN0bGUuZWR1LmF1
Disclaimer: All claims expressed in this article are solely those of the authors and do not necessarily represent those of their affiliated organizations, or those of the publisher, the editors and the reviewers. Any product that may be evaluated in this article or claim that may be made by its manufacturer is not guaranteed or endorsed by the publisher.
Research integrity at Frontiers
Learn more about the work of our research integrity team to safeguard the quality of each article we publish.