
95% of researchers rate our articles as excellent or good
Learn more about the work of our research integrity team to safeguard the quality of each article we publish.
Find out more
ORIGINAL RESEARCH article
Front. Water , 23 November 2020
Sec. Water and Critical Zone
Volume 2 - 2020 | https://doi.org/10.3389/frwa.2020.578602
This article is part of the Research Topic Chemical Export to River Systems from the Critical Zone View all 11 articles
 Anna L. Hermes1,2*
 Haruko M. Wainwright3
 Oliver Wigmore2,4,5
 Nicola Falco3
 Noah P. Molotch2,6
 Eve-Lyn S. Hinckley1,2
Climate warming in alpine regions is changing patterns of water storage, a primary control on alpine plant ecology, biogeochemistry, and water supplies to lower elevations. There is an outstanding need to determine how the interacting drivers of precipitation and the critical zone (CZ) dictate the spatial pattern and time evolution of soil water storage. In this study, we developed an analytical framework that combines intensive hydrologic measurements and extensive remotely-sensed observations with statistical modeling to identify areas with similar temporal trends in soil water storage within, and predict their relationships across, a 0.26 km2 alpine catchment in the Colorado Rocky Mountains, U.S.A. Repeat measurements of soil moisture were used to drive an unsupervised clustering algorithm, which identified six unique groups of locations ranging from predominantly dry to persistently very wet within the catchment. We then explored relationships between these hydrologic groups and multiple CZ-related indices, including snow depth, plant productivity, macro- (102->103 m) and microtopography (<100-102 m), and hydrological flow paths. Finally, we used a supervised machine learning random forest algorithm to map each of the six hydrologic groups across the catchment based on distributed CZ properties and evaluated their aggregate relationships at the catchment scale. Our analysis indicated that ~40–50% of the catchment is hydrologically connected to the stream channel, lending insight into the portions of the catchment that likely dominate stream water and solute fluxes. This research expands our understanding of patch-to-catchment-scale physical controls on hydrologic and biogeochemical processes, as well as their relationships across space and time, which will inform predictive models aimed at determining future changes to alpine ecosystems.
Alpine regions are essential sources of fresh water to lower elevation ecosystems and ~50% of people around the globe (Winkler, 2019). In addition, they are also some of the most vulnerable to climate change (Buytaert et al., 2011; Seidl et al., 2011; Ernakovich et al., 2014). Many researchers have shown that alpine areas are already warming and predict that they may experience the highest levels and impacts of warming well before other ecosystems (e.g., Bradley, 2004; Cannone et al., 2007; Pepin et al., 2015; Winkler, 2019). These impacts include changes to the timing, amount, and quality of water exported from alpine catchments (Barnett et al., 2005; Horton et al., 2006; Tague, 2009; Schneeberger et al., 2015), among others.
Water export from the alpine zone is controlled both by sources—including, in some cases, glaciers (Cannone et al., 2008), and precipitation, primarily as snow (Bales and Harrington, 1995; Bales et al., 2006)—and their mediation by the critical zone (CZ; Tague and Grant, 2009; Penna et al., 2011; Yang et al., 2014; Baraer et al., 2015; Brooks et al., 2015; Winnick et al., 2017). Many past studies have focused on determining the effects of a warming climate on the distribution of snowpack (Ishida et al., 2018; Smith and Bookhagen, 2018) as well as the timing and rate of snowmelt that feeds the CZ (Magnusson et al., 2012; Musselman et al., 2017; Jennings and Molotch, 2020). An important next step is to delve into how the physical structure of the CZ determines patterns of water storage and routing within alpine catchments; this is baseline knowledge required to predict changes to alpine water balances as well as ecological and biogeochemical functions.
Multiple scales of the CZ affect patterns of alpine water storage and routing. In particular, topographical features, both at macro- (102->103 m) and micro-scales (<100-102 m) play important roles. At the macro-scale, the characteristics of complex relief, including hillslope position, aspect, and slope, which interact with winds to influence snow accumulation and redistribution (Winstral et al., 2002). At the micro-scale, freeze-thaw processes produce morphological features, such as patterned ground, nivation depressions, and solifluction lobes and terraces that affect snow depth, water storage, and hydrologic connectivity (Russell, 1933; Matsuoka et al., 2005; Wainwright et al., 2015, 2017). At still finer, sub-meter scales, soil properties and vegetation influence infiltration rates (see Hinckley et al., 2014b; Brooks et al., 2015). When combined, these characteristics of the CZ create areas of like hydrologic behavior, characterized by both the quantity and rate of change of soil water storage.
Mapping areas of like hydrologic behaviors across alpine catchments is an important step toward understanding the aggregate effects of patch-scale processes. For example, mapping the spatial distribution of hydrologic behaviors aids in quantifying the temporal stability of soil water storage (Lee and Kim, 2019) and water transit time distributions (Harman, 2015). These are both key factors that complicate hillslope modeling studies (Kirchner, 2016; Guio Blanco et al., 2018) and efforts to quantify chemical export from the CZ (Ward et al., 2019). Furthermore, different hydrologic behaviors may map to important ecosystem control points (Bernhardt et al., 2017)—areas that support continuously or periodically high rates of biogeochemical cycling (Darrouzet-Nardi and Bowman, 2011; Knowles et al., 2015; Chen et al., 2020). Finally, patch-scale variability in snowmelt and soil moisture affects plant phenology and physiology (Bjorkman et al., 2018; Winkler et al., 2018) and results in catchment-scale spatial patterns of plant community composition and productivity (Seastedt, 2020) and responses to change (Suding et al., 2015; Winkler et al., 2016). Thus, the capacity to identify and predict the spatial organization of distinct hydrologic behaviors is relevant not only to understanding how alpine systems will change under a warmer climate, but also to addressing outstanding questions in hydrology and CZ science more broadly. This capacity has remained a challenge, however, because of limitations in our approach to connect point-scale hydrologic observations to broader scales, which is necessary for understanding catchment processes such as water and chemical export.
Previous analytical approaches have included a combination of terrain-derived topographic indices and other CZ-related properties to predict hydrologic states. For example, Western et al. (1999) used the upslope flow accumulation area and potential radiation indices to determine soil moisture values, finding that these variables were useful for prediction at different points in time. Williams et al. (2009) applied a similar approach to show that both static (e.g., slope, aspect, soil texture) and dynamic (e.g., snowmelt) properties controlled soil moisture spatiotemporal variability. More recently, Oroza et al. (2018) were able to accurately predict soil water storage over multiple years, relying on high-resolution soil moisture sensor network data from the Southern Sierra Critical Zone Observatory. Moving beyond prediction of point-scale surface soil moisture measurements, terrain-derived indices have also been used to identify areas of connected saturation or hydrologic connectivity to stream channels (Ali et al., 2013) and explain subsurface flow variability (Bachmair and Weiler, 2012). Combined, these studies demonstrate analytical approaches that connect multiple scales of physical properties with observations to explain spatiotemporal variability in soil water storage across landscapes.
Another set of analytical approaches extrapolate hydrologic, biogeochemical, and ecological measurements beyond the locations of field observations by combining point measurements, topographic indices, and statistical models. At Hubbard Brook Experimental Forest, Gillin et al. (2015) extrapolated soil hydropedons across a catchment with topographic wetness index, topographic position index, and bedrock-weighted upslope accumulation area using a multinomial logistic regression model. Another study by Wainwright et al. (2015) mapped carbon fluxes across arctic ice wedge polygons using high-resolution transects of geophysical and topographic metrics and support vector machine learning. Similarly, tower-based net ecosystem productivity, soil chamber CO2 flux measurements, and topographic indices were combined to calculate regions of a catchment that were either strong carbon sources or sinks (Emanuel et al., 2011). Falco et al. (2019) developed a new data fusion and machine learning approach that assimilated remote sensing and surface geophysical measurements to categorize plant communities and estimate soil moisture distributions across a lower montane-floodplain landscape in Colorado. This set of predictive modeling studies demonstrates a movement toward harnessing on the ground observations, remotely-sensed data, and statistical approaches to map integrated CZ processes at broader spatial scales.
Our study builds on these previous efforts to address this gap in our ability to connect point- or patch-scale hydrologic observations to broader spatial scales. We addressed three primary research questions: (1) Are there unique temporal trends, or hydrologic behaviors, in soil water storage across an alpine catchment? (2) Which CZ-related properties explain these different behaviors? and (3) What are the spatial scales that dictate the pattern of these hydrologic behaviors across an alpine catchment? To address these questions, we developed an analytical framework that integrates existing statistical approaches to (1) identify unique hydrologic behaviors from intensive in situ soil moisture observations, (2) explore CZ-related drivers of these behaviors, and then (3) map the occurrence and spatial pattern of behaviors across a study catchment. We apply this framework to an alpine system in the Colorado Rocky Mountains where physical properties of the CZ clearly exert control over hydrologic patterning at multiple scales. Developing this predictive capability to move from patch-scale measurements to catchment-scales is extremely valuable in alpine landscapes, due to their complexity, fragility, and societal importance as sources of fresh water.
We focused our research at the Niwot Ridge Long-term Ecological Research (NWT-LTER) site (40.05 N, 105.59 W), a high elevation, mountainous, alpine tundra ecosystem in the Colorado Rocky Mountains, U.S. This region, broadly, is part of the traditional territories of the Cheyenne, Ute, and Arapaho Peoples. The mean annual temperature is −4.1°C (Greenland and Losleben, 2001), although the annual minimum temperature has increased ~0.43°C per decade from 1953 to 2008, with the largest increases during July (McGuire et al., 2012). There is some evidence of spring warming (March–June) and winter cooling (October, December; McGuire et al., 2012). Annual precipitation is ~1,000 mm and long-term records at Niwot Ridge show that precipitation has increased by 60 mm per decade (Kittel et al., 2015). The majority (~80%) of precipitation falls as snow during winter and spring and localized convective rainstorms occur in the summer (Greenland and Losleben, 2001). Strong westerly winds redistribute snow, and topography dictates spatial patterns in snow accumulation and melt (Litaor et al., 2008). In turn, snow heterogeneity influences biogeochemical process rates (Darrouzet-Nardi and Bowman, 2011), solute transport (Perrot et al., 2014), and alpine plant community distributions (May and Webber, 1982; Caine, 1995). Snowmelt and streamflow typically peak during late May-June, and streamflow stops by late November (Williams and Caine, 2001). This climatology normally restricts the growing season to 1–3 snow-free months.
We used a 0.26 km2 headwater catchment within the North Boulder Creek Watershed as a study area (Figure 1). Ranging ~3,330 to 3,610 m in elevation, the study catchment is primarily south-facing, with east and west hillslopes. The upper portion of the catchment is alpine tundra, which transitions downslope to sub-alpine forest. A seasonally intermittent stream bifurcates the catchment and stream flow has been recorded since 1999 (Caine et al., 2020). Soils are typically ≤2 m deep and are categorized as Cryochrepts and Cryumbrepts, with some Cryorthents in areas without biota (Burns, 1980). Solifluction deposits, characterized by hummocks, turf- and stone-banked lobes and terraces, and ephemeral ponds are found throughout the catchment (Benedict, 1970); they are the dominant microtopographical features.
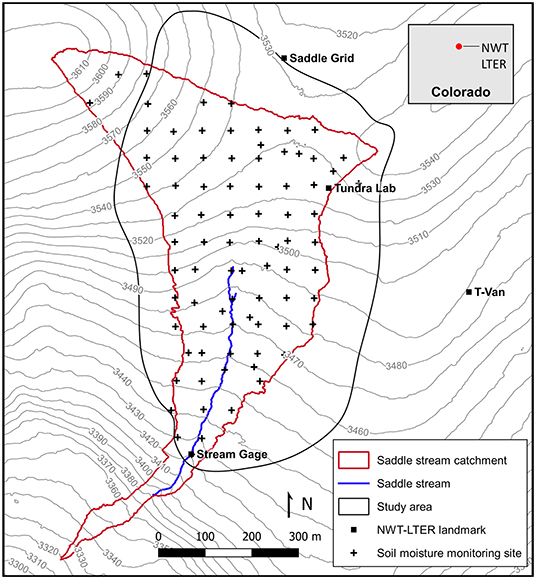
Figure 1. Headwater catchment (Saddle stream) of North Boulder Creek within the Niwot Ridge (NWT) Long-term Ecological Research (LTER) site in the Colorado Rocky Mountain Front Range. Repeat soil moisture measurements occurred at 84 locations (black “+”) and were combined with UAV-derived observations over the study area (black outline). Gray lines show 10 m elevation contours. The catchment outline and contours were derived from a 1 m digital terrain model (National Ecological Observatory Network, 2018).
During the summer of 2017, we established a grid of 84 monitoring locations across the study catchment. The locations were on roughly a 60 m × 60 m grid to maximize the spatial extent of monitoring across the landscape (Figure 1). We surveyed positions of monitoring locations to within 0.05 m using a GNSS rover receiver/antenna (Septentrio Altus APS3G) with dual band L1/L2 GPS and GLONASS functionality. Rover positions were differentially post-processed against base station observations from the five closest 1 second Continuously Operating Reference Stations (CORS) operated by the National Geodetic Survey (station codes: STBT, TMGO, P041, EC01, COFC). Two locations were marked by hand-held consumer grade GPS to 5 m accuracy. At each monitoring location, a 0.3 m × 0.3 m plot was established, with the northeast corner of the plot aligned with the surveyed point.
We measured surface soil moisture as a proxy for soil water storage. Repeat soil moisture surveys occurred weekly to biweekly with survey start dates on July 3, July 10, July 18, July 24, August 1, August 7, August 24, and September 8, 2017. The surveys began during late snowmelt, captured summer rainfall mid-July and August, and ended before snowfall recommenced in late September (Figure 3). Each survey took 2–4 days to complete. We measured soil moisture to 0.05 m depth five times within each 0.3 m × 0.3 m plot using a Delta-T Devices Ltd. SM-150 Soil Moisture Sensor. The five measurements captured fine-scale heterogeneity within plots, but we report soil moisture as plot averages. A site-specific calibration converted raw instrument voltages to volumetric soil moisture, which resulted in values >1.0 v/v for some locations (Supplementary Materials, Delta-T Devices Ltd. SM-150 Soil Moisture Sensor User Manual, v. SM150-UM-1.2, September 2016).
As part of a related study we completed weekly multispectral (red, green, blue, near infrared) photogrammetric surveys of the study catchment with an unmanned aerial vehicle (UAV). These flights were coordinated with our soil moisture surveys. Eight flights between June–August 2017 characterized spatial patterns of snow accumulation and depth and plant productivity (Wigmore and Molotch, 2018). Multispectral imagery collected at 0.03 m spatial resolution was used to derive 0.05 m orthomosaics and 0.10 m digital elevation models (DEM) using a Structure from Motion workflow (Westoby et al., 2012; Fonstad et al., 2013; Wigmore et al., 2019). Maximum snow depth (MSD) measured (21st June 2017) was calculated through DEM differencing against a snow free DEM (14th August 2017; Bühler et al., 2016; Webb et al., 2020) and accuracy assessed against extensive field-based snow depth measurements. From the multispectral surveys we calculated the Normalized Difference Vegetation Index (NDVI) for each date, which we use here as a proxy for plant productivity. We took this multi-temporal series and returned the maximum NDVI value for each pixel across the series, which is reported as max NDVI and is used as an index of peak productivity for the survey period.
We derived a 1 m digital terrain model (DTM) from publicly available LiDAR survey data. We downloaded raw .laz point cloud tiles over our area of interest from a National Ecological Observatory Network (NEON) aerial LiDAR survey of Niwot Ridge completed on September 4, 2017 (National Ecological Observatory Network, 2018). NEON point clouds are already classified by land cover/terrain features (e.g., ground, vegetation, building etc.); however, we re-classified the point cloud in ENVI LiDAR to better account for local terrain parameters and identify structures, low shrubs, trees, and bare ground. We calculated a 1 m DTM from the ground classified points and smoothed it to 5, 10, 20, 30, 65, and 100 m scales in MATLAB (v. 9.5.0.1033004, R2018b, Update 2) using the smooth2a function (Reeves, 2020).
We used the 1 m DTM to calculate a wide range of topographic indices. Topographic index calculations are detailed in the Supplementary Materials. In brief, we calculated: slope (both local, L, and macro, M), aspect, northness, eastness, flow accumulation (FA), topographic position index (TPI), the range in TPI across 20 m (TPIr), topographic wetness index (TWI), wind shelter (WS), convergence index (CI), the range in CI across 5 m (CIr), morphometric protection index (MPI), overland distance to channel network (OD2C), and vertical distance to channel network (VD2C; Supplementary Table 1). Slope, aspect, FA, TWI, and TPI indices were examined at a number of spatial scales (1, 5, 10, 20, 30, 65, 100, 200, and 300 m). We transformed indices that were strongly skewed to better approximate normal distributions or at least increase dispersion (Supplementary Table 1). All indices were scaled to account for differing means. Average topographic index values were extracted at the 84 soil moisture monitoring locations using either a 1, 5, or 10 m buffer radius around each location's GPS point. Topographic indices were visually inspected using QGIS (v. 3.12 Bucuresti). Collectively, we refer to the UAV-derived snow and NDVI layers and DTM-derived topographic indices as “CZ indices.”
We combined multiple statistical methods into a data analytical framework, which allowed us to (1) identify unique hydrologic behaviors from intensive in situ observations, (2) explore physical drivers with extensive remotely sensed parameters, (3) and map behaviors across broader spatial scales (Figure 2). The framework began with an unsupervised agglomerative hierarchical cluster analysis to identify groups of locations with like hydrologic behaviors within the study catchment. To cluster the locations, we included each location's time series of soil moisture; importantly, we included missing values for some monitoring locations due to snow cover. We calculated a Euclidean distance matrix and then used the hclust function in the base stats R package using a ward.D2 linkage method. This method minimizes within-group variance (Murtagh and Legendre, 2014), which was found to be most representative for grouping locations based on related studies in mountainous ecosystems (Devadoss et al., 2020). We visualized cluster separation using a dendrogram and a plot of the total within sum of squares for each increasing cluster number (Hastie et al., 2009). We named clusters of locations, “hydrologic groups,” which represented unique hydrologic behaviors.
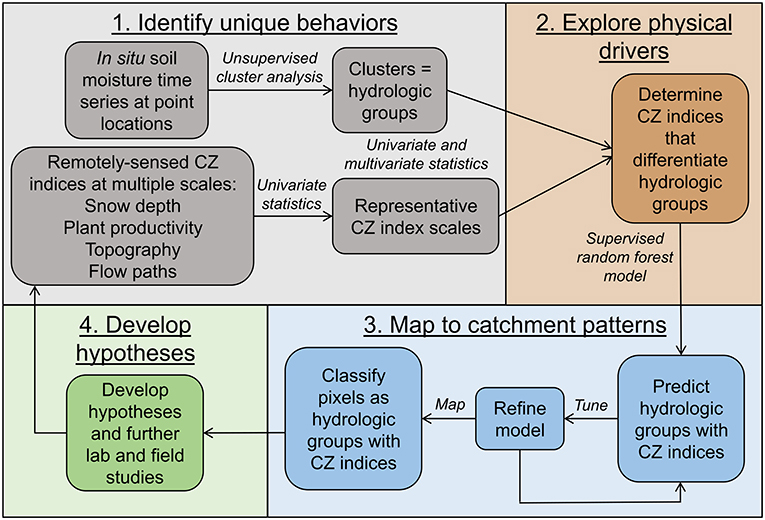
Figure 2. Analytical framework used to (1) identify unique hydrologic behaviors and landscape patterns from field observations, (2) explore critical zone (CZ) physical drivers underpinning groups of hydrologic behaviors, (3) map hydrologic behaviors beyond point scales, and (4) develop further hypotheses and studies.
We then used a suite of univariate and multivariate statistical analyses to identify CZ indices that had differences across hydrologic groups. First, we removed highly co-variate CZ indices that had a Pearson correlation coefficient ≥ ± 0.8, which was particularly useful for determining optimal micro- and macrotopographical spatial scales in our study catchment. Second, we reduced CZ indices to a final subset that differentiated at least two hydrologic groups using pairwise Wilcox tests with Bonferroni p-value adjustments (p < 0.1 significance threshold), visual examination of boxplots, and principal components analysis (PCA) and principal component (PC) biplots. The PCA analysis was primarily used as a visualization tool to understand the relationships among CZ indices and between hydrologic groups.
We used a supervised machine learning classification approach to extrapolate the hydrologic groups across the study catchment. We selected Breiman's (2001) random forest classification algorithm, which generates a large number of decision trees with bootstrapped sample data, and each tree is trained with a random selection of predictor variables. We selected random forest, because it does not assume underlying data distributions, avoids data overfitting, produces strong results compared to other machine learning-based classification methods, and performs well without substantial tuning (Breiman's, 2001; Liaw and Wiener, 2002; Cutler et al., 2007; Hastie et al., 2009; James et al., 2013). Furthermore, CZ indices seemed to separate hydrologic groups in a rule-based fashion.
We developed two random forest models: one with six hydrologic groups and the other with three. For both, we used the randomForest algorithm in the randomForest R package (v 4.6-14; Liaw and Wiener, 2002) to classify hydrologic groups using a suite of CZ indices as predictor variables. We used a grid-search approach to tune the number of predictor variables included in each tree and test the effect of different numbers of trees per forest. We selected the combination of hyperparameters that minimized “out-of-bag” (OOB) error and maximized Cohen's kappa coefficient (Cohen, 1960). Both models had a single observation per terminal node and bootstrapped samples without replacement, which produces less bias with unbalanced classes (Boehmke and Greenwell, 2020). The six-group model had one predictor variable per tree and 500 trees, while the three-group model used nine predictor variables and 250 trees. We performed leave-one-out cross-validation (LOOCV) to assess overall model accuracy and class-specific balanced accuracy (Kuhn, 2008; James et al., 2013). We also calculated the local variable importance, which is the increase in the percent of times a site was misclassified when a CZ index was permuted. Though local importance calculations are often noisy, they provided some indication of which indices best separated groups (Touw et al., 2013).
We then applied the random forest models to distributed CZ index maps to classify a hydrologic group for every pixel in the study area. We compared predicted maps to spatial patterns of hydrologic features observed during field surveys and high-resolution multispectral imagery across the study catchment to qualitatively evaluate model performance. Lastly, we calculated the areal extent of each hydrologic group across our study area. All statistical analyses were conducted in R, v. 4.0.0 (R Core Team, 2017).
Measurements collected in summer 2017 captured late snow melt, rainfall, and dry-down. The earliest UAV survey, June 21, occurred during peak streamflow (June 16–June 23; Figure 3) and measured a maximum snow depth of 4.8 m and median snow depth of 1.1 m (Supplementary Figure 1). During our first three soil moisture surveys (July 3, July 10, July 18), snow was still present at 12, 7, and 2 monitoring sites, respectively. Frequent convective thunderstorms began mid-July, and cumulative monthly rainfall peaked in August at 0.11 m (surveys 5–7; Figure 3). The catchment was completely snow-free by August 14, as shown by the high-resolution UAV imagery surveys. Between the 7th and 8th soil moisture surveys, precipitation was <0.001 m, and surveys ended before snowfall began again in late September (Figure 3).
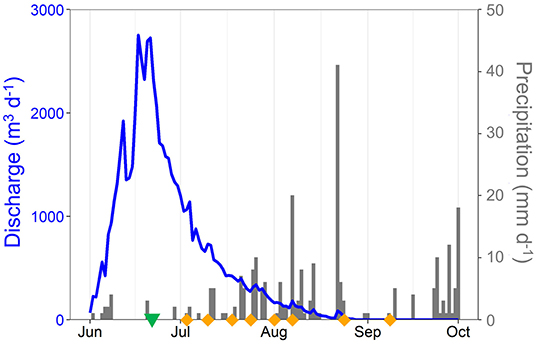
Figure 3. Summer 2017 climatology for the NWT Saddle stream catchment depicting stream discharge (blue line; Caine et al., 2020), precipitation (gray bars; Morse et al., 2020), date of our maximum snow depth UAV survey (green inverted triangle), and soil moisture surveys (yellow diamonds).
Soil moisture measurements reflected these seasonal patterns in snowmelt and rainfall. Overall, median soil moisture was highest for surveys 1, 6, and 7 at ~0.3 v/v (Figure 4A). It was lowest for surveys 3 and 8, near 0.1 v/v. The widest range in soil moisture, ~1.1 v/v, was during the first two surveys. By the final survey, 80% of sites had dried to < 0.2 v/v. Despite these overall trends, every survey had a wide range in soil moisture values with coefficients of variation across the catchment ~50 to 110.
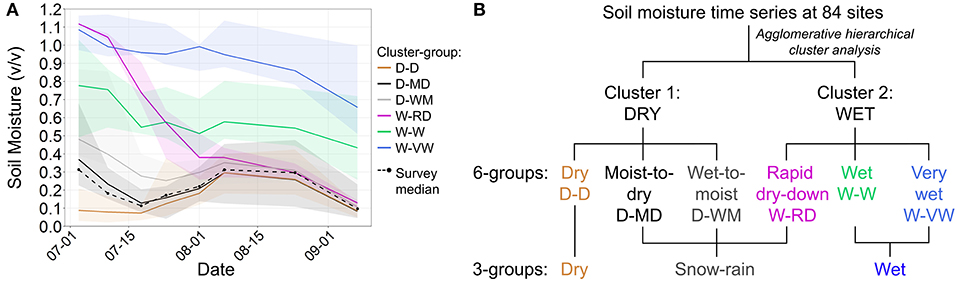
Figure 4. Soil moisture cluster analysis results. (A) Time series' of the overall soil moisture median (dashed black line) for each survey (black dots), and median (solid lines) and range (shaded area) in soil moisture for each of the six hydrologic groups. (B) Schematic of the relationships between clusters and hydrologic groups. Names and abbreviations correspond to those in Table 1.
Our unsupervised hierarchical cluster analysis revealed that monitoring locations assembled into two main clusters. The plot of within-sum-of-squares by cluster number showed an “elbow” at two clusters (Supplementary Figure 2). The locations in the first cluster had lower median soil moisture overall than the locations in the second cluster, and so we named them “DRY” (D) and “WET” (W), respectively. The D cluster locations exhibited a decline in soil moisture between surveys 1–3 in response to snowmelt, and then an increase in soil moisture later in the study period in response to summer rainfall events (Figure 4A). Locations in the W cluster had either wet (> 0.4 v/v) or very wet (≥0.8 v/v) soil moisture conditions during the first two surveys.
Using a dendrogram, we subdivided the D and W clusters into six groups of locations with common soil moisture quantities and temporal trends over the observed period (Supplementary Figure 3). We summarize the relationships between the two clusters and six hydrologic groups in Table 1 and Figure 4B. The first D group we named “dry” (D-D) since it had soil moisture ≤0.2 v/v during surveys 1-3. This group's median soil moisture peaked at ~0.3 v/v during surveys 6-7 and coincident with maximum summer rainfall (Figure 3). We named the second group “wet-to-moist” (D-WM). Median soil moisture was highest during the first survey at 0.5 v/v and then peaked again during surveys 6-7, similar to the D-D group. The third group, “moist-to-dry” (D-MD), had soil moisture values in between the D-D and D-WM groups. The fourth group, “rapid dry-down” (W-RD), had median soil moisture at 1.1 v/v which decreased approximately linearly to 0.13 v/v over the eight field surveys. The final two groups were either “persistently wet” (W-W; 0.4–1.0 v/v) or “persistently very wet” (W-VW; ≥ 0.8 v/v) until the last survey. We note that for each hydrologic group, its range in soil moisture values overlapped with one or more other groups (shaded areas, Figure 4A).
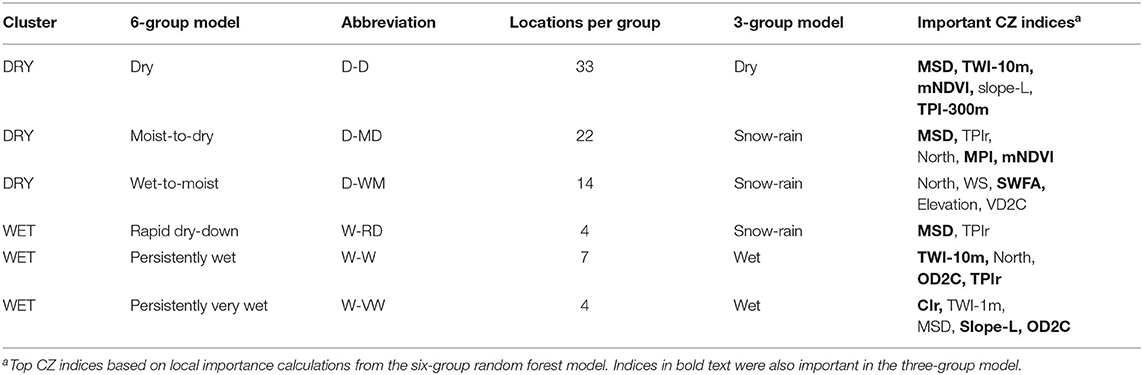
Table 1. Soil moisture clusters and hydrologic groups.
Critical zone indices were first narrowed by linear correlation analysis. We started with 47 CZ indices representing snow, plant productivity, macrotopography, microtopography, and flow accumulation patterns. Twenty-eight indices were highly co-variate with either the same index calculated at a different spatial resolution or another index representing similar topographic patterns (Supplementary Table 1). For example, we calculated slope at 1, 5, 10, 20, 30, 65, and 100 m scales, but all scales except 1 and 65 m had Pearson correlation coefficients ≥ ± 0.8. Thus, these two scales were retained to represent local slope and macro-slope, respectively. In another example, CI was highly correlated with TPI-30 m (r = 0.9) and so CI was removed.
With the 19 remaining CZ indices, we aimed to hone the CZ indices to a set that separated as many hydrologic groups as possible in univariate or multivariate space. Pairwise Wilcox tests determined that 11 CZ indices (MSD, mNDVI, OD2C, VD2C, CIr, TPIr, SWFA, TWI-1 m, TWI-10 m, TPI-300 m, and northness) had significant differences across one or more hydrologic groups (Supplementary Table 2). Four pairs of hydrologic groups could not be statistically separated by CZ indices, but five CZ indices (elevation, MPI, WS, slope-L, slope-M) did show trends toward differences when CZ indices were visualized using boxplots (Figure 5; Supplementary Table 2). While some CZ index values, such as slope-L and mNDVI, were more of a continuum across hydrologic groups (e.g., local slope or mNDVI), others clearly isolated one or more of them (e.g., OD2C, CIr; Figure 5).
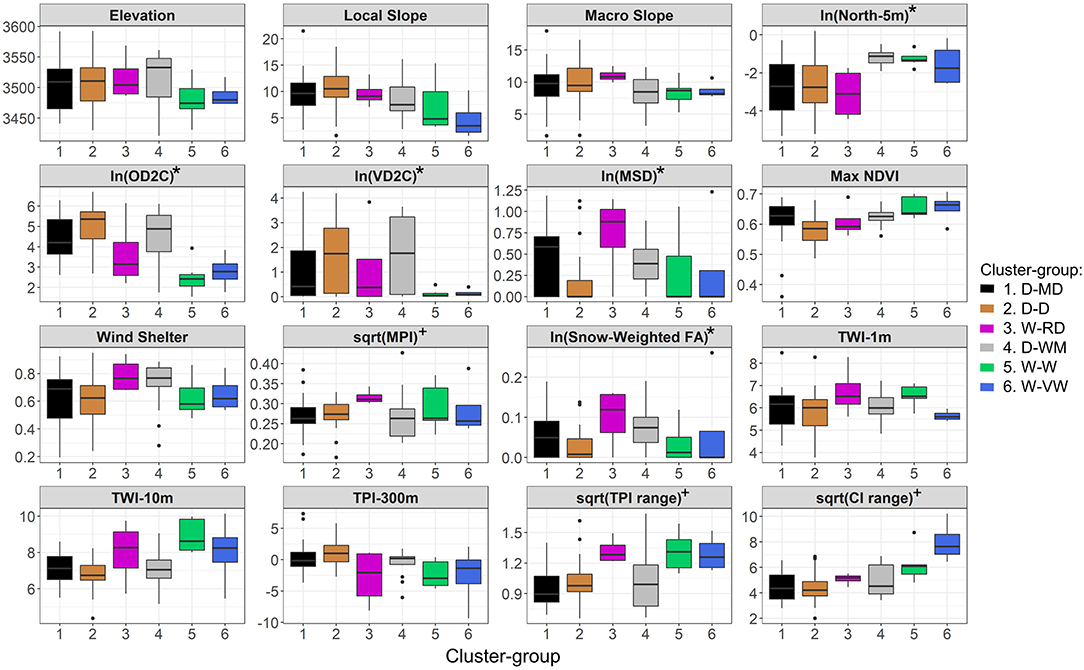
Figure 5. Hydrologic groups by CZ indices. Local slope and macro slope are in degrees. OD2C, overland distance to channel (meters); VD2C, vertical distance to channel (meters); MSD, maximum snow depth (meters); max NDVI, maximum normalized difference vegetation index; MPI, morphometric protection index; FA, flow accumulation; TWI, topographic wetness index, where higher values indicate flow accumulation; TPI, topographic position index, where “0” represents flat areas, while positive values are topographic highs and negative values are topographic lows; and CI, convergence index. “*”, indicates the index was transformed by natural log (ln) and “+” indicates the index was transformed by square root (sqrt).
Our PCA analysis showed relationships among CZ indices and hydrologic group separation in multivariate space. The first principal component (PC1) explained 28% of the CZ index variance and generally separated the D cluster from the W-W and W-VW groups (Figure 6A). The D cluster tended to have higher TPI-300 m, elevation, OD2C, and VD2C, while the W-W and W-VW groups had higher mNDVI, CIr, TWI-10 m, and TPIr. The second principal component axis (PC2) generally separated the D cluster from the W-RD group (Figure 6A) and explained 20% of overall variance. Plotting the first and third principal components (PC3), which explained an additional 15% of overall variance, further separated the D-D group from most others with higher TPI-300 m and slope, lower WS and SWFA, and was more south-facing (low northness index) compared with the rest of the groups (Figure 6B). Despite these patterns in PCA biplot space, no one group completely separated from the others, and the first three principal components only explained 63% of overall variance.
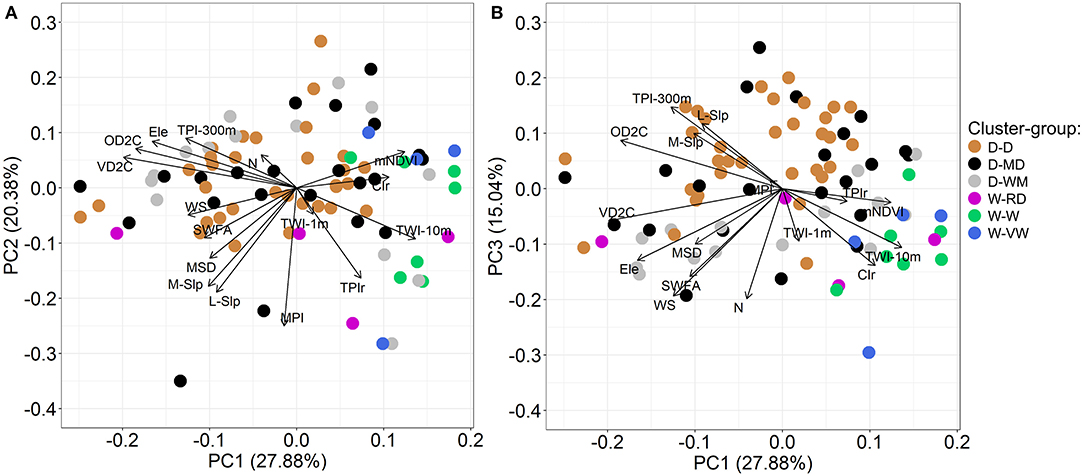
Figure 6. CZ index principal component analysis (PCA) biplots showing (A) PC1 vs. PC2 and (B) PC1 vs. PC3. Vector lengths are proportional to the variance of each CZ index, and the angle between vectors represents the correlation between CZ indices. Points are colored by hydrologic group. The x- and y-axes provide the percent variance explained by each PC.
We used random forest models to classify hydrologic groups across the study catchment using CZ indices as predictor variables. The six-group model included all 16 CZ indices and had an overall accuracy of 52.4% (Table 2). Some hydrologic group classifications were more accurate than others. Individual group balanced accuracy rates ranged from 49 to 80%. We reclassified our six hydrologic groups into three to increase sample numbers per group for random forest classification exercises. Locations classified as D-D remained the same across models, but locations classified into the D-MD, D-WM, and W-RD groups were combined into a “snow-rain” group (Table 1, Figure 4B). The remaining W-W and W-VW groups were combined into an overall “wet” group. The three-group random forest model had substantially improved overall accuracy at 71.4% and snow-rain group class balanced accuracy of 72% (Table 3). The wet group still had lower balanced accuracy than the others at 66%.
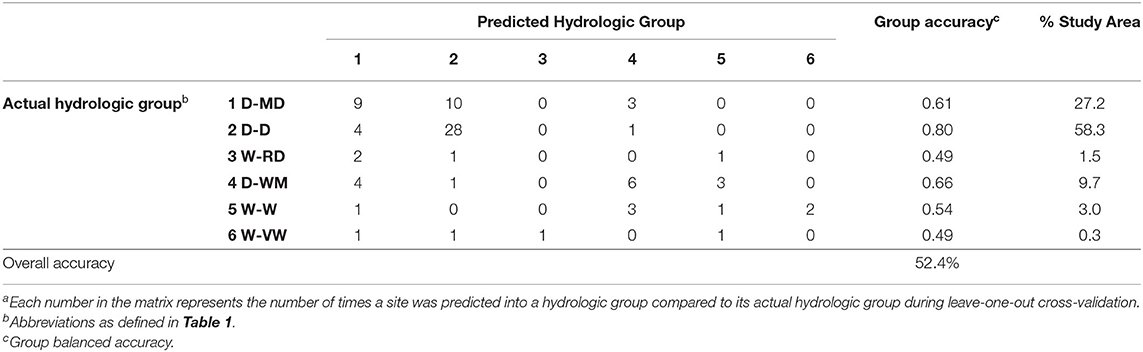
Table 2. Confusion matrix and accuracy for the six-group random forest modela.
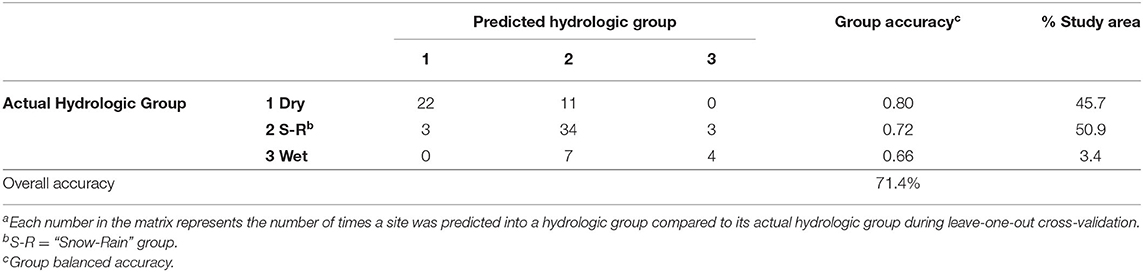
Table 3. Confusion matrix and accuracy for the three-group random forest modela.
Local importance calculations identified CZ indices underpinning each of the two main clusters (Table 1). Important CZ indices for the W cluster included CIr, TPIr, MSD, northness, OD2C, slope-L, TWI-1 m, and TWI-10 m, all of which represent microtopography or flow accumulation patterns. In contrast, CZ indices that differentiated the D cluster included mNDVI, WS, MPI, SWFA, northness, TPI-300 m, elevation, TPIr, and TWI-10 m. These indices represent snow accumulation and melt patterns driven by macrotopography and flow paths.
We then applied both the six- and three-group random forest models to distributed CZ index maps to classify each pixel in the study catchment (Figure 7). For the six-group model, the D-D group was mapped throughout the study area and encompassed the highest proportion of total area at 58.3% (Table 2). The upper portion of the catchment was mostly classified as a D-MD and D-WM zone (Figure 7A). These two groups made up 27.2 and 9.7% of the study area, respectively (Table 2). The middle area of the catchment was classified as the overall W cluster (W-RD, W-W, and W-VW; Figure 7A), with isolated patches of the W-W and W-VW groups also found along the eastern flank of the catchment. The W cluster accounted for ~5% of the total study area (Table 2). For the three-group model, the study area was classified as 46% dry, 51% snow-rain, and 3% wet (Table 3). The dry and snow-rain groups generally mapped to broad zones across the study area, with wet patches intermingling with the snow-rain group in the eastern half of the catchment (Figure 7B).
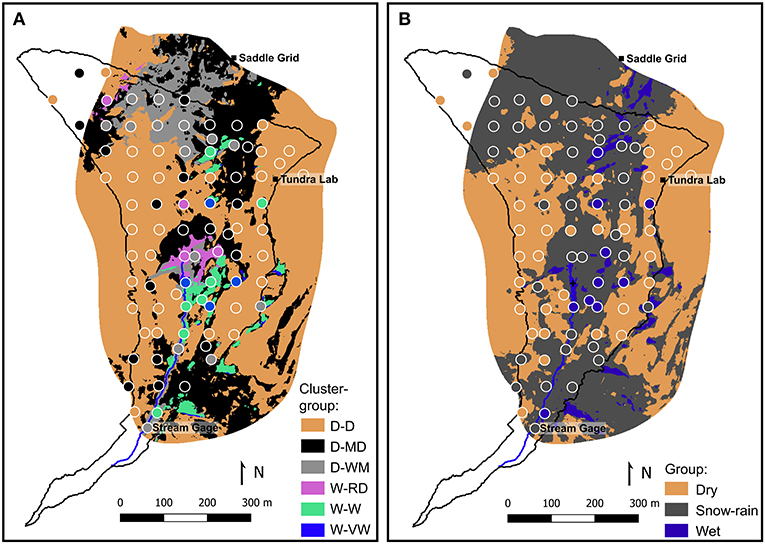
Figure 7. Predictions for the six- (A) and three- (B) hydrologic group random forest models. Colors reflect pixel-by-pixel hydrologic group classifications compared to observed classifications (dots).
Despite some uncertainty related to the six- and three-group maps, the spatial patterns of groups mirrored field observations of key hydrologic and topographic features across the study area (compare Figures 7, 8). In the upper portion of the catchment, mostly classified as D-MD and D-WM groups, snow caught between stone-banked solifluction terraces and accumulated in a wide “saddle” between two knolls. The saddle area had broad areas of wet and moist meadow plant communities, captured as W-W and W-VW groups. Eastern and western flanks of the catchment were predominated by dry meadow plant communities, captured as the D-D group in our models. Mid-catchment, a snow field persists every year until mid-August, adjacent to a broad zone of highly productive shrub and wet meadow plant communities. This area was classified as the W-RD, W-W, and W-VW groups. From this mid-catchment snow field and wet meadow, the stream channel emerged, and continued into sub-alpine forest in the lower portion of the catchment. Throughout the catchment, we observed seeps and ephemeral ponds in areas of local microtopographic variability, which were largely captured as D-MD, W-W, and W-VW groups.
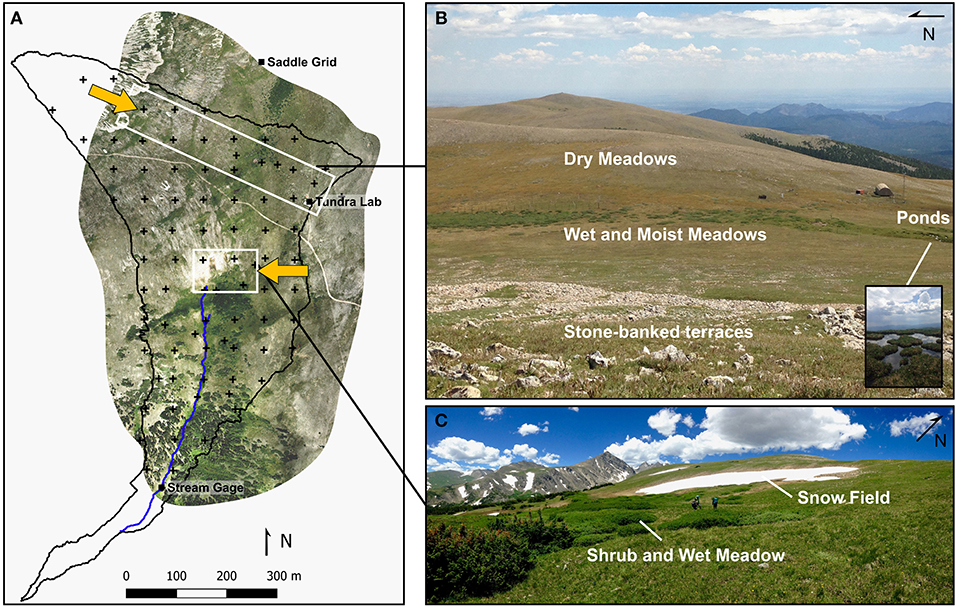
Figure 8. Key features across the study catchment from field-based observations. (A) UAV-derived orthomosaic (14th August, 2017) of the snow-free study area with boxes showing approximate locations represented by (B) a photo looking east from a western knoll in the upper catchment with image of ponds (inset) and (C) a photo looking west across a central shrub and wet meadow with a snow field in the distance. Yellow arrows on (A) indicate view direction of (B,C).
In this study, we used a hierarchical cluster analysis to identify six unique hydrologic behaviors, or the quantity and time evolution of soil moisture, across an alpine catchment at Niwot Ridge. Multiple scales of CZ properties drove the differences among these six groups, affecting patterns in water routing, storage, and potentially export to the stream channel. Notably, macrotopography and snow accumulation and melt across broad zones within the catchment created a continuum from drier sites to those more influenced by snow and snowmelt. For example, sites in the driest group, D-D, were found on hillslope summits or shoulders (high TPI-300 m, higher slope values; Figures 5, 6), which had high wind scour (lower WS values), low to no snow accumulation (low MSD; Figure 5), and were distant from the stream channel (higher OD2C and VD2C). These sites also tended to be south-facing, consistent with prior evidence that equator-facing slopes have higher solar radiation, and, thus, lower snow accumulation and soil moisture (Hinckley et al., 2014b; Pelletier et al., 2018). Water limitation characterizes the D-D areas, making them less likely to contribute to catchment export of water and solutes.
In contrast to the D-D group, the D-MD, D-WM, and W-RD groups reflected differences in the timing and duration of snow and snowmelt. The D-MD group was found along snowmelt flow paths (Figures 5, 7A), reflecting early snowmelt patterns across the study area; these areas also supported higher plant productivity than the D-D group, as shown by mNDVI measurements (Figure 5). The D-WM group, which mapped to a broad zone in the upper catchment, reflected an area of delayed snowmelt. These sites had higher wind shelter and were more north-facing than the D-D and D-MD groups. The W-RD group, with the highest MSD measured and highest morphometric protection on average, largely coincided with the persistent snow field mid-catchment. This group had a proximal source of snowmelt throughout the spring and summer, and, hence, was saturated during the first survey. Together, the physical drivers of the D-D to W-RD groups are consistent with prior work showing that wind interacts with macrotopography to drive snow accumulation and re-distribution patterns across Niwot Ridge (Winstral et al., 2002; Erickson et al., 2005; Litaor et al., 2008; Jepsen et al., 2012) and in mountainous regions globally (Grünewald et al., 2013).
Our research demonstrates that multiple scales of topography play a role in defining areas of soil water storage. We found that the W-W and W-VW groups were driven by a combination of macrotopography, microtopography, and hydrological flow paths. Both of these groups were in areas of lower macrotopographic position (lower TPI-300 m and slope relative to the DRY cluster groups; Figure 6). However, the W-W group was closer to stream channels (lower OD2C) or along flow paths (higher TWI) compared to the W-VW group (Figure 5). Sites in the W-VW group, in contrast, had lower local slope and were in areas of microtopographic change on the order of 5 m (higher CIr values; Figure 5). These differences suggest that those areas characterized by the W-W group follow the stream network and may contribute to catchment export, while the W-VW group is associated with areas of water storage (longer residence time), such as solifluction lobes, terraces, and ephemeral ponds (Benedict, 1970; Harris, 1977; Mercer, 2018). Areas in the W-VW group may have a number of functions: acting as biogeochemical reactors on the landscape, due to storage of water and material, or contribute to groundwater recharge depending on subsurface structure, including the presence of permafrost layers (Leopold et al., 2008; Mercer, 2018; Knowles et al., 2019).
Based on the results of this study and others, we propose a conceptual model of CZ influence on landscape hydrology in regions influenced by snow and ice. At high latitudes, the CZ is predominated by microtopographic features. For example, across great swaths of arctic tundra, microtopographic ice wedge polygons (~ 5–20 m) affect near surface soil moisture, permafrost, microbial activity, carbon fluxes, and vegetation (Zona et al., 2011; Hubbard et al., 2013; Wainwright et al., 2015; Dafflon et al., 2016; Taş et al., 2018). On the other end of the continuum, the CZ is predominated by macrotopographic features. For example, Hinckley et al. (2014a,b) found that hydrologic response and the fate of atmospheric nitrogen deposition in the montane were consistent within north- and south-facing aspects, but that the opposing hillslope aspects differed greatly, demonstrating nearly binary behavior when compared to one another. Here, we illustrate that alpine tundra sits between the arctic and montane endmembers: macrotopography dictates broad zones of snow accumulation and melt, as well as hydrological flow paths, while microtopography influences patches of water storage. We predict that this patch-to-zone structure of the CZ results in the heterogeneous patterns of hydrologic connectivity (Ronayne et al., 2012), biogeochemistry (Darrouzet-Nardi and Bowman, 2011), and plant community composition (Spasojevic et al., 2013; Opedal et al., 2015) that complicate our understanding of these sensitive but critical environments. Additional studies across multiple years and in other alpine regions are warranted to confirm this conceptual model.
Our random forest statistical classification models were strongly informed by our field observations, monitoring, and empirical data. Visual inspection of topographic features during field surveys informed initial topographic index selection and scales of interest. In addition, they led to the calculation of new indices, including CIr and TPIr, to capture solifluction lobe and terrace features. We also observed areas of persistent snowpack, ephemeral or subsurface flow paths, and surface ponding, indicating locations of extended water storage. These field observations aided in validating our random forest maps. For example, our six- and three-group random forest models were evaluated on their successful prediction of observed upper- and mid-catchment wet and moist meadows, ponds, extent of dry meadows, and isolated wet patches (Figure 7 compared to Figure 8). The three-group map presents predictions for broad spatial patterns in dry-to-wet areas, while the six-group map provides insight into patch-scale patterns that reflect more nuanced hydrologic dynamics. As posed by Blöschl et al. (2019), our study shows that employing multiple approaches to characterize alpine hydrology leads to a stronger understanding of how physical drivers affect patterns of hydrologic dynamics across space.
In turn, our random forest predictions identified gaps in our understanding of alpine hydrology, pointing to future field-based research needs in alpine CZ science (Figure 2, box 4). Although all of our groups had some degree of separation based on CZ indices, wide variance in most CZ index values (Figure 5), the incomplete separation of groups in multidimensional space, relatively low explanatory power of principal components (Figure 6), and high single-group error rates in our random forest models (Tables 2, 3) suggests that hydrologic groups may be affected by additional factors that we did not include in our analysis. First, our study did not include sub-meter-scale CZ properties specifically related to soils. Several studies reinforce the importance of soil texture indices for predicting patterns in soil moisture (Williams et al., 2009; Oroza et al., 2018). Other soil characteristics, such as porosity, mineralogy, and organic matter content are important for vertical infiltration rates and lateral flow paths in the alpine (e.g., Quinton et al., 2005; Yang et al., 2014). Stone-banked lobes and terraces may also affect surface soil moisture, similar to the importance of rock-related metrics in defining hydropedologic units in the Hubbard Brook Experimental Forest (Gillin et al., 2015) or explaining subsurface flow variability (Bachmair and Weiler, 2012).
Second, while the regularly spaced grid of monitoring sites enabled broad characterization of the landscape and allowed us to extrapolate hydrologic groups across the area, it yielded few samples of wet patches and zones (Table 1). As a result, it was difficult to predict W groups accurately. When W-W and W-VW groups were combined for the three-group model, wet group balanced accuracy improved from ~50 to 66%, but this was still higher error than for the “dry” and “snow-rain” groups (Tables 2, 3). The W-W and W-VW group were mostly misclassified as one another or as W-RD, D-WM, or D-MD groups, which suggests that we did not include some mechanisms that may more clearly differentiate these groups. Our results highlight a need for more rigorous study of wet areas within alpine landscapes to better understand the mechanisms underlying persistent wetness. For example, we do not know whether wet areas stay wet because they continually receive snowmelt or rather that they are areas fed locally by melting subsurface ice lenses and/or permafrost (e.g., Leopold et al., 2008; Knowles et al., 2019).
Third, subsurface characterization will be critical for developing predictive capacity related to quantifying stream flow and chemical export from the CZ. Characterizing subsurface heterogeneity has long been identified as a missing link in developing a unified theory of watershed hydrology (Troch et al., 2008), and our study indicates that the alpine is no exception. We could not physically measure soil moisture under the stone-banked terraces in the upper western portion of the catchment, nor in a broad shrub zone mid-catchment (Figure 8). Yet, we heard water percolating through the terraces and the broad shrub zone appeared saturated throughout most of the summer season. We know little about subsurface flow in these areas. These two unmeasured areas of the alpine may be important for water transport or storage, respectively, with important implications for water delivery to lower elevations. More broadly, characterizing surface water-groundwater interactions would inform the hydrologic connectivity between our hydrologic groups (Liu et al., 2004; Williams et al., 2015; Mercer, 2018).
Additionally, we believe that estimation error associated with predicting the W-RD group may be due to the lack of characterization of the subsurface CZ structure. This group was found in broad areas of steep relief with snow accumulation (i.e., the snowfield in the middle of the catchment; Figure 8) and in the upper western part of the catchment, where the stone-banked terraces intermix with meadows. These sites were mostly misclassified as the D-MD function, suggesting that the physical drivers of these two groups are similar. Although obviously influenced by snowmelt supply, the W-RD function may reflect subsurface properties at play. Our predicted maps can guide future acquisition of intensive geophysical datasets, such as ground-penetrating radar, as well as tracer studies to determine patterns of hydrologic connectivity at hillslope-to-catchment scales. In summary, our data analysis framework capitalized on the combination of intensive field observations, extensive remotely-sensed CZ indices, and the strength of machine learning models. However, continuing the dialogue between targeted data collection and building predictive frameworks is critical for extending our efforts beyond mapping soil water storage patterns (Figure 2).
Our analytical framework provides a strategy for condensing multiple and complex data streams into a process-oriented understanding of within catchment functions. This approach is increasingly important as technology enables observations with higher spatiotemporal resolutions and for longer durations. For example, unmanned aerial vehicles, such as those used in this and prior studies, offer sub-meter-scale observations (Wigmore et al., 2019), commercially available high-resolution (3 m) satellite images provide broad spatial coverage (Planet Team, 2017), and in situ soil moisture sensor arrays yield real-time sub-hourly data feeds and long-term monitoring (e.g., Demand et al., 2009; Oroza et al., 2018). Our unsupervised cluster analysis distilled many observations into clear and related soil moisture behaviors, and similar approaches identified characteristic time series of plant productivity in mountainous regions (Devadoss et al., 2020). In turn, our machine learning-derived maps could be used to design sensor array placement in new locations or targeted process oriented transect studies (e.g., Wainwright et al., 2015).
Our approach to identify and predict hydrologic groups allowed us to begin exploring their relationships within a catchment, as well as their potential effects on biogeochemical processes, plant productivity, and stream water and solute fluxes. Both our six- and three-group random forest predictions indicated that ~40–55% of the catchment is hydrologically active early in the summer growing season (Tables 2, 3). Areas classified as the D-MD, D-WM, and W-RD groups (~40% of the study area) are expected to contribute significantly to water fluxes and the fluxes of solutes stored in snowpack (e.g., inorganic N; Williams et al., 2015), mobilized from shallow soils (e.g., dissolved organic carbon), or produced from carbonic acid weathering (Winnick et al., 2017). As temperatures warm and soil moisture saturation decreases during the growing season, these areas develop optimal conditions for soil respiration (Knowles et al., 2015), soil N transformation rates (Chen et al., 2020), and plant growth (Supplementary Figure 1). We would expect that D-MD, D-WM, and W-RD groups then “prime” soils for mobilization of solutes in response to snowmelt and convective rainstorms later in the season, but future hydrologic modeling studies are needed to test this hypothesis. While their biogeochemical activity appears to be activated by warming temperatures and declining soil moisture, we predict that their primary role in the catchment is as export control points (Bernhardt et al., 2017); they accumulate and then contribute much of the water, solute, and nutrient fluxes from the terrestrial ecosystem when hydrologically connected to the channel.
Although we estimated that the W-W and W-VW groups are only ~3% of the study area, these sites may be disproportionately important in net ecosystem or catchment processes. Encompassing the riparian zones along the stream channel and areas accumulating snowmelt, these groups align with the “activated control points” typology outlined by Bernhardt et al. (2017). When warming temperatures cause thawing, these areas exhibit high soil respiration rates relative to other areas (Knowles et al., 2015, 2019). Consistent with prior research on Niwot Ridge (Bowman and Fisk, 2001; Seastedt, 2020), the wetter areas also had the highest mNDVI (Supplementary Figure 1). However, since these areas had the highest predictive uncertainty, further study is warranted to better understand their biogeochemical process rates, subsurface weathering dynamics, and surface-subsurface hydrologic connectivity.
We classified the other half of the study area as the D-D group. Dry areas have high rates of net N mineralization and nitrification early in the summer season (June-July) and again during August-September (Chen et al., 2020). These biogeochemical processes are stimulated by higher soil moisture during early snowmelt and summer rains. However, the overall low antecedent soil moisture conditions at dry sites prior to rains suggest that they are unlikely to contribute to streamflow, similar to the findings of Penna et al. (2011) in the Italian Alps. Low soil moisture also limits plant productivity; these areas had the lowest mNDVI on average (Supplementary Figure 1), consistent with previous studies on Niwot Ridge (for review, see Bowman and Fisk, 2001). However, these drier areas host the highest plant species richness of alpine plant communities (Seastedt and Vaccaro, 2001; Litaor et al., 2008; Seastedt, 2020). Our findings suggest that while the D-D group may be important areas for local nutrient cycling and plant species diversity, they are less important for ecosystem- or catchment-scale processes; thus, we do not designate them as control points. We do note, however, that D-D group areas may be more hydrologically relevant during early snowmelt—a period of time that our measurements did not capture.
Our observations and random forest predictions reflect only one growing season's hydrology in one alpine catchment, but we can consider our findings in the context of long-term climate data and predictions for the region. We suggest that, broadly, the spatial patterns of the different hydrologic groups will be robust to change, since these patterns are driven by the physical template of the landscape. This idea is similar to Williams et al. (2009)—patterns in soil moisture respond to both static (i.e., topography and soils) and dynamic (i.e., snowpack) CZ controls. However, we might expect some shifts in the spatial extent of groups, since over the long term, winter precipitation is increasing (Kittel et al., 2015) but spring and summer are warming (McGuire et al., 2012). Earlier but slower snowmelt (Musselman et al., 2017) may shift more areas to behave like an expanded D-MD group, with early influence of snowmelt, a slower dry-down period, and longer dry conditions prior to summer precipitation. This shift reinforces the importance of summer rains for stimulating microbial activity and plant growth under conditions of temperature stress (Harpold, 2016; Winkler et al., 2016; Chen et al., 2020). Nutrient losses to the channel may increase, since alpine plant productivity may be limited by photoperiod despite early snowmelt and warmer spring temperatures (Ernakovich et al., 2014). The W-W and W-VW areas may experience increases in subsurface thawing with warming summer temperatures, enhancing the hydrologic connectivity of these zones to other areas of the landscape and shifting their role, for example, from activated to transport control points (Bernhardt et al., 2017), important for conveying water and solutes to the channel (e.g., Barnes et al., 2014).
Our intensive soil moisture observations clustered into six hydrologic groups, characterized by similar quantities and temporal trends in soil moisture over the alpine growing season. Interestingly, we found that multiple scales of topography were at play in differentiating these groups, and these scales of topography interacted to manifest as broad zones or isolated patches of like soil moisture behaviors across the landscape. We expect hydrologic groups may shift in response to changes in snowmelt predicted for the region (Musselman et al., 2017; Jennings and Molotch, 2020), which may affect the roles of different patches or zones as ecosystem control points (Bernhardt et al., 2017). Our study illustrates the novel insights that can be provided by applying an analysis framework that links intensive on-the-ground field observations with empirical evidence, topography-derived terrain indices, and extensive aerial imagery from UAVs. Our framework combined the exploratory nature of hierarchical cluster analysis to identify unique hydrologic behaviors in our observations with the power of machine learning algorithms to predict them across a landscape. This approach yielded a detailed snapshot of hydrologic dynamics and connectivity across space, which will aid in informing targeted, process-based field and modeling studies in this and other sensitive alpine CZ systems.
The datasets presented in this study can be found in online repositories as follows. The original soil moisture measurements presented in this study are publicly available and can be found here: Hermes, A. 2019. Soil moisture and temperature surveys for Saddle Stream Network, 2017 ver 1. Environmental Data Initiative. https://doi.org/10.6073/pasta/caaa4da3a6ab7a4949a8afb3c0df6c14. Restrictions apply to the UAV-derived datasets presented in this article. These datasets are currently embargoed on the Environmental Data Initiative. Requests to access the datasets should be directed to Oliver Wigmore, b2xpdmVyLndpZ21vcmVAdnV3LmFjLm56.
We also analyzed existing publicly available datasets, which can be found here: Caine, T.N., Morse J., and Niwot Ridge LTER (2020). Streamflow data for Saddle stream, 1999 - ongoing. ver 3. Environmental Data Initiative. https://doi.org/10.6073/pasta/5947b3ce4f706470b83da7c4afa4a875 (accessed 2020-05-26).
Morse, J., Losleben, M., and Niwot Ridge LTER (2020). Precipitation data for Saddle chart recorder, 1981 - ongoing. ver 10. Environmental Data Initiative. https://doi.org/10.6073/pasta/21e69431d63e97ffb2d311bb35793eb1 (accessed 2020-05-26). National Ecological Observatory Network (2018).
Data Products: NEON_D13_NIWO_DP1_448000_4433000_classified_point_cloud, NEON_D13_NIWO_DP1_448000_4434000_classified_point_cloud, NEON_D13_NIWO_DP1_449000_4433000_classified_point_cloud, NEON_D13_NIWO_DP1_449000_4434000_classified_point_cloud, NEON_D13_NIWO_DP1_450000_4433000_classified_point_cloud, NEON_D13_NIWO_DP1_450000_4434000_classified_point_cloud. Provisional data downloaded from http://data.neonscience.org on 17 October 2018. Battelle, Boulder, CO, USA.
AH collected soil moisture observations, performed statistical analyses, and contributed to the original manuscript. HW advised statistical analyses and edited the original manuscript. OW collected unmanned aerial vehicle datasets, advised statistical analyses, and edited the original manuscript. NF advised statistical analyses and edited the original manuscript. NM edited the original manuscript. E-LH advised field observations and statistical analyses and contributed to the original manuscript. All authors contributed to the article and approved the submitted version.
This research was supported by the Niwot Ridge LTER program (NSF DEB−1637686). HW and NF were supported by the U.S. Department of Energy, Office of Science, Office of Biological and Environmental Research, Earth and Environmental Systems Sciences Division under Award Number DE-AC02-05CH11231, as part of the Watershed Function Scientific Focus Area. OW was supported in part through funding from the University of Colorado 2016 Innovative Seed Grant, and the University of Colorado Earth Lab Grand Challenge, in association with NM. GNSS survey equipment was provided by the GAGE Facility, operated by UNAVCO, Inc. with support from the National Science Foundation and the National Aeronautics and Space Administration under NSF Cooperative Agreement EAR-1724794.
The authors declare that the research was conducted in the absence of any commercial or financial relationships that could be construed as a potential conflict of interest.
The reviewer TF declared a past co-authorship with one of the authors NM to the handling editor.
We thank Youchao Chen, Cara Lauria, and the Mountain Research Station staff and field technicians for logistical and field assistance, and Brian Ebel contributed helpful insight into methods for hydrologic characterization. We acknowledge that this research occurred within traditional territories inhabited by the Ute, Cheyenne, and Arapaho Peoples and that our approach presented in this article is only one way of knowing a landscape.
The Supplementary Material for this article can be found online at: https://www.frontiersin.org/articles/10.3389/frwa.2020.578602/full#supplementary-material
CI, Convergence index; CIr, Range in convergence index over 5 m; CZ, Critical zone; D, Dry; D-D, Dry cluster, Dry hydrologic group; D-MD, Dry cluster, Moist-to-dry hydrologic group; D-WM, Dry cluster, Wet-to-moist hydrologic group; DEM, Digital elevation model; DTM, Digital terrain model; FA, Flow accumulation; GNSS, Global navigation satellite system; mNDVI, Maximum normalized difference vegetation index measured; MPI, Morphometric protection index; MSD, Maximum snow depth measured; OD2C, Overland distance to channel; OOB, Out-of-bag error estimate; PC, Principal component; PCA, Principal component analysis; Slope-L, Local slope; Slope-M, Macro slope; SWFA, Snow-weighted flow accumulation; TPI, Topographic position index; TPIr, Range in topographic position index over 20 m; TWI, Topographic wetness index; UAV, Unmanned aerial vehicle; VD2C, Vertical distance to channel; W, Wet; W-RD, Wet cluster, Rapid dry-down hydrologic group; W-W, Wet cluster, Wet hydrologic group; W-VW, Wet cluster, Very wet hydrologic group; WS, Wind shelter.
Ali, G., Birkel, C., Tetzlaff, D., Soulsby, C., Mcdonnell, J. J., and Tarolli, P. (2013). A comparison of wetness indices for the prediction of observed connected saturated areas under contrasting conditions. Earth Surf. Process. Landforms 39, 399–413. doi: 10.1002/esp.3506
Bachmair, S., and Weiler, M. (2012). Hillslope characteristics as controls of subsurface flow variability. Hydrol. Earth Syst. Sci. 16, 3699–3715. doi: 10.5194/hess-16-3699-2012
Bales, R. C., and Harrington, R. F. (1995). Recent progress in snow hydrology. Rev. Geophys. 33, 1011–1020. doi: 10.1029/95RG00340
Bales, R. C., Molotch, N. P., Painter, T. H., Dettinger, M. D., Rice, R., and Dozier, J. (2006). Mountain hydrology of the western United States. Water Resour. Res. 42:W08432. doi: 10.1029/2005WR004387
Baraer, M., McKenzie, J., Mark, B. G., Gordon, R., Bury, J., Condom, T., et al. (2015). Contribution of groundwater to the outflow from ungauged glacierized catchments: a multi-site study in the tropical Cordillera Blanca, Peru. Hydrol. Process. 29, 2561–2581. doi: 10.1002/hyp.10386
Barnes, R. T., Williams, M. W., Parman, J. N., Hill, K., and Caine, N. (2014). Thawing glacial and permafrost features contribute to nitrogen export from Green Lakes Valley, Colorado Front Range, USA. Biogeochemistry 117, 413–430. doi: 10.1007/s10533-013-9886-5
Barnett, T. P., Adam, J. C., and Lettenmaier, D. P. (2005). Potential impacts of a warming climate on water availability in snow-dominated regions. Nature 438, 303–309. doi: 10.1038/nature04141
Benedict, J. B. (1970). Downslope soil movement in a Colorado alpine region: rates, processes, and climatic significance. Arctic Alpine Res. 2, 165–226. doi: 10.1080/00040851.1970.12003576
Bernhardt, E. S., Blaszczak, J. R., Ficken, C. D., Fork, M. L., Kaiser, K. E., and Seybold, E. C. (2017). Control points in ecosystems: moving beyond the hot spot hot moment concept. Ecosystems 20, 665–682. doi: 10.1007/s10021-016-0103-y
Bjorkman, A. D., Myers-Smith, I. H., Elmendorf, S. C., Normand, S., Ruger, N., Beck, P. S. A., et al. (2018). Plant functional trait change across a warming tundra biome. Nature 562, 57–62. doi: 10.1038/s41586-018-0563-7
Blöschl, G., Bierkens, M. F., Chambel, A., Cudennec, C., Destouni, G., Fiori, A., et al. (2019). Twenty-three unsolved problems in hydrology (UPH) - a community perspective. Hydrol. Sci. J. 64, 1141–1158. doi: 10.1080/02626667.2019.1620507
Boehmke, B., and Greenwell, B. (2020). Hands-on Machine Learning with R. Chapman and Hall/CRC Press, 488. Available online at: https://bradleyboehmke.github.io/HOML/
Bowman, W. D., and Fisk, M. C. (2001). Ch. 9 Primary Production, in Structure and Function of an Alpine Ecosystem. eds W. D. Bowman, and T.R. Seastedt. New York, NY: Oxford University Press, 15–31.
Bradley, R. S. (2004). Projected temperature changes along the American cordillera and the planned GCOS network. Geophys. Res. Lett. 31:L16210. doi: 10.1029/2004GL020229
Brooks, P. D., Chorover, J., Fan, Y., Godsey, S. E., Maxwell, R. M., McNamara, J. P., et al. (2015). Hydrological partitionaing in the critical zone: recent advances and opportunities for developing transferable understanding of water cycle dynamics. Water Resour. Res. 51, 6973–6987. doi: 10.1002/2015WR017039
Bühler, Y., Adams, M. S., Bösch, R., and Stoffel, A. (2016). Mapping snow depth in alpine terrain with unmanned aerial systems (UASs): potential and limitations. Cryosphere 10, 1075–1088. doi: 10.5194/tc-10-1075-2016
Burns, S. F. (1980). Alpine soil distribution and development, Indian Peaks, Colorado Front Range. (Ph.D. dissertation). University of Colorado, Boulder.
Buytaert, W., Cuesta-Camacho, F., and Tobón, C. (2011). Potential impacts of climate change on the environmental services of humid tropical alpine regions. Glob. Ecol. Biogeogr. 20, 19–33. doi: 10.1111/j.1466-8238.2010.00585.x
Caine, N. (1995). Snowpack influences on geomorphic processes in Green Lakes Valley, colorado front range. Geogr. J. 161, 55–68. doi: 10.2307/3059928
Caine, T. N., Morse, J., and the Niwot Ridge L. T. E. R. (2020). Streamflow Data for Saddle stream, 1999-Ongoing. ver 3. Environmental Data Initiative. doi: 10.6073/pasta/5947b3ce4f706470b83da7c4afa4a875
Cannone, N., Diolaiuti, G., Guglielmin, M., and Smiraglia, C. (2008). Accelerating climate change impacts on alpine glacier forefield ecosystems in the European Alps. Ecol. Appl. 18, 637–648. doi: 10.1890/07-1188.1
Cannone, N., Sgorbati, S., and Guglielmin, M. (2007). Unexpected impacts of climate change on alpine vegetation. Front. Ecol. Environ. 5, 360–364. doi: 10.1890/1540-9295(2007)5[360:UIOCCO]2.0.CO;2
Chen, Y., Wieder, W. R., Hermes, A. L., and Hinckley, E.-L. S. (2020). The role of physical properties in controlling soil nitrogen cycling across a tundra-forest ecotone of the Colorado Rocky Mountains, U.S.A. Catena 186:104369. doi: 10.1016/j.catena.2019.104369
Cohen, J. A. (1960). Coefficient of agreement for nominal scales. Educ. Psychol. Meas. 20, 37–46. doi: 10.1177/001316446002000104
Cutler, D., Edwards, T., Beard, K., Cutler, A., Hess, K., Gibson, J., et al. (2007). Random forests for classification in ecology. Ecology 88, 2783–2792. doi: 10.1890/07-0539.1
Dafflon, B., Hubbard, S., Ulrich, C., Peterson, J., Wu, Y., Wainwright, H., et al. (2016). Geophysical estimation of shallow permafrost distribution and properties in an ice-wedge polygon-dominated Arctic tundra region. Geophysics 81, WA247–WA263. doi: 10.1190/geo2015-0175.1
Darrouzet-Nardi, A., and Bowman, W. D. (2011). Hot spots of inorganic nitrogen availability in an alpine-subalpine ecosystem, Colorado Front Range. Ecosystems 14, 848–863. doi: 10.1007/s10021-011-9450-x
Demand, D., Blume, T., and Weiler, M. (2009). Spatio-temporal relevance and controls of preferential flow at the landscape scale. Hydrol. Earth Syst. Sci. 23, 4869–4889. doi: 10.5194/hess-23-4869-2019
Devadoss, J., Falco, N., Dafflon, B., Wu, Y., Franklin, M., Hermes, A., et al. (2020). Remote sensing-informed zonation for understanding snow, plant, and soil moisture dynamics within a mountain ecosystem. Remote Sens. 12:2733. doi: 10.3390/rs12172733
Emanuel, R. E., Riveros-Iregui, D. A., McGlynn, B. L., and Epstein, H. E. (2011). On the spatial heterogeneity of net ecosystem productivity in complex landscapes. Ecosphere 2, 1–13. doi: 10.1890/ES11-00074.1
Erickson, T. A., Williams, M. W., and Winstral, A. (2005). Persistence of topographic controls on the spatial distribution of snow in rugged mountain terrain, Colorado, United States. Water Resour. Res 41:04014. doi: 10.1029/2003WR002973
Ernakovich, J. G., Hopping, K. A., Berdanier, A. B., Simpson, R. T., Kachergis, E. J., Steltzer, H., et al. (2014). Predicted responses of arctic and alpine ecosystems to altered seasonality under climate change. Glob. Chang. Biol. 20, 3256–3269. doi: 10.1111/gcb.12568
Falco, N., Wainwright, H., Dafflon, B., Léger, E., Peterson, J., Steltzer, H., et al. (2019). Investigating microtopographic and soil controls on a mountainous meadow plant community using high-resolution remote sensing and surface geophysical data. J. Geophys. Res. Biogeosci. 124, 1618–1636. doi: 10.1029/2018JG004394
Fonstad, M. A., Dietrich, J. T., Courville, B. C., Jensen, J. L., and Carbonneau, P. E. (2013). Topographic structure from motion: a new development in photogrammetric measurement. Earth Surf. Process. Landforms 38, 421–430. doi: 10.1002/esp.3366
Gillin, C. P., Bailey, S. W., McGuire, K. J., and Gannon, J. P. (2015). Mapping of hydropedologic spatial patterns in a steep headwater catchment. Soil Sci. Soc. Am. J. 79, 440–453. doi: 10.2136/sssaj2014.05.0189
Greenland, D., and Losleben, M. (2001). Ch. 2 climate in structure and function of an alpine ecosystem. eds W. D. Bowman, and T. R. Seastedt. New York, NY: Oxford University Press, 15–31.
Grünewald, T., Stötter, J., Pomeroy, J. W., Dadic, R., Moreno Banos, I., Marturìa, J., et al. (2013). Statistical modelling of the snow depth distribution in open alpine terrain. Hydrol. Earth Syst. Sci. 17, 3005–3021. doi: 10.5194/hess-17-3005-2013
Guio Blanco, C. M., Brito Gomez, V. M., Crespo, P., and Lieb, M. (2018). Spatial prediction of soil water retention in a Páramo landscape: methodological insight into machine learning using random forest. Geoderma 316, 100–114. doi: 10.1016/j.geoderma.2017.12.002
Harman, C. J. (2015). Time-variable transit time distributions and transport: Theory and application to storage-dependent transport of chloride in a watershed. Water Resour. Res. 51, 1–30. doi: 10.1002/2014WR015707
Harpold, A. A. (2016). Diverging sensitivity of soil water stress to changing snowmelt timing in the Western U.S. Adv. Water Resour. 92, 116–129. doi: 10.1016/j.advwatres.2016.03.017
Harris, C. (1977). Engineering properties, groundwater conditions, and the nature of soil movement on a solifluction slope in north Norway. Q. J. Eng. Geol. Hydrogeol. 10, 27–43. doi: 10.1144/GSL.QJEG.1977.010.01.02
Hastie, T., Tibshirani, R., and Friedman, J. (2009). The Elements of Statistical Learning: Data Mining, Inference, and Prediction, 2nd Edn. New York, NY: Springer.
Hinckley, E.-L. S., Barnes, R. T., Anderson, S. P., Williams, M. W., and Bernasconi, S. M. (2014a). Nitrogen retention and transport differ by hillslope aspect at the rain-snow transition of the Colorado Front Range. J. Geophys. Res. Biogeosci. 119, 1281–1296. doi: 10.1002/2013JG002588
Hinckley, E.-L. S., Ebel, B. A., Barnes, R. T., Anderson, R. S., Williams, M. W., and Anderson, S. P. (2014b). Aspect control of water movement on hillslopes near the rain-snow transition of the Colorado Front Range. Hydrol. Process. 28, 74–85. doi: 10.1002/hyp.9549
Horton, P., Schaefli, B., Mezghani, A., Hingray, B., and Musy, A. (2006). Assessment of climate-change impacts on alpine discharge regimes with climate model uncertainty. Hydrol. Process. 20, 2091–2109. doi: 10.1002/hyp.6197
Hubbard, S. S., Gangodagamage, C., Dafflon, B., Wainwright, H., Peterson, J., Gusmeroli, A., et al. (2013). Quantifying and relating land-surface and subsurface variability in permafrost environments using LiDAR and surface geophysical datasets. Hydrogeol. J. 21, 149–169. doi: 10.1007/s10040-012-0939-y
Ishida, K., Ercan, A., Trinh, T., Kavvas, M. L., Ohara, N., Carr, K., et al. (2018). Analysis of future climate change impacts on snow distribution over mountainous watersheds in Northern California by means of a physically-based snow distribution model. Sci. Total Environ. 645, 1065–1082. doi: 10.1016/j.scitotenv.2018.07.250
James, G., Witten, D., Hastie, T., and Tibshirani, R. (2013). An Introduction to Statistical Learning with Applications in R. New York, NY: Springer, 436.
Jennings, K. S., and Molotch, N. P. (2020). Snowfall fraction, cold content, and energy balance changes drive differential response to simulated warming in an alpine and subalpine snowpack. Front. Earth Sci. 8:186. doi: 10.3389/feart.2020.00186
Jepsen, S. M., Molotch, N. P., Williams, M. W., Rittger, K. E., and Sickman, J. O. (2012). Interannual variability of snowmelt in the Sierra Nevada and Rocky Mountains, United States: examples from two alpine watersheds. Water Resour. Res. 48:W02529. doi: 10.1029/2011WR011006
Kirchner, J. W. (2016). Aggregation in environmental systems-Part 2: Catchment mean transit times and young water fractions under hydrologic nonstationarity. Hydrol. Earth Syst. Sci. 20, 299–328. doi: 10.5194/hess-20-299-2016
Kittel, T. G. F., Williams, M. W., Chowanski, K., Hartman, M., Ackerman, T., Losleben, M., et al. (2015). Contrasting long-term alpine and subalpine precipitation trends in a mid-latitude North American mountain system, Colorado Front Range, USA. Plant Ecol. Diversity. 8, 607–624. doi: 10.1080/17550874.2016.1143536
Knowles, J. F., Blanken, P. D., Lawrence, C. R., and Williams, M. W. (2019). Evidence for non-steady-state carbon emissions from snow-scoured alpine tundra. Nat. Commun. 10:1306. doi: 10.1038/s41467-019-09149-2
Knowles, J. F., Blanken, P. D., and Williams, M. W. (2015). Soil respiration variability across a soil moisture and vegetation community gradient within a snow-scoured alpine meadow. Biogeochemistry 125, 185–202. doi: 10.1007/s10533-015-0122-3
Kuhn, M. (2008). Building predictive models in R using the caret package. J. Stat. Softw. 28, 1–26. doi: 10.18637/jss.v028.i05
Lee, E., and Kim, S. (2019). Seasonal and spatial characterization of soil moisture and soil water tension in a steep hillslope. J. Hydrol. 568, 676–685. doi: 10.1016/j.jhydrol.2018.11.027
Leopold, M., Lewis, G., Dethier, D., Caine, N., and Williams, M. W. (2008). Using geophysical methods to study the shallow subsurface of a sensitive alpine environment, Niwot Ridge, Colorado Front Range, U.S.A. Arct. Antarct. Alp. Res 40, 519–530. doi: 10.1657/1523-0430(06-124)[LEOPOLD]2.0.CO;2
Litaor, M. I., Williams, M., and Seastedt, T. R. (2008). Topographic controls on snow distribution, soil moisture, and species diversity of herbaceous alpine vegetation, Niwot Ridge, Colorado. J. Geophys. Res 113:2008. doi: 10.1029/2007JG000419
Liu, F., Williams, M. W., and Caine, N. (2004). Source waters and flow paths in an alpine catchment, Colorado Front Range, United States. Water Resour. Res. 40:W09401. doi: 10.1029/2004WR003076
Magnusson, J., Jonas, T., Ló Pez-Moreno, I., and Lehning, M. (2012). Snow cover response to climate change in a high alpine and half-glacierized basin in Switzerland. Hydrol. Res. 41, 230–240. doi: 10.2166/nh.2010.115
Matsuoka, N., Ikeda, A., and Date, T. (2005). Morphometric analysis of solifluction lobes and rock glaciers in the Swiss Alps. Permafr. Periglac. Process. 16, 99–113. doi: 10.1002/ppp.517
May, D. E., and Webber, P. J. (1982). “Spatial and temporal variation of the vegetation and its productivity on Niwot Ridge, Colorado,” in Ecological Studies in the Colorado alpine, a festschrift for John W. Marr. Occasional paper number 37. Institute of Arctic and Alpine Research, University of Colorado Boulder. Colorado, 35–62.
McGuire, C. R., Nufio, C. R., Bowers, M. D., and Guralnick, R. P. (2012). Elevation-dependent temperature trends in the Rocky Mountain Front Range: changes over a 56- and 20-year record. PLoS ONE 7:e44370. doi: 10.1371/journal.pone.0044370
Mercer, J. J. (2018). Insights into Mountain Wetland Resilience to Climate Change: an Evaluation of the Hydrological Processes Contributing to the Hydrodynamics of Alpine Wetlands in the Canadian Rocky Mountains. (Ph. D. dissertation). University of Saskatchewan Saskatoon.
Morse, J., Losleben, M., and Ridge, N. (2020). Precipitation data for Saddle chart recorder, 1981 - ongoing. ver 10. Environmental Data Initiative. doi: 10.6073/pasta/21e69431d63e97ffb2d311bb35793eb1
Murtagh, F., and Legendre, P. (2014). Ward's hierarchical agglomerative clustering method: Which algorithms implement Ward's Criterion? J. Classificat. 31, 274–295. doi: 10.1007/s00357-014-9161-z
Musselman, K. N., Clark, M. P., Liu, C., Ikeda, K., and Rasmussen, R. (2017). Slower snowmelt in a warmer world. Nat. Clim. Chang. 7, 214–219. doi: 10.1038/nclimate3225
National Ecological Observatory Network. (2018). Data Products: NEON_D13_NIWO_DP1_448000_4433000_classified_point_cloud, NEON_D13_NIWO_DP1_448000_4434000_classified_point_cloud, NEON_D13_NIWO_DP1_449000_4433000_classified_point_cloud, NEON_D13_NIWO_DP1_449000_4434000_classified_point_cloud, NEON_D13_NIWO_DP1_450000_4433000_classified_point_cloud, NEON_D13_NIWO_DP1_450000_4434000_classified_point_cloud. (Battelle, Boulder, CO). Available online at: http://data.neonscience.org (accessed October 17, 2018).
Opedal, O. H., Armbruster, W. S., and Graae, B. J. (2015). Linking small-scale topography with microclimate, plant species diversity and intra-specific trait variation in an alpine landscape. Plant Ecol. Divers. 8, 305–315. doi: 10.1080/17550874.2014.987330
Oroza, C. A., Bales, R. C., Stacy, E. M., Zheng, Z., and Glaser, S. D. (2018). Long-term variability of soil moisture in the Southern Sierra: measurement and prediction. Vadose Zone J. 17, 1–9. doi: 10.2136/vzj2017.10.0178
Pelletier, J. D., Barron-Gafford, G. A., Gutiérrez-Jurado, H., Hinckley, E.-L. S., Istanbulluoglu, E., Mcguire, L. A., et al. (2018). Which way do you lean? Using slope aspect variations to understand critical zone processes and feedbacks. Earth Surf. Process. Landforms 43, 1133–1154. doi: 10.1002/esp.4306
Penna, D., Tromp-Van Meerveld, H. J., Gobbi, A., Borga, M., and Dalla Fontana, G. (2011). The influence of soil moisture on threshold runoff generation processes in an alpine headwater catchment. Hydrol. Earth Syst. Sci. 15, 689–702. doi: 10.5194/hess-15-689-2011
Pepin, N., Bradley, R. S., Diaz, H. F., Baraer, M., Caceres, E. B., Forsythe, N., et al. (2015). Elevation-dependent warming in mountain regions of the world. Nat. Clim. Chang. 5, 424–430. doi: 10.1038/nclimate2563
Perrot, D., Molotch, N. P., Williams, M. W., Jepsen, S. M., and Sickman, J. O. (2014). Relationships between stream nitrate concentration and spatially distributed snowmelt in high-elevation catchments of the western U.S. Water Resour. Res. 50, 8694–8713. doi: 10.1002/2013WR015243
Planet Team. (2017). Planet Application Program Interface: In Space for Life on Earth, Planet. San Francisco, CA. Available online at: https://api.planet.com
Quinton, W. L., Shirazi, T., Carey, S. K., and Pomeroy, J. W. (2005). Soil water storage and active-layer development in a sub-alpine tundra hillslope, southern Yukon Territory, Canada. Permafr. Periglac. Processs 16, 369–382. doi: 10.1002/ppp.543
R Core Team. (2017). R: A Language and Environment for Statistical Computing. (Vienna, Austria: R Foundation for Statistical Computing). Available online at: https://www.R-project.org.
Reeves, G. (2020). smooth2a MATLAB Central File Exchange. Available online at: https://www.mathworks.com/matlabcentral/fileexchange/23287-smooth2a (accessed May 21, 2020).
Ronayne, M. J., Houghton, T. B., and Stednick, J. D. (2012). Field characterization of hydraulic conductivity in a heterogeneous alpine glacial till. J. Hydrol. 458–459, 103–109. doi: 10.1016/j.jhydrol.2012.06.036
Russell, R. J. (1933). Alpine land forms of western united states. Bull. Geol. Soc. Am. 44, 927–950. doi: 10.1130/GSAB-44-927
Schneeberger, K., Dobler, C., Huttenlau, M., and Stötter, J. (2015). Assessing potential climate change impacts on the seasonality of runoff in an Alpine watershed. J. Water Clim. Chang. 6, 263–277. doi: 10.2166/wcc.2014.106
Seastedt, T. R. (2020). “Patterns and controls on the productivity and plant diversity of alpine ecosystems,” in Encyclopedia of the World's Biomes, eds M. I. Goldstein and D. A. DellaSala (Elsevier), 265–274. doi: 10.1016/B978-0-12-409548-9.11787-7
Seastedt, T. R., and Vaccaro, L. (2001). Plant species richness, productivity, and nitrogen and phosphorus limitations across a snowpack gradient in alpine tundra. Arct. Antarct. Alp. Res. 33, 100–106. doi: 10.1080/15230430.2001.12003410
Seidl, R., Rammer, W., and Lexer, M. J. (2011). Climate change vulnerability of sustainable forest management in the Eastern Alps. Clim. Chang. 106, 225–254. doi: 10.1007/s10584-010-9899-1
Smith, T., and Bookhagen, B. (2018). Changes in seasonal snow water equivalent distribution in High Mountain Asia (1987 to 2009). Sci. Adv. 4:e1701550. doi: 10.1126/sciadv.1701550
Spasojevic, M. J., Bowman, W. D., Humphries, H. C., Seastedt, T. R., and Suding, K. N. (2013). Changes in alpine vegetation over 21 years: Are patterns across a heterogeneous landscape consistent with predictions? Ecosphere 4, 1–18. doi: 10.1890/ES13-00133.1
Suding, K., Farrer, E., King, A., Kueppers, L., and Spasojevic, M. J. (2015). Vegetation change at high elevation: scale dependence and interactive effects on Niwot Ridge. Plant Ecol. Divers. 8, 713–725. doi: 10.1080/17550874.2015.1010189
Tague, C., and Grant, G. E. (2009). Groundwater dynamics mediate low-flow response to global warming in snow-dominated alpine regions. Water Resour. Res. 45:W07421. doi: 10.1029/2008WR007179
Tague, C. L. (2009). Assessing climate change impacts on alpine stream-flow and vegetation water use: mining the linkages with subsurface hydrologic processes. Hydrol. Process. 23, 1815–1819. doi: 10.1002/hyp.7288
Taş, N., Prestat, E., Wang, S., Wu, Y., Ulrich, C., Kneafsey, T., et al. (2018). Landscape topography structures the soil microbiome in arctic polygonal tundra. Nat. Commun. 9:777. doi: 10.1038/s41467-018-03089-z
Touw, W. G., Bayjanov, J. R., Overmars, L., Backus, L., Boekhorst, J., Wels, M., et al. (2013). Data mining in the life sciences with Random Forest: a walk in the park or lost in the jungle? Brief. Bioinformatics 14, 315–326. doi: 10.1093/bib/bbs034
Troch, P. A., Carrillo, G. A., Heidbüchel, I., Rajagopal, S., Switanek, M., Volkmann, T. H. M., et al. (2008). Dealing with landscape heterogeneity in watershed hydrology: a review of recent progress toward new hydrological theory. Geograph. Compass 3, 375–392. doi: 10.1111/j.1749-8198.2008.00186.x
Wainwright, H. M., Dafflon, B., Smith, L. J., Hahn, M. S., Curtis, J. B., Wu, Y., et al. (2015). Identifying multiscale zonation and assessing the relative importance of polygon geomorphology on carbon fluxes in an Arctic tundra ecosystem. J. Geophys. Res. Biogeosci. 120, 788–808. doi: 10.1002/2014JG002799
Wainwright, H. M., Liljedahl, A. K., Dafflong, B., Ulrich, C., Peterson, J. E., Gusmerolia, A., et al. (2017). Mapping snow depth within a tundra ecosystem using multiscale observations and Bayesian methods. Cryosphere 11, 857–975. doi: 10.5194/tc-11-857-2017
Ward, A. S., Kurz, M. J., Schmadel, N. M., Knapp, J. L. A., Blaen, P. J., Harman, C. J., et al. (2019). Solute transport and transformation in an intermittent, headwater mountain stream with diurnal discharge fluctuations. Water 11:2208. doi: 10.3390/w11112208
Webb, R. W., Wigmore, O., Jennings, K., Fend, M., and Molotch, N. P. (2020). Hydrologic connectivity at the hillslope scale through intra-snowpack flow paths during snowmelt. Hydrol. Process 34, 1616–1629. doi: 10.1002/hyp.13686
Western, A. W., Grayson, R. B., Blöschl, G., Willgoose, G. R., and McMahon, T. A. (1999). Observed spatial organization of soil moisture and its relation to terrain indices. Water Resour. Res. 35, 797–810. doi: 10.1029/1998WR900065
Westoby, M. J., Brasington, J., Glasser, N. F., Hambrey, M. J., and Reynolds, J. M. (2012). “Structure-from-motion” photogrammetry: a low-cost, effective tool for geoscience applications. Geomorphology 179, 300–314. doi: 10.1016/j.geomorph.2012.08.021
Wigmore, O., Mark, B. G., McKenzie, J., Baraer, M., and Lautz, L. (2019). Sub-metre mapping of surface soil moisture in proglacial valleys of the tropical Andes using a multispectral unmanned aerial vehicle. Remote Sens. Environ. 222, 104–118. doi: 10.1016/j.rse.2018.12.024
Wigmore, O., and Molotch, N. P. (2018). “Assessing spatiotemporal variability in mountain ecosystem productivity with multispectral unmanned aerial systems,” in American Geophysical Union Fall Meeting, (Washington, DC: AGU). Available online at: https://agu.confex.com/agu/fm18/meetingapp.cgi/Paper/461222 (accessed June 28, 2020).
Williams, C. J., McNamara, J. P., and Chandler, D. G. (2009). Controls on the temporal and spatial variability of soil moisture in a mountainous landscape: the signature of snow and complex terrain. Hydrol. Earth System Sci. 13, 1325–1336. doi: 10.5194/hess-13-1325-2009
Williams, M. W., and Caine, N. (2001). Ch. 5 hydrology and hydrochemistry in structure and function of an alpine ecosystem. eds. W. D. Bowman, and T. R. Seastedt (New York, NY: Oxford University Press), 75–98.
Williams, M. W., Hood, E., Molotch, N. P., Caine, N., Cowie, R., and Liu, F. (2015). The ‘teflon basin’ myth: hydrology and hydrochemistry of a seasonally snow-covered catchment. Plant Ecol. Divers. 8, 639–661. doi: 10.1080/17550874.2015.1123318
Winkler, D. E. (2019). Contemporary human impacts on alpine ecosystems: the direct and indirect effects of human-induced climate change and land use. Encyclopedia of the World's Biomes. 1, 574–580. doi: 10.1016/B978-0-12-409548-9.11879-2
Winkler, D. E., Butz, R. J., Germino, M. J., Reinhardt, K., and Kueppers, L. M. (2018). Snowmelt timing regulates community compositoin, phenology, and physiological performance of alpine plants. Front. Plant Sci. 9:1140. doi: 10.3389/fpls.2018.01140
Winkler, D. E., Chapin, K. J., and Kueppers, L. M. (2016). Soil moisture mediates alpine life form and community productivity responses to warming. Ecology 97, 1553–1563. doi: 10.1890/15-1197.1
Winnick, M. J., Carroll, R. W. H., Williams, K. H., Maxwell, R. M., Dong, W., and Maher, K. (2017). Snowmelt controls on concentration-discharge relationships and the balance of oxidative and acid-base weathering fluxes in an alpine catchment, East River, Colorado. Water Resour. Res. 53, 2507–2523. doi: 10.1002/2016WR019724
Winstral, A., Elder, K., and Davis, R. E. (2002). Spatial snow modeling of wind-redistributed snow using terrain-based parameters. J. Hydrometerol. 3, 524–538. doi: 10.1175/1525-7541(2002)003<;0524:SSMOWR>;2.0.CO;2
Yang, F., Zhang, G. L., Yang, J. L., Li, D. C., Zhao, Y. G., Liu, F., et al. (2014). Organic matter controls of soil water retention in an alpine grassland and its significance for hydrological processes. J. Hydrol. 519, 3010–3027. doi: 10.1016/j.jhydrol.2014.10.054
Keywords: hydrology, critical zone, topography, random forest, Niwot Ridge LTER, Rocky Mountains, Colorado
Citation: Hermes AL, Wainwright HM, Wigmore O, Falco N, Molotch NP and Hinckley E-LS (2020) From Patch to Catchment: A Statistical Framework to Identify and Map Soil Moisture Patterns Across Complex Alpine Terrain. Front. Water 2:578602. doi: 10.3389/frwa.2020.578602
Received: 30 June 2020; Accepted: 12 October 2020;
Published: 23 November 2020.
Edited by:
Jon Chorover, University of Arizona, United StatesReviewed by:
Luca Brocca, National Research Council (CNR), ItalyCopyright © 2020 Hermes, Wainwright, Wigmore, Falco, Molotch and Hinckley. This is an open-access article distributed under the terms of the Creative Commons Attribution License (CC BY). The use, distribution or reproduction in other forums is permitted, provided the original author(s) and the copyright owner(s) are credited and that the original publication in this journal is cited, in accordance with accepted academic practice. No use, distribution or reproduction is permitted which does not comply with these terms.
*Correspondence: Anna L. Hermes, YW5uYS5oZXJtZXNAY29sb3JhZG8uZWR1
Disclaimer: All claims expressed in this article are solely those of the authors and do not necessarily represent those of their affiliated organizations, or those of the publisher, the editors and the reviewers. Any product that may be evaluated in this article or claim that may be made by its manufacturer is not guaranteed or endorsed by the publisher.
Research integrity at Frontiers
Learn more about the work of our research integrity team to safeguard the quality of each article we publish.