 Nyein Thandar Ko
 Phil Suter
 John Conallin3,4
 Martine Rutten
 Thom Bogaard
- 1Department of Water Management, Delft University of Technology, Delft, Netherlands
- 2Department of Ecology, Environment and Evolution, La Trobe University, Wodonga, VIC, Australia
- 3Institute of Land Water and Society, Charles Sturt University, Albury, NSW, Australia
- 4Department of Water Resources and Ecosystems, IHE Delft, Delft, Netherlands
Intensive and incessant disruptions in watercourses such as dams are taking place due to the growing demand for hydroelectric generation, and can result in severe deterioration of ecosystem integrity. This research concentrates on the impact of dams on macroinvertebrate communities downstream of two hydropower dams on tributaries of the upper Ayeyarwady River basin (Myitnge and Chaungmagyi Rivers) in Myanmar. A total of 52 and 49 aquatic invertebrate taxa with a total abundance of 2,743 and 1,356 were collected from the Myitnge and Chuangamgyi Rivers, respectively. We found the natural flow regime had changed in both study rivers after the construction of the dams. Analysis of similarity (ANOSIM) indicated the communities of morphospecies of taxa and the very sensitive insects (Ephemeroptera, Plecoptera, Trichoptera, and Odonata, EPTO) were significantly different between upstream and downstream of both dams. We used the preliminary Myanmar Aquatic Biomonitoring Assessment Index (MABA) detect ecological water quality. The MABA analysis using all taxa at family-level showed that upstream of the dams was rated as good quality whereas downstream of the dams was rated as fair quality. Our research showed that macroinvertebrates communities can be used as a bioindicator to detect the impact of human influences on river health such as dams. We concluded that the novel biomonitoring assessment tool recently developed for Myanmar is a promising monitoring tool as further river development occurs in Myanmar, which could also be linked to citizen science projects.
1. Introduction
Dams provide considerable social and economic benefits to human society, such as those produced by irrigation and hydroelectric power (Richter and Thomas, 2007). Although dams bring prosperity, they are cited as the most significant and incessant threat to freshwater ecosystems globally (Bunn and Arthington, 2002; Chen et al., 2011). Dams alter natural flow regimes, sediment transport, water quality, channel morphology, stream temperature, and nutrient cycles, and they also obstruct dispersal and the migration of macroinvertebrates and fish communities (Castro et al., 2013; Li et al., 2013; White et al., 2017).
In developed countries the rate of dam construction has been reducing and in some cases dams have been de-commissioned to restore the river ecosystem (Donnelly et al., 2002; Ishiyama et al., 2018). In South East Asia (SE Asia), the construction of new dams is accelerating in order to facilitate those countries' economic growth (Dugan et al., 2010), especially in Myanmar. Dudgeon (1999) pointed out that the biodiversity of rivers in tropical Asia is already threatened by existing dams.
Myanmar, a developing country in SE Asia, has abundant hydropower potential (IFC and Myanmar, 2018). The existing installed capacity of Myanmar ranges from 10 to 1,000 MW for medium to large-scale hydropower projects, and the target is to reach a total of 16,665 MW of installed capacity by 2030 (Lazarus et al., 2019). In Myanmar, most of the dams are multipurpose, used for both generating electricity and irrigation. The effects of dams are evident when researching the physical, chemical, and hydrological gap-free time series data before and after barrier construction (Chen et al., 2015; Li et al., 2017). Unfortunately, the availability of robust hydrological and meteorological datasets is relatively limited in Myanmar (Taft and Evers, 2016; Lazarus et al., 2019). Therefore, in Myanmar, studies on the impact of dams, in general, are limited.
The use of aquatic macroinvertebrate communities has received interest as a biological indicator to detect human's influence on river ecosystems, due to it being scientifically reliable, low-cost, and easy to apply by both scientists and non-scientists (Mustow, 2002; Graham et al., 2004; Buss et al., 2015; Leslie and Lamp, 2017). We can collect macroinvertebrate samples on a large spatial scale relatively easily with a simple net (Chessman, 1995; Buss et al., 2015). Macroinvertebrates play an essential role in freshwater ecosystems because they break down and transfer organic matter, which assists in the cycling of nutrients in stream ecosystems (Wallace and Webster, 1996; Hussain et al., 2012; Hauer and Resh, 2017). Also, macroinvertebrates are a primary food source of fishes and predators, meaning they are essential in the food web (Castro et al., 2013). The level of impact and pressure on a river can be observed by identifying the taxa present in different sites, upstream and downstream, in potentially impacted sites (Hocutt, 1975).
There are a significant number of studies on the impact of dams on the diversity and abundance of macroinvertebrate communities (Cortes et al., 1998; Santucci et al., 2005; Sharma et al., 2005; Xiaocheng et al., 2008; Bredenhand and Samways, 2009; Vaikasas et al., 2013; Chen et al., 2015; Serrana et al., 2018). Most of the studies reported changes in the taxonomic composition of macroinvertebrates between sites upstream and downstream of a dam (Sharma et al., 2005; Xiaocheng et al., 2008). These studies found changes in macroinvertebrate communities downstream of a dam, consisting of changes in either the abundance or diversity of taxa and species.
Bredenhand and Samways (2009) found that the species richness of macroinvertebrate communities was 50% lower downstream of a dam compared to upstream of a dam. Indeed, the sensitive insects (Ephemeroptera, Plecoptera, Trichoptera, EPT) are abundant upstream of a dam while they were rare downstream of a dam. Likewise, Vaikasas et al. (2013) stated that the abundance of macroinvertebrates was significantly reduced downstream of a hydropower dam compared to control sites (dam-unaffected), which was especially evident with more sensitive EPT taxa.
It is not only changes to the flow regime that are important. For example, the composition of benthic communities downstream of a barrier can be extensively impacted by the accumulation of organic and inorganic material in the reservoir of a dam. Similarly, a change in nutrient resources downstream of a dam can affect the taxa richness and abundance (Sharma et al., 2005). Thus, the long-term reduction in downstream movement of organic and inorganic loads can have an impact on availability of organic material as a food source for macroinvertebrates. In addition the dam and reservoir can act as barrier to drift or aerial colonization by macroinvertebrates (Kuenzer et al., 2013). Therefore, the differences in species richness upstream compared to downstream of dams are not only due to the difference in flow regime, but also the change in nutrient availability due to the accumulation of sediment and blocking of migration (Visser et al., 2017).
In Myanmar, the use of aquatic macroinvertebrate communities in the assessment of human influences on aquatic ecosystems like rivers, streams, and lakes is lacking. Previous research has been conducted on the Ayeyarwady River (about 2,210 km long) in the central dry zone of Myanmar and the lower Thanlyin River (1,224 km long), 65 km from the Andaman sea. This initial study stated that macroinvertebrates cannot be used as an indicator to define healthy river ecosystems in large rivers in Myanmar, where there are high flow fluctuations and sediment loads which can create unsuitable substrates for macroinvertebrate communities (Dickens et al., 2018). However, they suggested that there were tributaries upstream of Mandalay, that more suitable for macroinvertebrate sampling (Dickens et al., 2018) and that macroinvertebrates may be suitable for water quality assessment. A study on the Bago River (331 km long) in Myanmar also showed that macroinvertebrates can be collected in tributaries and therefore able to identify healthy river ecosystems (Eriksen et al., 2017).
Recently, the preliminary development of river health biomonitoring using macroinvertebrates has been reported (Ko et al., 2020). Due to the inexistence of biomonitoring methods in Myanmar, the preliminary development method was based on the existing Asian indexing method using taxa information from undisturbed or least-impacted sites in the upstream reaches of the Myitnge and Chuangmagyi Rivers. The study by Ko et al. (2020) shows that an indexing method using aquatic macroinvertebrate communities works well in estimating ecological river water quality, and the study recommends applying it in impacted sites (downstream) to access human influences. In the current study, we used this Myanmar-modified method to estimate ecological river water quality both upstream and downstream of dams, to see the impact of dams on river water quality.
Therefore, the objective of this research is to study the impact of two hydroelectric dams on aquatic assemblages in the Myitnge and Chaungmagyi Rivers in Myanmar.
2. Study Area and Sampling Locations
We selected two hydropower dams on different rivers, namely Myitnge (MT), and Chaungmagyi (CM) Rivers; two main tributaries of the Ayeyarwady River. The Ayeyarwady River is about 2,210 km long, and 91% of its river basin (412,500 km2) lies within Myanmar (Lazarus et al., 2019). The Myitnge River is 528 km long which begins from the hills of eastern Hseni and through Shan state and Mandalay region. The Chaungmagyi River is 100 km long and flows from the Shan Plateau of Eastern part of Myanmar and through to the central part of the country. Both study rivers have 29,630 and 5,720 km2 catchment area, respectively and end into the Ayeyarwady River near the Mandalay plain at the central dry zone of the country.
The first study dam is the Yeywa Dam-(21°40′32.42′′ N and 26°28′27.94′′ E), located in the east of Mandalay city on the Myitnge (MT) River. Its construction started in 2001 and was finished in 2010. Although the gross hydropower potential is 790 MW with four generators, currently, only approximately 25–30% of its capacity is being used (Department of Hydropower Yeywa Dam, 2017).
The second study dam is Sae Daw Gyi multipurpose dam (22°20′56.76′′ N and 96°19′21.13′′ E), located near Madaya city in the Mandalay region on Chaungmagyi (CM) River. The dam operation has been started to work in 1989. The priority of dam operation rule is irrigation water supply. And, two generators (2 × 12.5 MW) have been installed to generate hydroelectricity (Department of Irrigation, Mandalay, 2017).
Sampling sites were selected which enabled good and safe accessibility and were suitable for macroinvertebrate sampling with two upstream sites (US-1 and US-2) and two downstream sites (DS-1 and DS-2) of both dams. The first upstream sites (MT-US-1 and CM-US-1) were approximately 253 and 115 km upstream of the dams and 432 and 680 m a.s.l in the Myitnge and Chaungmagyi Rivers, respectively. The second upstream sites (MT-US-2 and CM-US-2) were situated at 98.5 and 115 km upstream of the dams with 259 and 680 m a.s.l, respectively.
Sampling sites around 5.5 and 6 km downstream of the dams (MT-DS-1 and CM-DS-1) (89.25 and 81.40 m a.s.l, respectively) were chosen. The second downstream sampling sites for the dams were selected at 40.5 and 8 km from Yeywa dam and Sae Daw Gyi dam, respectively (Figure 1). All sampling sites had cobble and sandy substrate.
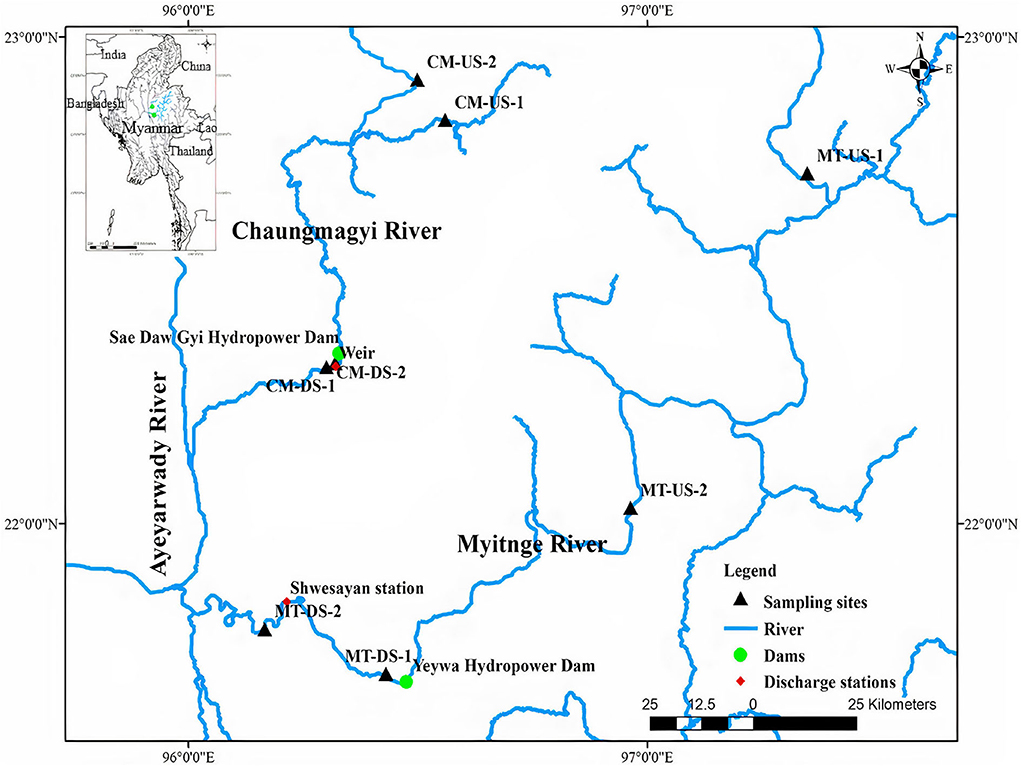
Figure 1. Locations of the sampling sites upstream and downstream of the two hydropower dams (US, upstream; DS, downstream) on Myitnge (MT) and Chaungmagyi (CM) Rivers.
3. Description Hydrological and Biomonitoring Analysis
3.1. Hydrological Analysis
We applied the Indicator of Hydrologic Alteration (IHA) version 7.1 (Richter et al., 1997) to analyse the changes in natural flow regimes from the pre-impact period to post-impact period based on a daily streamflow series.
RVA analysis using IHA software gives a series of Hydrologic Alteration (HA) factors with 33 parameters (Table 1) to show how natural flow regimes have been altered from the pre-impact period to the post-impact period. The change in frequency from pre- to a post-impact period of each parameter can be determined into three RVA category boundaries; Low, meaning HA is less or equal to 33% from median values, Middle is between 33 and 67%, and High HA includes all values >67% (The Nature Conservancy, 2009). We selected the non-parametric analysis (percentile values) for this study to calculate three different categories of values (The Nature Conservancy, 2009).
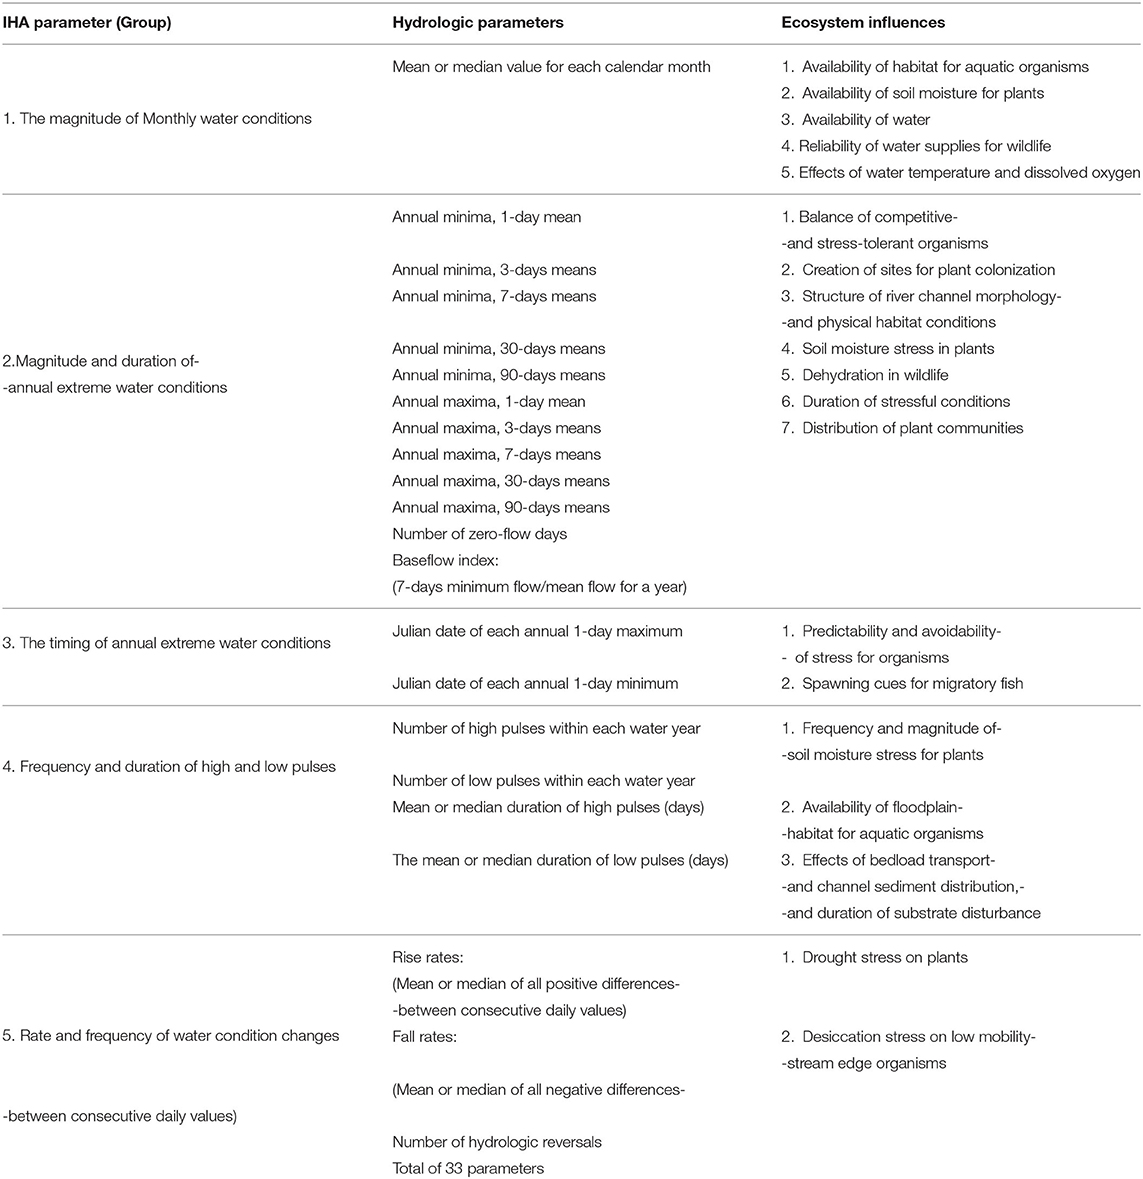
Table 1. Summary of IHA parameters (Swanson, 2002).
The following equation is used to calculate all RVA values for each of the 33 parameters;
where the expected frequency is the expected frequency in the post-impact period if it is the same flow pattern as pre-impact period, the observed frequency is the observed frequency in the post-impact period. Positive HA shows increased frequency values from pre- to post-impact period (with a maximum value of infinity), whereas negative HA shows decreased frequency values (with a minimum value of −1) (The Nature Conservancy, 2009).
We used daily flow data from 1981 to 2016 at Shwesayan discharge station (Figure 1), which was approximately 35.5 Km downstream of the MT-DS-1. We used this discharge data for the pre-impact period (1981–2001), transition period (2001–2010), and the post-impact period (2010–2016) for the Yeywa dam in the Myitnge River to quantify the changes in the frequency, duration, magnitude, and flow fluctuations due to the impact of the dam.
For Chaungmagyi River, we used historic daily flow data (1969–2016) recorded at the weir, which is four kilometers downstream of the Sae Daw Gyi dam. There is a large data gap, so we used 10 years of daily discharge from 1969 to 1978 as pre-impact period and 21 years of daily discharge from 1996 to 2016 as a post-impact period without a transition period for analysis of the Sae Daw Gyi multipurpose dam.
3.2. Physico-Chemical Parameters
Spot samples of pH, turbidity, water temperature, and electrical conductivity were collected at the time of macroinvertebrate sampling at each sampling site. We used a Simplex Health pH test strips (ranged 4.5–9.0), Ground Truth water clarity tubes, and Greisinger, GMH 3400 series meter to measure pH, turbidity [Nephelometric Turbidity Units, NTU], water temperature [°C] and electrical conductivity (EC) [μ S cm−1].
3.3. Biological Sampling
At each site three macroinvertebrate samples were collected (Masese and Raburu, 2017) each from a five-meter transect parallel to the riverbank. A sweep-net/kick sampling method was used by disturbing the substrate by kicking. We used Nylon net 500 μm mesh size to be sure the aquatic macroinvertebrates can be retained in the net as discussed by Buss et al. (2015). Each sample was preserved with 70% ethanol on-site for later laboratory identification. The three samples were treated as discrete sample. We did two sampling occasions with the same sampling regime in low flow conditions during November–December 2016 and February–March 2017.
3.4. Ecological Water Quality Index
We estimated the ecological river water quality at all sampling sites in both study rivers using Myanmar Aquatic Biomonitoring Assessment Index (MABA) method by Ko et al. (2020) based on all collected taxa of three macroinvertebrates samples at each site. We calculated the ecological river water quality index using all collected and identified taxa in the laboratory with the following equation of MABA (Ko et al., 2020);
The score of individual taxa ranges from 1 to 10 in the MABA method. The MABA method classifies three different ecological river water quality level based on the calculated index; between 1 and 2.9 means poor water quality, between 3.0 and 6.9 means fair water quality, and between 7.0 and 10.0 means good water quality (Ko et al., 2020).
3.5. Statistical Analysis
For statistical analysis, we used the statistical program PRIMER v6 (Clarke and Gorley, 2006). Taxa matrix was constructed using a square root transformation. Then, the taxa resemblance matrix was computed using Bray-Curtis similarity using 999 random permutations as a function of sampling sites (upstream and downstream) and sampling season. We used dimensionless non-metric multidimensional scaling (MDS) plot to check the difference in macroinvertebrate composition among sampling sites and time. MDS plots display the rank order distance correlation among the resemblance matrix produced by Bray-Curtis similarity (Clarke, 1993). MDS plots show stress value which ranges from 0 to 1.0. Stress value with smaller than 0.05 means a near-perfect representation of ordination space, meaning there is no overlap between sample variables (Clarke, 1993).
We used a one-way analysis of similarity (ANOSIM) to test the null hypothesis of no community differences between sites upstream and downstream of the dams and between sampling time. A Bray-Curtis similarity resemblance matrix was calculated using 999 permutations (Clarke and Gorley, 2006).
To check the percentage of similarity/dissimilarity of communities, we used similarity analysis (SIMPER) routine of PRIMER v6 (Clarke and Gorley, 2006). SIMPER provides the percentage of the contribution of individual taxa which support the percentage of (dis)similarity of communities between upstream and downstream, and between different sampling periods. We used the feeding traits of the macroinvertebrates as indicators in SIMPER to examine the contribution of each feeding behavior. We determined the feeding traits for each taxon using the functional feeding groups in Dudgeon (1999) and Merritt et al. (2002).
All analyses were undertaken using two methods, firstly using the lowest taxonomic level of identification (morphospecies) for all collected taxa and secondly the only Ephemeroptera, Plecoptera, Trichoptera, and Odonata (EPTO) taxa.
For taxa identification we used the identification keys from the Mekong River and tributaries (Narumon and Boonsoong, 2004) where climate and watershed characteristics are similar to Myanmar's rivers. We identified collected taxa into family and morphospecies level of taxonomy in this study.
4. Results
4.1. Hydrological Analysis
The results of IHA using historic daily discharge data before and after the construction of the dams are shown in Figure 2. The flow regime changed after the construction of the barriers in both rivers. However, in the Myitnge River the post-impact flows were reduced from June to November and increased in January to May but the seasonality of flow was maintained (Figure 2A). In the Chaungmagyi River the seasonal pattern was lost and magnitude of flows was greatly reduced throughout the year (Figure 2B).
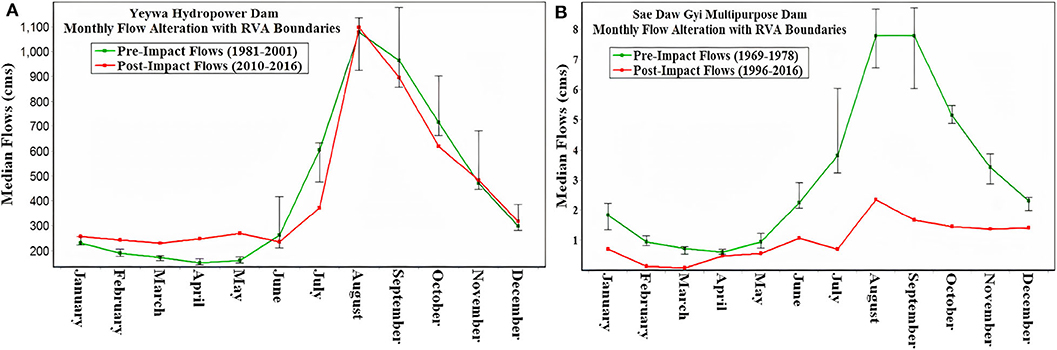
Figure 2. Monthly flow alteration of pre- and post-impact periods (A) on the Myitnge River downstream of Yeywa dam and, (B) on the Chaungmagyi River downstream of Sae Daw Gyi dam.
Indeed, the RVA analysis for the Myitnge River showed an increase in the magnitude of monthly median flows in high RVA categoryfrom pre-to post impact period in the period of January–May within the high RVA category (Figure 2A). The highest flow alterations occur in April and May with 64 and 67% increase in magnitude during post impact period. The alteration in the magnitude of monthly median flows in other months were not significant, except in July, which showed 38% decrease in magnitude in post impact period (Figure 2A).
In Myitnge River, there was an increase in the frequency of values in high RVA range for both minimum (the annual 1-, 3-, 7-, 30-, and 90-day) and maximum flows (the annual 1-, 3-, and 7-day) but the frequency of values for the annual 30- and 90-day maximum flows decreased with middle RVA range (Figure 3A).
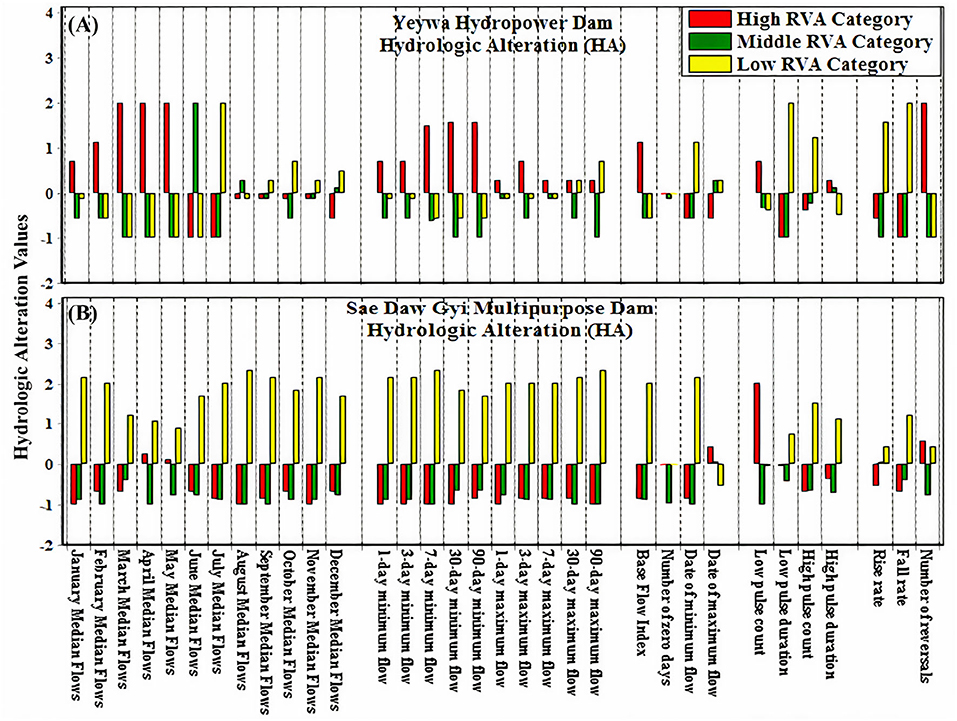
Figure 3. The Results of Hydrologic Alteration (HA) with three different RVA categories (A) in Myitnge (Yeywa) and (B) Chaungmagyi (Sae Daw Gyi) Rivers; positive HA values indicate a higher frequency, magnitude, and duration of values in the given range of RVA (Low, Middle, High).
On the other hand, in the Chaungmagyi River, the magnitude of monthly median flows and the duration and frequencies of minimum and maximum flow (the annual 1-, 3-, 7-, 30-, and 90-day) decreased in the whole year after the construction of Sae Daw Gyi multipurpose Dam with high and medium RVA being close to the theoretical minimum value of −1 (Figure 3B).
The base flow index has gone up 47% in Myitnge River and down in Chaungmagyi River with almost 100% (close to the theoretical minimum value of −1) during post-impact period. The number of zero flow days in Myitnge River was negligible in both pre- and post-impact period whereas the number of Julian dates of zero flow has increase from 0 to 49 from pre-to post-impact period in the Chaungmagyi River with RVA categories being close to −1.
The Julian dates of minimum and maximum flows were earlier in Myitnge River during post-impact period with 16 and 5% differences, respectively. In Chaungmagyi River, the Julian dates of minimum flows were 75% earlier from pre-to post-impact period with high RVA categories being close to −1, but the Julian dates of maximum flows were 10% late from pre-to-post-impact period.
Both the number and duration of low and high pulses have increased in the post-impact period in the Myitnge and Chaungmagyi Rivers, except that the duration of the high pulse has decreased with high RVA in the Myitnge River.
The flow rise rate has decreased by 38% and the flow fall rate has increased by 233% from pre-impact to the post-impact periods in the Myitnge River where water has been stored and released for the generation of hydroelectric power. On the other hand, both rise and fall rate of the flow regime have gone down by 97% in the post-impact period in the Chaungmagyi River where irrigation water supply was a priority for the dam operation.
Lastly, the number of reversals has significantly increased by more than 120% in Myitnge River during post-impact period whereas the number of reversals has gone up by only 2% in the Chaungmgagyi River after the construction of Sae Daw Gyi dam.
4.2. Physico-Chemical Water Quality Parameters
We collected four physico-chemical water quality parameters to see the water quality conditions at the time of sampling in all sampling sites (Table 2). Turbidity of the water in the Myitnge River ranged from 4.0 to 7.0 [NTU]. In contrast, the turbidity in the Chaungmagyi River ranged from 4 to 498 [NTU] with the highest values of 307.8 and 498 [NTU] at the upstream site (CM-US-I-1 and CM-US-I-2).
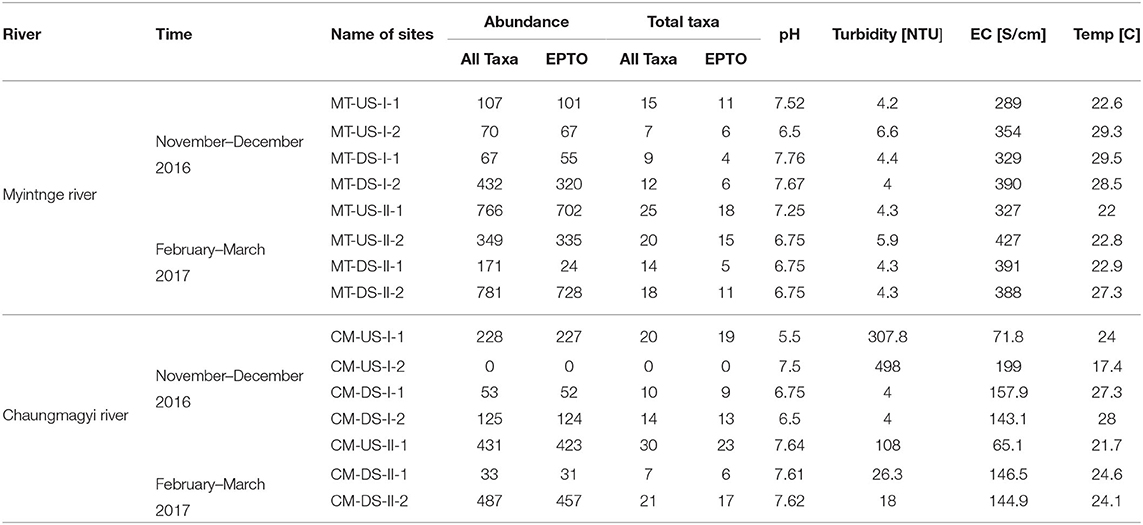
Table 2. Collected abundance and taxa richness of all macroinvertebrates taxa and EPTO with four Physico-chemical water quality parameters at each sampling site in Myitnge and Chaungmagyi Rivers for two sampling periods.
The EC values differ little between upstream and downstream of the Yeywa Dam. The EC values were similar upstream and downstream of the Yeywa Dam (ranging from 289 to 390 μ S cm−1 in November–December 2016 and 323–427 μ S cm−1 in February–March 2017) although upstream values were generally lower than downstream. In the Chaungmagyi River the EC ranged from 72 to 199 μ S cm−1 in November–December 2016 and 65 to 146 μ S cm−1 in February–March 2017. CM-US-I was <72 μ S cm−1 on each sampling occasion.
The pH values at all sampling sites were above 6 with the exception of the site upstream of the Sae Daw Gyi dam (CM-US-I-1) with a pH of 5.5 in November–December 2016.
Temperature in the upper tributary of the Myitnge River (MT-US-I) was near 22°C on both sampling occasions but in the lower catchment upstream and downstream of the dam the water temperature was near 29°C in November-December 2016 and near 23°C in February March 2017, although the most downstream site (MT-DS-II-2) was some 5°C warmer. In the Chaungmagyi River the November–December 2016 temperature in the upstream sites ranged from 17 to 24°C and at downstream sites ranged from 27 to 28°C. In February–March 2017 the upstream site was 21.7°C and downstream sites were near 24°C.
4.3. Macroinvertebrate Analyses
We found a total of 52 and 49 aquatic invertebrate taxa (morpho-species) from the Myitnge and the Chaungmagyi Rivers, respectively (Table 3) with 27 EPTO taxa in the Myitnge River and 35 in the Chaungmagyi River. Total number of families was 37 and 27 in the Myitnge and Chaungmagyi Rivers, respectively. Insects dominated the species richness at all sites with 50 taxa in the Chaungmagyi River and 45 morpho-species in the Myintnge River. There were six mollusc taxa and 1 crustacean in the Myitnge River, but these groups were not found in the Chaungmagyi River.
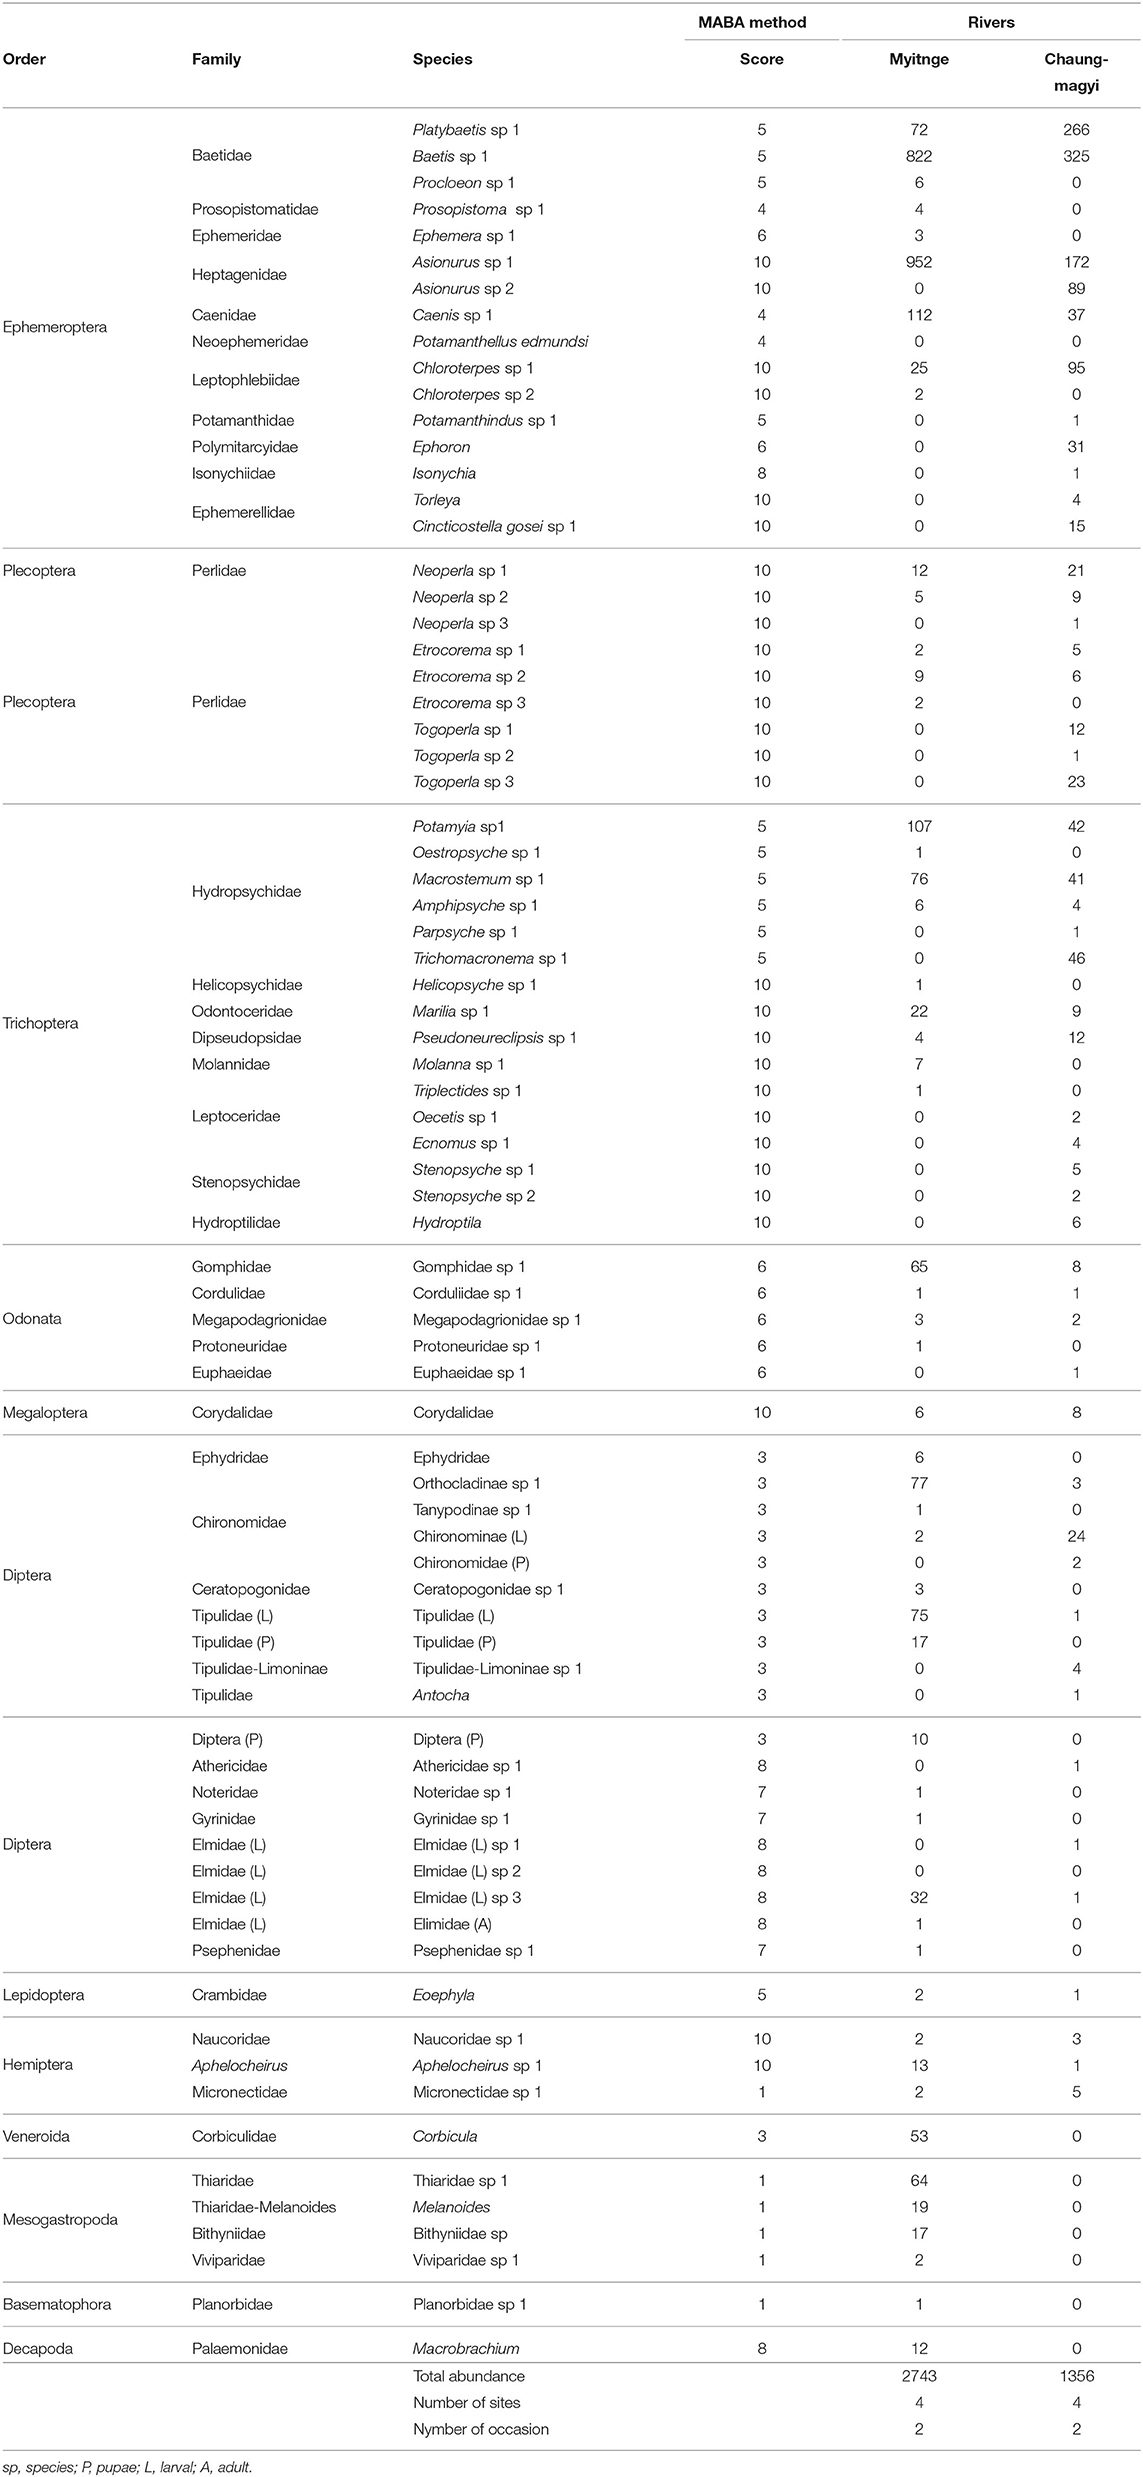
Table 3. Collected total abundance and their score of The Myanmar Aquatic Biomonitoring Assessment Index (MABA) by Ko et al. (2020).
Table 2 shows the number of total abundance and taxa of all taxa and sensitive taxa (Ephemeroptera, Plecoptera, Trichoptera, Odonata: EPTO) at all sampling sites including physico-chemical water quality parameter in both rivers. The second upstream site of Chaungmagyi River (CM-US-I-2) showed zero macroinvertebrates in the November–December 2016 sample.
We recorded the highest species richness of all taxa and EPTO from upstream of the Sae Daw Gyi dam (CM-US-I-1 & CM-US-II-1) during both sampling occasions (20 & 30 all morpho-species, and 19 & 23 EPTO taxa). We found the highest abundance of both all and EPTO taxa (432 & 781 individuals all taxa, and 320 & 728 individuals EPTO) from the downstream sites of Myitnge River (MT-DS-I-2 & MT-DS-II-2). We found the lowest abundance of all taxa and EPTO in sampling sites just downstream the hydropower dams; 53 and 33 individuals of all taxa in site CM-DS-I-1 and CM-DS-II-1, and 55 and 24 individuals of EPTO in site MT-DS-I-1 and MT-DS-II-1 (Table 2).
The abundance of macroinvertebrates ranged from 31 to 457 individuals per sample in the Chaungmagyi River and 24 to 728 in the Myitnge River, respectively. Mean taxonomic richness per sample was 11.5 and 8.75 taxa at upstream sites and 8.4 and 6.4 taxa at downstream sites on the Chaungmagyi and Myitgne Rivers, respectively. The mean abundances per sample at upstream sites and the downstream sites were 109.8 and 107.7 individuals at upstream sites and 69.7 and 145.1 at downstream sites on the Chaungmagyi and Myitgne Rivers, respectively.
4.4. Multivariate Analyses
All statistical analyses were carried out using all taxa and only EPTO taxa to find the difference in communities between sampling sites and time on both study rivers.
4.4.1. Myitnge River—(Yeywa Hydropower Dam)—Morphospecies-Level of All Aquatic Macroinvertebrates Taxa
All taxa resemblance matrices were calculated using Bray-Curtis similarity as a function of sampling sites (upstream and downstream) and sampling periods (November–December 2016 and February–March 2017). The calculated MDS stress values for both functions of sampling sites and time were high at 0.22 (Figures 4A,B). The MDS plot showed that there was no overlap in multidimensional space by the spread of points between upstream and downstream sites, and the ANOSIM analyses indicated significant differences in community structure between sampling sites. The p-value was smaller than 0.001 according to the Global R test with 1,000 permutations. The separation between the two sampling periods was not significant (p = 0.9).
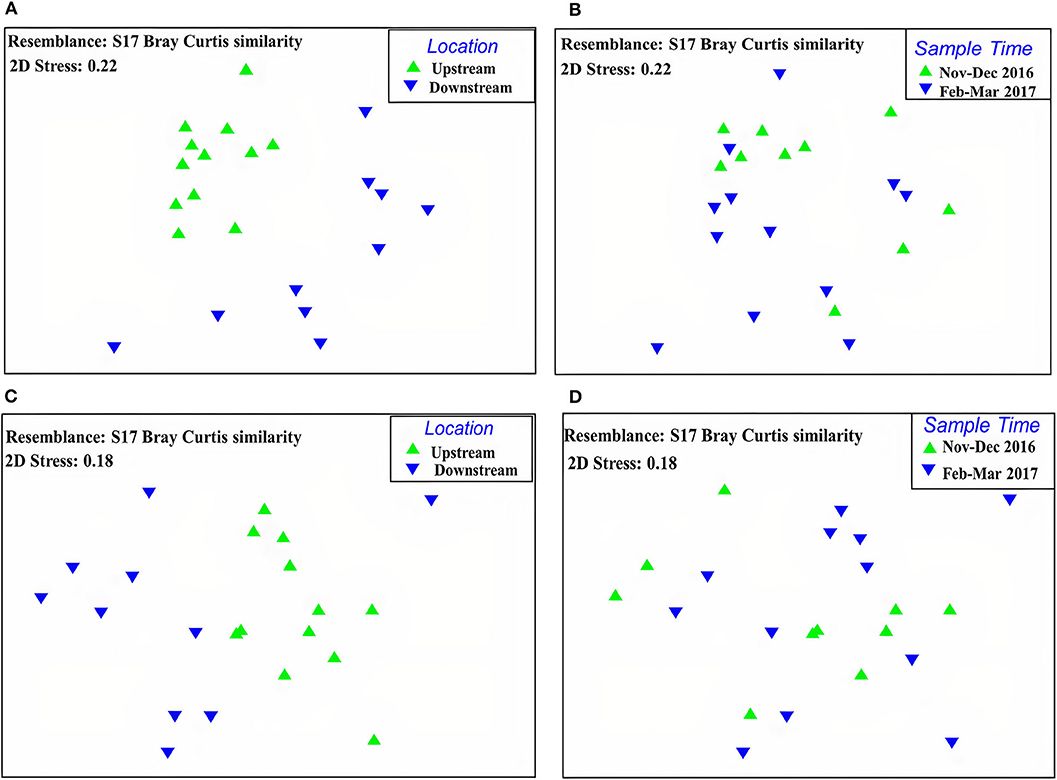
Figure 4. Non-metric Multidimensional Scaling (MDS) plots for comparison of sampling sites (upstream and downstream) and sampling period (November–December 2016 and February–March 2017) in Myitnge River, (A): the comparison of all taxa communities between sampling sites, (B): the comparison of all taxa communities between sampling periods, (C): the comparison of EPTO taxa communities between sampling sites, (D): the comparison of EPTO taxa communities between sampling periods.
SIMPER analysis between the upstream and downstream sites showed six taxa accounted for 91% of the community upstream of the dam and five taxa accounted for 91% downstream of the dam (Table 4). Of these taxa, only two were common to the two zones, Platybaetis sp1 (Average abundance of 1.84 upstream and 0.44 downstream) and Asionurus sp1 (Average abundance of 0.81 upstream and 6.29 downstream) yielding an 88.57% dissimilarity between upstream and downstream sites.
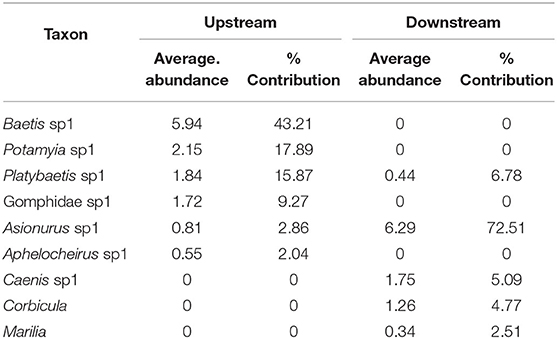
Table 4. The percentage of contribution of all taxa with their average abundance between sampling locations (upstream and downstream) of the Yewar hydropower dam on Myitnge River (88.57% dissimilarity in communities between upstream and downstream sites).
Upstream of the dam there were three functional feeding groups represented, namely collector-gatherers, filter feeders, and predators. Collector-gatherers which feed mainly on detritus and fine particulate organic material included the two baetid mayflies Baetis and Platybaetis. The filter feeders which also feed on suspended detritus included the hydropsychid caddis fly Potamyia (coarse to fine particulate organic material) and the heptageniid mayfly Asionurus which is a burrower feeding on fine organic material. The predators were the dragonfly Family Gomphidae and the true bug (Hemiptera) Aphelocheirus. Downstream the same functional feeding groups were represented but usually by different taxa. The collector–gatherers, were the mayfly Baetis and the caenid mayfly Caenis. Filter feeders included the burrowing mayfly Asionurus which was most abundant and the bivalve mollusc Corbiculina. The predator was the Odontocerid caddisfly Marilia.
4.4.2. Myitnge River (Yeywa Hydropower Dam)—Morphospecies-Level of Ephemeroptera, Plecoptera, Trichoptera, and Odonata, (EPTO)
There is a distinct separation of the EPTO communities between upstream and downstream of the dams demonstrated by MDS with the stress level of 0.18 and no overlap in ordination space (Figure 4C). ANOSIM Global R test showed the EPTO communities were significantly different between upstream and downstream at the P-value of 0.001 with 1,000 permutations. However, the sample time (November–December 2016 and February–March 2017) for the upstream and downstream the dam sites showed overlap in multidimensional space, indicating there was no difference between the sampling dates (Figure 4D) with P-value of 0.9.
SIMPER analysis based on the sampling location (Table 5) showed six species accounted for 90% of the community upstream of the dam and four taxa accounted for 90% downstream of the dam. Platybaetis sp1 (average abundance of 1.09 upstream and 0.42 downstream) and Asionurus sp1 (average abundance of 0.62 upstream and 2.06 downstream) accounted for a percentage dissimilarity of 78.19 between upstream and downstream sites (Table 5).
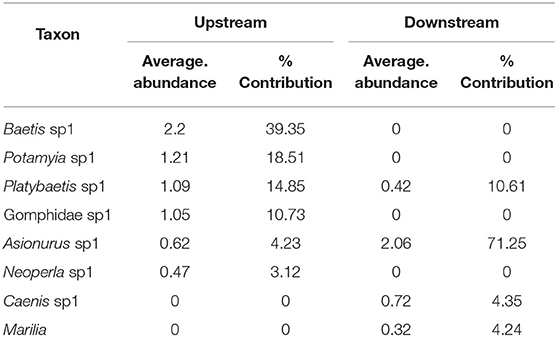
Table 5. The percentage of contribution of EPTO taxa with their average abundance between sampling locations (upstream and downstream) of the Yewar dam on the Myitnge river (78.19% dissimilarity in EPTO communities between upstream and downstream sites).
The functional feeding groups were similar upstream to those identified in the total taxa analysis. Downstream the EPTO taxa were the same as in the total taxa analysis.
4.4.3. Chaungmagyi River (Sae Daw Gyi Multipurpose Dam)—Morphospecies-Level of All Aquatic Macroinvertebrates Taxa
The MDS plot demonstrated that there was a distinct separation of the macroinvertebrate communities upstream and downstream the dam. The stress level was 0.16 indicating the separation is a reasonable representation of differences between the two communities (Figure 5A). ANOSIM P-value by the Global R test showed significant differences between upstream and downstream (p = 0.015). The sample time (season) for the upstream and downstream the dam sites showed no overlap in multidimensional space, indicating there was a difference between the sampling dates (stress = 0.16) (Figure 5B). ANOSIM P-value by the Global R test showed that there was a difference between sampling dates (p = 0.008).
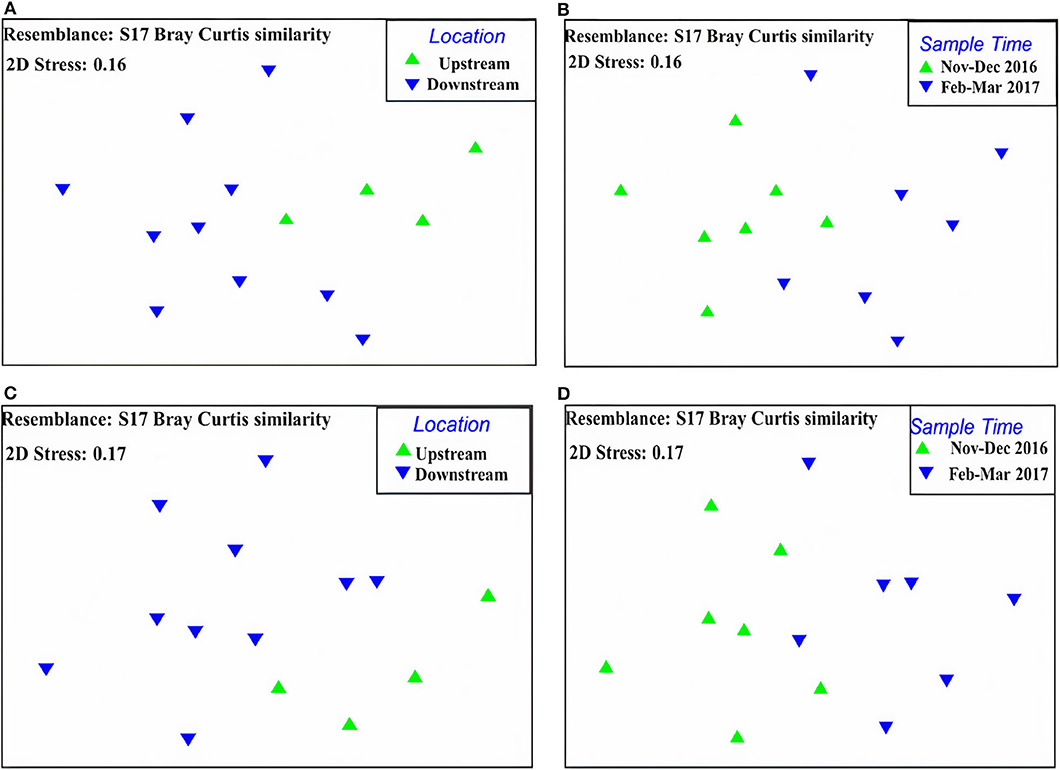
Figure 5. Non-metric Multidimensional Scaling (MDS) plots for comparison of sampling sites (upstream and downstream) and sampling period (November–December 2016 and February–March 2017) in Chaungmagyi River, (A): the comparison of all taxa communities between sampling sites, (B): the comparison of all taxa communities between sampling periods, (C): the comparison of EPTO taxa communities between sampling sites, (D): the comparison of EPTO taxa communities between sampling periods.
SIMPER analysis indicated that six taxa accounted for over 90% of the community upstream of the dam, and eight taxa accounted for over 90% downstream of the dam. Three mayflies were common in upstream and downstream sites, Platybaetis sp1 (Average abundance of 1.68 upstream and 1.34 downstream), Baetis sp1 (Average abundance of 1.77 upstream and 1.2 downstream) and Asionurus sp1 (Average abundance of 0.75 upstream and 1.3 downstream) with 73% dissimilarity between zones (Table 6).
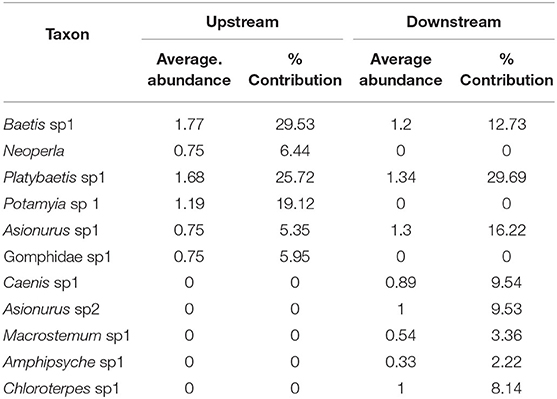
Table 6. The percentage of contribution of all taxa with their average abundance between sampling locations (upstream and downstream) of the Sae Daw Gyi multipurpose dam on Chaungmagyi River (73% dissimilarity in communities between upstream and downstream sites).
SIMPER analysis between the different sampling dates showed five taxa accounted for over 90% of the community in November–December 2016 and 13 taxa accounted for over 90% of the community in the February–March 2017. Of these taxa four mayfly taxa were common to the two sampling periods, Platybaetis sp1 (Average abundance of 1.67 in 2016 and 1.16 in 2017), Baetis sp1 (Average abundance of 1.19 in 2016 and 2.12 in 2017), Asionurus sp1 (Average abundance of 0.79 in 2016 and 1.53 in 2017), and Caenis sp1 (Average abundance of 0.38 in 2016 and 0.73 in 2017) with 71.06% dissimilarity between dates (Table 7).
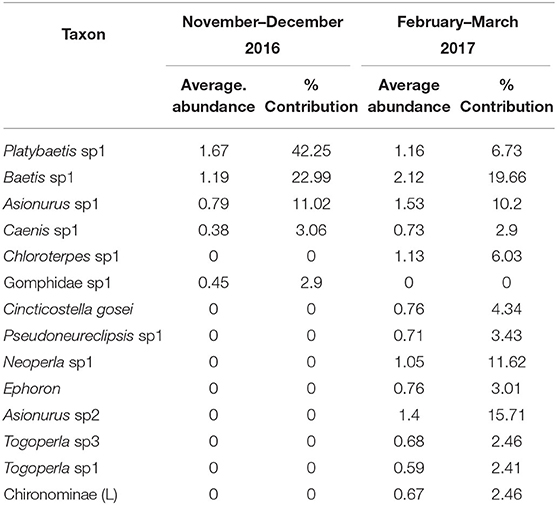
Table 7. The percentage of contribution of all taxa with their average abundance between sampling periods (November–December 2016 and February–March 2017) of the Sae Daw Gyi multipurpose dam on Chaungmagyi River (71.06% dissimilarity in communities between sampling periods).
Three functional feeding groups were collected upstream of the Sae Daw Gyi multipurpose dam in the Chaungmagyi River. Collector-gatherers included the two baetidae mayflies Baetis and Platybaetis. The filter feeders included the hydropsychid caddisfly Potamyia and the heptageniid mayfly Asionurus. The predators were the gomphid dragonfly, and the perlid stonefly Neoperla.
Only two functional feeding groups were found downstream of the dam. The baetid mayflies Baetis and Platybaetis, the caenid mayfly Caenis and the leptophlebiid mayfly Chloroterpes were dominant for collector-gatherers. Filter feeders included two species of the burrowing mayfly Asionurus and the hydropsychid caddisflies Macrostemum and Amphipsyche.
Samples in November–December 2016 had three functional feeding groups represented. Collector-gatherers included the two baetidae mayflies Baetis and Platybaetis, the caenid mayfly Caenis and the leptophlebiid Chloroterpes. Filter feeders included the same families with sampling sites comparison (Potamyia and Asionurus). The gomphid dragonfly was the predator.
Samples in February–March 2017 had four functional feeding groups represented. The collector–gatherers, were same as in the November–December 2016 samples. Filter feeders included two species of the burrowing mayfly Asionurus, the polymitarcid mayfly Ephoron, and the caddisfly Pseudoneuroclipsis The predators were the stoneflies Neoperla and two species of Togoperla. The mayfly, Cincticostella gosei is a shredder feeding on large particulate organic material such as leaves.
4.4.4. Chaungmagyi River (Sae Daw Gyi MultipurposeDam)—Morphospecies-Level of Ephemeroptera, Plecoptera, Trichoptera, and Odonata, (EPTO)
MDS plot showed there was a distinct separation of the macroinvertebrate communities upstream and downstream the dam using only the EPTO taxa. The stress level was high at 0.17, and there was no overlap in ordination space (Figure 5C). The Global R-value for the site comparison indicated that there was a significant difference (p = 0.012) between the communities upstream and downstream of the dam.
The sample time (season) for upstream and downstream the dam sites showed little overlap in multidimensional space (Figure 5D) but generally indicated there was a difference between the sampling dates, which was confirmed with the Global R with p = 0.012.
SIMPER analysis indicated upstream of the Sae Daw Gyi dam six taxa contributed 90% of the community and downstream seven taxa were dominant (Table 8). The taxa common to both zones were Platybaetis sp1 (Average abundance of 1.19 upstream and 1.34 downstream), Baetis sp1 (Average abundance of 1.77 upstream and 1.20 downstream) and Asionurus sp1 (Average abundance of 0.75 upstream and 1.30 downstream). Potamyia sp1, Neoperla sp1, and Gomphidae sp1 were only recorded upstream and Caenis sp1, Asionurus sp2, Chloroterpes sp1, and Macrostemum sp1 were only recorded downstream. The dissimilarity of communities between upstream and downstream was 68.58%, supporting the conclusion the communities upstream and downstream were different.
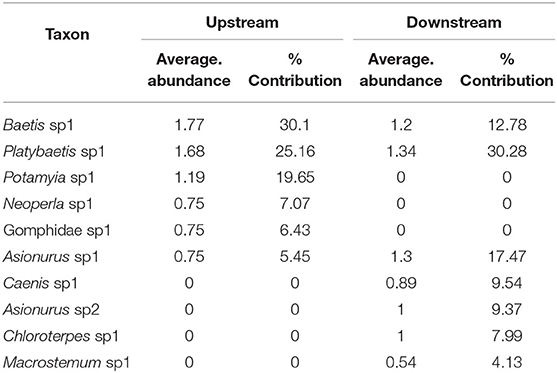
Table 8. The percentage of contribution of EPTO taxa with their average abundance between sampling locations (upstream and downstream) of the Sae Daw Gyi multipurpose dam on Chaungmagyi River (68.58% dissimilarity in communities between upstream and downstream sites).
Both the similarity results by SIMPER using all taxa and EPTO contributions between sampling periods were similar with five taxa accounting for over 90% of the community in November–December 2016 and 12 taxa in February–March 2017. Of these taxa the same four mayfly taxa were common to the two sampling periods as in the all taxa analysis, Platybaetis sp1 (Average abundance of 1.67 in 2016 and 1.16 in 2017), Baetis sp1 (Average abundance of 1.19 in 2016 and 2.12 in 2017), Asionurus sp1 (Average abundance of 0.79 in 2016 and 1.53 in 2017), and Caenis sp1 (Average abundance of 0.38 in 2016 and 0.73 in 2017) with 67.05% dissimilarity between dates. (i.e., sampling dates with different communities.) (Table 9).
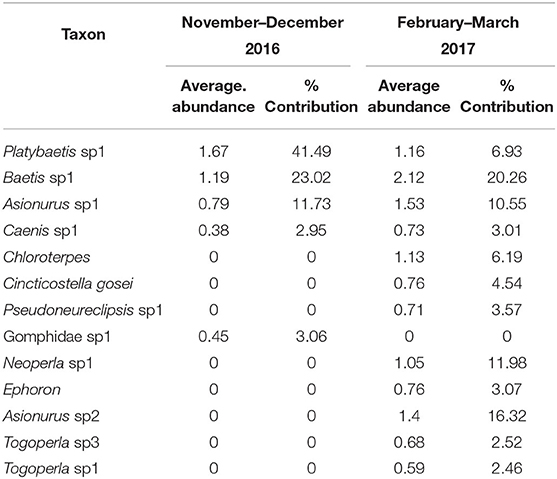
Table 9. The percentage of contribution of EPTO taxa with their average abundance between sampling periods (November–December 2016 and February–March 2017) of the Sae Daw Gyi multipurpose dam on Chaungmagyi River (67.05% dissimilarity in communities between sampling periods).
4.5. Ecological Water Quality Index
We determined the ecological water quality conditions at each sampling site in both rivers using the MABA rapid assessment method by Ko et al. (2020). Both rivers showed good water quality conditions in all upstream sites in both sampling period (> 6.9 Index value) (Figure 6). In the Chaungmagyi River, the first downstream site (CM-DS-I-1, CM-DS-II-1) just 6 km downstream of the dam, had index values of 5.1 and 6.9, respectively in 2016 whereas the second downstream site which was 8 km from the dam (CM-DS-I-2, CM-DS-II-2) had indices of 6.6 and 7.9, respectively in 2017. Similarly, in the Myitnge River during the first sampling occasion in 2016 the index was lowest closer to the dam site (MT-DS-I-1, 5.0) than site (MT-DS-I-2, 6.9) some 40 km downstream of the dam. During the second sampling occasion in 2017, both downstream sampling sites in the Myitnge River showed similar poor water quality conditions (MT-DS-II-1, 4.8 and MT-DS-II-2, 4.7).
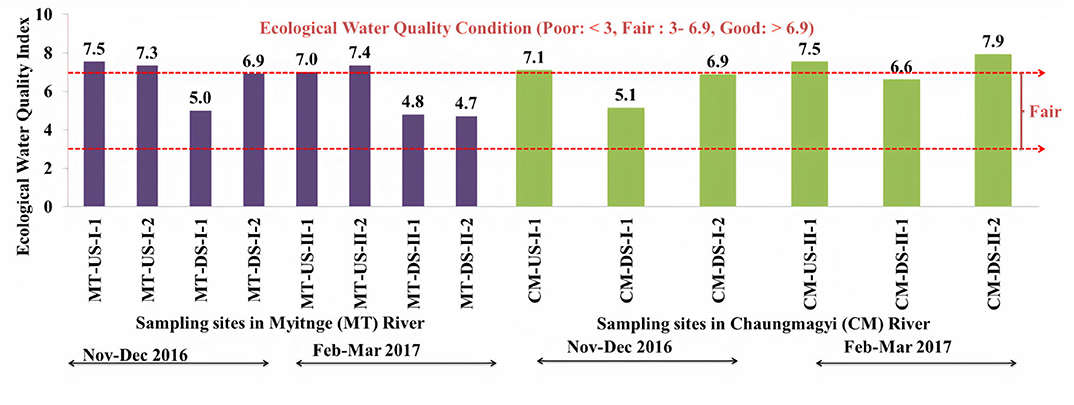
Figure 6. Calculated ecological river water quality index using rapid biomonitoring index method by Ko et al. (2020) in Myitnge (MT) and Chaungmagyi (CM) Rivers during two sampling periods using all collected taxa at each sample at each site; US-upstream, DS-downstream, I-first sampling period (November–December 2016), II-second sampling period (February–March 2017).
5. Discussion
5.1. Changes in Hydrology
According to the data analysis of historical flows between pre- and post-impact periods by IHA, we found that the magnitude of monthly median flow changed in both rivers after the construction of the dams, but the degree of change was individually different based on the respective dam operation rules. Indeed, the difference in the magnitude of monthly median flow from pre- to post-impact periods is significant throughout the year in Chaungmagyi River, where water extraction for irrigation purposes is a priority (Figure 2B). On the other hand, there was no significant alteration in flow regime over the year in the Myitnge River, where the water is used to run turbines to generate hydroelectricity (Figure 2A). This is typical for the operation of hydropower reservoirs and for example was also found by Li et al. (2017) in a study on the impact of hydropower dams in Mekong River. Li et al. (2013) and Kuenzer et al. (2013) showed that different reservoir operation rules caused increased flows during the dry season and decreased flows during the wet season downstream of the dams, with a varying degree of change based on a particular purpose.
Furthermore, there is uncertainty regarding the quality of hydrometeorological data in Myanmar (Eulderink, 2019; Lazarus et al., 2019). The latter study on Myitnge River reported that the annual runoff data compared to the annual precipitation do not fully match which also could have its effect on the given extreme conditions of duration, timing, and frequency. The overall loss of a seasonal flow signal that occurs in the Chaungmagyi River due to irrigation demands is consistent with rivers where the primary consumptive use is for irrigation. This pattern is now the norm in the Murray River, Australia (Thoms et al., 2000).
5.2. Changes in the Ecosystem
Changes in the hydrological regime can directly impact the diversity and composition of aquatic macroinvertebrates and fish, downstream of the dam (Bunn and Arthington, 2002; Serrana et al., 2018). We found a lower number of species downstream than upstream in both rivers (Table 2). The greatest change in the hydrological regime was in the Chaungmagyi River with a reduced median flow in every month of the year with a loss of a seasonal pattern. This river, which has a high irrigation demand, is similar to other rivers where the greatest consumptive use is for irrigation. The River Murray in Australia has a reduction of flows from 11,883 GL/y under natural flows to 2,539 GL/y under current conditions (Boulton and Brock, 1999) and the seasonal pattern is not only lost but in fact reversed (Thoms et al., 2000). These changes have altered the river's hydrological regime to one of drought years (61 years per 100 years compared with 5 years per 100 years under natural conditions) (Boulton and Brock, 1999). Recent studies by Paul et al. (2018) and Le et al. (2020) have shown that the macroinvertebrate fauna are impacted by the changes in hydrology and take over three decades to recover after a flood event (Le et al., 2020).
Alterations in the magnitude of flows can cause unreliable habitat availability, water availability which can affect water temperature, and dissolved oxygen levels for aquatic communities (Swanson, 2002). The percentage dissimilarity in communities downstream of the dams was higher in the Myitnge River (89%) than in the Chaungmagyi River (73%). The dam on the Myitgne River is primarily used for hydroelectricity generation and although not substantially changing the monthly flows compared with pre-impact power generation is usual that flows vary daily depending on power demand resulting in high flows (hydro-peaking) followed by low flow. These conditions impact the river habitats by altering the wetting and drying of the littoral zone occupied by the benthic fauna (Richter et al., 1996) and impacting the macroinvertebrate communities (Gore, 1994) and may account for the higher dissimilarity in this river.
In addition to changes in flow regime, food availability may partly explain the change in species composition between upstream and downstream. Fine particulate organic material is usually stored in the reservoir behind dams thus reducing organic particulates flowing downstream (Boulton and Brock, 1999). The operation of the two dams studied release water from the epilimnion which is the main zone of algal production. It may be that phytoplankton and zooplankton are discharged downstream during releases providing food for filter feeders, which are dominant downstream of the dams. Bredenhand and Samways (2009) found that filter feeders are in greatest abundance further downstream of dams, where there is plenty of fine particulate organic matter (FPOM). On the Myitnge River, collector-grazers were dominant upstream of the Yeywa dam compared to filter feeders downstream of the dam (Tables 4, 5). On the Chaungmagyi River (Tables 6, 8), collector-gatherers were dominant both upstream and downstream of Sae Daw Gyi dam. This difference may be due to the more stable water levels as irrigation water is released downstream of the Sae Daw Gyi dam compared with the hydro-peaking effects from power generation below the Yeywa dam.
In addition, the waste products of other anthropogenic activities, such as industry and agriculture, may have an impact on the macroinvertebrate communities along the river (Sharma et al., 2005). In this case study, there were agricultural activities upstream and downstream of both dams (FAO, 2009), which can contribute to the observed changes and can, with our dataset, not be completely separated from the effects of dams.
5.3. Physico-Chemical Water Quality Variables
The collected general physico-chemical water quality variables, such as electrical conductivity (150–500 μ S cm−1), were within the normal range of freshwater aquatic life (Bacey and Spurlock, 2007). However, at the sites CM-US-I-1 and CM-US-I-2 on the Chaungmagyi River, turbidity exceeded this range. One reason for the high turbidity values (308, 498 NTU) at the upstream sites in Chaungmagyi River may be the inflow from the ruby mining wetlands. Along the Chaungmagyi River is a large ruby production zone (Hughes, 2013). During our field sampling, we found that the color of the river was red in this area, and that local people sometimes call the river the “Red River” instead of the Chaungmagyi River. However, the turbidity did not seem to affect the macroinvertebrate composition in the investigated sites. We did not find any significant changes in the macroinvertebrate communities between the first sampling period with higher turbidity and the second sampling period with lower turbidity. Anderson et al. (2006) also reported that most taxa, such as sensitive taxa (Ephemeroptera), are not affected by turbidity as high as 1,000 NTU.
Besides this, site CM-US-I-1 showed a pH value (pH: 5.5, Table 2) lower than the healthy range for fish and macroinvertebrate communities (pH: 6.5–9.0, according to Ward et al., 1992). However, we found a high number of sensitive insects (Ephemeroptera and Plecoptera), which considered considered groups unable to survive in a pH lower than 6.0 (Ward et al., 1992). Bredenhand and Samways (2009) in South Africa also found an abundance of mayflies and stoneflies upstream of a reservoir where the mean pH values were lower than 6.0, suggesting some species may be adapted to these natural acidic conditions.
The hypolimnetic releases of the dams can have a significant influence on the longitudinal pattern of water temperature in the downstream sites, within a range of distance from 10 to 100 km (Kędra and Wiejaczka, 2018). However, both of our study dams have epilimnetic water releases, which tend to have less of an effect on temperature changes. The length of egg development and consequent hatching species in tropical and subtropical streams can be affected by water temperature at lower than 15°C (Dudgeon, 1999). Thus, the timing of the life-cycle events of the macroinvertebrates is not likely to be affected by the current water temperature recorded in this study.
We only measured physico-chemical water quality at the time and location of the macroinvertebrate sampling. Hence we may have missed a pollution event which happened earlier and affected the fauna. However, the current spot samples of physico-chemical water quality variables did not show significant changes between the two sampling periods in both study rivers except the hight turbidity at site CM-US-1 on Chaungmagyi River (308 NTU to 108 NTU). An interview with local people during field sampling showed that the water quality of both rivers did not apparently change during the year. Generally, our physico-chemical water quality measurements showed the existing conditions of the sampling sites at the time of sampling. As the measurement of physico-chemical is an instantaneous measure, it does not necessarily reflect the values prior to the sampling or the fluctuations of each parameter. Only two samples were taken from each site and consequently it is not possible to show any correlation between aquatic communities and physic-chemical variables.
5.4. Macroinvertebrate Communities
We observed a clear and significant difference in all taxa communities between the upstream and downstream sites on both the Myitnge and Chaungmagyi Rivers (Figures 4, 5). Samples from the downstream sites rarely contained the most sensitive taxa (EPTO) and had fewer sensitive taxa such as Mollusca (Corbicula) and Diptera (Chironominae) from the Myitnge and Chaungmagyi Rivers, respectively (Tables 4, 6) compared to the upstream sites. These results are in line with a study on the effect of hydropower dams on macroinvertebrate communities by Vaikasas et al. (2013).
We also analyzed the communities using only the morphospecies level of EPTO, and the results were just as strong as they were for the comparison of all taxa between upstream and downstream sites. The stress values were lower on both rivers. We found sensitive taxa downstream of both study dams. However, the predators (Plecoptera and Odonata) were rare in all the downstream sampling sites of both rivers (Tables 5, 8), a finding which is not in keeping with the previous study of Mwedzi et al. (2016). Mwedzi et al. (2016) found rare predators <1 km downstream, but the number of predators did not change significantly between upstream and downstream sites further than 1 km downstream of the dam. Predator numbers are generally low as they are at the top of the macroinvertebrate food web (Boulton and Brock, 1999).
The community differences of all taxa and EPTO between the sampling periods were not significant in the Myitnge River, unlike the Chaungmagyi River. There were different dominant families between the two sampling periods in the Chaungmagyi River. Five taxa were represented during November and December 2016, and 13 taxa were represented during February and March 2017, respectively (Table 7). This may be more due to the life cycles of the animals than water quality. The later sampling may have different numbers as a result of the timing of their reproduction and life cycles. This follows the findings of Mesa (2012), who demonstrated a significant difference in communities and abundance between seasons (March and September) because of the life-history adaptations of taxa, such as small adult body size, rapid development time, and nearly-continuous reproduction.
Furthermore, the sampling sites located just upstream and downstream of the dams saw a reduction in species richness (Table 2). This is supported by previous studies in Nepal (Sharma et al., 2005) and China (Xiaocheng et al., 2008), which show that restoring the organic matter in the reservoir and changes in flow speed can have an impact on macroinvertebrate communities just upstream and downstream of the dam.
5.5. Ecological Water Quality Index (MABA Method)
The estimated ecological water quality index, using all the collected taxa, is lowest at the sites just downstream the dam on both rivers (MT-DS-1 & CM-DS-1) in both sampling periods (Figure 6). Then, the water quality index values steadily increased for the sites further downstream of both rivers (MT-DS-2 & CM-DS-2), which suggests that our study rivers have the potential to recover naturally from the dam disturbance.
The biomonitoring method MABA (Ko et al., 2020), which uses family data, can also be used to detect the ecological water quality of Myanmar's rivers and the impact of dams. This preliminary biomonitoring method can also potentially be used by citizens, which can help with community empowerment in the sector of water resources development around the country. However, adequate training in the identification of different groups of taxa and in the field to understand the monitoring method are needed. Furthermore, adequate collaboration space for young researchers is an important issue in building up a participatory monitoring program in Myanmar.
6. Conclusion
Hydropower dams are critical water infrastructure for Myanmar's economy. Negatively, dams alter the natural flow regime downstream of the dam, in terms of magnitude, frequency, and duration. Aquatic macroinvertebrate communities can be used as an indicator to detect humans' influence, such as dams, on river ecosystems. We sampled both upstream and downstream of Yeywa and Sae Daw Gyi dams on the Myitnge and Chaungmagyi Rivers, to see how macroinvertebrate communities changed downstream of the dams. We also studied the natural flow regime before and after the construction of the dams to see how the hydrology changed, which can have an impact on aquatic macroinvertebrate communities downstream. We found that macroinvertebrate communities at morphospecies level of all taxa and sensitive taxa (Ephemeroptera, Plecoptera, Trichoptera, and Odonata) are significantly different between the upstream and downstream of both study dams in term of species richness, abundance, and functional feeding groups. We also tested the preliminary Myanmar Aquatic Biomonitoring Assessment Index to detect the ecological water quality index of both the upstream and downstream sampling sites. We found that the biomonitoring index at the family level also showed the same pattern with the results of species-level identification analyses between upstream and downstream of both study dams. We conclude that the indexing method can be applied to detect human influences on river ecosystems, leaving a potential role for citizen monitoring in Myanmar's rivers. However, further research over a longer duration and a greater number of flowing waters including natural and semi-natural water bodies such as rivers, streams and human-made channels is recommended to relate the preliminary index method to hydrology and water quality in both.
Data Availability Statement
The datasets presented in this study can be found in online repositories. The names of the repository/repositories and accession number(s) can be found in the article/supplementary material.
Author Contributions
All authors designed conceptualization of manuscript. NK and PS performed data analysis and data validation. NK wrote the original draft manuscript. TB, MR, JC, and PS reviewed and edited the manuscript. All authors contributed to the article and approved the submitted version.
Funding
This research was funded by The Netherlands Fellowship Program (NFP) for 4-year Ph.D. study. The APC was funded by Delft University of Technology, The Netherlands.
Conflict of Interest
The authors declare that the research was conducted in the absence of any commercial or financial relationships that could be construed as a potential conflict of interest.
Acknowledgments
The authors would like to acknowledge for 4-year personal Ph.D. grant by Netherlands Fellowship Program, NFP. The authors would like to acknowledge to Ye Yint Aung, Min Min Naing, Kyaw Kyaw, and Kyaw Min Naing for their efforts as volunteers during sampling observations in Myitnge and Chaungmagyi Rivers in Myanmar.
References
Anderson, B. S., Phillips, B. M., Hunt, J. W., Connor, V., Richard, N., and Tjeerdema, R. S. (2006). Identifying primary stressors impacting macroinvertebrates in the Salinas river (California, USA): relative effects of pesticides and suspended particles. Environ. Pollut. 141, 402–408. doi: 10.1016/j.envpol.2005.08.056
Bacey, J., and Spurlock, F. (2007). Biological assessment of urban and agricultural streams in the California central valley. Environ. Monitor. Assess. 130, 483–493. doi: 10.1007/s10661-006-9438-8
Boulton, A. J., and Brock, M. A. (1999). Australian Freshwater Ecology Processes and Management. Glen Osmond, SA: Gleneagles Publishing.
Bredenhand, E., and Samways, M. J. (2009). Impact of a dam on benthic macroinvertebrates in a small river in a biodiversity hotspot: cape floristic region, South Africa. J. Insect Conserv. 13, 297–307. doi: 10.1007/s10841-008-9173-2
Bunn, S. E., and Arthington, A. H. (2002). Basic principles and ecological consequences of altered flow regimes for aquatic biodiversity. Environ. Manage. 30, 492–507. doi: 10.1007/s00267-002-2737-0
Buss, D. F., Carlisle, D. M., Chon, T.-S., Culp, J., Harding, J. S., Keizer-Vlek, H. E., et al. (2015). Stream biomonitoring using macroinvertebrates around the globe: a comparison of large-scale programs. Environ. Monit. Assess. 187:4132. doi: 10.1007/s10661-014-4132-8
Castro, D., Hughes, R., and Callisto, M. (2013). Influence of peak flow changes on the macroinvertebrate drift downstream of a Brazilian hydroelectric dam. Braz. J. Biol. 73, 775–782. doi: 10.1590/S1519-69842013000400013
Chen, Q., Yang, Q., and Lin, Y. (2011). Development and application of a hybrid model to analyze spatial distribution of macroinvertebrates under flow regulation in the Lijiang river. Ecol. Inform. 6, 407–413. doi: 10.1016/j.ecoinf.2011.08.001
Chen, Q., Zhang, X., Chen, Y., Li, Q., Qiu, L., and Liu, M. (2015). Downstream effects of a hydropeaking dam on ecohydrological conditions at subdaily to monthly time scales. Ecol. Eng. 77, 40–50. doi: 10.1016/j.ecoleng.2014.12.017
Chessman, B. C. (1995). Rapid assessment of rivers using macroinvertebrates: a procedure based on habitat-specific sampling, family level identification and a biotic index. Austr. J. Ecol. 20, 122–129. doi: 10.1111/j.1442-9993.1995.tb00526.x
Clarke, K., and Gorley, R. (2006). Primer v6: User Manual/Tutorial, Primer E: Plymouth. Plymouth: Plymouth Marine Laboratory.
Clarke, K. R. (1993). Non-parametric multivariate analyses of changes in community structure. Austr. J. Ecol. 18, 117–143. doi: 10.1111/j.1442-9993.1993.tb00438.x
Cortes, R. M. V., Ferreira, M. T., Oliveira, S. V., and Godinho, F. (1998). Contrasting impact of small dams on the macroinvertebrates of two Iberian mountain rivers. Hydrobiologia 389:51. doi: 10.1023/A:1003599010415
Dickens, C., Cox, A., Johnston, R. M., Davison, S., Henderson, D., Meynell, P., et al. (2018). “Monitoring the health of the greater Mekong's rivers,” in CGIAR Research Program on Water, Land and Ecosystems (WLE) (Vientiane).
Donnelly, C., Nalder, N., Paroschy, N., and Philips, M. (2002). Issues and controversies associated with dam removals. Can. Dam Assoc. Bull. 13, 7–18. doi: 10.13140/2.1.2557.0882
Dudgeon, D. (1999). Tropical Asian Streams: Zoobenthos, Ecology and Conservation, Vol. 1. Hong Kong: Hong Kong University Press.
Dugan, P. J., Barlow, C., Agostinho, A. A., Baran, E., Cada, G. F., Chen, D., et al. (2010). Fish migration, dams, and loss of ecosystem services in the Mekong basin. Ambio 39, 344–348. doi: 10.1007/s13280-010-0036-1
Eriksen, T. E., Nesheim, I., Friberg, N., Aung, T. T., and Myint, Z. W. (2017). Characterization of the Bago Sub-Basin Pilot Implementing the EU Water Framework Directive. NIVA-rapport. Norsk institutt for vannforskning.
Eulderink, J. (2019). Silenced rivers: modelling and assessing the impacts of largescale hydropower projects on the ecohydrology of the Myitnge and Myittha rivers in Myanmar (Master thesis). Delft University of Technology, Delft, Netherlands.
Gore, J. (1994). “Hydrological change,” in The Rivers Handbook: Hydrological and Ecological Principles, Vol. 2, eds P. Calow and G. E. Petts (Oxford: Blackwell Science Ltd.), 33–54. doi: 10.1002/9781444313871.ch3
Graham, P. M., Dickens, C. W., and Taylor, R. J. (2004). Minisass–a novel technique for community participation in river health monitoring and management. Afr. J. Aquat. Sci. 29, 25–35. doi: 10.2989/16085910409503789
Hauer, F. R., and Resh, V. H. (2017). “Macroinvertebrates,” in Methods in Stream Ecology, Vol. 1. (Boston, MA: Elsevier; Academic Press), 297–319. doi: 10.1016/B978-0-12-416558-8.00015-9
Hocutt, C. H. (1975). Assessment of a stressed macroinvertebrate community 1. J. Am. Water Resour. Assoc. 11, 820–835. doi: 10.1111/j.1752-1688.1975.tb00734.x
Hughes, R. (2013). Burma Ruby Pigeon's Blood Mogok Stone Tract. Available online at: http://www.ruby-sapphire.com/pigeons-blood-mogok.htm
Hussain, Q. A., and Pandit, A. K. (2012). Macroinvertebrates in streams: a review of some ecological factors. Int. J. Fish. Aquac. 4, 114–123. doi: 10.5897/IJFA11.045
Ishiyama, N., Ryo, M., Kataoka, T., Nagayama, S., Sueyoshi, M., Terui, A., et al. (2018). Predicting the ecological impacts of large-dam removals on a river network based on habitat-network structure and flow regimes. Conserv. Biol. 32, 1403–1413. doi: 10.1111/cobi.13137
Kędra, M., and Wiejaczka, Ł. (2018). Climatic and dam-induced impacts on river water temperature: assessment and management implications. Sci. Tot. Environ. 626, 1474–1483. doi: 10.1016/j.scitotenv.2017.10.044
Ko, N. T., Suter, P., Conallin, J., Rutten, M., and Bogaard, T. (2020). The urgent need for river health biomonitoring tools for large tropical rivers in developing countries: preliminary development of a river health monitoring tool for Myanmar rivers. Water 12:1408. doi: 10.3390/w12051408
Kuenzer, C., Campbell, I., Roch, M., Leinenkugel, P., Tuan, V. Q., and Dech, S. (2013). Understanding the impact of hydropower developments in the context of upstream-downstream relations in the Mekong river basin. Sustain. Sci. 8, 565–584. doi: 10.1007/s11625-012-0195-z
Lazarus, K. M., Cardinale, P., Corbett, M., Lin, N. S., and Noeske, T. K. H. (2019). Strategic Environmental Assessment of the Hydropower Sector in Myanmar: Baseline Assessment Report : Introduction (English). Available online at: https://www.burmalibrary.org/en/strategic-environmental-assessment-of-the-hydropower-sectorin-myanmar-vol-2-baseline-assessment (accessed October 7, 2020).
Le, C. T., Paul, W. L., Gawne, B., and Suter, P. J. (2020). Quantitative flow-ecology relationships using distributed lag nonlinear models: large floods in the Murray river could have delayed effects on aquatic macroinvertebrates lasting more than three decades. Water Resour. Res. 56:e2019WR025896. doi: 10.1029/2019WR025896
Leslie, A. W., and Lamp, W. O. (2017). Taxonomic and functional group composition of macroinvertebrate assemblages in agricultural drainage ditches. Hydrobiologia 787, 99–110. doi: 10.1007/s10750-016-2947-8
Li, D., Long, D., Zhao, J., Lu, H., and Hong, Y. (2017). Observed changes in flow regimes in the Mekong river basin. J. Hydrol. 551, 217–232. doi: 10.1016/j.jhydrol.2017.05.061
Li, K., Zhu, C., Wu, L., and Huang, L. (2013). Problems caused by the three gorges dam construction in the Yangtze river basin: a review. Environ. Rev. 21, 127–135. doi: 10.1139/er-2012-0051
Masese, F. O., and Raburu, P. (2017). Improving the performance of the ept index to accommodate multiple stressors in Afrotropical streams. Afr. J. Aquat. Sci. 42, 219–233. doi: 10.2989/16085914.2017.1392282
Merritt, R. W., Cummins, K. W., Berg, M. B., Novak, J. A., Higgins, M. J., Wessell, K. J., et al. (2002). Development and application of a macroinvertebrate functional-group approach in the bioassessment of remnant river oxbows in Southwest Florida. J. North Am. Benthol. Soc. 21, 290–310. doi: 10.2307/1468416
Mesa, L. M. (2012). Interannual and seasonal variability of macroinvertebrates in monsoonal climate streams. Braz. Arch. Biol. Technol. 55, 403–410. doi: 10.1590/S1516-89132012000300011
Mustow, S. (2002). Biological monitoring of rivers in Thailand: use and adaptation of the BMWP score. Hydrobiologia 479, 191–229. doi: 10.1023/A:1021055926316
Mwedzi, T., Bere, T., Siziba, N., Mangadze, T., and Bangira, C. (2016). Longitudinal macroinvertebrate assemblages in contrasting discontinuities: the effects of damming in tropical streams. Afr. J. Ecol. 54, 183–194. doi: 10.1111/aje.12281
Narumon, S., and Boonsoong, B. (2004). Identification of Freshwater Invertebrates of the Mekong River and Tributaries. Faculty of Science, Appllied Taxonomic Research Center Khon Kean University, Khon Kean, Thailand.
Paul, W. L., Cook, R. A., Suter, P. J., Clarke, K. R., Shackleton, M. E., McInerney, P. J., et al. (2018). Long-term monitoring of macroinvertebrate communities over 2,300 km of the Murray river reveals ecological signs of salinity mitigation against a backdrop of climate variability. Water Resour. Res. 54, 7004–7028. doi: 10.1029/2018WR022976
Richter, B., Baumgartner, J., Wigington, R., and Braun, D. (1997). How much water does a river need? Freshw. Biol. 37, 231–249. doi: 10.1046/j.1365-2427.1997.00153.x
Richter, B. D., Baumgartner, J. V., Powell, J., and Braun, D. P. (1996). A method for assessing hydrologic alteration within ecosystems. Conserv. Biol. 10, 1163–1174. doi: 10.1046/j.1523-1739.1996.10041163.x
Richter, B. D., and Thomas, G. A. (2007). Restoring environmental flows by modifying dam operations. Ecol. Soc. 12:26. doi: 10.5751/ES-02014-120112
Santucci, V. J. Jr, Gephard, S. R., and Pescitelli, S. M. (2005). Effects of multiple low-head dams on fish, macroinvertebrates, habitat, and water quality in the fox river, Illinois. North Am. J. Fish. Manage. 25, 975–992. doi: 10.1577/M03-216.1
Serrana, J. M., Yaegashi, S., Kondoh, S., Li, B., Robinson, C. T., and Watanabe, K. (2018). Ecological influence of sediment bypass tunnels on macroinvertebrates in dam-fragmented rivers by DNA metabarcoding. Sci. Rep. 8, 1–10. doi: 10.1038/s41598-018-28624-2
Sharma, C. M., Sharma, S., Borgstrom, R., and Bryceson, I. (2005). Impacts of a small dam on macroinvertebrates: a case study in the Tinau river, Nepal. Aquat. Ecosyst. Health Manage. 8, 267–275. doi: 10.1080/14634980500218332
Swanson, S. (2002). Indicators of Hydrologic Alteration. Resource Notes 58. National Science and Technology Center, Bureau of Land Management.
Taft, L., and Evers, M. (2016). A review of current and possible future human-water dynamics in Myanmar's river basins. Hydrol. Earth Syst. Sci. 20:4913. doi: 10.5194/hess-20-4913-2016
Thoms, M., Suter, P., Roberts, J., Koehn, J., Jones, G., Hillman, T., and Close, A. (2000). Report of the River Murray Scientific Panel on Environmental Flows. River Murray-Dartmouth to Wellington and the Lower Darling River. Canberra, ACT: Murray Darling Basin Commission.
Vaikasas, S., Palaima, K., and Pliūraitė, V. (2013). Influence of hydropower dams on the state of macroinvertebrates assemblages in the Virvyte river, lithuania. J. Environ. Eng. Landsc. Manage. 21, 305–315. doi: 10.3846/16486897.2013.796956
Visser, A., Beevers, L., and Patidar, S. (2017). Macro-invertebrate community response to multi-annual hydrological indicators. River Res. Appl. 33, 707–717. doi: 10.1002/rra.3125
Wallace, J. B., and Webster, J. R. (1996). The role of macroinvertebrates in stream ecosystem function. Annu. Rev. Entomol. 41, 115–139. doi: 10.1146/annurev.en.41.010196.000555
Ward, J. V. (1992). Aquatic Insect Ecology, Part 1: Ecology and Habitat. Hoboken, NJ: John Wiley & Sons, Inc.
White, J. C., Hannah, D. M., House, A., Beatson, S. J., Martin, A., and Wood, P. J. (2017). Macroinvertebrate responses to flow and stream temperature variability across regulated and non-regulated rivers. Ecohydrology 10:e1773. doi: 10.1002/eco.1773
Keywords: hydropower generating dams, macroinvertebrate community, Myanmar, flow regime, preliminary Myanmar aquatic biomonitoring assessment index
Citation: Ko NT, Suter P, Conallin J, Rutten M and Bogaard T (2020) Aquatic Macroinvertebrate Community Changes Downstream of the Hydropower Generating Dams in Myanmar-Potential Negative Impacts From Increased Power Generation. Front. Water 2:573543. doi: 10.3389/frwa.2020.573543
Received: 17 June 2020; Accepted: 02 November 2020;
Published: 24 November 2020.
Edited by:
Praveen Kumar, University of Illinois at Urbana-Champaign, United StatesReviewed by:
Seifu Admassu Tilahun, Bahir Dar University, EthiopiaEddy F. Pazmino, Escuela Politécnica Nacional, Ecuador
Copyright © 2020 Ko, Suter, Conallin, Rutten and Bogaard. This is an open-access article distributed under the terms of the Creative Commons Attribution License (CC BY). The use, distribution or reproduction in other forums is permitted, provided the original author(s) and the copyright owner(s) are credited and that the original publication in this journal is cited, in accordance with accepted academic practice. No use, distribution or reproduction is permitted which does not comply with these terms.
*Correspondence: Nyein Thandar Ko, bi50LmtvQHR1ZGVsZnQubmw=; bnllaW4wMDAxQGdtYWlsLmNvbQ==