
95% of researchers rate our articles as excellent or good
Learn more about the work of our research integrity team to safeguard the quality of each article we publish.
Find out more
ORIGINAL RESEARCH article
Front. Water , 26 November 2020
Sec. Water and Critical Zone
Volume 2 - 2020 | https://doi.org/10.3389/frwa.2020.564211
This article is part of the Research Topic Linking Hydrological and Biogeochemical Processes in Riparian Corridors View all 20 articles
 Yilin Fang*
 Xuehang Song
 Huiying Ren
 William A. Perkins
 Pin Shuai
 Marshall C. Richmond
 Zhangshuan Hou
 Jie Bao
 Xingyuan Chen
 Timothy D. Scheibe
Hydrologic exchange flows (HEFs) have environmental significance in riverine ecosystems. Key river channel factors that influence the spatial and temporal variations of HEFs include river stage, riverbed morphology, and riverbed hydraulic conductivity. However, their impacts on HEFs were often evaluated independently or on small scales. In this study, we numerically evaluated the combined interactions of these factors on HEFs using a high-performance simulator, PFLOTRAN, for subsurface flow and transport. The model covers 51 square kilometers of a selected river corridor with large sinuosity along the Hanford Reach of the Columbia River in Washington, US. Three years of spatially distributed hourly river stages were applied to the riverbed. Compared to the simulation when riverbed heterogeneity is not ignored, the simulation using homogeneous riverbed conductivity underestimated HEFs, especially upwelling from lateral features, and overestimated the mean residence times derived from particle tracking. To derive a surrogate model for the river corridor, we amended the widely used transient storage model (TSM) for riverine solute study at reach scale with reactions. By treating the whole river corridor as a batch reactor, the temporal changes in the exchange rate coefficient for the TSM were derived from the dynamic residence time estimated from the hourly PFLOTRAN results. The TSM results were evaluated against the effective concentrations in the hyporheic zone calculated from the PFLOTRAN simulations. Our results show that there is potential to parameterize surrogate models such as TSM amended with biogeochemical reactions while incorporating small-scale process understandings and the signature of time-varying streamflow to advance the mechanistic understanding of river corridor processes at reach to watershed scales. However, the assumption of a well-mixed storage zone for TSM should be revisited when redox-sensitive reactions in the storage zones play important roles in river corridor functioning.
The concept of river corridors that integrate in-stream transport with lateral and vertical exchange across interfaces (Harvey and Gooseff, 2015) has been increasingly recognized due to their valuable ecological functions. The surrounding sediments along the river corridor, or the hyporheic zones (HZ), directly relate with the stream surface water in terms of activity and hydrologic connectivity across microscale, stream-reach scale, and catchment scale (Boulton et al., 1998). Bidirectional mixing, or hydrologic exchange flow, at the interface of stream and HZs is important in influencing stream water quality, water temperature, fish conservation, microbial communities, dissolved organic matter processing, and groundwater contamination (Boulton et al., 1998; Edwardson et al., 2003; DiStefano et al., 2009; Febria et al., 2010; Wexler et al., 2011; Dickson et al., 2012; Kawanishi et al., 2017; Haddou et al., 2018; Harjung et al., 2018; Lewandowski et al., 2019).
River corridors are heterogeneous in space, non-stationary, and involve multiscale feedbacks (Ward and Packman, 2019). Previous studies suggested that research on river corridor processes has suffered from the lack of the long-term (weeks to years) investigations on the dynamic driving forces (e.g., streamflow, evapotranspiration) of hyporheic processes across different scales (Boano et al., 2007; Helton et al., 2012; Larsen et al., 2014; Anibas et al., 2018; Galloway et al., 2019; Zheng et al., 2019). A recent kilometer scale simulation of a major gravel bed river corridor along the Columbia River by Zachara et al. (2020) suggested that hyporheic zones must be frequently monitored under different flow conditions for water quality concerns because of the complicated multidirectional flow behaviors. Studies accounting for the dynamic hydrologic processes on hyporheic exchange and biogeochemical reactions have started to emerge in recent years (Larsen et al., 2014; Rahimi et al., 2015; Gomez-Velez et al., 2017; Dwivedi et al., 2018; Liu and Chui, 2018; Singh et al., 2019; Zheng et al., 2019; Kruegler et al., 2020). However, these studies mainly focused on the spatial and temporal patterns of HEFs and biogeochemistry for synthetic individual bedform or two-dimensional cross-sections of single geomorphic features along the river corridor. Scaling these observed complex patterns from small scale localized sampling to reach scale and basin scale investigation is challenging as they are influenced by geomorphic and hydrologic dynamics (Helton et al., 2012), channel morphology, bed roughness, and permeability (Triska et al., 1989; Hassan et al., 2015), hydrologic connectivity (Datry et al., 2008), and vegetation feedbacks (Magliozzi et al., 2019).
On the other hand, reach scale river corridor exchanges are often quantified using the transient storage models (TSM) (e.g., Bencala, 1983; Harvey et al., 1996; Runkel et al., 1998; Briggs et al., 2009). Despite its simplicity, TSM has been extensively used to study riverine solute transport since its first introduction fifty years ago. TSM is a simple expansion of the one-dimensional in-stream transport equation to include bilateral exchange processes between the main-channel and the well-mixed transient storage zones (Bencala, 1983). This model assumes that the amounts of water transferred between the stream and subsurface are insignificant at the reach scale and the water transfer only influences solute transport (Bencala et al., 2011). The exchange process is often represented by a single-rate mass transfer. In the past, the hyporheic exchange rates were obtained from the calibration of field tracer experiments as they are impractical to measure directly over large areas (Boano et al., 2014). Reach scale tracer investigations can also be effective in providing bulk reactivity for a particular biogeochemical constituent of interest (Harvey and Fuller, 1998; Jonsson et al., 2004; Harvey et al., 2013; Lemke et al., 2013), but they rely on data fitting from the observations and mechanistic process understanding cannot be gained (Boano et al., 2014). There were a few examples of TSM applications to reactive tracers (Bencala, 1983; Harvey and Fuller, 1998; Gooseff et al., 2005; Knapp and Cirpka, 2017; Kelleher et al., 2019), but they only focused on a single reactive component.
A recent review article by Ward and Packman (2019) calls for a framework and theoretical models of river corridor exchange to accurately predict the hydrologic exchange in the river corridor at the scales of stream reaches and entire networks. Lewandowski et al. (2019) also highlighted the research focus on HEF processes that link hydrological, biogeochemical and ecological processes. In this research, we investigate how mechanistic understanding from high resolution three-dimensional (3D) simulations of flow and reactive transport induced by multiple years of transient stream discharge in a large gravel bed river corridor can be used to inform the development of reach scale reduced order models, such as the transient storage models. We use synthetic data generated by high-resolution 3D physically-based simulations to derive and test a surrogate TSM model and identify future development needs. Given the physical basis of the high-resolution model it is reasonable to assume that it is a plausible representation of a realistic system, although we recognize that it is not a precise representation of any particular real system. While TSM models can be parameterized and tested using field tracer tests, the size and flow rate of the Columbia River renders such tests impractical in this case. Therefore, testing the performance of a simpler empirical model (the TSM) against the high-resolution model outputs is one reasonable way to assess potential strengths and weaknesses of the TSM for this large system. The results of the 3D simulations were used to parameterize the exchange coefficients of the TSM and were compared with the TSM simulation results, for both conservative and reactive transport, to identify TSM model weaknesses and future model development needs. We hypothesize that transient streamflow and riverbed heterogeneity have significant effects on the zonation of HZs, residence time of HEFs within HZs, and biogeochemical reaction rate constants at the reach scale.
The study river corridor is located at the 100-H area along the Hanford Reach (an eight-order stream) of the Columbia River in the southeastern Washington State (Figure 1A). The Hanford Reach provides a refuge for native fish, riverine wildlife and plants (Rickard and Gray, 1995). The bottom substrate of the river consists mainly of cobbles and boulders, and the flow rate in the Hanford Reach is regulated by upstream dams in response to hydroelectric power demand (Dauble et al., 1989), ranging between 1,900 and 5,600 m3/s depending on season (Zachara et al., 2020). The water level fluctuates up to 2 m daily due to discharge variation from the Priest Rapids Dam (Arntzen et al., 2006).
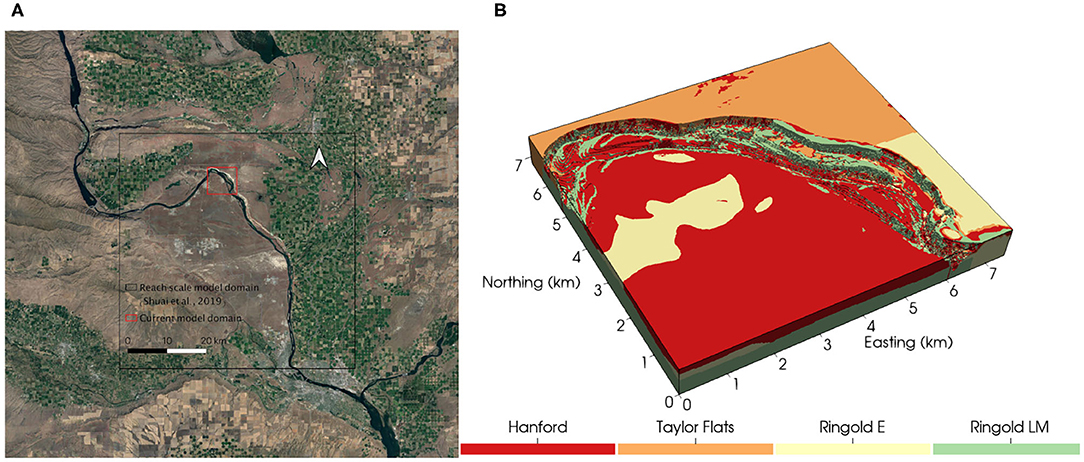
Figure 1. (A) The Hanford reach and the study domain (bounded in red). The reach scale model in Shuai et al. (2019) is bounded in black. (B) Geologic units at the study domain.
At our selected location, the river meanders north and then southeast (Figure 1). The unconfined aquifer of the river corridor consists primarily of the Hanford Formation composed of Pleistocene-age flood deposits and the underlying late-Miocene to late-Pliocene Ringold Formation formed from river and lake sediments (Thorne et al., 2006; Shuai et al., 2019). The Ringold Formation in the 100-H area is broadly divided into Ringold E unit, Ringold Taylor Flats unit, and Ringold Lower Mud unit. The geologic unit of the simulated domain is shown in Figure 1B and their hydrologic properties are summarized in Table 1. The study domain occupies an area of 50.864 km2. The domain is discretized into 748 × 680 × 30 (15,096,000) elements of 10 m resolution in the horizontal direction and 1 m in the vertical direction. The bottom elevation is 90 m above sea level. The riverbed is delineated using a combination of LiDAR and other measured bathymetric elevation (Coleman et al., 2010).
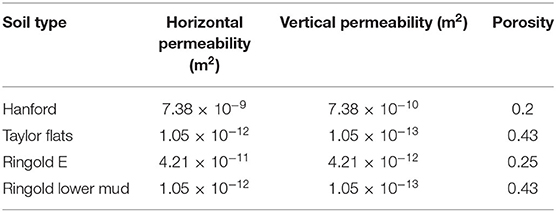
Table 1. Hydrogeologic properties of geologic units.
To investigate the hydrologic exchange fluxes at the riverbed driven by multi-year stream discharge, we used the state-of-the-art massively parallel subsurface flow and reactive transport code, PFLOTRAN. PFLOTRAN is an open source code, which solves a system of non-linear partial differential equations to describe multiphase, multicomponent and multiscale reactive flow and transport in porous materials (Hammond et al., 2014). For this study, the Richards Equation was solved for the variably saturated flow with the van Genuchten (Van Genuchten, 1980) and Burdine (Burdine, 1953) constitutive relations for saturation and relative permeability, respectively. The simulation period is from 2013 to 2015, which covers two normal flow years and a low flow year in 2015.
The initial pressure of the modeled domain was interpolated from the 2012 results of a coarser reach scale simulation in Shuai et al. (2019). The bottom boundary of the domain was prescribed as no flow condition as it was constrained by the low permeable Ringold units. The top boundary was also set as no-flow as the surface recharge is negligible in the semiarid climate zone (Rockhold et al., 1995). The inland boundaries of the domain were prescribed as hydrostatic conditions, using transient pressures interpolated from the reach scale simulation in Shuai et al. (2019). To represent a low permeable thin alluvium layer at the sediment-water interface, a heterogeneous-conductance type boundary condition was imposed on each grid cell of the riverbed. The conductance type condition is similar to a seepage face, which dampens the effect of river stage fluctuations (Hammond and Lichtner, 2010). The flow rate for this type of boundary is proportional to the head difference, with conductance as the constant of proportionality. Hourly river stages simulated using the Modular Aquatic Simulation System in two dimensions (MASS2) simulator (Perkins and Richmond, 2004), as described by Niehus et al. (2014), were assigned to each river boundary cell.
To evaluate the effect of dynamic HEFs on reaction rates at the reach scale, we added a conservative tracer and the following two-step denitrification reactions and an oxidative respiration reaction based on previous studies by Song et al. (2018) at a nearby area in the reactive transport simulation:
Cell decay or lysis of biomass (Newcomer et al., 2018) and turnover back to CH2O was also considered in the model. Reaction rate formulations follow a modified dual-Monod type. The maximum uptake rate of O2, NO3−, and NO2− are 84.78, 28.26, and 23.28 d−1, respectively. The initial and boundary conditions are shown in Table 2. NH4+ was assumed to be unlimited. A conservative tracer with a concentration of 10−3 mol/L was assigned at the river boundary to indicate the concentration of river water. The four lateral boundaries were treated as tracer free.
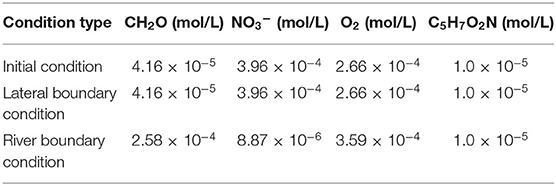
Table 2. Reactive transport conditions.
We ran simulations for five case scenarios:
• Case 1. Flow and solute transport for year 2013–2015 with homogenous riverbed conductance of 10−12 m;
• Case 2. Flow and solute transport for year 2013–2015 with heterogeneous riverbed conductance;
• Case 3. Flow and solute transport for year 2014 using the end of the simulation in year 2013 of Case 1 as the initial condition for flow, and setting initial conservative tracer to 0.0 mol/L;
• Case 4. Flow and solute transport for year 2014 using the end of the simulation in year 2013 of Case 2 as the initial condition for flow, and setting initial conservative tracer to 0.0 mol/L;
• Case 5. Flow and reactive transport for year 2014 using the end of the simulation in year 2013 of Case 1 as the initial condition for flow, and setting initial and boundary conditions of chemical components to those in Table 2.
Cases 1 and 2 were used to examine the effect of dynamic discharge and riverbed heterogeneity on HEFs. It is challenging to quantify the spatial distribution of conductance over the reach scale. A recent effort by Hou et al. (2019) provided a map of the riverbed sediments along the Hanford Reach based on the integration of diverse observations with numerical simulations of river hydrodynamics using facies classifications. This map enabled us to assign unique conductance for each of the four facies identified in the study area (Figure 2) to evaluate how significant the HEFs can be affected by riverbed heterogeneity. The conductance is 1.07 × 10⁻¹³, 9.11 × 10⁻¹³, 3.97 × 10⁻¹², and 8.01 × 10⁻¹² m, for facies 1, 2, 3, and 4, respectively. Facies 1 to 4 correspond to increasing mean shear stresses from river hydrodynamics simulation (Hou et al., 2019). The homogeneous conductance is the geometric mean of these heterogeneous values.
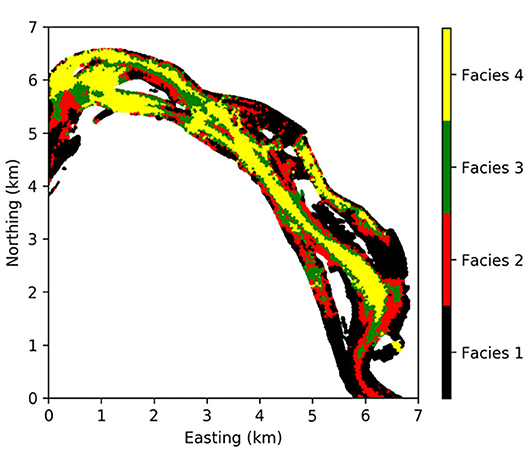
Figure 2. Map of riverbed facies.
Cases 1 and 2 were used to define the hyporheic zones in the river corridor. Results from Cases 3, 4, and 5 were used for reduced order model development for reach-scale simulation. We generated synthetic reach-scale datasets of concentrations in the hyporheic zones for tracer and reactive components from cases 3 to 5 treating the whole simulation domain as a single river corridor of a reach. All simulations were run on the EMSL (the William R. Wiley Environmental Molecular Sciences Laboratory) cascade high performance computing cluster using 1,596 process cores. Hourly outputs of around 9.6 terabytes for each year were recorded for analysis and post-processing.
The transient storage model (TSM) (Bencala, 1983), a simplified reduced order model, has been extensively used to quantify hyporheic exchange flows based on tracer injection experiments (Bencala et al., 2011). The partial differential formulation of the model is shown in the following equations (Harvey et al., 1996; Boano et al., 2014; Larsen et al., 2014):
where C [M L−3] and Cs [M L−3] are the solute concentrations in the main channel and in the hyporheic (storage) zone, respectively, Q [L3 T−1] is the volumetric streamflow rate, A [L2] and As [L2] are the cross-sectional areas of the main channel and the hyporheic zone, respectively, D [L2 T−1] is the longitudinal dispersion coefficient in the river, and α [T−1] is the storage zone exchange coefficient, τs [T] is the residence time of the storage zone, (α A/As) is the inverse of the residence time in the storage zone (Harvey et al., 1996; Larsen et al., 2014).
The storage zone size and the residence time are the two key parameters required to run the TSM model. In order to use the conservative tracer simulation to provide meaningful parameter estimates for the reduced order model, massively parallel forward particle tracking algorithm was used to find the residence time distribution and flow paths of the hydrologic exchange flows. Particles were released from 100,000 randomly sampled locations on the river boundary at 1,000 time points randomly selected between October 2013 and September 2014.
We assumed a single transient storage zone or hyporheic zone (HZ) for the whole river corridor. After 1-year spinup, the volume of the storage zone was defined as the region with 95% of the stream water, or tracer concentration of 0.0095 mol/L, following the geochemical definition in the literature (Triska et al., 1989; Singh et al., 2019) using the results of Cases 1 and 2 in 2014. The total mass of solutes of Case 3 and Case 4 within the whole transient storage zone volume defined in Case 1 and Case 2 were calculated, respectively. The total mass in each case was then used to calculate the hourly whole reach HZ concentration (mass divided by HZ volume) response. The same procedure was performed for the reactive components, i.e., CH2O, NO3−, and O2 in Case 5.
We amended the TSM model with reactions and the following equation was used to calculate the hyporheic zone reactive component concentrations at the reach scale by treating it as a batch reactor. Concentrations of reactive species are fixed in the river (i.e., Equation 4 is not solved) as shown in Table 2.
where Ri is the reaction rate of reactions shown in Equations (1–3), and μi is the stoichiometric coefficient of a species in reaction i, which is negative for reactants and positive for products. For example, the above equation for C5H7O2N and NO2− can be written as Equation (7) and Equation (8), respectively.
Species concentrations predicted by the reaction amended TSM represented by Equation (6) for CH2O, NO3−, and O2, will be compared with the average concentrations within the HZ calculated from the PFLOTRAN simulation. Equation 6 is solved using the PFLOTRAN batch reaction module.
Global sensitivity test using the Fourier Amplitude Sensitivity Test (FAST) method will be performed for the TSM as we expect there will be disagreement between the two models for reactive species.
We summed up the lateral and vertical hydrologic exchange flow rates for Case 1 and Case 2 after 1-year spinup. The maximum lateral flow is about a tenth of the vertical flow (Figures 3A,B). From the hourly PFLOTRAN output during the 2-year simulation, we found that the river gains water from the lateral flow 83.8% of the time for Case 1 and 85.5% of the time for Case 2. The river gains water from the vertical flow 54.7% of the time for Case 1 and 49.8% of the time for Case 2. While the percentages of times for upwelling (denoted as positive value) and downwelling do not make a big difference for the two cases, lateral flows contributed more to the river water for Case 2 with a mean of 0.46 m3/s due to the heterogenous conductance compared to Case 1 with a mean of 0.21 m3/s (Figure 3A). On the other hand, vertical flow for Case 1 contributed more to the river, with a mean flow rate to the river of 0.47 m3/s compared to 0.1 m3/s for Case 2. Vertical downwelling flow rates were stronger than upwelling for both Case 1 and Case 2 (Figure 3B). There was a seasonal decrease of lateral flow to the river (Figure 3C). Vertical upwelling was strong in the fall, and downwelling is dominant in the wet season (Figure 3D). Compared to the Columbia River discharge (1,900–5,600 m3/s), the hydrologic exchange flow has little effect on river hydrodynamics and transport.
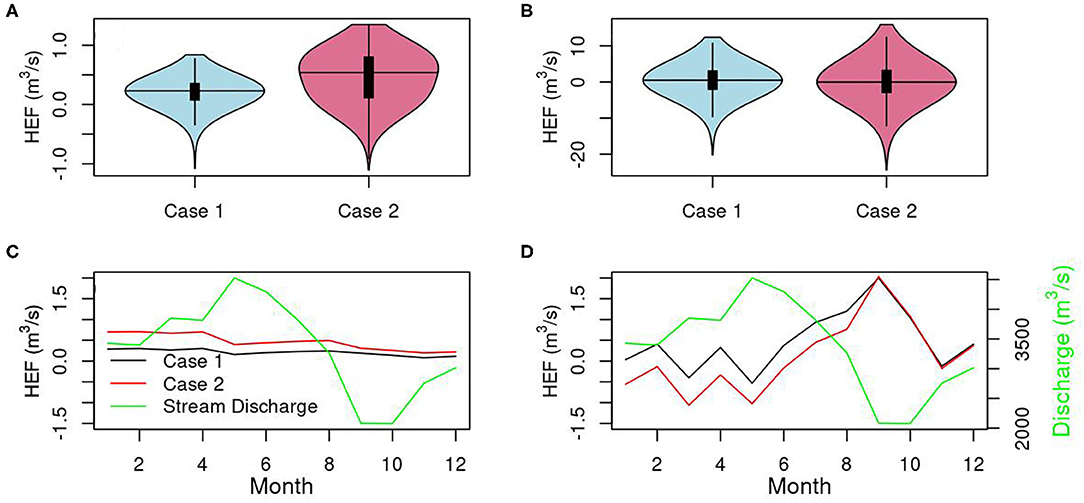
Figure 3. Violin plots of temporal hydrologic exchange flow rate from PFLOTRAN in the lateral (A) and vertical (B) direction and seasonal hydrologic exchange flow rate and stream discharge in the lateral (C) and vertical (D) direction. The river gains water for the positive flow.
The volume of the hyporheic zone (HZ) for Case 1 and Case 2 was calculated by summing up the pore volumes of those grid cells with tracer concentration equals to or > 0.0095 mol/L (i.e., ≥ 95% river water). Hourly HZ volumes varied between 5.7 × 10⁶ and 1.23 × 10⁷ m3 for Case 1, and between 6.11 × 10⁶ and 1.27 × 10⁷ m3 for Case 2. The distributions of the HZ volume displayed pronounced multimodal character as shown in the bean plot created using the R package “beanplot” (Figure 4A). The difference of mean HZ volume between the two cases was small. The seasonal expansion and contraction of HZ follow the dynamics of stream discharge (Figure 4B). HZ volume for Case 2 was larger than Case 1 when streamflow increased, and smaller when streamflow decreased due to the high riverbed conductance of Facies 4. There was a temporal lag of the peak HZ volume compared to the stream discharge due to the variation in residence time of the hydrologic exchange fluxes.
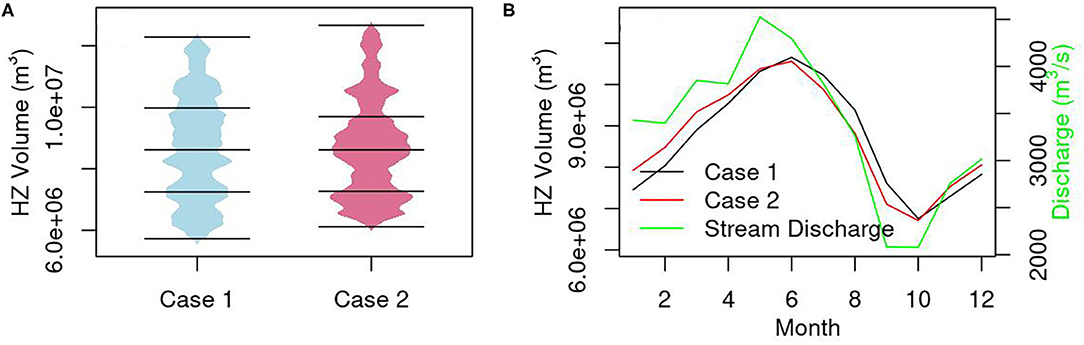
Figure 4. Temporal distribution of HZ volume estimated from the PFLOTRAN simulations (A) and seasonal change of HZ volume and stream discharge (B). The solid lines in (A) show the quantiles of the HZ volume.
A mean residence time of all released particles at a selected time was calculated by weighting the residence time of each particle with its releasing flux. A total of 1,000 reach-scale mean residence times were calculated with the 100 million particles. Compared to Case 1, the longest residence time in Case 2 was shorter than the long-term average of Case 1 (Figure 5). Heterogeneous conductance decreased the long-term mean residence time by half, with a mean of 1,639.35 h for Case 1, and 782.89 h for Case 2. Case 1 residence time had a larger variability than Case 2, ranging from 259 to 2,570 h, compared to 291 to 1,520 h for Case 2. In general, the residence time is positively related to stream discharge (Figure 5B).
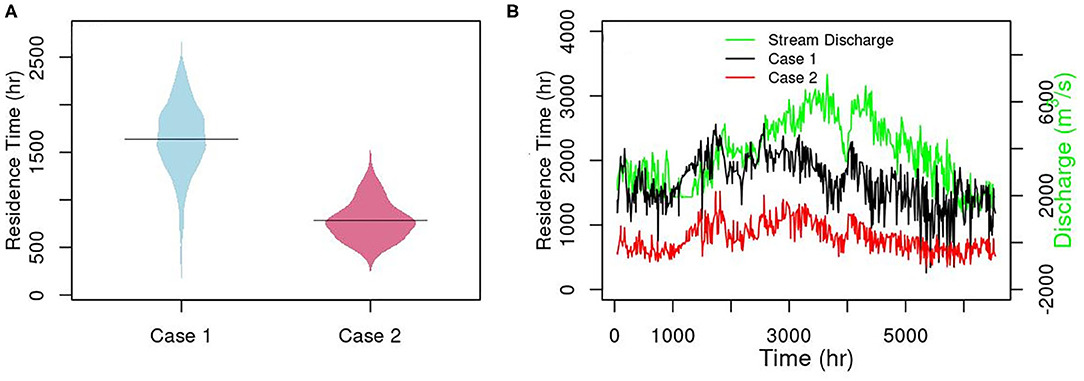
Figure 5. Temporal distribution (A), time series (B) of residence time estimated using particle tracking for Case 1 and Case 2.
Summing up the volume of the grid cells identified as hyporheic zone in year 2014 for Case 1 and Case 2 at every time step, we obtained a reach-scale hyporheic zone volume for each Case. The mass of conservative tracer simulated in year 2014 from Case 3 and Case 4 in those hyporheic zone grid cells identified in Case 1 were then summed up. Dividing the total mass of conservative tracer by the reach-scale hyporheic zone volume, we obtained a synthetic hourly response of the conservative tracer concentration in the hyporheic zone driven by the dynamic stream discharge. The exchange rate coefficient in Equation (6) is now time-varying. At every time step, the residence time was interpolated from those estimated using particles released during 2014 for both Cases 1 and 2. Our simulation showed that the transient storage model (TSM) without reactions could explain the synthetic tracer data with an R-squared of 0.97 for Case 1 and 0.95 for Case 2 (Figure 6). However, TSM underpredicted the concentration for Case 1, and overpredicted for Case 2 compared to the synthetic PFLOTRAN results.
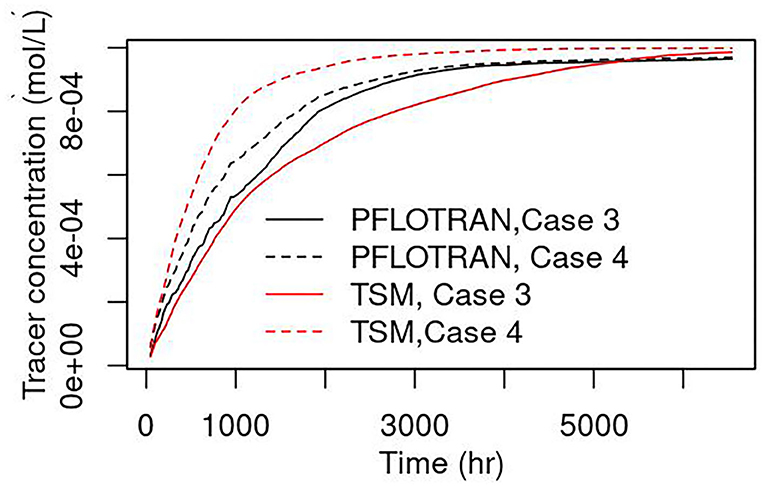
Figure 6. Temporal tracer concentration curves simulated using PFLOTRAN and TSM.
As shown in Figure 5, the minimum reach-scale residence time was > 200 h. Because the time scales of the reactions shown in section Reactive transport were < 1 h, the reaction Damköhler number, Da was >> 1. This means hyporheic exchange flow paths spent too much time in storage, and they were transport limited (Harvey et al., 2019). Case 5 was run for year 2014 using the end of 2013 simulation of Case 1 as the initial condition for flow and chemical initial and boundary conditions as shown in Table 2. We summed up the mass of CH2O, NO3, and O2 for the hyporheic grid cells identified in Case 1 for 2014, and then normalized to the hyporheic volume calculated for Case 1 at each time step of year 2014 to create a temporal synthetic reach-scale chemical concentration data set. Running the reaction amended TSM using the same exchange rate coefficients as for the tracer validation in Case 3 and the same reaction kinetics in Case 5, the concentration profiles for CH2O, NO3, and O2 are shown in Figure 7.
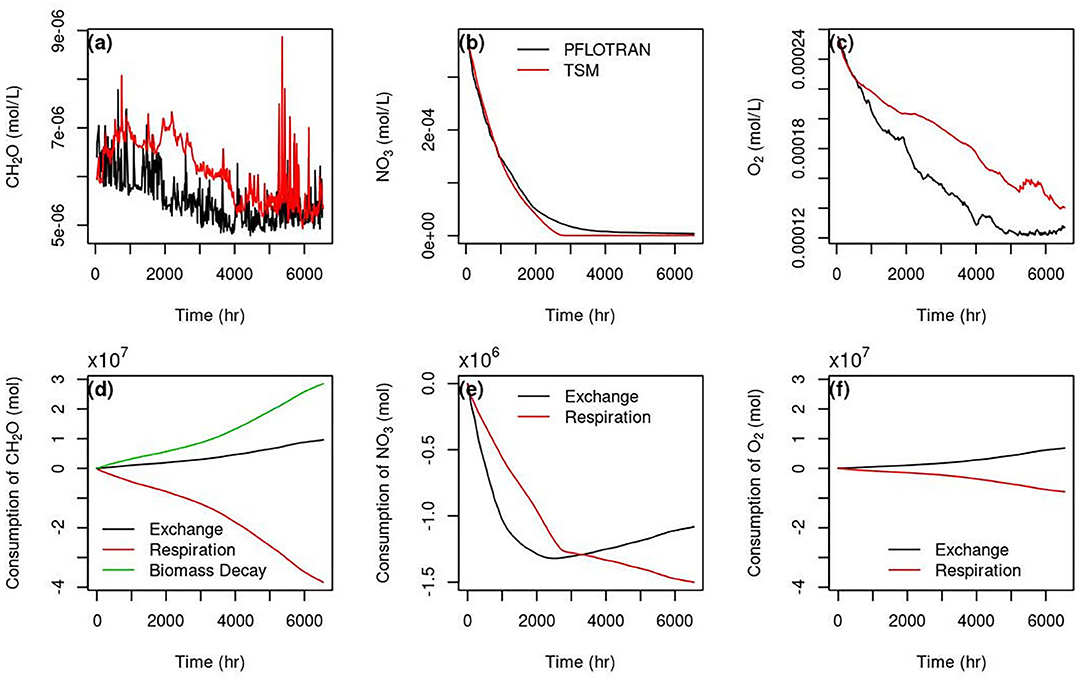
Figure 7. Temporal concentration curves of CH2O (a), NO3 (b), and O2 (c) simulated using PFLOTRAN and TSM, and the total consumption (negative) of CH2O (d), NO3 (e), and O2 (f) by different processes simulated using TSM.
R-squared for CH2O, NO3, and O2 are 0.19, 0.99, and 0.13, respectively. The TSM model has a very good performance for NO3 except for at low concentrations after 2,000 h (Figure 7b), but biased high for CH2O (Figure 7a) and O2 (Figure 7c) compared to the synthetic data. However, the high variability of CH2O exhibited in the synthetic data was simulated using TSM. The high variability was mainly caused by the balance between the production by biomass decay and exchange, and the consumption by the respiration reactions (Figure 7d). The concentration change with time for NO3 and O2 are relatively smooth. The hyporheic exchange contributed to the HZ concentrations of CH2O (Figure 7d), and O2 (Figure 7f) during the simulation, but was a sink for HZ NO3 till 2,000 h (Figure 7e). NO3 consumption was dominated by hyporheic exchange up to 2,000 h. The TSM model performance for NO3 at low concentrations started to deteriorate when production due to exchange balances the reaction consumption.
Apart from the residence times, there are 8 reaction kinetic parameters involved in the TSM with reactions. To evaluate whether there exists a single set of rate parameters that can explain the results obtained from the PFLOTRAN simulations using the TSM, we ran simulations using a range of rate parameters previously reported in the literature. Parameter importance was evaluated to identify which rate parameters we should pay our attention to for TSM parameterization. Rate parameters were sampled from 6.24 to 240 (1/d) for the maximum microbial reaction rate of nitrate (kNO3), 0.001–0.05 (mmol/L) for the Monod half-saturation constant of nitrate (Ka, NO3), 0.0833–0.2583 (mmol/L) for the half-saturation constant of CH2O (Kd, CH2O), 4.8–139.2 (1/d) for the maximum microbial reaction rate of aerobic respiration (kO2), 0.001–0.0969 (mmol/L) for the half-saturation constant of O2 (Ka, O2) based on parameter bounds in Zarnetske et al. (2011) surveyed from the literature. The lower bound for the maximum microbial reaction rate of nitrite was set to one-tenth of that in Killingstad et al. (2002), and the rest of rate constant bounds for nitrite were the same as nitrate reduction reaction. We also assumed 0.242–3.1536 (1/d) for the biomass decay rate. One thousand six hundred samples were generated using the Fourier Amplitude Sensitivity Test (FAST) method implemented in the Python sensitivity analysis library (SALib) (Herman and Usher, 2017). Parameter sensitivity were analyzed based on the average of the temporal concentrations of CH2O, NO3, and O2 and the sensitivity indices are shown in Figure 8. Reaction rate constants kNO3 and kO2 are the most important for concentrations of NO3 and O2, respectively. The biomass decay rate constant is important for all three reactive components. The maximum rate constant for O2 reduction (kO2) are of equal importance for O2 and CH2O.
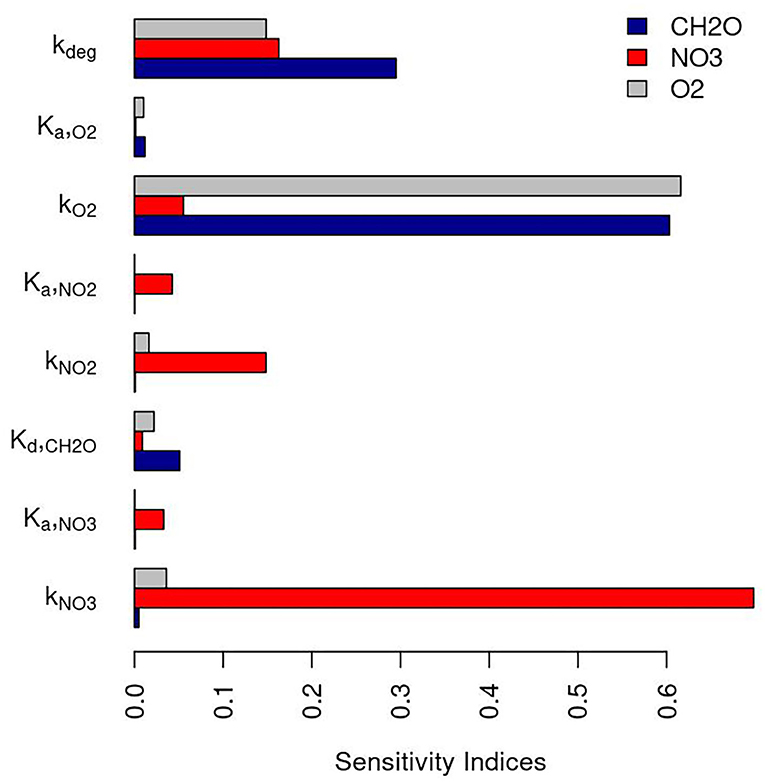
Figure 8. Sensitivity indices of model parameters for TSM simulations.
The TSM results from the bulk of the simulations did not fit the PLOTRAN results well (Figure 9). To check if there is a common set of effective rate parameters for all three reactants, we narrowed down to 5% of the model runs that can explain the observed synthetic concentrations for each reactive component. Plotting the parameters, we were not able to find a common set of important parameters for all of them (Figure 10). The parameters also varied with time. For instance, to explain the CH2O concentration, kNO3 is > 100 (1/d) during the earlier time and smaller than 50 (1/d) between 1,000 and 2,000 h (Figure 10A). We only showed the parameter space for kNO3 as an example. It is challenging to find a constant value for the other parameters too.
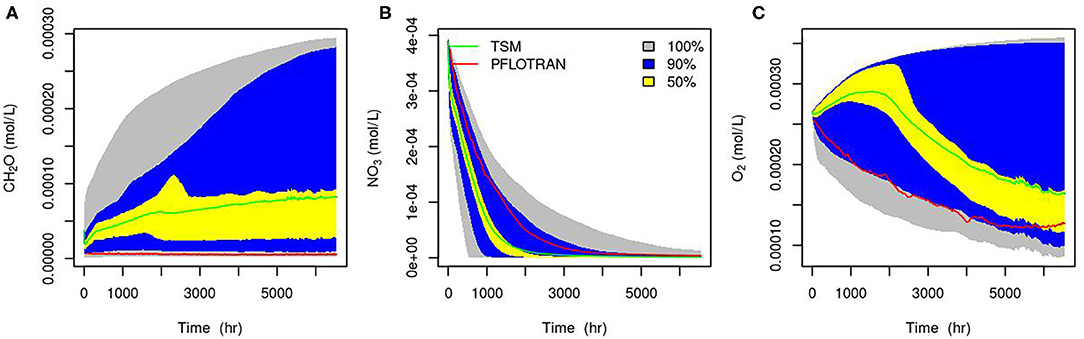
Figure 9. 50, 90, 100% percentiles of 1,600 TSM simulations for the concentrations of CH2O (A), NO3− (B), and O2 (C), red line is from PFLOTRAN, and green line is the mean of the TSM models at each hour.
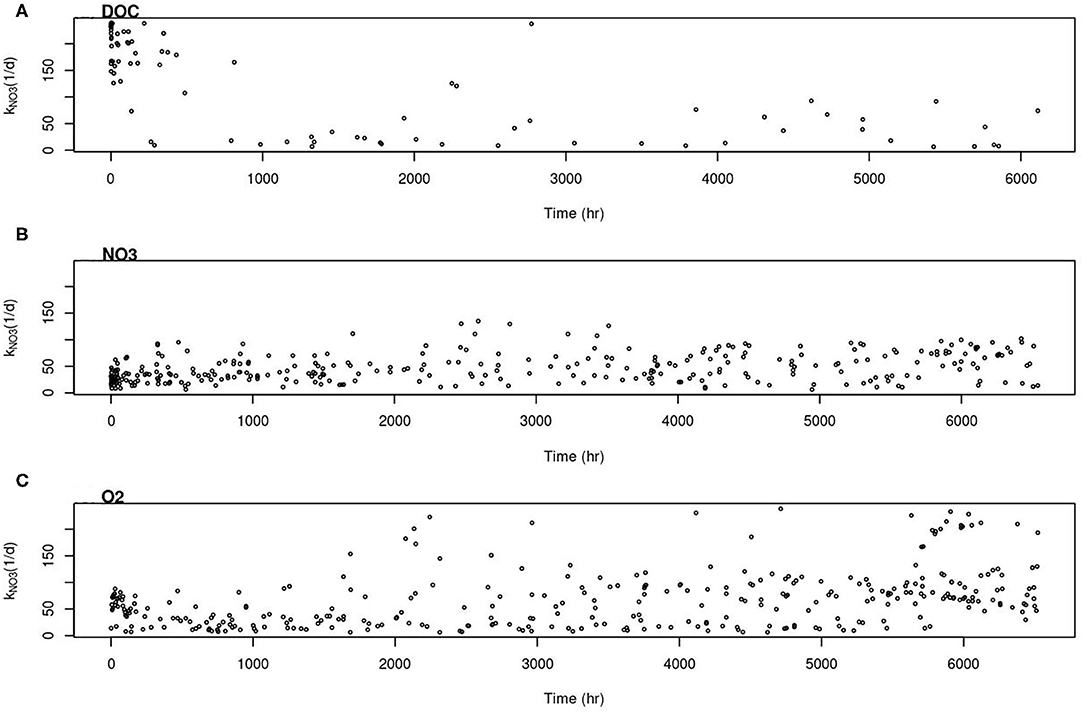
Figure 10. Parameter range of rate constant for nitrate reduction reaction in TSM that can best fit (A) CH2O, (B) NO3−1, and (C) O2.
There have been an increasing number of numerical studies emphasizing the impact of spatially and temporally variable conditions on the hyporheic exchange within river corridors. However, none were carried out at the reach-scale accounting for both the long-term dynamics in driving force and the small-scale hydromorphic heterogeneity. This study investigated the response of river corridor hydrologic exchange as a result of time varying streamflow and riverbed heterogeneity for a reach in an eighth-order stream. Riverbed conductance heterogeneity increased the mean lateral hydrologic exchange flow into the river by a factor of 2.2 and decreased the vertical exchange flow into the river by a factor of 4.7. On the other hand, dynamic streamflow changed the dominant downwelling in the wet season to upwelling dominant in the dry season for the vertical flow (Figure 3D). As the upwelling becomes stronger in the dry season (Figure 3D), the hyporheic volume is significantly reduced (Figure 4B), which echoes the findings in Boano et al. (2008) that the upwelling of subsurface water can significantly reduce the volume of hyporheic sediments that receive water from the stream. HEF variability caused by streamflow is larger than that by riverbed conductance for this case study.
Hyporheic volume defined using the geochemical definition showed that the largest expansion at the peak streamflow can be twice as big as that during the low streamflow. The discrepancy in hyporheic volume due to riverbed conductance heterogeneity is not significant compared to that caused by streamflow variability. It is consistent with the conclusion in Sawyer and Cardenas, 2009 that permeability heterogeneity in riverbed sediment is more important in changing the residence times than the volume of the hyporheic zone. Shorter mean residence time can be caused by riverbed heterogeneity compared to the homogenous simulation, which has also been previously reported (Salehin et al., 2004; Tonina et al., 2016).
The riverbed conductance heterogeneity and streamflow variability both have impacts on the reach scale residence times. The difference caused by conductance heterogeneity can be comparable to the difference caused by streamflow variability.
Though not perfect, we showed that it is possible to derive the TSM based on the residence time and synthetic dataset simulated using high resolution flow and reactive transport. We developed a simplified transient storage model (TSM) integrating the streamflow dynamics and riverbed heterogeneity that have been reflected in the residence time to simulate reach-scale processes. The TSM model was agreeable simulating the synthetic reach-scale tracer data. But the discrepancy due to heterogeneity was exaggerated due to the inaccuracy predicting the synthetic observation. The mismatch between the synthetic observations and TSM may be due to the definition of hyporheic zone or some HEF pathways that contributed significantly to the tracer concentrations were not accounted for when deriving the mean residence times. The high bias in O2 and CH2O coincided with the low bias of tracer, which may be caused by the cumulative effect of reaction and transport that cannot be simply represented by using the same reaction parameters apart from the aforementioned possible causes.
When including reactions in the TSM, there is a surprisingly good agreement between the TSM and the synthetic observation of nitrate. TSM results shows that the nitrate loss due to the biological reactions varied from 34 to 66% of the total loss combined with hyporheic exchange. For this simulation, nitrate from the hyporheic zone was mainly a source to the river water until HZ nitrate concentration is lower than river concentration. The high bias of CH2O and O2 concentrations suggest that the agreement between the TSM and the observations for nitrate might give us a bulk nitrate uptake rate, but it is not enough to explain the other two reactive components. Because the tracer concentration was being underpredicted by the TSM as shown in Figure 6, the high bias of CH2O and O2 could not be caused by the hyporheic exchange, but effective reaction rates. The results also indicate that the well-mixed assumption in the HZs for TSM should be revisited, especially for redox-sensitive reactions. Adding one-dimensional flow and reactive transport in the HZ might improve the model simulation.
One of the questions asked in a recent commentary by Knapp and Kelleher (2020) was whether the processes estimated from conceptual parameters are interpretable for TSM. We showed that the TSM model parameters can be interpretable. Our TSM parameters carry the signatures of dynamics streamflow and subsurface heterogeneity. The simplified TSM can assist in uncertainty analysis efficiently to understand the controlling parameters for reach-scale system behavior. Sensitivity analysis on reaction rate parameters showed that they can be time dependent, which is caused by inaccurate conceptualization, such as well-mixed storage zones. The maximum change in cumulative consumption of nitrate is only 2.5% if a constant mean residence time was used for TSM because of the long mean residence time. This suggested that the dynamic exchange rate coefficient was not necessary for this study case. However, the difference between the simulations using a constant vs. time varying residence times became larger if we decreased the residence times by a factor of 10, reaching 7.8%.
High resolution models can give more mechanistic details of a study system, but it is not realistic for every river corridor as it is quite expensive, especially for uncertainty analysis. Combined with TSM models amended with biogeochemical reactions and machine learning (future work) from the high resolution model simulation results, it is possible to better constrain the TSM models and improve the mechanistic understanding of the river corridors and better inform field investigations so that the vulnerability of watersheds to water quality changes due to a variety of stressors can be identified and protected (Ranalli and Macalady, 2010).
Using high performance flow and reactive transport simulations and a massively parallel particle tracking method, we calculated the dynamic hydrologic exchange fluxes and residence time distributions driven by long-term time-varying stream discharges within a large river corridor, located along an eighth-order stream. While it is possible to interpret the synthetic tracer data at the reach-scale using a transient storage model integrating the signatures of dynamics stream discharge and subsurface heterogeneity, there are still challenges representing multiple reactive components using simplified TSM that's amended with reactions. A bulk reaction rate for a single reactive component may be far from reflecting the true mechanisms in the system of interest. A transferrable, novel multiscale modeling framework integrating multiscale characteristics from high resolution simulations and modified TSMs, e.g., accounting for multirate mass transfer, dynamic reaction kinetics, or depth-resolved flow and transport, is in need in order to improve mechanistic predictions of water quality in streams and map the watersheds of vulnerability for restoration.
The raw data supporting the conclusions of this article will be made available by the authors, without undue reservation.
YF did model simulations and wrote the paper. XS did particle tracking. HR, WP, PS, and MR developed the dataset for model boundary conditions. All co-authors contributed to the writing and model discussion of the paper.
This research described in this publication was supported by the U.S. Department of Energy (DOE), Office of Biological and Environmental Research, Subsurface Biogeochemical Research (SBR) Program through the SBR Scientific Focus Area project at Pacific Northwest National Laboratory. Simulations were performed at EMSL (grid.436923.9), a DOE Office of Science User Facility sponsored by the Office of Biological and Environmental Research. Pacific Northwest National Laboratory is operated for DOE by Battelle.
The authors declare that the research was conducted in the absence of any commercial or financial relationships that could be construed as a potential conflict of interest.
Anibas, C., Tolche, A. D., Ghysels, G., Nossent, J., Schneidewind, U., Huysmans, M., et al. (2018). Delineation of spatial-temporal patterns of groundwater/surface-water interaction along a river reach (Aa River, Belgium) with transient thermal modeling. Hydrogeol. J. 26, 819–835. doi: 10.1007/s10040-017-1695-9
Arntzen, E. V., Geist, D. R., and Dresel, P. E. (2006). Effects of fluctuating river flow on groundwater/surface water mixing in the hyporheic zone of a regulated, large cobble bed river. River Res. Appl. 22, 937–946. doi: 10.1002/rra.947
Bencala, K. E. (1983). Simulation of solute transport in a mountain pool-and-riffle stream with a kinetic mass-transfer model for sorption. Water Resour. Res. 19, 732–738. doi: 10.1029/WR019i003p00732
Bencala, K. E., Gooseff, M. N., and Kimball, B. A. (2011). Rethinking hyporheic flow and transient storage to advance understanding of stream-catchment connections. Water Resour. Res. 47, 1–9. doi: 10.1029/2010WR010066
Boano, F., Harvey, J. W., Marion, A., Packman, A. I., Revelli, R., Ridolfi, L., et al. (2014). Hyporheic flow and transport processes: mechanisms, models, and biogeochemical implications. Rev. Geophys. 52, 603–679. doi: 10.1002/2012RG000417
Boano, F., Revelli, R., and Ridolfi, L. (2007). Bedform-induced hyporheic exchange with unsteady flows. Adv. Water Resour. 30, 148–156. doi: 10.1016/j.advwatres.2006.03.004
Boano, F., Revelli, R., and Ridolfi, L. (2008). Reduction of the hyporheic zone volume due to the stream-aquifer interaction. Geophys. Res. Lett. 35, 1–5. doi: 10.1029/2008GL033554
Boulton, A. J., Findlay, S., Marmonier, P., Stanley, E. H., and Valett, H. M. (1998). The functional significance of the hyporheic zone in streams and rivers. Annu. Rev. Ecol. Syst. 29, 59–81. doi: 10.1146/annurev.ecolsys.29.1.59
Briggs, M. A., Gooseff, M. N., Arp, C. D., and Baker, M. A. (2009). A method for estimating surface transient storage parameters for streams with concurrent hyporheic storage. Water Resour. Res. 45, 1–13. doi: 10.1029/2008WR006959
Burdine, N. T. (1953). Relative permeability calculations from pore size distribution data. T Am. I Min. Met. Eng. 198, 71–78. doi: 10.2118/225-G
Coleman, A. M., Ward, D. L., Larson, K. B., and Lettrick, J. W. (2010). Development of a High-Resolution Bathymetry Dataset for the Columbia River through the Hanford Reach. PNNL-19878. (Richland, WA: Pacific Northwest National Laboratory). doi: 10.2172/1000818
Datry, T., Scarsbrook, M., Larned, S., and Fenwick, G. (2008). Lateral and longitudinal patterns within the stygoscape of an alluvial river corridor. Fund. Appl. Limnol. 171, 335–347. doi: 10.1127/1863-9135/2008/0171-0335
Dauble, D. D., Page, T. L., and Hanf, R. W. (1989). Spatial-distribution of juvenile salmonids in the hanford reach, Columbia River. Fish B Noaa 87, 775–790.
Dickson, N. E., Carrivick, J. L., and Brown, L. E. (2012). Flow regulation alters alpine river thermal regimes. J. Hydrol. 464, 505–516. doi: 10.1016/j.jhydrol.2012.07.044
DiStefano, R. J., Magoulick, D. D., Imhoff, E. M., and Larson, E. R. (2009). Imperiled crayfishes use hyporheic zone during seasonal drying of an intermittent stream. J. N. Am. Benthol. Soc. 28, 142–152. doi: 10.1899/08-072.1
Dwivedi, D., Steefel, C. I., Arora, B., Newcomer, M., Moulton, J. D., Dafflon, B., et al. (2018). Geochemical exports to river from the intrameander hyporheic zone under transient hydrologic conditions: east river mountainous Watershed, Colorado. Water Resour. Res. 54, 8456–8477. doi: 10.1029/2018WR023377
Edwardson, K. J., Bowden, W. B., Dahm, C., and Morrice, J. (2003). The hydraulic characteristics and geochemistry of hyporheic and parafluvial zones in Arctic tundra streams, North Slope, Alaska. Adv. Water Resour. 26, 907–923. doi: 10.1016/S0309-1708(03)00078-2
Febria, C. M., Fulthorpe, R. R., and Williams, D. D. (2010). Characterizing seasonal changes in physicochemistry and bacterial community composition in hyporheic sediments. Hydrobiologia 647, 113–126. doi: 10.1007/s10750-009-9882-x
Galloway, J., Fox, A., Lewandowski, J., and Arnon, S. (2019). The effect of unsteady streamflow and stream-groundwater interactions on oxygen consumption in a sandy streambed. Sci. Rep. 9:19735. doi: 10.1038/s41598-019-56289-y
Gomez-Velez, J. D., Wilson, J. L., Cardenas, M. B., and Harvey, J. W. (2017). Flow and Residence times of dynamic river bank storage and sinuosity-driven hyporheic exchange. Water Resour. Res. 53, 8572–8595. doi: 10.1002/2017WR021362
Gooseff, M. N., Bencala, K. E., Scott, D. T., Runkel, R. L., and McKnight, D. M. (2005). Sensitivity analysis of conservative and reactive stream transient storage models applied to field data from multiple-reach experiments. Adv. Water Resour. 28, 479–492. doi: 10.1016/j.advwatres.2004.11.012
Haddou, K., Bendaoud, A., Belaidi, N., and Taleb, A. (2018). A large-scale study of hyporheic nitrate dynamics in a semi-arid catchment, the Tafna River, in Northwest Algeria. Environ. Earth Sci. 77:520. doi: 10.1007/s12665-018-7673-2
Hammond, G. E., and Lichtner, P. C. (2010). Field-scale model for the natural attenuation of uranium at the Hanford 300 area using high-performance computing. Water Resour. Res. 46:W09527. doi: 10.1029/2009WR008819
Hammond, G. E., Lichtner, P. C., and Mills, R. T. (2014). Evaluating the performance of parallel subsurface simulators: an illustrative example with PFLOTRAN. Water Resour. Res. 50, 208–228. doi: 10.1002/2012WR013483
Harjung, A., Sabater, F., and Butturini, A. (2018). Hydrological connectivity drives dissolved organic matter processing in an intermittent stream. Limnologica 68, 71–81. doi: 10.1016/j.limno.2017.02.007
Harvey, J., Gomez-Velez, J., Schmadel, N., Scott, D., Boyer, E., Alexander, R., et al. (2019). How hydrologic connectivity regulates water quality in river corridors. J. Am. Water Resour. Assoc. 55, 369–381. doi: 10.1111/1752-1688.12691
Harvey, J., and Gooseff, M. (2015). River corridor science: hydrologic exchange and ecological consequences from bedforms to basins. Water Resour. Res. 51, 6893–6922. doi: 10.1002/2015WR017617
Harvey, J. W., Bohlke, J. K., Voytek, M. A., Scott, D., and Tobias, C. R. (2013). Hyporheic zone denitrification: controls on effective reaction depth and contribution to whole-stream mass balance. Water Resour. Res. 49, 6298–6316. doi: 10.1002/wrcr.20492
Harvey, J. W., and Fuller, C. C. (1998). Effect of enhanced manganese oxidation in the hyporheic zone on basin-scale geochemical mass balance. Water Resour. Res. 34, 623–636. doi: 10.1029/97WR03606
Harvey, J. W., Wagner, B. J., and Bencala, K. E. (1996). Evaluating the reliability of the stream tracer approach to characterize stream-subsurface water exchange. Water Resour. Res. 32, 2441–2451. doi: 10.1029/96WR01268
Hassan, M. A., Tonina, D., Beckie, R. D., and Kinnear, M. (2015). The effects of discharge and slope on hyporheic flow in step-pool morphologies. Hydrol. Process. 29, 419–433. doi: 10.1002/hyp.10155
Helton, A. M., Poole, G. C., Payn, R. A., Izurieta, C., and Stanford, J. A. (2012). Scaling flow path processes to fluvial landscapes: an integrated field and model assessment of temperature and dissolved oxygen dynamics in a river-floodplain-aquifer system. J. Geophys. Res. Biogeo. 117:G00N14. doi: 10.1029/2012JG002025
Herman, J., and Usher, W. (2017). An open-source Python library for sensitivity analysis. J. Open Sourc. Softw. 2:97. doi: 10.21105/joss.00097
Hou, Z. S., Scheibe, T. D., Murray, C. J., Perkins, W. A., Arntzen, E. V., Ren, H. Y., et al. (2019). Identification and mapping of riverbed sediment facies in the Columbia River through integration of field observations and numerical simulations. Hydrol. Process 33, 1245–1259. doi: 10.1002/hyp.13396
Jonsson, K., Johansson, H., and Worman, A. (2004). Sorption behavior and long-term retention of reactive solutes in the hyporheic zone of streams. J. Environ. Eng. Asce. 130, 573–584. doi: 10.1061/(ASCE)0733-9372(2004)130:5(573)
Kawanishi, R., Dohi, R., Fujii, A., Inoue, M., and Miyake, Y. (2017). Vertical migration in streams: seasonal use of the hyporheic zone by the spinous loach Cobitis Shikokuensis. Ichthyol. Res. 64, 433–443. doi: 10.1007/s10228-017-0576-5
Kelleher, C., Ward, A., Knapp, J. L. A., Blaen, P. J., Kurz, M. J., Drummond, J. D., et al. (2019). Exploring tracer information and model framework trade-offs to improve estimation of stream transient strorage processes. Water Resour. Res. 55, 3481–3501. doi: 10.1029/2018WR023585
Killingstad, M. W., Widdowson, M. A., and Smith, R. L. (2002). Modeling enhanced in situ denitrification in groundwater. J. Environ. Eng. Asce. 128, 491–504. doi: 10.1061/(ASCE)0733-9372(2002)128:6(491)
Knapp, J. L. A., and Cirpka, O. A. (2017). Determination of hyporheic travel time distributions and other parameters from concurrent conservative and reactive tracer tests by local-in-global optimization. Water Resour. Res. 53, 4984–5001. doi: 10.1002/2017WR020734
Knapp, J. L. A., and Kelleher, C. (2020). A perspective on the future of transient storage modeling: let's stop chasing our tail. Water Resour. Res. 56:e2019WR026257. doi: 10.1029/2019WR026257
Kruegler, J., Gomez-Velez, J., Lautz, L. K., and Endreny, T. A. (2020). Dynamic evapotranspiration alters hyporheic flow and residence times in the intrameander zone. Water 12:424. doi: 10.3390/w12020424
Larsen, L. G., Harvey, J. W., and Maglio, M. M. (2014). Dynamic hyporheic exchange at intermediate timescales: testing the relative importance of evapotranspiration and flood pulses. Water Resour. Res. 50, 318–335. doi: 10.1002/2013WR014195
Lemke, D., Liao, Z. J., Wohling, T., Osenbruck, K., and Cirpka, O. A. (2013). Concurrent conservative and reactive tracer tests in a stream undergoing hyporheic exchange. Water Resour. Res. 49, 3024–3037. doi: 10.1002/wrcr.20277
Lewandowski, J., Arnon, S., Banks, E., Batelaan, O., Betterle, A., Broecker, T., et al. (2019). Is the hyporheic zone relevant beyond the scientific community? Water 11:2230. doi: 10.3390/w11112230
Liu, S. N., and Chui, T. F. M. (2018). Impacts of different rainfall patterns on hyporheic zone under transient conditions. J. Hydrol. 561, 598–608. doi: 10.1016/j.jhydrol.2018.04.019
Magliozzi, C., Coro, G., Grabowski, R. C., Packman, A. I., and Krause, S. (2019). A multiscale statistical method to identify potential areas of hyporheic exchange for river restoration planning. Environ. Modell. Softw. 111, 311–323. doi: 10.1016/j.envsoft.2018.09.006
Newcomer, M. E., Hubbard, S. S., Fleckenstein, J. H., Maier, U., Schmidt, C., Thullner, M., et al. (2018). Influence of hydrological perturbations and riverbed sediment characteristics on hyporheic zone respiration of CO2 and N-2. J. Geophys. Res. Biogeo. 123, 902–922. doi: 10.1002/2017JG004090
Niehus, S. E., Perkins, W. A., and Richmond, M. C. (2014). Simulation of Columbia River Hydrodynamics and Water Temperature from 1917 through 2011 in the Hanford Reach. Final Report PNWD-3278. (Richland, WA: Battelle-Pacific Northwest Division).
Perkins, W. A., and Richmond, M. C. (2004). MASS2 Modular Aquatic Simulation System in Two Dimensions User Guide and Reference (Richland, WA: Pacific Northwest National Laboratory), PNNL-14820-1.
Rahimi, M., Essaid, H. I., and Wilson, J. T. (2015). The role of dynamic surface water-groundwater exchange on streambed denitrification in a first-order, low-relief agricultural watershed. Water Resour Res 51, 9514–9538. doi: 10.1002/2014WR016739
Ranalli, A. J., and Macalady, D. L. (2010). The importance of the riparian zone and in-stream processes in nitrate attenuation in undisturbed and agricultural watersheds - a review of the scientific literature. J. Hydrol. 389, 406–415. doi: 10.1016/j.jhydrol.2010.05.045
Rickard, W. H., and Gray, R. H. (1995). The hanford reach of the columbia river - a refuge for fish and riverine wildlife and plants in Eastern Washington. Nat. Area J. 15, 68–74.
Rockhold, M. L., Fayer, M. J., Kincaid, C. T., and Gee, G. W. (1995). Estimation of Natural Groundwater Recharge for the Performance Assessment of a Low-Level Waste Disposal Facility at the Hanford Site (Richland, WA: Pacific Northwest National Laboratory).
Runkel, R. L., McKnight, D. M., and Andrews, E. D. (1998). Analysis of transient storage subject to unsteady flow: diel flow variation in an Antarctic stream. J. N. Am. Benthol. Soc. 17, 143–154. doi: 10.2307/1467958
Salehin, M., Packman, A. I., and Paradis, M. (2004). Hyporheic exchange with heterogeneous streambeds: laboratory experiments and modeling. Water Resour. Res. 40:W11504. doi: 10.1029/2003WR002567
Sawyer, A. H., and Cardenas, M. B. (2009). Hyporheic flow and residence time distributions in heterogeneous cross-bedded sediment. Water Resour. Res. 45:W08406. doi: 10.1029/2008WR007632
Shuai, P., Chen, X. Y., Song, X. H., Hammond, G. E., Zachara, J., Royer, P., et al. (2019). Dam Operations and subsurface hydrogeology control dynamics of hydrologic exchange flows in a regulated river Reach. Water Resour. Res. 55, 2593–2612. doi: 10.1029/2018WR024193
Singh, T., Wu, L. W., Gomez-Velez, J. D., Lewandowski, J., Hannah, D. M., and Krause, S. (2019). Dynamic hyporheic zones: exploring the role of peak flow events on bedform-induced hyporheic exchange. Water Resour. Res. 55, 218–235. doi: 10.1029/2018WR022993
Song, X. H., Chen, X. Y., Stegen, J., Hammond, G., Song, H. S., Dai, H., et al. (2018). Drought conditions maximize the impact of high-frequency flow variations on thermal regimes and biogeochemical function in the hyporheic zone. Water Resour. Res. 54, 7361–7382. doi: 10.1029/2018WR022586
Thorne, P., Bergeron, M., Williams, M., and Freedman, V. (2006). Groundwater Data Package for Hanford Assessments. Richland, WA: Pacific Northwest National Laboratory. doi: 10.2172/882976
Tonina, D., de Barros, F. P. J., Marzadri, A., and Bellin, A. (2016). Does streambed heterogeneity matter for hyporheic residence time distribution in sand-bedded streams? Adv. Water Resour. 96, 120–126. doi: 10.1016/j.advwatres.2016.07.009
Triska, F. J., Kennedy, V. C., Avanzino, R. J., Zellweger, G. W., and Bencala, K. E. (1989). Retention and transport of nutrients in a 3rd-order stream - channel processes. Ecology 70, 1877–1892. doi: 10.2307/1938119
Van Genuchten, M. T. (1980). A closed-form equation for predicting the hydraulic conductivity of unsaturated soils. Soil Sci. Soc. Am. J. 44, 892–898. doi: 10.2136/sssaj1980.03615995004400050002x
Ward, A. S., and Packman, A. I. (2019). Advancing our predictive understanding of river corridor exchange. Wires Water 6:e1327. doi: 10.1002/wat2.1327
Wexler, S. K., Hiscock, K. M., and Dennis, P. F. (2011). Catchment-scale quantification of hyporheic denitrification using an isotopic and solute flux approach. Environ. Sci. Technol. 45, 3967–3973. doi: 10.1021/es104322q
Zachara, J., Chen, X., Song, X., Shuai, P., Murray, C., and Tom Resch, C. (2020). Kilometer-scale hydrologic exchange flows in a gravel bed river corridor and their implications to solute migration. Water Resour. Res. 56:e2019WR025258. doi: 10.1029/2019WR025258
Zarnetske, J. P., Haggerty, R., Wondzell, S. M., and Baker, M. A. (2011). Dynamics of nitrate production and removal as a function of residence time in the hyporheic zone. J. Geophys. Res. Biogeo. 116:G01025. doi: 10.1029/2010JG001356
Keywords: river corridor, hydrologic exchange flow, residence time, transient storage model, particle tracking, reach-scale flow and transport
Citation: Fang Y, Song X, Ren H, Perkins WA, Shuai P, Richmond MC, Hou Z, Bao J, Chen X and Scheibe TD (2020) High-Performance Simulation of Dynamic Hydrologic Exchange and Implications for Surrogate Flow and Reactive Transport Modeling in a Large River Corridor. Front. Water 2:564211. doi: 10.3389/frwa.2020.564211
Received: 20 May 2020; Accepted: 05 November 2020;
Published: 26 November 2020.
Edited by:
Carl I. Steefel, Lawrence Berkeley National Laboratory, United StatesReviewed by:
Joseph Guillaume, Australian National University, AustraliaCopyright © 2020 Fang, Song, Ren, Perkins, Shuai, Richmond, Hou, Bao, Chen and Scheibe. This is an open-access article distributed under the terms of the Creative Commons Attribution License (CC BY). The use, distribution or reproduction in other forums is permitted, provided the original author(s) and the copyright owner(s) are credited and that the original publication in this journal is cited, in accordance with accepted academic practice. No use, distribution or reproduction is permitted which does not comply with these terms.
*Correspondence: Yilin Fang, eWlsaW4uZmFuZ0Bwbm5sLmdvdg==
Disclaimer: All claims expressed in this article are solely those of the authors and do not necessarily represent those of their affiliated organizations, or those of the publisher, the editors and the reviewers. Any product that may be evaluated in this article or claim that may be made by its manufacturer is not guaranteed or endorsed by the publisher.
Research integrity at Frontiers
Learn more about the work of our research integrity team to safeguard the quality of each article we publish.