 Wenming Dong*
 Amrita Bhattacharyya
 Patricia M. Fox
 Markus Bill
 Dipankar Dwivedi
 Sergio Carrero
 Mark Conrad
 Peter S. Nico*
- Earth and Environment Sciences Area, Lawrence Berkeley National Laboratory, Berkeley, CA, United States
Hyporheic zones act as critical ecological links between terrestrial and aquatic systems where redox-sensitive metals of iron (Fe) and manganese (Mn) significantly impact nutrient cycling and water quality. However, the geochemical controls on the release and speciation of Fe(II) and Mn(II) in these biogeochemical hotspots are still poorly understood. Here we conducted batch incubation experiments and analyzed Fe K-edge extended X-ray absorption fine structure (EXAFS) spectroscopy data using sediment samples from a hyporheic zone of the East River floodplain in Colorado to understand the production, release and speciation of Fe(II) and Mn(II) in groundwater. Our results indicate that the production and release of Fe(II) and Mn(II) vary with sediment reducing conditions and subsurface positions, and the rates were determined either by a zero- or first-order rate equation. The sediments with higher Fe(II) production did not necessarily result in higher release of dissolved Fe(II), and ≥97% Fe(II) is accumulated in solid phase. We found that the majority of Fe(II) exists as siderite (FeCO3), Fe(II)-natural organic matter (NOM) complexes and ferrosmectite, and the equilibrium concentrations of dissolved Fe(II) are controlled primarily by siderite solubility, and enhanced greatly by formation of strong Fe(II)-NOM complexes as dominant aqueous Fe(II) species. By contract, dissolved Mn(II) increases slowly and linearly, and an equilibrium concentration was not reached during the incubation period, and the roles of rhodochrosite (MnCO3) and Mn(II)-NOM complexes are insignificant. Furthermore, we reviewed and calibrated the literature reported binding constants (log K) of Fe(II)-NOM complexes which successfully predicted our experimental data. This work reveals that siderite and dissolved NOM are the controlling phases in release and speciation of dissolved Fe(II), and the finding is expected to be applicable in many hyporheic zones and subsurface environments with similar geochemical conditions.
Introduction
River hyporheic zones are defined as regions of sediment beneath and alongside a streambed where mixing and bidirectional exchange of shallow groundwater and river water occurs. These zones perform important ecological functions by linking terrestrial and aquatic systems within watersheds and have been recognized as hotspots for biological activity and cycling of metals and nutrients (Boulton et al., 1998; Gomez et al., 2012; Boano et al., 2014; Dwivedi et al., 2018; Saup et al., 2019). The interaction of nutrient-rich groundwater and oxygen-rich stream water results in distinct redox gradients (Dwivedi et al., 2018) which significantly impact the export of redox-sensitive metals from hyporheic zone to the local watershed, thereby influencing the overall nutrient cycling and water quality (Bryant et al., 2020).
Redox reactions of iron (Fe) and manganese (Mn), often accompanied by dissolution-precipitation processes, widely influence the biogeochemical cycles of nutrients (e.g., carbon, nitrogen, sulfur, oxygen, and phosphorous) as well as the transport of contaminants such as uranium, chromium, and polychlorinated biphenyls (PCBs) in many subsurface aquifers (Lovley, 1991, 1997). Toxic metalloids (e.g., arsenic and selenium) associated with Fe/Mn mineral assemblies could also be simultaneously released into groundwater (Lovley, 1991; Pedersen et al., 2006; Rowland et al., 2007; Park et al., 2018). In addition, soluble Fe(II) and Mn(II) species in groundwater gets re-oxidized and precipitated as insoluble Fe(III) and Mn(III/IV) oxides during transport, thereby changing the porosity and permeability of sediment, clogging water pathway as well as staining water supply systems.
The production and release of Fe(II) and Mn(II) are critically important geochemical processes in hyporheic zones. Dissimilatory metal reduction can convert highly insoluble Fe(III) and Mn(III/IV) (oxyhydr)oxides to more soluble Fe(II) and Mn(II) species in oxygen-limited environments (Lovley, 1991, 1997; Cooper et al., 2006; Hyun et al., 2017). Their release rates, extent and speciation are not yet fully understood, and could be controlled by site-specific geochemical factors such the solubility of metal minerals under neutral and alkaline conditions [e.g., siderite (FeCO3), rhodochrosite (MnCO3) and pyrite (FeS2); Coleman et al., 1993; Zachara et al., 1998; Jensen et al., 2002; Wan et al., 2019] or formation of metal complexes with natural organic matter (NOM) in NOM-rich environments (Daugherty et al., 2017). Siderite has been considered as an important reduced phase of iron(II) mineral and end product of bacterial respiration in anaerobic environments (Coleman et al., 1993) as well as in laboratory studies (Zachara et al., 1998). NOM can influence mineral solubility and metal speciation via formation of strong metal complexes (Tipping, 2002; Dong et al., 2010; Daugherty et al., 2017), and serve as an electron donor for microbial metal reduction (Lovley, 1991, 1997; Cooper et al., 2006; Kenwell et al., 2016; Hyun et al., 2017; Bryant et al., 2020). However, the impact of NOM on release and speciation of Fe(II) and Mn(II) in hyporheic zones is still not well-understood.
The East River floodplain, located in the upper Colorado River Basin, has been developed as a community headwaters testbed for the U.S. Department of Energy (DOE) to explore how mountainous watersheds retain and release water, nutrients, carbon and metals, and how they respond to early snowmelt, drought, and other disturbances (Hubbard et al., 2018). It consists of multiple river meanders with a distinctive fluvial progression and is representative of other headwater systems (Kenwell et al., 2016; Dwivedi et al., 2018). The East River flow is fed predominantly by snowmelt in late spring to early summer, with middle to late-summer monsoon (Winnick et al., 2017; Hubbard et al., 2018). A reactive transport modeling study (Dwivedi et al., 2018) indicated that dissolved oxygen (DO) and nitrate () decreased quickly along the intrameander flow paths while Fe(II) concentration increased. It further confirmed that the interactions of river water and groundwater resulted in distinct redox gradients and geochemical conditions. However, there is a knowledge gap in understanding the geochemical controls on the release of these redox active metals and their speciation in the hyporheic sediments and groundwater of East River. To address these questions, we conducted (1) laboratory batch incubation experiments to determine the production, release rates and extent of Fe(II) and Mn(II) using the depth- and redox-distributed sediment samples from East River hyporheic sediments, (2) synchrotron-based bulk Fe K-edge extended X-ray absorption fine structure (EXAFS) spectroscopy to identify the major Fe species associated with sediments, (3) geochemical modeling to explore the geochemical controls on the release and speciation of Fe(II) and Mn(II), with an emphasis on the impact of Fe(II)-NOM complexation on siderite dissolution.
Materials and Methods
Site Description and Sediment Characterization
Sediment samples were collected from a meandering reach of the East River located near Gothic, Colorado (Figure 1). Detailed descriptions of the field site and sediment sampling have been reported previously (Dwivedi et al., 2018; Fox et al., 2020). The watershed geology includes a diverse suite of Paleozoic and Mesozoic sedimentary rocks. In particular, the floodplain site consists of the Mancos Shale, a relative young Cretaceous Shale bedrock overlain by glacial moraine and alluvial sediment deposits. The Mancos is an agglomeration of an array of marine black shale with regions of elevated metal, metalloid, and pyrite content (Morrison et al., 2012; Kenwell et al., 2016). The four sediment samples (MCP1S, MCP1D, MCP3S, and MCP3D) used in this study were collected at ~30–45 cm and 60–75 cm depth using a 5-cm diameter soil core sampler directly adjacent to two existing wells, MCP1 and MCP3 along a transect across Meander C (Figure 1) on September 22, 2016. Here “S” denotes shallow depth 30–45 cm and “D” denotes deep depth 60–75 cm. These samples represent the variation of naturally reducing zones within the meander C (Dwivedi et al., 2018). MCP3 is located in the anoxic zone with more Fe-reducing conditions, while MCP1 is located in the suboxic zone with relatively less Fe-reducing conditions. The deep sample (60–75 cm) has more Fe-reducing conditions than the shallow samples. At the time of sampling, the water table was ~80 cm (MCP1) and 90 cm (MCP3) below ground surface and the river discharge was nearing baseflow conditions during a water year characterized as average (Hubbard et al., 2018). However, the water table varies seasonally with river discharge, and portions of the floodplain can become completely saturated due to overbank flow during spring snowmelt (May–July). The samples were sealed into Mylar bags with oxygen absorbers immediately after sampling in order to preserve its redox status, shipped in a cooler with ice packs to the laboratory and stored at 4°C until further use. Note that the samples were stored ~6 months in Mylar bags in a 4°C refrigerator before our incubation experiments. Each sediment was homogenized and sieved through a 2-mm sieve in an anaerobic glovebox. Typical groundwater composition at the two locations is shown in Supplementary Table 1.
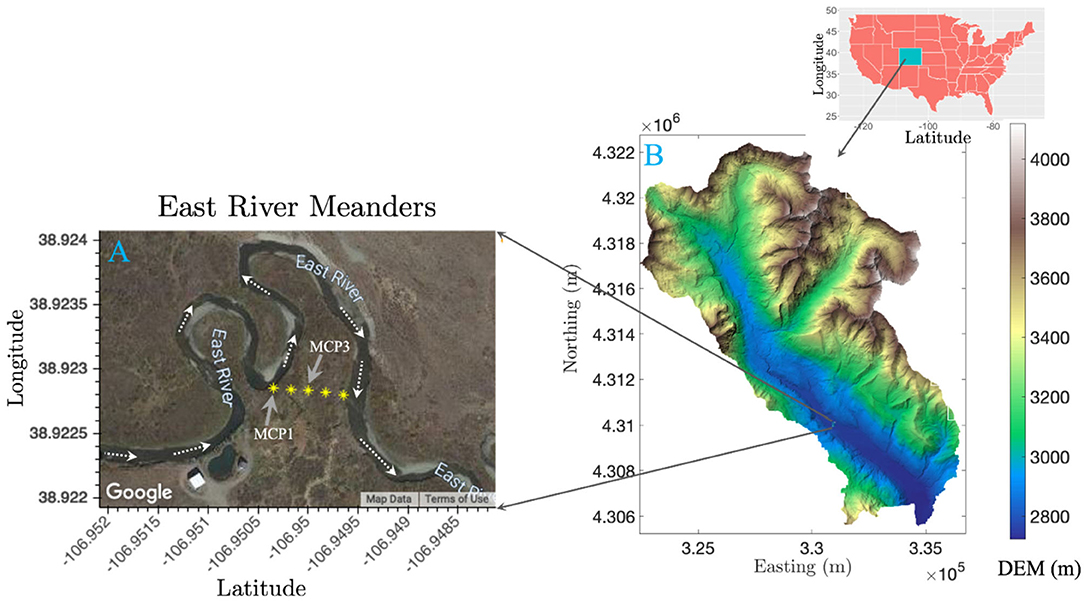
Figure 1. Map showing core sampling locations of MCP1 and MCP3 from the meander C floodplain transect (A), and a digital elevation map (DEM) of the East River watershed in Colorado (B).
Moisture content was measured by drying a portion of sample at 105°C until a constant mass was achieved. A subsample of ≤2-mm fraction was air-dried at room temperature and ball-milled to fine powder for chemical and mineralogy analyses. Total carbon (TC) and total inorganic carbon (TIC) were analyzed using a Shimadzu TOC-VCPH analyzer equipped with a solid sample module (SSM-5000A). Total organic carbon (TOC) was obtained from the difference between TC and TIC. The iron (Fe) and manganese (Mn) contents from their free (oxyhydr)oxides were determined by extracting finely ground samples with sodium salt solution of citrate (0.3 M), bicarbonate (0.1 M), and dithionite (0.1 M) (CBD-extractable Fe and Mn) at 80°C on duplicate samples (Sparks, 1996). Total Fe(II) was extracted with 1 M HCl for 24 h and analyzed by ferrozine assay (Stookey, 1970). The mineralogical composition of powdered samples was analyzed by X-ray diffraction (XRD) using Rigaku SmartLab® diffractometer. The diffractometer was equipped with a theta-theta goniometer and a rotating sample holder using Cu (λkα1 = 1.5406 Å and λkα2 = 1.5444 Å) cathode. The data were collected from 2° to 90° of 2θ with a 0.02 °2θ step-size and count times of 2 s per step using a Kα radiation tube (40 kV, 40 mA). The diffraction patterns were analyzed using the software Match (Putz and Brandenburg, 2011) extended with the PDF2 mineral database.
Artificial River Water
Artificial river water was synthesized based on the annual average water chemistry of Pump House stream water, which is located nearby meander C. The artificial river water chemistry is provided in Table 1. ACS analytical-grade chemicals were dissolved in Milli-Q water (18.2 MΩ·cm) and the water was sparged gently with air for ~3 days to ensure equilibrium with atmospheric CO2(g) and O2(g). The pH was adjusted with small amount of HCl/NaOH until to achieve a final pH of 8.2 ± 0.1. After equilibrium, the water was filtered with 0.2 μm Corning filter system (polystyrene, sterile) in order to remove any possible microbes. Note that the concentrations of cations and anions in artificial river water (Table 1) are similar and comparable to those of the groundwater at the MCP1 and MCP3 wells (Supplementary Table 1). The major difference is that the artificial river water was manipulated with a relatively higher [] = 40 μM and saturated with atmospheric O2 for evaluating the rapid deoxygenation and denitrification processes in hyporheic zones (Dwivedi et al., 2018).
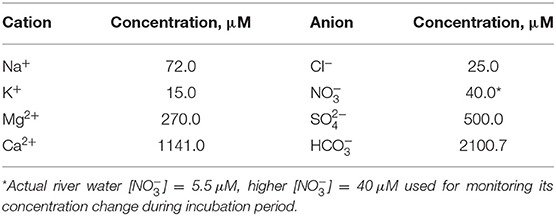
Table 1. The concentrations of major cations and anions in artificial river water.
Batch Incubation Experiments
Batch incubation experiments were conducted in duplicate in an anaerobic glovebox (~2% H2 and ~98%N2) under ambient temperature (~ 22.5°C). All materials and tools used were either autoclaved or purchased as sterile. All preparation and processing procedures were conducted in an anaerobic glovebox unless otherwise stated. First, field-wet sediment samples (15.0 g dry weight equivalent) and the artificial river water (135 mL) were mixed in 160-mL serum bottles. The bottles were then sealed with thick rubber stoppers and aluminum crimp caps, and the headspace was immediately purged with N2 to remove atmospheric O2 and CO2. The approach of mixing air saturated artificial river water with sediment mimics the process of fresh surface stream water infiltrating into anaerobic sediments. The bottles were then wrapped with aluminum foil and placed on a rotary shaker (VWR Orbital Shaker 5000). Aliquots of samples were taken at pre-selected time intervals within 57 days' incubation for chemical analyses. During sampling, we turned the bottles upside down, inserted a 25-gauge needle with 10-mL syringe, swirled vigorously, and ~ 5 mL slurry samples were taken for analyses. The nominal inner diameter of 260 μm of 25 gauge needles helps to successfully capture the reactive fine fraction (clay, silt, and fine sand) of sediment. Immediately, a 0.2 mL aliquot of the slurry sample was injected in 2-mL Eppendorf tube containing 1.8 mL of 1 M HCl, vortexed briefly and then allowed the sediment to settle for 24 h. The supernatant was analyzed for total Fe(II). The remaining slurry sample was centrifuged at 14,000 rpm for 5 min and then filtered with 0.2 μm Supor® membrane syringe filters (Pall Life Science). The filtrates were immediately split into three portions: 0.5 mL acidified (2% HNO3) for metal analysis, 0.5 mL for anion analysis, and the remaining filtrate for dissolved organic carbon (DOC) analysis. At the end of the incubation (57 days), larger samples were collected and filtered as described above for measurement of pH and Fe(II) concentrations, and headspace gas samples were collected for CO2 and δ13C analysis. Prior to each sampling point, nitrogen gas (N2) was injected first with the same volume of sample to be taken. A sediment-free control experiment was also conducted. DOC was analyzed as non-purgeable organic carbon (NPOC) using a Shimadzu TOC-VCPH analyzer. Dissolved metal and anions were analyzed using inductively coupled plasma mass spectrometry (ICP-MS) (Elan DRC II, PerkinElmer) and ion chromatography (IC) (Dionex ICS-2100, Thermo Scientific), respectively. The pH values were measured using an Orion 8104BNUWP Ross Ultra pH electrode. Fe(II) was analyzed using the ferrozine assay at 562 nm (Stookey, 1970). The concentrations and the carbon isotope ratios (δ13CVPDB) of headspace CO2 were analyzed using a headspace autosampler (Gilson, Villiers-le-Bel, France) connected to a Trace gas preconcentrator interfaced to Micromass JA Series Isoprime isotope ratio mass spectrometer (Micromass, Manchester, UK). CO2 concentrations were determined using the m/z 44 (CO2) peak area.
Iron Speciation by X-Ray Absorption Spectroscopy
Iron oxidation state and chemical coordination environment of the sediment samples were determined using Fe K-edge extended X-ray absorption fine structure (EXAFS) (7,112 eV) at beamline 4-3 at the Stanford Synchrotron Radiation Light Source, at Menlo Park, CA, under ring operating conditions of 3 GeV with a current of 450 mA. EXAFS data were processed and analyzed using the Sixpack and Athena software packages (Ravel and Newville, 2005; Webb, 2005). Linear combination fitting (LCF) of spectra was performed in Athena in k3-weighted k-space between k = 2 and 12, using the following end-members: siderite (FeCO3), 2-and 6-line ferrihydrite [Fe(OH)3·nH2O], goethite (α-FeOOH), lepidocrocite (γ-FeOOH), ferrosmectite (Fe-containing clays), and Fe(II)-NOM. Details of Fe(II)-NOM preparation and characterization are provided in Daugherty et al. (2017). These references were chosen based on their likelihood to be present in our experimental samples. The fits were optimized such that the sum of the contributing Fe phases would be 1. Compounds were only included in the fit if the fractional contribution was >0.05. Additional details for the LCF-EXAFS analysis are presented in the Supplementary Material.
Kinetic and Geochemical Modeling
The kinetics of total Fe(II) production, dissolved Fe(II) and Mn, and DOC were simulated using the data analysis of Origin 8.1 with user defined kinetic rate equations. The geochemical computer code PHREEQC (Parkhurst and Appelo, 2004) was applied for modeling of dissolved Fe(II) and Mn(II) species and the solubilities of relevant minerals including siderite (FeCO3), rhodochrosite (MnCO3), amorphous ferrous hydroxide (Fe(OH)2) and pyrite (FeS) under our incubation experimental conditions. Pyrite is included because it was identified as an important Fe(II) mineral in deep sediments from East River hillslope and floodplain (Kenwell et al., 2016; Dwivedi et al., 2018; Wan et al., 2019). The relevant geochemical reactions and thermodynamic constants (Stumm and Morgan, 1996; Langmuir, 1997) used are given in Supplementary Table 2.
Results
Sediment Characterization and Redox Variations
The CBD-extractable Fe and Mn, Fe(II), and TIC/TOC are provided in Table 2. The CBD-extractable Fe (214–436 μmol/g) and Mn (3.5–6.5 μmol/g) represent the Fe and Mn present in all “free” (oxyhydr)oxide and may server as sources for microbial reduction (Lovley, 1991, 1997; Cooper et al., 2006; Hyun et al., 2017). Similarly, total Fe(II) content serves as an indicator of the Fe-reducing conditions of the samples. As expected, MCP3 has higher Fe(II) content than MCP1 which is consistent with observations of high dissolved Fe(II) in groundwater at MCP3 (Dwivedi et al., 2018).
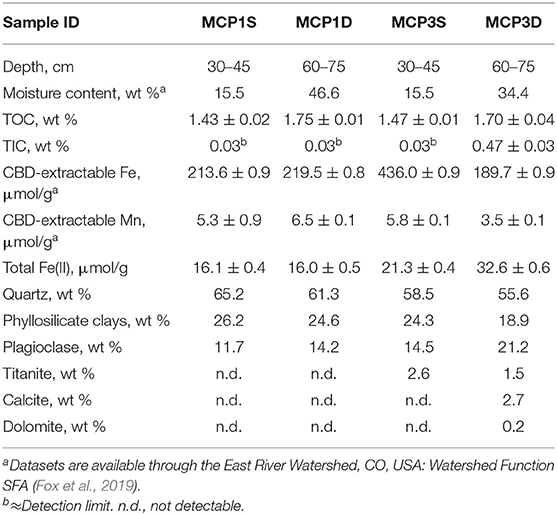
Table 2. Characterization of hyporheic sediment samples.
Deep sediments (60–75 cm) have similar TOC content ≈ 1.7% while the shallow sediments (30–45 cm) have TOC ≈ 1.5% (Table 2). TIC is much higher in MCP3D (0.47%) than in the other three samples (≤0.03%) which is in agreement with the contents of calcite and dolomite determined by XRD method. Organic carbon can serve as a major electron donor for microbial metal reduction (Lovley, 1991, 1997; Hyun et al., 2017), but also can complex with metals (Daugherty et al., 2017). TIC is a potential sink of metal-carbonates, also can be dissolved in aqueous phase as alkaline pH buffer (Stumm and Morgan, 1996). XRD analysis (Table 2) shows that the samples are composed of mostly quartz (55–65%), phyllosilicate clays (19–26%), and plagioclase (12–21%), with minor titanite (1.5–2.6%) for MCP3, and MCP3D contains detectable calcite (2.7%) and dolomite (0.2%).
Distribution of Fe Phases in Sediments
LCF of bulk Fe K-edge EXAFS provides semi-quantitative information regarding the different Fe forms present in the sediment samples (Figure 2, Supplementary Figure 1, Table 3). Irrespective of the meander location or depth, the majority of Fe species is composed of ferrihydrite (25–41%), ferrosmectite (20–45%), and Fe(II)-NOM complexes (23–32%), along with siderite (2–8%) as a minor component. Low values of R-factor and reduced chi-square indicate the goodness of the LCF fits.
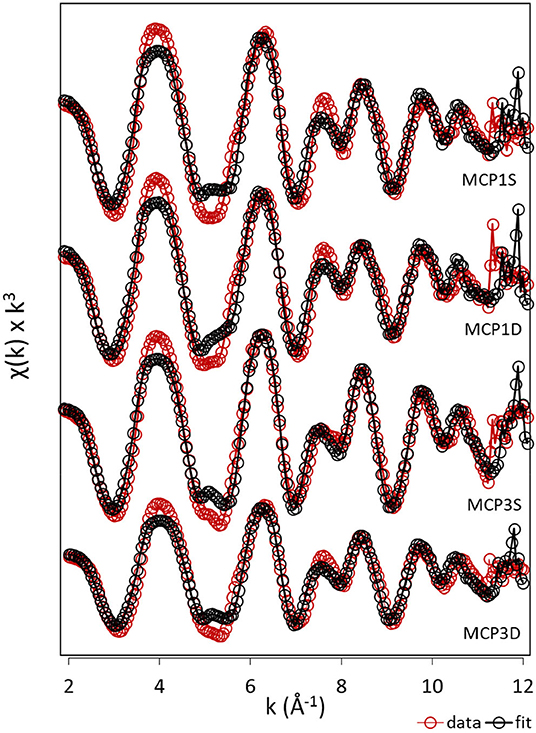
Figure 2. EXAFS analysis. k3-weighted EXAFS spectra and fits of sediment samples collected from MCP1 and MCP3 wells at shallow (S) and deep (D) zones (top to bottom). Red and black dotted lines indicate the experimental and fitted Fe K-edge EXAFS spectra, respectively.
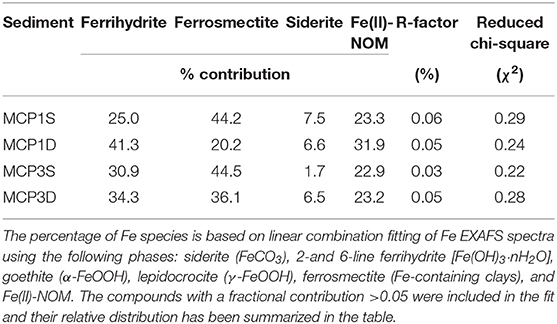
Table 3. Linear combination fit (LCF) analysis results for Fe K-edge EXAFS spectra of sediment samples collected from MCP1 and MCP3 wells at shallow (S) and deep (D) zones.
Kinetics of Total Fe(II) Production
Nitrate concentrations decreased rapidly from the initial 40 μM to ~4 μM within the first day (Supplementary Figure 2), then reduced further to ≤ 3 μM after 3 days for all sediments which is consistent with the nitrate concentrations observed in the nearby river water. It suggests that dissolved oxygen (DO) was depleted within the first day of incubation, because DO is energetically more favorable to accept electrons than nitrate, Fe(III) and sulfate (Froelich et al., 1979; Luu and Ramsay, 2003), i.e., reduction potential: dissolved O2 > nitrate > Mn(IV) > Fe(III) > sulfate. More details about interactions of DO with sediments are provided in Supplementary Material. With a rapid depletion of DO and nitrate, dissimilatory Fe(III) reduction became the dominant mechanism resulting in Fe(II) production (Lovley, 1991, 1997; Lovley et al., 1998; Lovley and Blunt-Harris, 1999) (Figure 3).
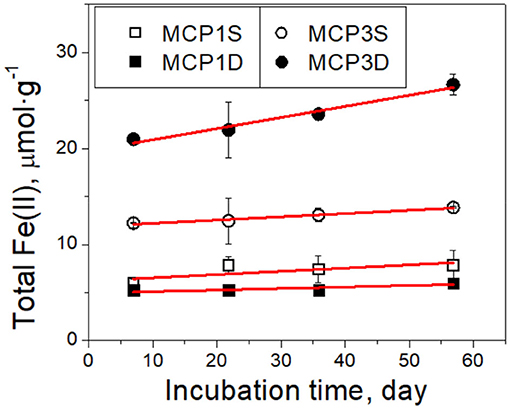
Figure 3. Kinetics of total Fe(II) production over time in incubation experiments. Black symbols are the experimental data, and red lines are the fitted results with the zero-order rate (Equation 2). The error bars represent one standard deviation from duplicate experiments.
Total Fe(II) production (μmol g−1 sediment) increased linearly over incubation time (Figure 3). It can be described by a zero-order rate equation,
where k0 is the overall zero-order rate constant (μmol·g−1·day−1). It can be integrated to yield
where is the initial total Fe(II) content (μmol·g−1) at t = 7 day, and is total Fe(II) content at t > 7 day. The data before 7 days are not used in order to avoid any potential perturbation caused by DO and nitrate. Equation (2) fits the experimental data well (red lines in Figure 3). The fitted rate constants and other parameters are provided in Table 4A. It shows the production rate constant k0 (μmol·g−1·day−1): MCP3D (0.12) > MCP3S (0.034) ≈ MCP1S (0.034) > MCP1D (0.0159), with existed at 7 days: MCP3D (19.8 μmol·g−1) > MCP3S (11.9 μmol·g−1) > MCP1S (6.2 μmol·g−1) > MCP1D (5.0 μmol·g−1). The trend is in good agreement with the total sediment Fe(II) in Table 2, indicating that the reduction rates are highly dependent on the Fe-reducing conditions and subsurface positions.
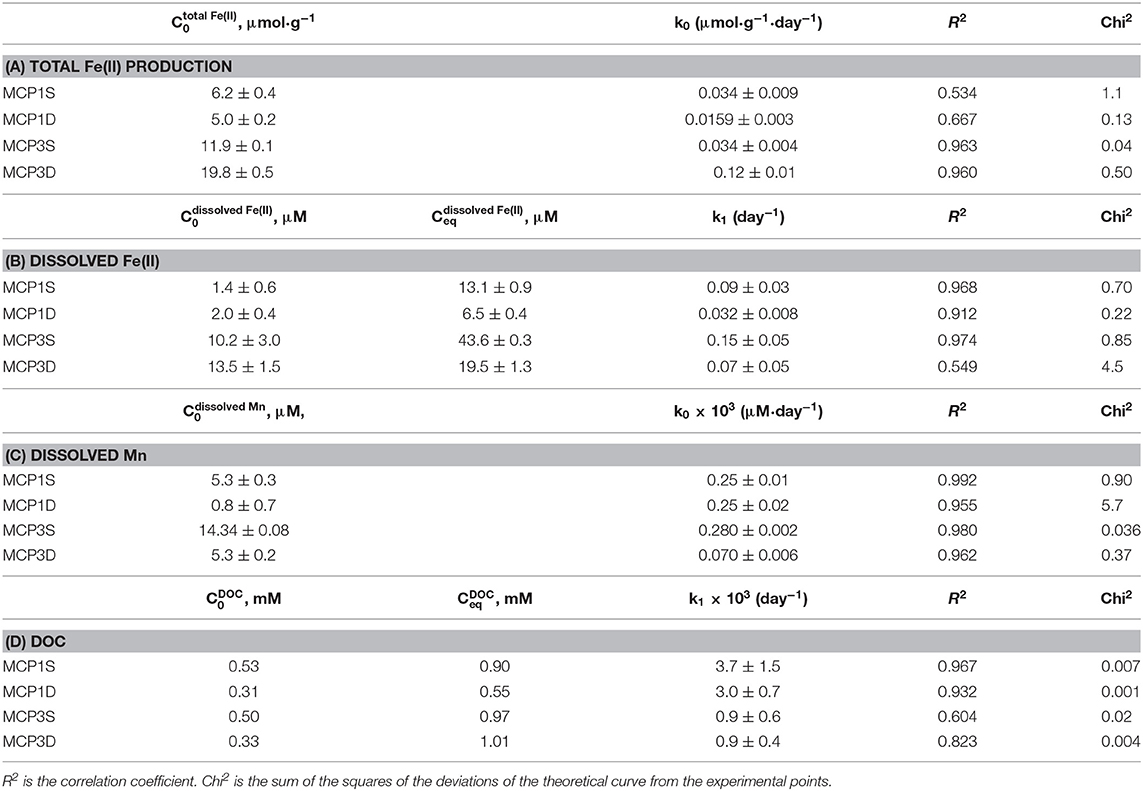
Table 4. Fitted kinetic parameters of total Fe(II) production (A), and release of dissolved Fe (B), dissolved Mn (C), and DOC (D).
Release Rates and Extent of Dissolved Fe(II)
Dissolved Fe(II) showed an initial drop during the first day of incubation due to the oxidation by DO introduced from the artificial river water, increased thereafter, and reached near-constant equilibrium concentrations after ~3 weeks (Figure 4). The experimental kinetic and equilibrium data can be simulated by a pseudo first-order rate equation (Langmuir, 1997)
where k1 is the overall first-order rate constant (day−1). Ceq is the equilibrium concentration (μM) of dissolved Fe(II), and Ct is the concentration (μM) of dissolved Fe(II) at incubation time t. This can be integrated to yield
where C0 is the initial concentration (μM) of dissolved Fe(II) at time t = 1 day. Here we selected the initial time at t = 1 day because dissolved Fe increased steadily after day 1. The fitted rate constants and parameters are given in Table 4B, and the fitted lines (red) are shown in Figure 4.
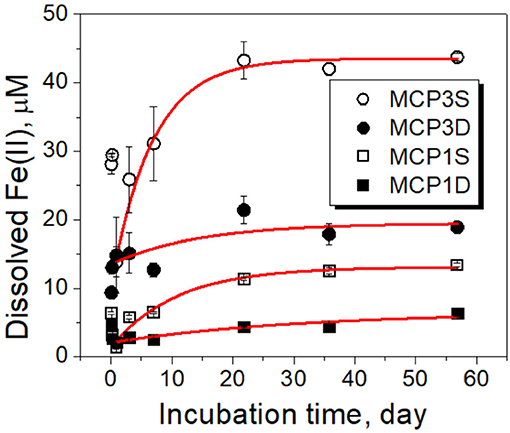
Figure 4. Dissolved Fe(II) concentrations over time during incubation experiments. Black symbols are the experimental data, and red lines are the fitted results with the first-order rate (Equation 4). The error bars represent one standard deviation from duplicate experiments.
Our observation shows that the release extent [i.e., equilibrium concentration (Ceq)] of dissolved Fe(II) varies with Fe-reducing conditions and positions (Table 4B). Specifically, MCP3 sediments released more dissolved Fe(II) than MCP1. This result is expected because MCP3 sediments were collected from the middle of the meander with greater Fe-reducing conditions, while MCP1 from near the river bank where relatively lower Fe-reducing conditions exist (Dwivedi et al., 2018). However, Figure 4 shows that the shallow sediments (30–45 cm) released more dissolved Fe(II) than the deep sediments (60–75 cm) which is contrary to our expectation that shallow sediments will have a lower Fe-reducing potential compared to that of the deep sediment. For example, MCP3S released the highest concentration of dissolved Fe(II), contrary to what we observe in Figure 3 where MCP3D contains the highest total Fe(II) production, indicating that higher total Fe(II) did not necessarily result in higher dissolved Fe(II). Although the release of dissolved Fe(II) is expected to be controlled by the equilibrium process, the release rates (k1) in Table 4B could be useful for predicting the kinetic release of dissolved Fe(II) when systems are under non-equilibrium conditions due to groundwater table changes during drought and wet seasons or other disturbances (Hubbard et al., 2018).
Mn(II) Release Kinetics
Because of the very low solubility of Mn(III/IV) oxides, dissolved Mn can be considered as Mn(II) species resulting from reductive dissolution of Mn(III/IV) oxides (Stone, 1987; Lovley, 1991; Gounot, 1994). Dissolved Mn increased slowly and linearly, and a steady state of concentration was not reached over the 57-day incubation period (Figure 5). The zero-order rate laws (Equations 1, 2) can be applied to describe the Mn release kinetics well (red lines in Figure 5). The fitted parameters are given in Table 4C. MCP3S released the highest Mn concentrations (14–30 μM) with a rate of 0.28 μM·day−1, whereas MCP3S released the highest dissolved Fe(II) as well (Figure 4). MCP1S and MCP1D both have the same release rate of 0.25 μM·day−1, but MCP1S releases more Mn (5.3–20 μM) than MCP1D (0.8–15 μM) due to its higher initial dissolved Mn concentration. The release rate is only 0.070 μM·day−1 for MCP3D with an initial concentration of 5.3 μM. The very slow release rate of Mn in strongly Fe-reducing MCP3D can be attributed to either available reducible Mn being limited or inhibited by strong reduction of Fe(III).
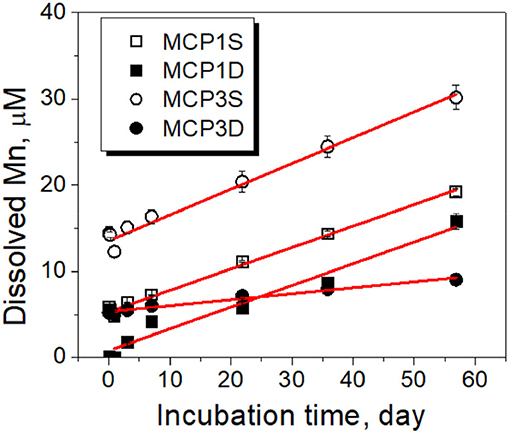
Figure 5. Kinetics of dissolved Mn over time during sediment incubation experiments. Black symbols are the experimental data, and red lines are the fitted results with the zero rate (Equation 2). The error bars represent one standard deviation from duplicate experiments.
DOC Release Kinetics and Decomposition
DOC concentrations increase rapidly and reach a relatively steady state within 24 h of incubation, with slight fluctuations during the first 3 weeks (Supplementary Figure 3). The data have been successfully fitted with a first-order rate (Equation 4) and the fitted parameters summarized in Table 4D. Equilibrium DOC concentrations range from 0.55 to 1.01 mM across samples. For all samples, the partial pressure of CO2 (pCO2) in headspace increased over the course of the 57-day incubation, with a concomitant decrease in δ13C for headspace CO2 and aqueous pH (Table 5), indicating that some sediment OC was mineralized. For example, pCO2 in the headspace MCP3S increased to 10−2.0 atm from an initial 10−3.4 atm, and aqueous pH decreased to 7.45 from an initial 8.2. The δ13C values of headspace CO2 range from −18.3 to −21.1‰. These values are higher than δ13C values from the soil organic C (−25 to −27‰) (Fox et al., 2020) and lower than those values from soil carbonate (−10 to 4‰) (Montanez, 2013), suggesting that a high proportion of the CO2 produced during the experiment comes from microbially decomposed sediment organic C.
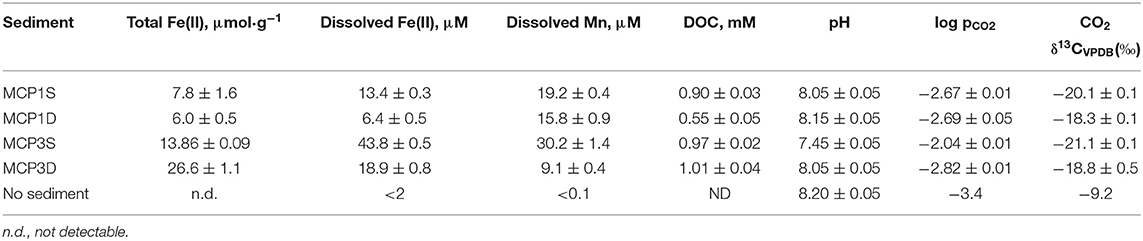
Table 5. Concentrations of total Fe(II), dissolved Fe(II), dissolved Mn and DOC, and pH, pCO2 and δ13C values of CO2 at incubation time = 57 day.
Discussion
Geochemical Reactions Controlling Fe(II) Release
Our experimental observation indicates that the majority of Fe(II) production exists as insoluble Fe(II) species since the total Fe(II) (Figure 3) is significantly higher than the dissolved Fe(II) (Figure 4), with the amount of dissolved Fe(II) only 0.5–3% of total Fe(II) after 57 days of incubation (Table 5). Furthermore, sediments with highest initial or accumulated total Fe(II) do not necessarily release more Fe(II) to groundwater. The fact that dissolved Fe(II) reaches a near-constant concentration after ~3 weeks (Figure 4), while total Fe(II) concentrations (Figure 3) continue to increase, suggests that over longer time periods, dissolved Fe(II) concentrations are controlled by an equilibrium process rather than through the continued reduction of Fe(III) to Fe(II).
Our LCF of bulk Fe EXAFS spectroscopy analysis (Figure 2 and Table 3) suggests that siderite and NOM are the primary phases of Fe(II) in sediments along with a significant contribution of Fe from Fe-containing clays. Other studies also reported siderite as the end product under alkaline condition (Coleman et al., 1993; Zachara et al., 1998), and Fe(II)-NOM complexes as the primary reduced phase in NOM-rich environment (Daugherty et al., 2017). Under the aqueous pH (7.5–8.2) and DOC concentrations (0.5–1.1 mM) in these experiments, we hypothesize the release of dissolved Fe(II) is primarily controlled by siderite solubility, which is enhanced by Fe(II) complexation with dissolved NOM. These processes can be described by the following reactions:
Where L− represents the reactive ligands or binding sites from dissolved NOM.
Siderite Solubility vs. Dissolved Fe(II) Without Dissolved NOM
In order to verify our hypotheses, we first calculated the solubility of siderite in absence of dissolved NOM [i.e., without considering the role of aqueous Fe(II) complexation with NOM] under our experimental conditions of pH and pCO2 (Table 5). The relevant thermodynamic reactions and constants are listed in Supplementary Table 2 and the experimental concentrations of coexisting ions are given in Supplementary Table 3. The results are compared with the concentrations of experimentally dissolved Fe(II) in Figure 6. The solubilities of pyrite (FeS2) and amorphous Fe(OH)2 are also presented in Figure 6. It is apparent that pyrite and amorphous Fe(OH)2 are not phase controlling minerals. The concentrations of dissolved Fe(II) are closely related to the predicted solubility of siderite, which increases with decrease of pH. However, the predicted Fe(II) concentrations underpredict the experimental Fe(II) concentrations in all cases, accounting for 31, 52, 32, and 30% for MCP1S, MCP1D, MCP3S, and MCP3D, respectively (Figure 7), indicating that the solubility of siderite alone cannot describe the release of dissolved Fe(II) without considering the effect of Fe(II)-NOM complexes.
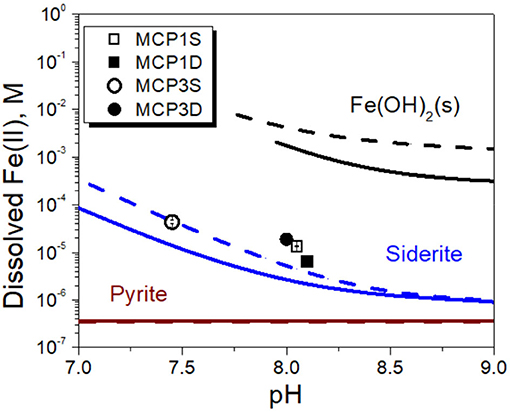
Figure 6. Dissolved Fe(II) concentrations (symbols) vs. solubilities of amorphous Fe(OH)2(s), siderite and pyrite in the absence of Fe(II)-NOM complex (solid lines calculated at pCO2 = 10−2.0 atm and dashed lines calculated at pCO2 = 10−2.7 atm).
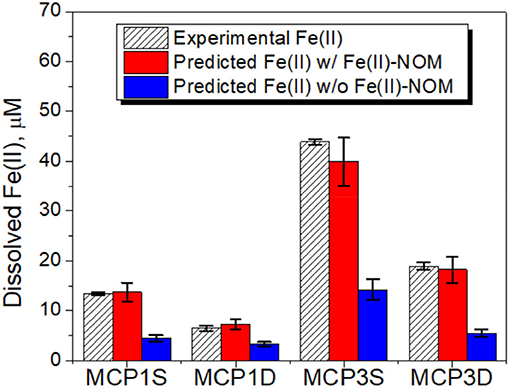
Figure 7. Dissolved Fe(II) concentrations vs. predicted siderite solubility with and without including Fe(II)-NOM complexes. The error bars represent one standard deviation from duplicate experiments.
Enhanced Solubility of Siderite by Dissolved NOM
In order to evaluate the impact of dissolved NOM on siderite solubility, we need to know (i) the concentrations of the reactive ligands (L) from dissolved NOM, and (ii) the binding constants (log K) for Fe(II) complexation with L. NOM can be grouped into humic substance (HS) and non-humic substances. Dissolved HS is operationally defined as humic acid (HA) and fulvic acid (FA) based on their solubility at pH = 2 (Schnitzer and Khan, 1972). HA and FA are the most reactive components of NOM which are responsible for complexing metals via their acidic carboxylic and phenolic groups (Schnitzer and Skinner, 1966; Tipping, 2002; Daugherty et al., 2017). The contribution of non-humic substances on metal complexation is negligible due to their weak binding strength. However, the fraction of HS in DOC ranges from 30 to 70% (Dilling and Kaiser, 2002; Spencer et al., 2012; Kida et al., 2018) with a mean value of ~50% in surface and subsurface waters (Suffet and MacCarthy, 1988; Herbert and Bertsch, 1995). By assuming ~50% of DOC in Table 5 is from HA and FA, we can calculate the concentrations of acidic functional groups as the reactive binding sites (L). According to the definition of the International Humic Substances Society (IHSS), the carboxylic content is the charge density (mmol/g C) at pH 8.0 and the phenolic content is the charge density (mmol/g C) between pH 8.0 and pH 10.0. Since our incubation experiment was conducted at pH ≤ 8.2, the carboxyls are considered as the major binding sites (Ritchie and Perdue, 2003; Rosario-Ortiz, 2014). Based on the nineteen HAs and FAs from IHSS, the carboxylic groups are estimated to have a mean value of 10.4 mmol/g C, with a mean value of the proton binding constant log K = 4.1 (Supplementary Table 4). Based on these assumptions, L concentrations from DOC can be estimated as
where [DOC] is the concentration of DOC in mol/L.
It is a challenge to select an appropriate log K value for Fe(II)-L complexes because the literature reported values are conditional constants, and vary over many orders of magnitude due to different experimental conditions and methodologies applied (Schnitzer and Skinner, 1966; Rose and Waite, 2003; Yamamoto et al., 2010; Fujisawa et al., 2011; Catrouillet et al., 2014). After a literature review, the log K-values for Fe(II)-L complexes from Rose and Waite (2003) are selected and corrected for the difference of experimental conditions. The original log K values vary from 6.6 to 10.2 (Supplementary Table 5) for Fe(II) with twelve extracted HAs and FAs. We modified their values by correcting the effects of the binding site density and ionic strength. The corrected log K values are given in Table 6. More details on log K corrections and a literature review are provided in Supplementary Material. In addition, log K values for coexisting metals of Mn(II), Ca(II), and Mg(II) with NOM are also selected from Mantoura et al. (1978) because of similar pH 8.0. The original log K-values given in Table 6 for Mn(II), Ca(II), and Mg(II) have also been converted into binding sites based values from their original molecular weight based values (Mantoura and Riley, 1975; Mantoura et al., 1978).
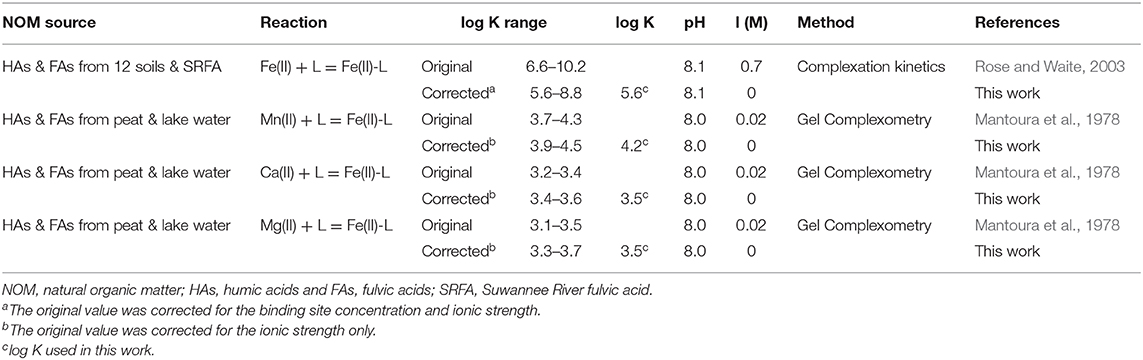
Table 6. Original and corrected binding constants (log K) for 1:1 complexes between metals(II) and the carboxylic acid groups (L) in NOM.
Given the corrected log K-values in the range of 5.6–8.8 for Fe(II)-L (Table 6), we first evaluated these values for simulating the solubility of siderite, while using the mean log K values of Mn(II)-L, Ca(II)-L, and Mg(II)-L and the concentrations of coexisting ions provided in Supplementary Table 3 and the relevant thermodynamic reactions and constants listed in Supplementary Table 2. We found log K = 5.6 for Fe(II)-L best describes the equilibrium concentrations of dissolved Fe(II) (Figure 7) for all samples, with an overall average 100% (± 5%) agreement. The log K = 5.6 is also in agreement with those reported by Fujisawa et al. (2011) (log K = 5.3–5.6 at pH 3.6). These results clearly demonstrate that dissolved NOM can significantly enhance the solubility of siderite by forming strong Fe(II)-NOM complex, and affected by pH as well as pCO2.
Influence of NOM on Dissolved Fe(II) Species
Predicted distribution of dissolved Fe(II) species indicate that Fe(II)-NOM complex is the major Fe(II) species in all samples and comprised of 54–70% of total dissolved Fe(II) species (Figure 8). The remaining inorganic species (30–46%) are mostly composed of free Fe2+ (20–25%), FeCO3(aq) (2.5–14%) and (5–10%) along with a minor percentage of FeSO4 (~1%). More detailed prediction of siderite solubility and Fe(II) species at a pH range of 7.5–9.0 is provided in Supplementary Figure 4.
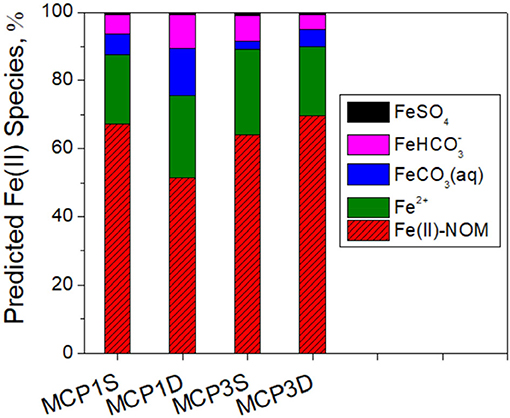
Figure 8. Predicted distribution (%) of dissolved Fe(II) species including Fe(II)-NOM complexes.
Geochemical Controls on Mn(II) Release
Similar to Fe(II), the potential phase controlling Mn(II) release could be rhodochrosite (MnCO3) at alkaline conditions (Jensen et al., 2002). We calculated the solubility of rhodochrosite in the same manner as for siderite, i.e., with and without including Mn(II)-NOM complex, and compared with the dissolved Mn(II) concentrations at 57-days (Figure 9). The results show that all samples are oversaturated regarding the solubility of rhodochrosite for the Mn(II) concentrations after 3 weeks of incubation. The dissolution and precipitation of rhodochrosite (MnCO3) are reported to be very slow processes, and precipitation may not occur within 57 days even when oversaturated (Pingitore et al., 1988; Jensen et al., 2002), indicating that other mechanisms or processes controlled Mn(II) release. We hypothesize that the dissolved Mn(II) occurs either via continuous microbial reduction of Mn(III/IV) oxides (Stone, 1987; Lovley, 1991; Gounot, 1994; Lloyd, 2003) or through the co-release of adsorbed or co-precipitated Mn(II) during dissolution of other minerals (e.g., Fe-oxides; Pingitore et al., 1988; Gounot, 1994). Reduction of Mn(IV) oxides by Fe(II) could be another potential mechanism for Mn(II) release (Siebecker et al., 2015), which shows how intricately linked the Fe/Mn redox cycles can be in these hyporheic zones.
Figure 9. Dissolved Mn(II) concentrations vs. predicted rhodochrosite solubility with and without including Mn(II)-NOM complex. The error bars represent one standard deviation from duplicate experiments.
Unlike Fe(II)-NOM, predicted Mn(II)-NOM is a minor species (3–7%) due to the weaker binding strength between Mn(II) and NOM (Table 6). Dissolved Mn(II) speciation is dominated by inorganic species of free Mn2+ (34–58%), MnCO3(aq) (17–52%), (10–16%), and MnSO4 (1–2%). Therefore, unlike for Fe(II), dissolved NOM has little influence on Mn(II) species distribution and solubility.
Conclusions
Prediction of the release and speciation of Fe and Mn are crucially important in hyporheic zones for understanding their impact on nutrient cycling and water quality in East River watershed. To our knowledge, this work is the first study which reports siderite and dissolved NOM as the controlling phases for Fe(II) release from hyporheic sediments of the upper Colorado River basin.
Our results reveal that the release rates, extent and speciation of dissolved Fe(II) and Mn(II) are highly dependent on the site-specific geochemical conditions. While precipitation and dissolution of siderite and NOM are predicted to be the controlling processes for Fe(II) release under neutral and alkaline environments, the role of Fe(II)-NOM aqueous complexes are not well evaluated and rarely included in reactive geochemical transport models due to the lack of reliable and applicable Fe(II)-NOM complexation constants in literature. In this work, we calibrated the log K values of 1:1 Fe(II)-NOM complexes from Rose and Waite (2003). The calibrated log K values successfully predicted our experimental data, and expected to be applicable for geochemical modeling in many East River hyporheic zones and other subsurface aquifers with similar geochemical conditions. However, further study on NOM complexation with Fe(II) and other co-existing metals is truly needed to improve our current understanding on the binding models and strength under in-situ environmental conditions due to the challenges and uncertainties associated with characterization of NOM composition and their reactive binding sites as well as methodologies for determining metal-NOM complexation.
Data Availability Statement
All datasets generated for this study are included in the article/Supplementary Material, and the kinetics datasets are publicly available through the East River Watershed. CO, USA: Watershed Function SFA (Dong et al., 2020).
Author Contributions
PN conceptualized the project and designed the research. WD conducted the incubation experiments, geochemical modeling, and prepared the original draft. AB conducted EXAFS measurements and LCF analysis. PF conducted samples preparation and characterization. DD conducted field sampling and mapping. SC conducted XRD analysis. MB and MC conducted the CO2 δ13CVPDB(‰) and pCO2 analysis. All authors participated in the review, editing, and revision of the manuscript.
Funding
This work was supported as part of the Watershed Function Scientific Focus Area program at Lawrence Berkeley National Laboratory, supported by the U.S. Department of Energy, Office of Science, Office of Biological and Environmental Research, Subsurface Biogeochemical Research Program, through Contract No. DE-AC02-05CH11231 between Lawrence Berkeley National Laboratory and the U.S. Department of Energy. Synchrotron work was performed at beamline 4-3 of the Stanford Synchrotron Radiation Lightsource, SLAC National Accelerator Laboratory which is supported by the U.S. Department of Energy, Office of Basic Energy Sciences under Contract No. DE-AC02-76SF00515.
Conflict of Interest
The authors declare that the research was conducted in the absence of any commercial or financial relationships that could be construed as a potential conflict of interest.
Acknowledgments
We thank Harry Beller and Patrick Sorensen at Lawrence Berkeley National Lab for providing experimental suggestions and assistance.
Supplementary Material
The Supplementary Material for this article can be found online at: https://www.frontiersin.org/articles/10.3389/frwa.2020.562298/full#supplementary-material
References
Boano, F., Harvey, J. W., Marion, A., Packman, A. I., Revelli, R., Ridolfi, L., et al. (2014). Hyporheic flow and transport processes: mechanisms, models, and biogeochemical implications. Rev. Geophys. 52, 603–679. doi: 10.1002/2012RG000417
Boulton, A. J., Findlay, S., Marmonier, P., Stanley, E. H., and Valett, H. M. (1998). The functional significance of the hyporheic zone in streams and rivers. Ann. Rev. Ecol. Syst. 29, 59–81. doi: 10.1146/annurev.ecolsys.29.1.59
Bryant, S. R., Sawyer, A. H., Briggs, M. A., Saup, C. M., Nelson, A. R., Wilkins, M. J., et al. (2020). Seasonal manganese transport in the hyporheic zone of a snowmelt-dominated river (East River, Colorado, USA). Hydrogeol. J. 28, 1323–1341. doi: 10.1007/s10040-020-02146-6
Catrouillet, C., Davranche, M., Dia, A., Bouhnik-Le Coz, M., Marsac, R., Pourret, O., et al. (2014). Geochemical modeling of Fe(II) binding to humic and fulvic acids. Chem. Geol. 372, 109–118. doi: 10.1016/j.chemgeo.2014.02.019
Coleman, M. L., Hedrick, D. B., Lovley, D. R., White, D. C., and Pye, K. (1993). Reduction of Fe(III) in sediments by sulfate-reducing bacteria. Nature 361, 436–438. doi: 10.1038/361436a0
Cooper, D. C., Picardal, F. F., and Coby, A. J. (2006). Interactions between microbial iron reduction and metal geochemistry: effect of redox cycling on transition metal speciation in iron bearing sediments. Environ. Sci. Technol. 40, 1884–1891. doi: 10.1021/es051778t
Daugherty, E. E., Gilbert, B., Nico, P. S., and Borch, T. (2017). Complexation and redox buffering of iron(II) by dissolved organic matter. Environ. Sci. Technol. 51, 11096–11104. doi: 10.1021/acs.est.7b03152
Dilling, J., and Kaiser, K. (2002). Estimation of the hydrophobic fraction of dissolved organic matter in water samples using UV photometry. Water Res. 36, 5037–5044. doi: 10.1016/S0043-1354(02)00365-2
Dong, W., Fox, P. M., Bhattacharyya, A., Bill, M., and Nico, P. S. (2020). Kinetics Data of Iron(II), Manganese(II), Dissolved Organic Carbon and Nitrate from Batch Incubation Experiments Using Hyporheic Sediments from the East River Watershed, Colorado. Watershed Function SFA.
Dong, W., Liang, L., Brooks, S., Southworth, G., and Gu, B. (2010). Roles of dissolved organic matter in the speciation of mercury and methylmercury in a contaminated ecosystem in Oak Ridge, Tennessee. Environ. Chem. 7, 94–102. doi: 10.1071/EN09091
Dwivedi, D., Steefel, C. I., Arora, B., Newcomer, M., Moulton, J. D., Dafflon, B., et al. (2018). Geochemical exports to river from the intrameander hyporheic zone under transient hydrologic conditions: East River mountainous watershed, Colorado. Water Res. Res. 54, 8456–8477. doi: 10.1029/2018WR023377
Fox, P. M., Bill, M., Heckman, K., Conrad, M., Anderson, C., Keiluweit, M., et al. (2019). Geochemical Characterization of Floodplain Sediments from Meander C and O in the East River Watershed, CO, USA. Watershed Function SFA.
Fox, P. M., Bill, M., Heckman, K., Conrad, M., Anderson, C., Keiluweit, M., et al. (2020). Shale as a source of organic carbon in floodplain sediments of a mountainous watershed. J. Geophy. Res. Biogeosci. 125:e2019JG005419. doi: 10.1029/2019JG005419
Froelich, P. N., Klinkhammer, G. P., Bender, M. L., Luedtke, N. A., Heath, G. R., Cullen, D., et al. (1979). Early oxidation of organic-matter in pelagic sediments of the eastern equatorial Atlantic - suboxic diagenesis. Geochim. Cosmochim. Acta 43, 1075–1090. doi: 10.1016/0016-7037(79)90095-4
Fujisawa, N., Furubayashi, K., Fukushima, M., Yamamoto, M., Komai, T., Ootsuka, K., et al. (2011). Evaluation of the iron(II)-binding abilities of humic acids by complexometric titration using colorimetry with ortho-phenanthroline. Humic Subst. Res. 8, 1–6.
Gomez, J. D., Wilson, J. L., and Cardenas, M. B. (2012). Residence time distributions in sinuosity-driven hyporheic zones and their biogeochemical effects. Water Resourc. Res. 48:W09533. doi: 10.1029/2012WR012180
Gounot, A. M. (1994). Microbial oxidation and reduction of manganese - consequences in groundwater and applications. FEMS Microbiol. Rev. 14, 339–349. doi: 10.1111/j.1574-6976.1994.tb00108.x
Herbert, B. E., and Bertsch, P. M., (eds.). (1995). Characterization of Dissolved and Colloidal Organic Matter in Soil Solution: A Review. Madison, WI: SSSA, 63–68.
Hubbard, S. S., Williams, K. H., Agarwal, D., Banfield, J., Beller, H., Bouskill, N., et al. (2018). The East River, Colorado, watershed: a mountainous community testbed for improving predictive understanding of multiscale hydrological-biogeochemical dynamics. Vadose Zone J. 17, 1–25. doi: 10.2136/vzj2018.03.0061
Hyun, J. H., Kim, S. H., Mok, J. S., Cho, H., Lee, T., Vandieken, V., et al. (2017). Manganese and iron reduction dominate organic carbon oxidation in surface sediments of the deep Ulleung Basin, East Sea. Biogeosciences 14, 941–958. doi: 10.5194/bg-14-941-2017
Jensen, D. L., Boddum, J. K., Tjell, J. C., and Christensen, T. H. (2002). The solubility of rhodochrosite (MnCO3) and siderite (FeCO3) in anaerobic aquatic environments. Appl. Geochem. 17, 503–511. doi: 10.1016/S0883-2927(01)00118-4
Kenwell, A., Navarre-Sitchler, A., Prugue, R., Spear, J. R., Hering, A. S., Maxwell, R. M., et al. (2016). Using geochemical indicators to distinguish high biogeochemical activity in floodplain soils and sediments. Sci. Total Environ. 563, 386–395. doi: 10.1016/j.scitotenv.2016.04.014
Kida, M., Fujitake, N., Suchewaboripont, V., Poungparn, S., Tomotsune, M., Kondo, M., et al. (2018). Contribution of humic substances to dissolved organic matter optical properties and iron mobilization. Aquatic Sci. 80:26. doi: 10.1007/s00027-018-0578-z
Lloyd, J. R. (2003). Microbial reduction of metals and radionuclides. FEMS Microbiol. Rev. 27, 411–425. doi: 10.1016/S0168-6445(03)00044-5
Lovley, D. R. (1991). Dissimilatory Fe(III) and Mn(IV) reduction. Microbiol. Rev. 55, 259–287. doi: 10.1128/MMBR.55.2.259-287.1991
Lovley, D. R. (1997). Microbial Fe(III) reduction in subsurface environments. FEMS Microbiol. Rev. 20, 305–313. doi: 10.1111/j.1574-6976.1997.tb00316.x
Lovley, D. R., and Blunt-Harris, E. L. (1999). Role of humic-bound iron as an electron transfer agent in dissimilatory Fe(III) reduction. Appl. Environ. Microbiol. 65, 4252–4254. doi: 10.1128/AEM.65.9.4252-4254.1999
Lovley, D. R., Fraga, J. L., Blunt-Harris, E. L., Hayes, L. A., Phillips, E. J. P., and Coates, J. D. (1998). Humic substances as a mediator for microbially catalyzed metal reduction. Acta Hydrochim. Hydrobiol. 26, 152–157. doi: 10.1002/(SICI)1521-401X(199805)26:3<152::AID-AHEH152>3.0.CO;2-D
Luu, Y. S., and Ramsay, J. A. (2003). Review: microbial mechanisms of accessing insoluble Fe(III) as an energy source. World J. Microbiol. Biotechnol. 19, 215–225. doi: 10.1023/A:1023225521311
Mantoura, R. F. C., Dickson, A., and Riley, J. P. (1978). The complexation of metals with humic materials in natural waters. Estuarine Coast. Mar. Sci. 6, 387–408. doi: 10.1016/0302-3524(78)90130-5
Mantoura, R. F. C., and Riley, J. P. (1975). The use of gel-filtration in study of metal binding by humic acids and related compounds. Anal. Chim. Acta 78, 193–200. doi: 10.1016/S0003-2670(01)84765-6
Montanez, I. P. (2013). Modern soil system constraints on reconstructing deep-time atmospheric CO2. Geochim. Cosmochim. Acta 101, 57–75. doi: 10.1016/j.gca.2012.10.012
Morrison, S. J., Goodknight, C. S., Tigar, A. D., Bush, R. P., and Gil, A. (2012). Naturally occurring contamination in the Mancos Shale. Environ. Sci. Technol. 46, 1379–1387. doi: 10.1021/es203211z
Park, J. H., Kim, S. J., Ahn, J. S., Lim, D. H., and Han, Y. S. (2018). Mobility of multiple heavy metalloids in contaminated soil under various redox conditions: effects of iron sulfide presence and phosphate competition. Chemosphere 197, 344–352. doi: 10.1016/j.chemosphere.2018.01.065
Parkhurst, D. L., and Appelo, C. J. (2004). User's Guide to PHREEQC (Version 2) – A Computer Program for Speciation, Batch-Reaction, One-Dimensional Transport, and Inverse Geochemical Calculations, 2 Edn. Denver, CO: US Geological Survey.
Pedersen, H. D., Postma, D., and Jakobsen, R. (2006). Release of arsenic associated with the reduction and transformation of iron oxides. Geochim. Cosmochim. Acta 70, 4116–4129. doi: 10.1016/j.gca.2006.06.1370
Pingitore, N. E., Eastman, M. P., Sandidge, M., Oden, K., and Freiha, B. (1988). The coprecipitation of manganese(II) with calcite - an experimental-study. Mar. Chem. 25, 107–120. doi: 10.1016/0304-4203(88)90059-X
Putz, H., and Brandenburg Gbr, K. (2011). “Match! - Phase Identification from Powder Diffraction, Crystal Impact”. Bonn.
Ravel, B., and Newville, M. (2005). ATHENA, ARTEMIS, HEPHAESTUS: data analysis for X-ray absorption spectroscopy using IFEFFIT. J. Synchrotron Radiat. 12, 537–541. doi: 10.1107/S0909049505012719
Ritchie, J. D., and Perdue, E. M. (2003). Proton-binding study of standard and reference fulvic acids, humic acids, and natural organic matter. Geochim. Cosmochim. Acta 67, 85–96. doi: 10.1016/S0016-7037(02)01044-X
Rosario-Ortiz, F., (ed.). (2014). Advances in the Physicochemical Characterization of Dissolved Organic Matter: Impact on Natural and Engineered Systems. Boulder, CO: American Chemical Society; University of Colorado. doi: 10.1021/bk-2014-1160
Rose, A. L., and Waite, T. D. (2003). Kinetics of iron complexation by dissolved natural organic matter in coastal waters. Mar. Chem. 84, 85–103. doi: 10.1016/S0304-4203(03)00113-0
Rowland, H., Pederick, R. L., Polya, D. A., Pancost, R. D., Van Dongen, B. E., et al. (2007). The control of organic matter on microbially mediated iron reduction and arsenic release in shallow alluvial aquifers, Cambodia. Geobiology 5, 281–292. doi: 10.1111/j.1472-4669.2007.00100.x
Saup, C. M., Bryant, S. R., Nelson, A. R., Harris, K. D., Sawyer, A. H., Christensen, J. N., et al. (2019). Hyporheic zone microbiome assembly is linked to dynamic water mixing patterns in snowmelt-dominated headwater catchments. J. Geophys. Res. Biogeosci. 124, 3269–3280. doi: 10.1029/2019JG005189
Schnitzer, M., and Khan, S. U. (1972). Humic Substances in Environment. New York, NY: Marcel Dekker.
Schnitzer, M., and Skinner, S. I. M. (1966). Organo-metallic interactions in soils: 5. stability constants of Cu2+, Fe2+ and Zn++ fulvic acid complexes. Soil Sci. 102:361. doi: 10.1097/00010694-196612000-00002
Siebecker, M., Madison, A. S., and Luther, G. W. (2015). Reduction kinetics of polymeric (soluble) manganese(IV) oxide (MnO2) by ferrous iron (Fe2+). Aquatic Geochem. 21, 143–158. doi: 10.1007/s10498-015-9257-z
Sparks, D. L., (ed.). (1996). Mehtods of Soil Analysis. Part3. Chemical Methods-SSSA Book Series: 5. Madison, WI: Soil Science Society of America and American Society of Agronom. doi: 10.2136/sssabookser5.3
Spencer, R. G. M., Butler, K. D., and Aiken, G. R. (2012). Dissolved organic carbon and chromophoric dissolved organic matter properties of rivers in the USA. J. Geophys. Res. Biogeosci. 117:G03001. doi: 10.1029/2011JG001928
Stone, A. T. (1987). Microbial metabolites and the reductive dissolution of manganese oxides - oxalate and pyruvate. Geochim. Cosmochim. Acta 51, 919–925. doi: 10.1016/0016-7037(87)90105-0
Stookey, L. L. (1970). Ferrozine - a new spectrophotometric reagent for iron. Anal. Chem. 42, 779–781. doi: 10.1021/ac60289a016
Suffet, I. H., and MacCarthy, P., (eds.). (1988). Aquatic Humic Substances. Washington DC: American Chemical Society.
Wan, J., Tokunaga, T. K., Williams, K. H., Dong, W., Brown, W., Henderson, A. N., et al. (2019). Predicting sedimentary bedrock subsurface weathering fronts and weathering rates. Sci. Rep. 9:17198. doi: 10.1038/s41598-019-53205-2
Webb, S. M. (2005). SIXpack: a graphical user interface for XAS analysis using IFEFFIT. Phys. Scripta T115, 1011–1014. doi: 10.1238/Physica.Topical.115a01011
Winnick, M. J., Carroll, R. W. H., Williams, K. H., Maxwell, R. M., Dong, W., and Maher, K. (2017). Snowmelt controls on concentration-discharge relationships and the balance of oxidative and acid-base weathering fluxes in an alpine catchment, East River, Colorado. Water Res. Res. 53, 2507–2523. doi: 10.1002/2016WR019724
Yamamoto, M., Nishida, A., Otsuka, K., Komai, T., and Fukushima, M. (2010). Evaluation of the binding of iron(II) to humic substances derived from a compost sample by a colorimetric method using ferrozine. Bioresour. Technol. 101, 4456–4460. doi: 10.1016/j.biortech.2010.01.050
Keywords: hyporheic zone, dissolved Fe(II), dissolved Mn(II), siderite, natural organic matter (NOM), complexation, extended X-ray absorption fine structure (EXAFS) spectroscopy
Citation: Dong W, Bhattacharyya A, Fox PM, Bill M, Dwivedi D, Carrero S, Conrad M and Nico PS (2020) Geochemical Controls on Release and Speciation of Fe(II) and Mn(II) From Hyporheic Sediments of East River, Colorado. Front. Water 2:562298. doi: 10.3389/frwa.2020.562298
Received: 15 May 2020; Accepted: 21 October 2020;
Published: 25 November 2020.
Edited by:
Alexis Navarre-Sitchler, Colorado School of Mines, United StatesReviewed by:
Ruben Kretzschmar, ETH Zürich, SwitzerlandJohn Bargar, Stanford University, United States
Copyright © 2020 Dong, Bhattacharyya, Fox, Bill, Dwivedi, Carrero, Conrad and Nico. This is an open-access article distributed under the terms of the Creative Commons Attribution License (CC BY). The use, distribution or reproduction in other forums is permitted, provided the original author(s) and the copyright owner(s) are credited and that the original publication in this journal is cited, in accordance with accepted academic practice. No use, distribution or reproduction is permitted which does not comply with these terms.
*Correspondence: Wenming Dong, d2VubWluZ2RvbmdAbGJsLmdvdg==; Peter S. Nico, cHNuaWNvQGxibC5nb3Y=