 Jannis Jakobi1*
 Johan A. Huisman1
 Martin Schrön2
 Justus Fiedler1
 Cosimo Brogi1
 Harry Vereecken1
 Heye R. Bogena1
- 1Agrosphere Institute (IBG-3), Forschungszentrum Jülich GmbH, Jülich, Germany
- 2Department of Monitoring and Exploration Technologies, Helmholtz-Zentrum für Umweltforschung GmbH-UFZ, Leipzig, Germany
Cosmic ray neutron (CRN) sensing allows for non-invasive soil moisture measurements at the field scale and relies on the inverse correlation between aboveground measured epithermal neutron intensity (1 eV−100 keV) and environmental water content. The measurement uncertainty follows Poisson statistics and thus increases with decreasing neutron intensity, which corresponds to increasing soil moisture. In order to reduce measurement uncertainty, the neutron count rate is usually aggregated over 12 or 24 h time windows for stationary CRN probes. To obtain accurate soil moisture estimates with mobile CRN rover applications, the aggregation of neutron measurements is also necessary and should consider soil wetness and driving speed. To date, the optimization of spatial aggregation of mobile CRN observations in order to balance measurement accuracy and spatial resolution of soil moisture patterns has not been investigated in detail. In this work, we present and apply an easy-to-use method based on Gaussian error propagation theory for uncertainty quantification of soil moisture measurements obtained with CRN sensing. We used a 3rd order Taylor expansion for estimating the soil moisture uncertainty from uncertainty in neutron counts and compared the results to a Monte Carlo approach with excellent agreement. Furthermore, we applied our method with selected aggregation times to investigate how CRN rover survey design affects soil moisture estimation uncertainty. We anticipate that the new approach can be used to improve the strategic planning and evaluation of CRN rover surveys based on uncertainty requirements.
Introduction
Soil moisture is an essential variable of the terrestrial system as it governs the transfer of both water and energy between the land surface and the atmosphere (Vereecken et al., 2015). Accurate information on soil moisture dynamics is vital for a better understanding of processes in the vadose zone, because it controls major subsurface processes, such as ground water recharge, runoff, and infiltration. Furthermore, soil moisture dynamics are important for the optimization of agricultural management because they determine crop growth, leaching processes, and the fate of fertilizers applied to soils. Soil moisture is highly variable in both space and time, with typical length and time scales ranging from a few centimeters to several kilometers and from minutes to years, respectively (Robinson et al., 2008; Vereecken et al., 2008).
Recent advances in non-invasive monitoring techniques enable continuous and contactless measurements of soil moisture dynamics at the field scale (Bogena et al., 2015). Among other methods, the cosmic ray neutron sensing (CRNS) method has become increasingly popular for soil moisture estimation since its introduction by Zreda et al. (2008). The CRNS method relies on the inverse relationship between soil moisture and the amount of aboveground epithermal neutrons (energy range from ~0.2 eV to 100 keV) (Köhli et al., 2018). The measurement footprint ranges from 130 to 240 m radius around the neutron detector with a penetration depth ranging between 15 and 80 cm depending on soil moisture and other parameters (Köhli et al., 2015). Typically, stationary CRNS probes are used to obtain continuous information on field scale soil moisture dynamics (Zreda et al., 2012; Andreasen et al., 2017; Schrön et al., 2018a). More recently, mobile applications of CRNS probes (i.e., CRN roving) have been introduced, which enable to measure spatial soil moisture variability at the larger catchment scale (Chrisman and Zreda, 2013; Dong et al., 2014; Franz et al., 2015; Avery et al., 2016; McJannet et al., 2017; Schrön et al., 2018b).
Measurement uncertainty is an important quantity that should accompany every geophysical data set. The systematic uncertainty has been analyzed by Baroni et al. (2018), who quantified the influence of environmental factors, such as vegetation or soil properties, on the CRNS product. The present study investigates the statistical uncertainty of CRNS soil moisture estimates, which depends on the detector configuration, i.e., the number of counts in a given period of time. This count rate, however, is inversely related to soil moisture, such that dryer soil leads to more precise measurements (cf. Desilets et al., 2010; Bogena et al., 2013). In CRN rover applications, this translates to the number of detected neutrons in a specific spatial unit that is passed during the record period of the detector. Hence, the traveling speed determines the spatial resolution and is an important factor for the quantification of measurement uncertainty.
Various neutron detectors exist of different size and efficiency. Typically, a larger detector volume improves the counting statistics, and thus reduces the uncertainty of the soil moisture product. The record period of most mobile neutron detectors is between 10 s and 1 min, while typical driving speeds range from 2 to 10 km/h on agricultural fields (Schrön et al., 2018b; Fentanes et al., 2019) to ~50 km/h for large-scale surveys (e.g., Chrisman and Zreda, 2013; Dong et al., 2014; McJannet et al., 2017; Dong and Ochsner, 2018). In most studies, additional spatial smoothing was applied to the CRN rover measurements by using a temporal moving window filter in order to reduce the uncertainty in the soil moisture estimates (e.g., Schrön et al., 2018b: window size of 3 measurements; Chrisman and Zreda, 2013: window size of 7 measurements). However, long record periods as well as large averaging window sizes lead to elongated measurement footprints in the direction of data acquisition and thus to a decrease in spatial resolution (Chrisman and Zreda, 2013; Fersch et al., 2018; Schrön et al., 2018b). For instance, aggregated neutron counts for 1, 3, 5, and 7 min time periods acquired with an average driving speed of 50 km/h correspond to elongated footprints where the longer axis is 0.8, 2.5, 4.2, and 5.8 km long, respectively. More advanced approaches for data aggregation have also been proposed. Some studies assigned the average of all raw neutron measurements within a fixed radius to a grid (e.g. Dong and Ochsner, 2018; Gibson and Franz, 2018; Finkenbiner et al., 2019). In a further processing step, inverse distance weighting was used to further sharpen the image and to increase resolution (Gibson and Franz, 2018; Finkenbiner et al., 2019).
Bogena et al. (2013) and Schrön et al. (2018a) have already analyzed the dependence of the accuracy of CRN-based soil moisture measurements on the time integration for a stationary CRNS probe. In principle, this method can also be applied to mobile CRN rovers by taking spatial aggregation into account. Nevertheless, the effects of the spatial aggregation of neutron counts on the soil moisture measurement accuracy have not yet been investigated in detail. A comprehensive method to determine uncertainty in soil moisture from uncertainty in neutron counts would allow for the discrimination of statistical effects from the effects of environmental water. In earlier CRN rover studies, such undetermined features could not be assessed in full detail (e.g., Dong et al., 2014; Franz et al., 2015; Dong and Ochsner, 2018; Schrön et al., 2018b).
In this study, we aim to analyze how temporal and spatial aggregation of neutron counts affects the accuracy of soil moisture measurements with CRNS technology with a focus on mobile CRN roving. To this end, analytical expressions for error propagation are introduced that allow to assess the accuracy of soil moisture estimates from uncertain neutron count rates. The appropriateness of the analytical expressions is evaluated using Monte Carlo simulations. The applicability of the analytical expressions is tested using experimental data from three different CRN rover campaigns with different spatial scales in Germany and in Oklahoma (USA).
Materials and Methods
Jülich CRN Rover
The Jülich CRN rover consists of an array of nine neutron detector units (Hydroinnova LLC, Albuquerque, NM, USA) each holding four 10BF3-filled tubes, which amounts to a total number of 36 neutron detector tubes located in 9 detector housings. The housing of the detector tubes was designed such that the moderating High Density Polyethylene (HDPE) can be removed on demand. This allows to convert the neutron detector tubes from epithermal (with HDPE) to thermal neutron sensitive (without HDPE) and back. During the presented measurement campaigns, the Jülich CRN rover was configured to measure epithermal neutrons with five detector units. Three of these units were mounted in vertical orientation, while the other two units were oriented horizontally (Figure 1). The remaining four detector units measured thermal neutrons during the experiments to calculate the thermal-to-epithermal neutron ratio (Nr). The Nr ratio has already been successfully used in previous studies to estimate surface biomass and to correct the influence of surface biomass on soil moisture from cosmic ray neutrons (Tian et al., 2016; Jakobi et al., 2018). The driving speed during the presented measurement campaigns with the Jülich CRN rover was 4–5 km/h, and the time interval of the raw neutron count measurements was 10 s.
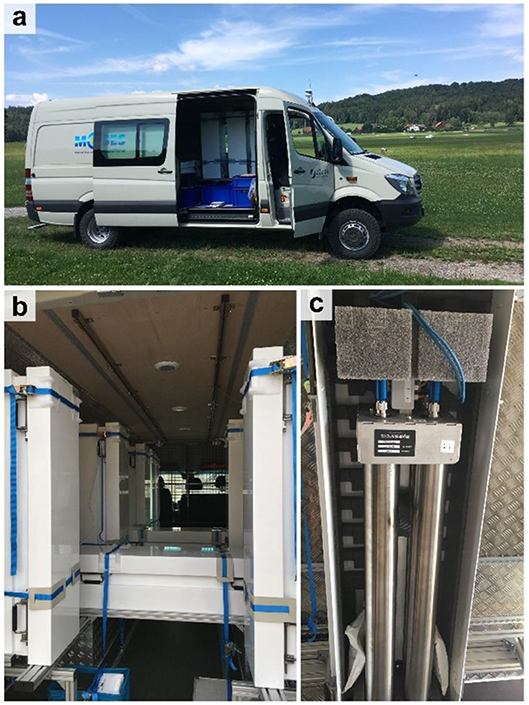
Figure 1. Jülich Cosmic rover in the field at the TERENO research site Fendt (a). Setup of the nine detector units inside the car (b). Example of one detector unit consisting of four detector tubes—here shown without the moderating HDPE (c).
Experimental Sites
Fendt Site (Germany, Experiment A)
The long-term research site Fendt (47°50'N, 11°3.6'E) belongs to the Pre-Alpine observatory (Wolf et al., 2016; Kiese et al., 2018) of the TERENO (TERrestrial ENvironmental Observatories) network (Zacharias et al., 2011; Bogena et al., 2012). The Fendt site is located at the south-eastern tip of the Rott catchment (55 km2) at about 595 m a.s.l. The soils are dominated by Cambrian stagnosols and land use consists mainly of pasture and forest. The Fendt site has a temperate marine climate with an average annual rainfall of 1,033 mm and temperature of 8.6°C (Fu et al., 2017). For more detailed information on site characteristics, we refer to Kiese et al. (2018).
The CRN rover measurements on the Fendt research site were carried out as part of a joint field campaign of the CosmicSense project (for more information please visit the project webpage: https://www.uni-potsdam.de/en/cosmicsense.html). We drove back and forth along a ~350 m long grass road for 4 h at the lowest possible speed of 4–5 km/h on 14 April 2019. For reference, shallow soil moisture (0–7 cm depth) was measured at 155 locations a few meters off the road using HydraProbe soil moisture sensors (Hydra Go Field Version, Stevens Water Monitoring Systems, Inc., Portland, USA). The measurement transect was bordered by a road in the west and a small stream in the east.
Selhausen Site (Germany, Experiment B)
The research site Selhausen (50°52'N, 6°27'E) covers an area of ~1 × 1 km and is part of the Lower Rhine Valley/Eifel Observatory of the TERENO network (Bogena et al., 2018). The Selhausen site is located in the eastern part of the Rur catchment (2,354 km2) and is characterized by an eastern upper terrace composed of Pleistocene sand and gravel sediments that are buried in loess sediments and by a western lower terrace that is generally dominated by Pleistocene/Holocene loess sediments (Weihermüller et al., 2007). The soils in the area consist of Cambisols, Luvisols, Planosols, and Stagnosols (Rudolph et al., 2015). Generally, all fields within the study area are used for agriculture. The crops that are most commonly grown are winter cereals, sugar beet and silage maize (Reichenau et al., 2016). The site has a temperate maritime climate with a mean annual precipitation and temperature of 714 mm and 10.2°C, respectively (Korres et al., 2015). Detailed information on the Selhausen research site can be found in Bogena et al. (2018) and Brogi et al. (2020).
The CRN rover measurements at the Selhausen site were collected as part of a MOSES (Modular Observation Solutions for Earth Systems) test campaign. MOSES is an infrastructure program funded by the Helmholtz Association (https://www.ufz.de/moses/). The campaign was carried out on 11 July 2018 and we mostly drove on the roads in the research area. Whenever it was possible, we also drove on the agricultural fields. Some of the fields in the northwest and southeast of the area were irrigated during the CRN rover measurements. Reference soil moisture measurements were again made with HydraProbe sensors as in the Fendt experiment at 738 locations distributed over a large fraction of the experimental area with a focus on sites where earlier studies were based (e.g., Rudolph et al., 2015; Jakobi et al., 2018; Brogi et al., 2019). This was done to limit the amount of work associated with taking reference measurements (4 people were measuring for ~4 h).
For this site, the bulk density of the fine fraction (ϱbd<2) was estimated to be 1.32 g/cm3 from literature values (Ehlers et al., 1983; Unger and Jones, 1998) and from previous sampling campaigns conducted within the study area. These values were modified using gravel content as successfully done by Brogi et al. (2020) for the simulation of crop growth in this study area. For this, a high-resolution soil map produced from a combination of electromagnetic induction measurements and direct soil sampling (Brogi et al., 2019) was used to retrieve spatially distributed gravel content. This map divides the study area in 18 soil units, each provided with information on gravel content for each horizon. To obtain bulk density (ϱbd) values considering gravel content, the method proposed by Brakensiek and Rawls (1994) was used:
where ϱbd>2 is the bulk density of rock fragments (2.65 g/cm3, Brakensiek and Rawls, 1994) and Z2 [g/cm3] is the volume of rock fragments (Flint and Childs, 1984), which was approximated according to Brakensiek and Rawls (1994) with:
where Z1 is the gravel content in % of weight relative to the total weight of dry samples. The same map was used to determine the sum of lattice water and organic matter (θoff) for the Selhausen site with the loss-on-ignition method by heating mixed samples of the 18 soil units to 1,000°C for 12 h (Zreda et al., 2012; Baatz et al., 2015). The samples were obtained from mixed top soil material (30–40 cm depth) from a total of 200 measurement locations in the area. The reference soil moisture, ϱbd and θoff were horizontally weighted to match the CRN rover measurement locations (Schrön et al., 2017).
Oklahoma Site (USA, Experiment C)
The Oklahoma site is located in the Cimarron River catchment in the central north of Oklahoma, USA. The soil is dominated by Mollisols, Alfisols and Inzeptisols with loamy texture in the central part of the transect and sandy texture in the western part of the transect (SSURGO database, https://websoilsurvey.sc.egov.usda.gov/). The land use consists mainly of warm seasonal grasses, winter wheat and small patches of deciduous forests. The average annual precipitation ranges from 880 mm in the east to 732 mm in the west (Dong and Ochsner, 2018).
CRN rover measurements were performed 18 times on a ~150 km long unpaved road. The resulting dataset was analyzed by Dong and Ochsner (2018) to determine controlling factors for mesoscale soil moisture patterns. The CRN rover used at this site consists of two epithermal neutron detectors, each holding two 3He-filled detector tubes (Hydroinnova LLC, Albuquerque, NM, USA). The aggregation interval of the raw neutron count measurements was 1 min and the driving speed varied according to the local conditions. The average speed was 48 km/h (Dong and Ochsner, 2018).
For the Oklahoma study area, we extracted ϱbd and clay content of the top soil from the SSURGO database and converted it to a 200 × 200 m resolution grid as described by Dong and Ochsner (2018). In a further step, we used their linear relation to derive lattice water (θoff) from clay content. The hydrogen pool of the soil organic matter was not considered by Dong and Ochsner (2018). Next, average values of ϱbd and θoff in a 200 m radius were assigned to the CRN rover measurement locations.
Data Acquisition and Standard Processing
Both CRN rovers recorded GPS locations at the end of each aggregation interval. These were set to half the distance traveled between two recordings so that the location better reflected the origin of the accumulated neutron counts (Dong and Ochsner, 2018; Schrön et al., 2018b). In addition, absolute humidity (calculated from measured air temperature and relative humidity) and atmospheric pressure were recorded with both CRN rovers. The corrected neutron counts (Ncor) for the Jülich CRN rover were obtained by applying standard correction procedures for atmospheric pressure (Desilets and Zreda, 2003), absolute humidity (Rosolem et al., 2013) and variation in incoming cosmic radiation (Desilets and Zreda, 2001). The correction procedures are described in detail in Jakobi et al. (2018, Appendix B). The reference incoming cosmic radiation was obtained from the neutron monitor at Jungfraujoch (JUNG, available via the NMDB neutron monitor database at www.nmdb.eu). The hourly incoming cosmic ray data were interpolated linearly to the respective time stamps of the measurements with the Jülich CRN rover. For the Oklahoma CRN rover, we used the raw and corrected neutron counts as published by Dong and Ochsner (2018).
Conversion of Neutron Counts to Soil Moisture
We converted the corrected neutron count rates to gravimetric soil moisture (θg [g/g]) with the approach of Desilets et al. (2010):
where N0 is a free parameter that is usually calibrated with independent in-situ soil moisture reference measurements, and ai = (0.0808, 0.372, 0.115) are fitting parameters determined by Desilets et al. (2010) and validated in many publications thereafter. Estimated hydrogen content within the CRN probe footprint stored in pools other than soil moisture (θoff [g/g], i.e., lattice water and organic matter) is subtracted from the CRN soil moisture estimate (Franz et al., 2012). As in previous CRN rover studies, we only considered lattice water and organic matter here (e.g., Avery et al., 2016; McJannet et al., 2017). The conversion from gravimetric to volumetric soil moisture (θv [m3/m3]) is known as:
For the Fendt site, we used a constant ϱbd = 1.028 g/m3 and θoff = 0.072 g/g, which were sampled ~150 m northeast of the measurement transect by Fersch et al. (2018). The in-situ soil moisture measurements were used to calibrate N0 in Equation 3, which resulted in a value of 753 cts/min for the Fendt site. For the N0 calibration of the CRN rover application at the Selhausen site, all reference in-situ soil moisture were used with four different aggregation methods (moving window and nearest neighbor aggregation of 3 and 9 measurements, respectively). Subsequently, the four aggregated N0 values were averaged, resulting in a mean N0 value of 720 cts/min for the Selhausen site. In this way, we did not favor any of the aggregation strategies used in this study. For the conversion of measured neutron counts to soil moisture at the Oklahoma site, we used N0 = 556 cts/min. This value was obtained by Dong and Ochsner (2018) using calibration against reference data from four stations of the Oklahoma Mesonet.
Quantification of Measurement Accuracy
The measurement accuracy of CRN rover measurements was quantified using the standard deviation (σ) and the root mean squared error (RMSE). Both have a similar meaning and are therefore directly comparable. The standard deviation σ is given by:
where x and are the measurements and their mean, respectively, and A is the total number of measurements, which scales with the aggregation size c. The RMSE is given by:
where x2 are the reference measurements for a given level of aggregation.
Expected Measurement Accuracy Due to Uncertain Neutron Count Rates
Measurements of a proportional neutron detector system are governed by counting statistics that follow a Poissonian probability distribution (Zreda et al., 2012). For a large number of events per unit time, the Poisson distribution converges to a normal distribution. Therefore, the expected uncertainty in the neutron count rate N is defined by the standard deviation . Consequently, increasing neutron count rates lead to decreasing relative measurement uncertainty as well as decreasing absolute soil moisture uncertainty (Schrön, 2017). It is important to realize that the basic uncertainty is introduced by the raw count rate rather than the processed neutron counts after correction. Therefore, the uncertainty analysis must be based on the raw measurement N and propagated to the corrected neutron counts with the factor s, the product of the correction factors for pressure, humidity and incoming cosmic radiation:
In order to obtain the expected standard deviation of soil moisture, the uncertainty of the neutron count rates must be propagated through Equation 3. One possible approach is the approximation by an analytical Taylor expansion. We used the method presented by Mekid and Vaja (2008), which develops the Taylor expansion up to the 3rd polynomial order and considers six central moments in the uncertainty distribution. Since the random detection of neutron counts follow a symmetric Gaussian normal distribution, only the 2nd, 4th, and 6th—moments are relevant in this calculation. The 1st, 2nd, and 3rd order approximation of the propagated uncertainty of θg (σθg [g/g]) are given by:
where the rectangles from small to large denote increasing order of approximation (Mekid and Vaja, 2008). Equation 8 requires the 1st, 2nd, and 3rd derivatives of Equation 3, which are given by:
For easier implementation of the 3rd order uncertainty approximation, the expressions given in Equations 8 and 9 can be simplified to:
To convert the expected standard deviation from gravimetric to volumetric units (σθv [m3/m3]) we used:
To validate the proposed Taylor expansion approach, we used a more computationally intensive Monte Carlo uncertainty analysis (e.g., Bogena et al., 2013; Baroni et al., 2018). For this, we calculated neutron count rates representative for volumetric soil moisture ranging from 0.0 to 0.7 m3/m3. This was done using Equations 3 and 4 by assuming Fendt site conditions (i.e., ϱbd, θoff, and s) and N0 values ranging from 0 to 45,000 cts. These values were chosen since they cover typical N0 values for the counting periods of CRN rovers (e.g., Avery et al., 2016: 518 cts/min; Dong and Ochsner, 2018: 556 cts/min; Vather et al., 2019: 133 cts/min) aggregated up to 1 h (e.g., Dong and Ochsner, 2018: 33,360 cts/h), as well as typical N0 values for long aggregation periods of stationary cosmic ray probes (e.g., Baatz et al., 2014: 936–1,242 cts/h; Baroni et al., 2018: 1,438 and 1,531 cts/h) aggregated up to 24 h. Subsequently, the synthetic mean neutron count rates were recalculated to raw neutron count rates with assuming the average conditions of the Fendt experiment and used to generate large sets of draws from the appropriate Poisson distribution (Nout). These were rescaled again with Npoisson = sNout and converted to soil moisture. The standard deviation of the resulting soil moisture distributions was used to obtain the measurement accuracy as a function of soil moisture, aggregation time and N0.
It should be noted that the non-linear behavior of Equation 3 transforms the Gaussian probability distribution of N to a skewed distribution of θg. Consequently, the uncertainty of θg is asymmetric, which cannot be expressed by a single standard deviation as obtained from the uncertainty approximation methods used in this study. However, since the focus is the optimization of CRNS rover surveys, we are confident that the presented approaches represent the uncertainty in soil moisture estimates from uncertain neutron count rates sufficiently well.
Since uncertainties of rover measurements are often more prone to areal than to temporal variation in soil moisture, we also converted aggregation time to aggregation length for 5, 10, 50, and 100 km/h driving speed using:
Other Sources of Uncertainty
Additional uncertainties for the estimation of soil moisture with the CRNS method, such as the uncertainties in the amount of biomass (Avery et al., 2016), N0, the incoming cosmic ray flux (Baroni et al., 2018), air pressure (Gugerli et al., 2019), and humidity are not investigated in this manuscript. However, due to the linear dependency of σθv and soil bulk density (Equation 11), the uncertainty in soil bulk density (σϱbd) is known to have a particularly strong influence on the volumetric soil moisture product (Avery et al., 2016; Baroni et al., 2018). According to error propagation theory, the relative uncertainty of soil bulk density and gravimetric soil moisture in Equation 11 sum up, which leads to the following calculation of volumetric soil moisture uncertainty:
Neutron Aggregation Strategies
For the Fendt experiment, we subdivided the measurement transect into equally long sections while assuring that each section contained at least 100 neutron count measurements. This resulted in ten sections, for which we assumed constant soil moisture during the 4 h measurement campaign. Within each of the sections, we defined a central location using the respective means of the east-west distance and the north-south distance. Subsequently, we selected the ten measurements nearest to the central location and calculated the standard deviation of the first aggregation step using Equation 5. In the next aggregation step, the twenty nearest measurements were selected. Then, the 1st and 11th, 2nd and 12th measurement, etc., were added to obtain 10 aggregated neutron count rates, and the standard deviation was calculated again. This process was continued until less than ten measurement were left. Finally, we used Equations 3 and 4 to convert the corrected neutron counts to volumetric soil moisture.
As mentioned above, the neutron count statistics of CRN rover measurements are usually improved by using a moving window filter. However, in many locations more local information is available where streets are intersecting. Therefore, using a nearest neighbor average should improve the measurement accuracy in these locations. We used the Selhausen experiment to compare a moving window aggregation strategy with a nearest neighbor aggregation strategy. We used a moving average filter with a window size of three and nine measurements along the driven route. Analogously, we averaged the neutron counts at each location with the nearest neighbor measurements in a way that the same number of measurements can be compared (e.g., a moving window of nine subsequent measurements is compared to the average of the location and the eight nearest neighbors).
For the Oklahoma experiment, we followed the strategy described by Dong and Ochsner (2018). From the average driving speed during data collection (~50 km/h), an average measurement interval of ~800 m was derived. This was used to generate an ideal route with 800 m spacing between the end, start and turning points of the transect driven on 7 August 2015. Next, the neutron measurements within different radii from the generated location were averaged for each transect driven. For a more detailed explanation on the averaging strategy, we refer to Dong and Ochsner (2018). Gibson and Franz (2018) and Finkenbiner et al. (2019) applied a similar aggregation strategy, but extended it by inverse distance weighting of the averaged neutron measurements. We did not test the potential benefits of this interpolation method as our primary focus was to establish an analytical approach for soil moisture uncertainty assessment. However, we suggest that the effects of different interpolation methods should be investigated in a separate study.
Results and Discussion
Expected Accuracy—Analytical vs. Monte Carlo Approach
Figure 2 shows the standard deviation of soil moisture as a function of soil moisture for synthetic neutron count rates using the Fendt site characteristics and N0 values of 500, 1,000, 2,000, and 5,000 cts, respectively. It is important to note that the presented results are site-specific and depend on soil bulk density, θoff and s. As expected, the uncertainty in soil moisture estimation increased with increasing soil moisture (Bogena et al., 2013). An increase in N0 (i.e., more aggregation or more efficient detectors) and therefore an increase in the count rate N led to substantially lower errors in soil moisture estimation (Figure 2).
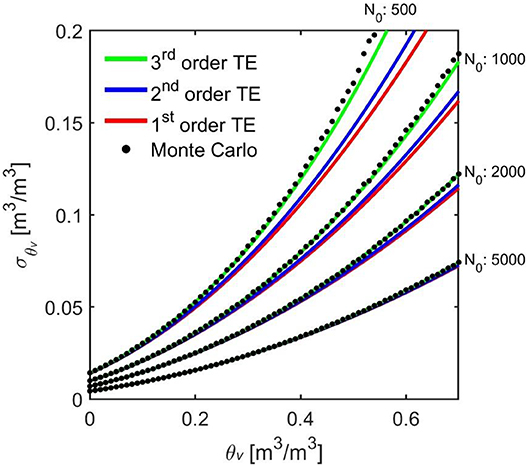
Figure 2. Standard deviation of soil moisture from raw neutron counts (σθv [m3/m3]) as a function of soil moisture (θv [m3/m3]) using N0 = 500, 1,000, 2,000, and 5,000 cts with Fendt site conditions and soil properties (ϱbd = 1.028 g/m3, θoff = 0.072 g/g and s = 0.6136). The standard deviations were obtained from a Monte Carlo approach and Taylor expansions (TE) of 1st, 2nd, and 3rd polynomial order with Equations 8, 9, and 11.
In addition, four error estimation methods are compared in Figure 2, namely the Monte Carlo approach and the Taylor expansions of 1st, 2nd, and 3rd order. We found that the analytical expressions for measurement uncertainty underestimated the standard deviation for high soil moisture content (> ~0.3 m3/m3) when the 1st and 2nd order Taylor expansions were used. For N0 values larger than 1,000, the 3rd order approximation matched the results of the Monte Carlo analysis very well. For low N0, the 3rd order approximation still deviated from the Monte Carlo simulations (Figure 2) with high water content (i.e., low neutron counts). This can be explained by the increasing steepness of Equation 3 toward the asymptote present at a neutron count rate of a1N0. Overall, we found only minor differences between Monte Carlo simulations and the 3rd order Taylor expansion to estimate measurement accuracy of soil moisture due to uncertainty of neutron count rates. Therefore, the 3rd order approximation was used in the remainder of this study.
Figure 2 clearly shows that higher count rates will result in lower soil moisture uncertainty. For this reason, aggregation periods of 12 or 24 h are often used with stationary probes and multiple CRN rover measurements along the same track are averaged. Figure 3 shows the aggregation time required to obtain soil moisture estimates of a specified measurement uncertainty with the Jülich CRN rover and Fendt site conditions. The aggregation time was obtained using the Monte Carlo approach and the 3rd order Taylor expansion approach. In addition, the aggregation time was converted to aggregation length using Equation 12. For soil moisture contents below 0.4 m3/m3, an aggregation time of 10 min is necessary to achieve a measurement uncertainty below 0.03 m3/m3 with the Jülich CRN rover and Fendt site conditions. Correspondingly, this measurement uncertainty can be achieved with increasing spatial aggregation depending on the driving speed. For instance, aggregation lengths of ~1, ~2, ~10, and ~20 km are needed for driving speeds of 5, 10, 50, and 100 km/h, respectively (Figure 3).
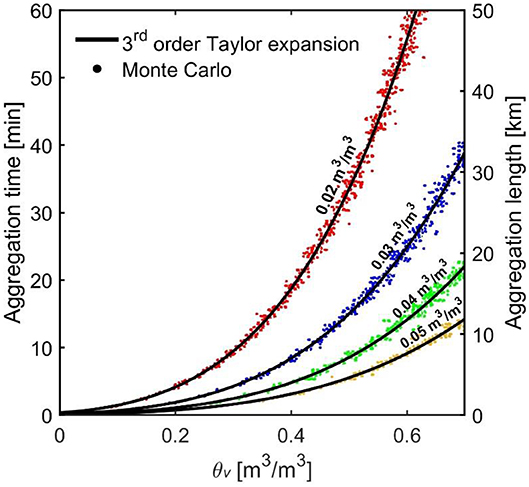
Figure 3. Aggregation time/aggregation length with 50 km/h traveling speed required to obtain soil moisture estimates (θv [m3/m3]) with 0.02, 0.03, 0.04 and 0.05 m3/m3 measurement uncertainty expressed as standard deviation from raw neutron counts (σθν [m3/m3]) as function of soil moisture. The standard deviation was obtained from a Monte Carlo approach and a Taylor expansion approach of 3rd polynomial order with Equations 8, 9 and 11 and the presented estimates are valid for neutron measurements with the J�lich CRN rover and Fendt site conditions (N0 = 753 cts/min, ϱbd = 1.028 g/m3, θoff = 0.072 g/g and s = 0.6136). The aggregation length can be converted linearly to other aggregations lengths and corresponding traveling speeds with Equation 12 (e.g., for 100 km/h multiply tick marks with 2, for 10 km/h divide the tick marks by 5, and for 5 km/h divide tick marks by 10).
It is important to note that the measurement uncertainty presented in Figures 2, 3 only considered uncertainty in neutron count rate, and thus does not include other sources of uncertainty in CRN soil moisture estimates, such as the uncertainty in soil bulk density (Avery et al., 2016; Baroni et al., 2018). Figure 2 suggests that a soil moisture of 0.3 m3/m3 is associated with an uncertainty of 0.056 m3/m3 for N0 = 1,000 cts due to uncertain neutron counts. An uncertainty of 20% in bulk density would add an additional uncertainty of 0.06 m3/m3 according to Equation 13. Thus, the combined uncertainty due to uncertain soil bulk density and raw neutron counts would be 0.116 m3/m3. It is clear that above a minimum threshold of raw neutron counts, the greatest absolute uncertainty in volumetric soil moisture estimates using CRNS technology can be attributed to soil bulk density (Avery et al., 2016). The framework presented here can be used to determine such a minimum threshold for a particular site, which is shown exemplary in Figure 4 for the Fendt site. For this, we obtained the uncertainty in soil moisture estimation with fixed neutron count rates N for different values of N0 using Equations 10 and 11. If we assume a 20% uncertainty in soil bulk density and a soil moisture range from 0.2 to 0.4 m3/m3, the uncertainties in soil bulk density and raw neutron counts are approximately equal, when there are 500 cts/unit area. For a soil moisture of 0.4 m3/m3 the combined uncertainties (Equation 13) from 20% uncertainty in soil bulk density and 1,000 cts/unit area is ~0.13 m3/m3. As we lack estimates of the uncertainty in bulk density for the case studies presented here, we focus on the uncertainty from raw neutron counts in the remainder of this manuscript.
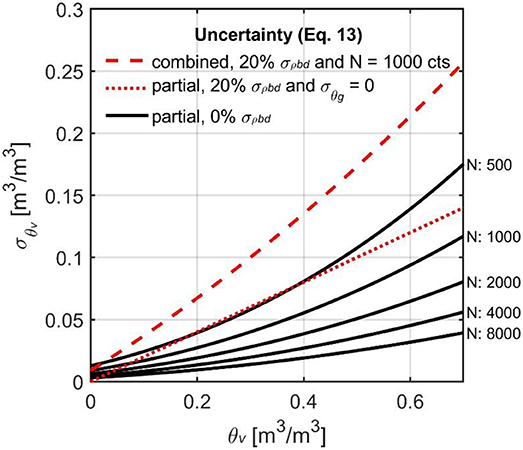
Figure 4. Standard deviation from raw neutron counts (σθν [m3/m3]) as a function of soil moisture (θν [m3/m3]) using fixed N = 500, 1,000, 2,000, 4,000 and 8,000 cts and variable N0s representative for soil moistures between 0 and 0.7 m3/m3 at the Fendt site (ϱbd = 1.028 g/m3, θoff = 0.072 g/g and s = 0.6136) obtained with Equation 11. For comparison the standard deviation from soil bulk density (σϱbd) in units of soil moisture as a function of soil moisture, assuming 20% uncertainty in bulk density, and the combined uncertainty from soil bulk density and raw neutron counts in units of soil moisture as a function of soil moisture, assuming N = 1,000 and 20% uncertainty in bulk density (Equation 13), is shown.
Experiment a (Fendt Site)
The measurements at the Fendt site (experiment A) were acquired to illustrate the accuracy of the 3rd order approximation to estimate measurement uncertainty of actual CRN roving measurements. The minimum, average and maximum count rates were 402, 606, and 810 cts/min, respectively, before correction (N). After correction, we observed a distinct reduction in neutron count rates, which is mostly attributed to the atmospheric pressure correction (responsible for an average reduction of ~35%). It is important to note that the large reduction due to the pressure correction occurred because we normalized to standard pressure (1023.25 hPa). The use of a different reference value (e.g., the average pressure during the measurement campaign) would reduce this effect. Minimum, average and maximum count rates after correction (Ncor) were 246, 372, and 504 cts/min, respectively. The measurement transect showed a distinct gradient in epithermal neutron count rates, with increasing environmental water content toward the east and corresponding decreasing epithermal neutron count rates (Figure 5A). The gradient in neutron counts was dominated by the road at the western end and the small stream at the eastern end of the transect (Figures 5A,B). These additional influences were considered during calibration and validation by adding artificial measurement points along the road and the stream (see Figure 5B). It is perhaps possible to correct neutron counts for the road influence with the approach from Schrön et al. (2018b), but this was not tested here because this correction would not have influenced the error estimation because it is based on raw neutron counts. To our knowledge, there is currently no correction approach for nearby water bodies available. Here, we assumed homogeneous soil moisture equivalent values of 0.07 m3/m3 for the road (Schrön et al., 2018b) and 1.0 m3/m3 for the stream, respectively, and the density of the artificially added points to consider roads and water bodies corresponded to the in-situ measurements.
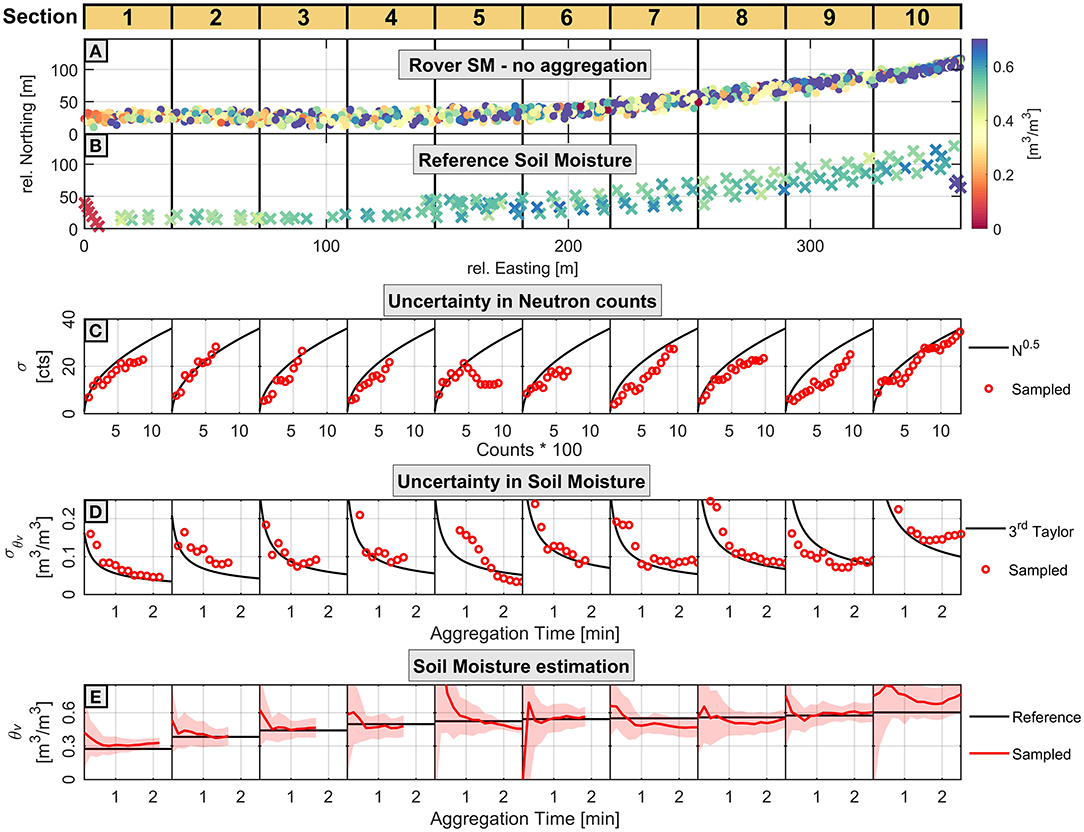
Figure 5. Overview of the results from the Fendt experiment for each of the ten analyzed sections. (A) CRN rover soil moisture without aggregation. (B) In-situ reference soil moisture. The relative coordinates in panels a and b were calculated from UTM coordinates. (C) Expected standard deviation of raw neutron counts (σ). (D) 3rd order approximation of standard deviation of soil moisture from raw neutron counts (σθv) in comparison to measured standard deviation with the CRN rover. (E) Soil moisture (θv) estimated with the CRN rover in comparison with mean reference soil moisture content for each section. Red area indicates ± one measured standard deviation of the mean.
To guide the visual analysis of the results, we divided the measurement transect into 10 sections. The expected and measured uncertainty of N with increasing aggregation is shown in Figure 5C. Both showed very similar behavior with increasing aggregation in most sections. Exceptions were sections 5 and 9, where the measured standard deviation of the counts was lower than expected. Figure 5D shows the standard deviation of measured soil moisture calculated with Equations 3 and 4 and the expected standard deviation calculated with Equations 10 and 11 (3rd order Taylor expansion) as a function of spatial aggregation. With the exception of sections 5, 9 and 10, all sections showed good agreement between the expected and measured uncertainty of soil moisture. Generally, the standard deviation of measured soil moisture was relatively high (>0.05 m3/m3) even after aggregation. This can be explained by the relatively short maximum aggregation time per section, which varied between 1.5 and 2.5 min. Such short aggregation times lead to a high measurement uncertainty as shown in Figure 3. To achieve a measurement accuracy of 0.05 m3/m3 at a soil moisture content of 0.60 m3/m3 (e.g., section 10), it would be required to aggregate for more than 10 min (cf. Figure 3). To achieve the same measurement accuracy for a soil moisture of 0.3 m3/m3 (e.g., section 1), an aggregation time of 2.5 min would have been sufficient.
Figure 5E shows the CRN rover derived soil moisture with increasing aggregation time as well as the mean reference in-situ soil moisture of each section. In most sections, the mean reference soil moisture fell within the range of the standard deviation of soil moisture. We found the largest deviations between the reference in-situ soil moisture and CRN rover derived soil moisture in sections 5 and 10 (Figure 5E). A possible explanation is that within these two sections the environmental moisture conditions were not constant as assumed in the analysis approach. This is consistent with earlier results of Schrön et al. (2018a), who found that small differences in position can significantly influence soil moisture estimates from CRN probes in complex environments.
Experiment B (Selhausen Site)
The measurements from the Selhausen experiment were used to compare different aggregation scales and strategies. Minimum, average and maximum count rates were 450, 654, and 888 cts/min, respectively, before correction (N). After correction, we observed a moderate reduction in neutron count rates and the incoming neutron correction had the greatest influence (responsible for an average reduction of ~10%). Minimum, average and maximum count rates after correction (Ncor) were 408, 588, and 798 cts/min, respectively.
The estimated soil moisture was very low (< 0.15 m3/m3, Figure 6) due to the extended drought period before and during the campaign. The soil moisture estimates of the CRN rover showed low values in the northeast and high values in the southwest, which reflects differences in soil texture (Rudolph et al., 2015; Brogi et al., 2019; Figure 6). Reference soil moisture measurements were even lower (< 0.1 m3/m3) than the soil moisture estimates from CRN roving.
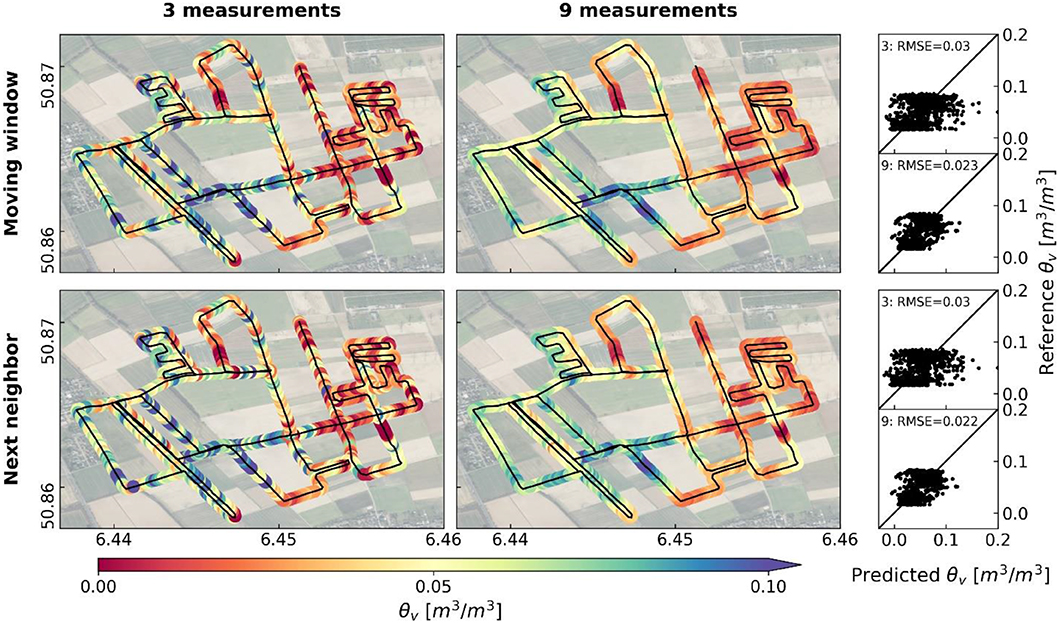
Figure 6. Comparison of four aggregation strategies with the Jülich CRN rover at the Selhausen site with data measured on 11 July 2018. Top panels: moving window aggregation for three and nine following measurements, respectively. Bottom panels: nearest neighbor aggregation with the nearest two and eight neighbors, respectively. The scatter plots show the reference soil moisture (θv) measurements (horizontally averaged according to Schrön et al., 2017) as a function of the predicted soil moisture from the CRN rover. Base maps: ESRI World Imagery and Contributors.
A correction for the effect of biomass on the soil moisture estimates was attempted using two approaches: (1) a linear regression between N0 and in-situ measured biomass (e.g., Baatz et al., 2015), and (2) the thermal-to-epithermal neutron ratio method (Tian et al., 2016; Jakobi et al., 2018). Both correction methods did not result in substantial improvements of the soil moisture estimates. We also attempted to remove road effects on the measured neutron count rate using the approach of Schrön et al. (2018b). However, this also did not result in an improvement, which was perhaps related to the dry conditions. Soil moisture content was lower than or equal to the soil moisture equivalents of different road types (grassy pathways, dirt roads, and asphalt), which is unusual and was not considered in the development of the correction approach (Schrön et al., 2018b).
Aggregation clearly improved the accuracy of soil moisture estimates as indicated by the lower RMSE, irrespective of aggregation strategy (Figure 6). Only minor differences were found for the aggregation approaches both in the case of three and nine measurements. In the case of the aggregation of nine measurements, the most pronounced differences occurred near crossroads, or for closely separated tracks (Figure 7). If only three measurements were aggregated, the differences were more variable due to the high measurement uncertainty, but they occurred in the same locations for both cases. A drawback of the nearest neighbor aggregation approach is that the processing algorithm potentially also takes measurements into account that were taken on parallel roads, even though they may have different water contents (cf. Figure 7).
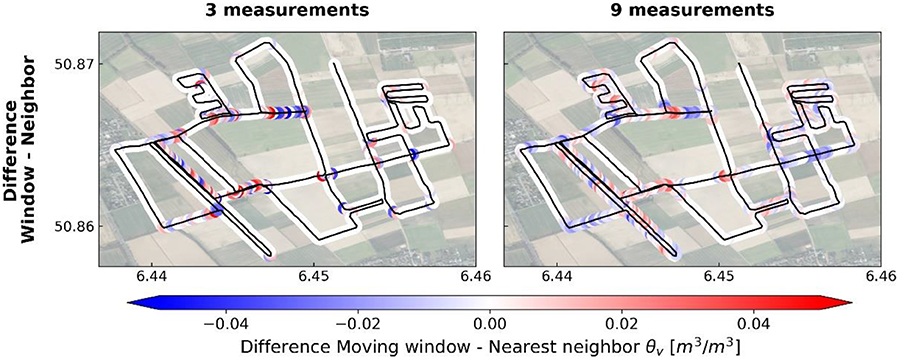
Figure 7. Difference in soil moisture (θv) between moving window and nearest neighbor aggregation strategies for three and nine aggregated measurements. Base maps: ESRI World Imagery and Contributors.
At first sight, the results from this experiment looked satisfying because of the relatively low reported RMSEs. However, the expected soil moisture estimation uncertainty using Selhausen site conditions (Figure 8) were similar to the overall uncertainty as expressed by the RMSE when only 3 measurements were used (0.032 m3/m3). This is undesirable and suggests the need for more aggregation. When nine measurements were aggregated, the average uncertainty due to uncertain neutron measurements decreased to 0.017 m3/m3 irrespective of aggregation strategy. Also, the patterns of soil moisture uncertainty distribution varied minimally between the aggregation strategies (Figure 8).
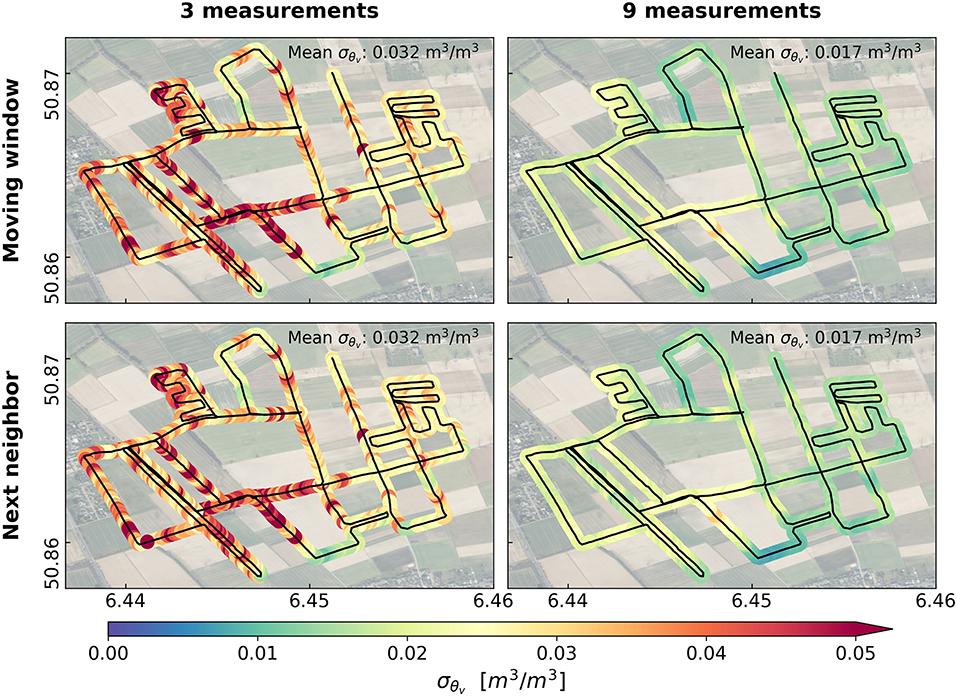
Figure 8. Comparison of soil moisture uncertainty from neutron counts (σθv) estimation with four aggregation strategies with the Jülich CRN rover at the Selhausen site with data measured on 11 July 2018. Top panels: moving window aggregation for three and nine following measurements, respectively. Bottom panels: nearest neighbor aggregation with the nearest two and eight neighbors, respectively. Base maps: ESRI World Imagery and Contributors.
This measurement campaign illustrates the required compromise between aggregation time and spatial resolution that is sometimes necessary for CRN rover measurements. In order to achieve lower uncertainty, the driving speed would have to be much lower. However, the vehicle did not allow lower driving speeds. Alternatively, one can increase the aggregation scale, with the drawback of less spatial resolution of the resulting soil moisture map. However, this led only to a slight reduction in RMSE (e.g., aggregation of 36 measurements led to a RMSE of 0.018 m3/m3). Since further aggregation only had a minor influence on the RMSE, we attribute the remaining part of the RMSE to other influences. Important additional sources of error were the spatial variability in bulk density, the heterogeneous vegetation, roads of different size and nature, as well as the inconsistency between in-situ and CRN rover measurements (both in time and depth).
Experiment C (Oklahoma Site)
Figure 9 provides an overview of the data from Dong and Ochsner (2018) with 800, 1,600, and 2,400 m aggregation length for soil moisture content, expected standard deviation as well as the relative standard deviation (). Using the original aggregation to 800 m, the mean soil moisture was 0.19 m3/m3 and the estimated mean standard deviation for all CRN rover measurements was 0.039 m3/m3, which is still below the error benchmark of 0.04 m3/m3 defined for the soil moisture active passive (SMAP) satellite mission (Chan et al., 2014). However, both soil moisture and the estimated standard deviation were spatially and temporally variable (Figure 9, upper and middle panel). As expected, the soil moisture and standard deviation of soil moisture showed a very similar pattern (Figure 9, upper and middle panel), while the relative standard deviation showed a different pattern (Figure 9, lower panel). There were two reason for this difference. First, some high relative standard deviation values were related to locations with only a few measurements within one pixel, which appear as red stripes across most measurement days in the lower panel of Figure 9. Second, measurement days with low soil moisture content and relatively low standard deviation nevertheless showed high relative errors. This is in line with the high relative uncertainty we found for the Selhausen site (Experiment B). Measurement days with high soil moisture and relatively high standard deviation nevertheless showed lower relative errors (Figure 9, compare driest and wettest measurement date). With increasing aggregation length, sharp transitions in soil moisture estimates of neighboring pixels are reduced (Figure 9, top panel) and both the absolute (Figure 9, middle panel) and relative standard deviation of soil moisture (Figure 9, lower panel) are reduced.
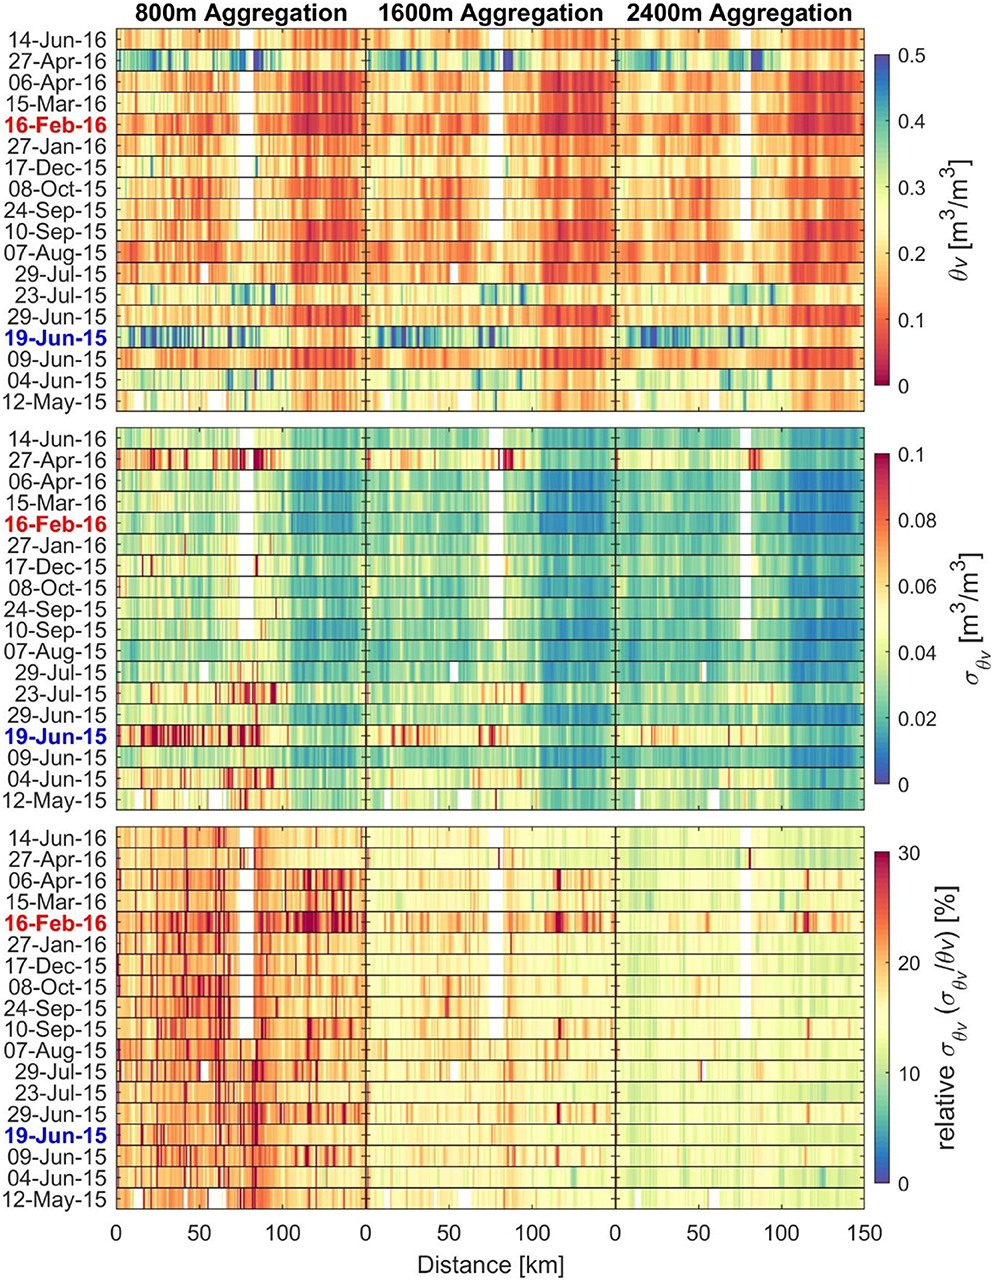
Figure 9. Soil moisture (θv), uncertainty of soil moisture from neutron counts (σθv) approximated using a 3rd order Taylor expansion approach and relative standard deviation () using 800, 1,600, and 2,400 m aggregation along the measurement transects in Oklahoma. White patches are areas not covered during a measurement date due to road closures (Dong and Ochsner, 2018). Blue and red dates indicate the wettest and driest measurement dates, respectively.
To evaluate the trade-off between aggregation length and expected standard deviation for the Oklahoma CRN rover data, we determined the proportion of pixels with an expected measurement uncertainty below 0.02, 0.03, 0.04, and 0.06 m3/m3 for different aggregation lengths (Figure 10). With increasing aggregation lengths, the number of pixels with valid information increased and this increase became stronger with increasing uncertainty thresholds. Less than 40% of the pixels had a measurement uncertainty below 0.03 m3/m3 for the original aggregation length of 800 m solely due to the neutron count uncertainty. This is consistent with the analysis of Dong and Ochsner (2018), who estimated the average measurement uncertainty for 800 m aggregation length as 0.03 g/g, which corresponds to ~0.044 m3/m3. Only at locations with low soil moisture content (< ~0.14 m3/m3), the expected measurement uncertainty was lower than 0.02 m3/m3. If all CRN rover locations were required to have a measurement uncertainty below 0.04 m3/m3, an aggregation length of more than 5 km would be necessary. However, already with 2,400 m aggregation length, the measurement uncertainty in the drier part of the measurement transect was lower than this (Figure 9, top and middle panel: km 110–150).
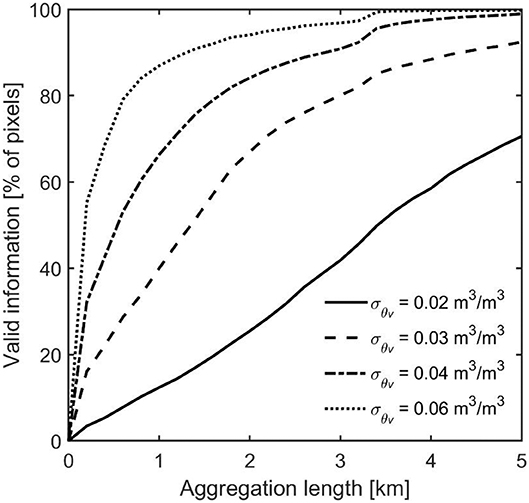
Figure 10. Percentage of pixels with soil moisture uncertainty from neutron counts (σθv) ≤ 0.02, 0.03, 0.04, and 0.06 m3/m3 standard deviation as a function of aggregation length.
Although we cannot recommend a universal aggregation length, we believe that the presented uncertainty approximation approach can serve as a tool for assessing the best possible compromise between measurement accuracy and spatial resolution. It should be noted that it is not possible to determine the uncertainty without taking into account site conditions and rover specifications and that the presented uncertainties are best possible estimates as other sources of uncertainty have not yet been taken into account. In general, the aggregation length should be carefully tailored to the needs of users, the capabilities of the CRN rover and the site conditions. In addition to the uncertainty in the neutron count rate, further uncertainties in the soil moisture estimation with the dataset from Dong and Ochsner (2018) are worthwhile mentioning. First, the influence of vegetation on soil moisture estimates was not considered. Promising approaches for removing these influences are the use of airborne (e.g., Fersch et al., 2018) or satellite (e.g., Avery et al., 2016) derived biomass estimates. Second, the influence of roads was not considered, which most likely resulted in underestimation of soil moisture content in most measurement locations (Schrön et al., 2018b). Third, the derivation of lattice water (θoff) and soil bulk density from uncertain soil maps, such as the SSURGO database, will introduce uncertainty in soil moisture estimation. However, this has been demonstrated in several other studies (e.g., Avery et al., 2016; McJannet et al., 2017) and is challenging to overcome. Fourth, soil organic carbon is an additional hydrogen pool in soils that should be considered for accurate soil moisture estimation (Franz et al., 2013). Regarding the influence of some of those environmental factors and their uncertainty, the reader is referred to Baroni et al. (2018).
Conclusion and Outlook
In this study, we quantified the uncertainty in soil moisture estimation with cosmic ray neutron measurements with an easy to use 3rd order Taylor expansion approach. The performance was evaluated using Monte Carlo simulations and experimentally determined measurement uncertainty and we found good agreement. Because of the typically short aggregation time and thus a low amount of neutron counts, soil moisture estimates obtained with cosmic ray neutron rover measurements are typically more uncertain than those obtained using stationary measurements. The proposed approach to approximate measurement uncertainty in soil moisture estimates has great potential for the planning and evaluation of rover experiments. It was shown that such uncertainty estimates can be used to find a suitable trade-off between measurement accuracy, aggregation, and the associated spatial resolution of the resulting soil moisture products.
The approach can also be used to design surveys with the cosmic ray neutron rover according to given accuracy requirements. We applied our error estimation approach to three cosmic ray neutron rover experiments and the major findings were:
- Measured and expected uncertainty matched well even with short aggregation periods.
- Uncertainty in soil moisture estimation from uncertainty in cosmic ray neutron counts can be reduced to only a fraction of the total measurement uncertainty if appropriate aggregation is used.
- The aggregation length of an experiment needs to be carefully selected based on the needs of the user, taken into account the site characteristics, and the cosmic ray neutron rover specifications.
Data Availability Statement
The datasets generated for this study are available on request to the corresponding author.
Author Contributions
JJ: rover data sampling and data processing, writing the manuscript, editing the manuscript, experimental design. JH and HB: supervision, reference data sampling, editing the manuscript, experimental design. MS: editing the manuscript, CRNS teaching. JF: reference data sampling, prepratory work, experimental design. CB: prepratory work, sample processing, editing the manuscript. HV: supervision.
Funding
This research was funded by the Deutsche Forschungsgemeinschaft (DFG, German Research Foundation)—project 357874777 of the research unit FOR 2694 Cosmic Sense. It also received supported from the MOSES (Modular Observation Solutions for Earth Systems) project funded by the Helmholtz-Gemeinschaft, which provided funding for the Jülich CRN rover. We also acknowledge the NMDB database funded by EU-FP7.
Conflict of Interest
The authors declare that the research was conducted in the absence of any commercial or financial relationships that could be construed as a potential conflict of interest.
Acknowledgments
We thank Jingnuo Dong and Tyson Ochsner for making their dataset publicly available and for updating it for this work. Carsten Montzka, Bernd Schilling, Daniel Dolfus, and Ansgar Weuthen are thanked for supporting the reference measurements at the Selhausen test site and Benjamin Fersch is thanked for the organization of the measurement campaign at the Fendt test site. Furthermore, we thank the two reviewers for their constructive feedback and suggestions.
References
Andreasen, M., Jensen, K. H., Desilets, D., Franz, T., Zreda, M., Bogena, H. R., et al. (2017). Status and perspectives of the cosmic-ray neutron method for soil moisture estimation and other environmental science applications. Vadose Zone J. 16:4079. doi: 10.2136/vzj2017.04.0086
Avery, W. A., Finkbeiner, C., Franz, T. E., Wang, T., Nguy-Robertson, A. L., Suyker, A., et al. (2016). Incorporation of globally available datasets into the roving cosmic-ray neutron probe method for estimating field-scale soil water content. Hydrol. Earth Syst. Sci. 20, 3859–3872. doi: 10.5194/hess-20-3859-2016
Baatz, R., Bogena, H. R., Hendricks Franssen, H.-J., Huisman, J. A., Qu, W., Montzka, C., et al. (2014). Calibration of a catchment scale cosmic-ray probe network: a comparison of three parametrization methods. J. Hydrol. 516, 231–244. doi: 10.1016/j.jhydrol.2014.02.026
Baatz, R., Bogena, H. R., Hendricks Franssen, H-J., Huisman, J. A., Montzka, C., and Vereecken, H. (2015). An empirical vegetation correction for soil water content quantification using cosmic ray probes. Water Resour. Res. 51, 2030–2046. doi: 10.1002/2014WR016443
Baroni, G., Scheiffele, L. M., Schrön, M., Ingwersen, J., and Oswald, S. E. (2018). Uncertainty, sensitivity and improvements in soil moisture estimation with cosmic-ray neutron sensing. J. Hydrol. 564, 873–887. doi: 10.1016/j.jhydrol.2018.07.053
Bogena, H., Kunkel, R., Krüger, E., Zacharias, S., Pütz, T., Schwank, M., et al. (2012). TERENO — long-term monitoring network for terrestrial research. Hydrol. Wasserb. 56, 138–143.
Bogena, H. R., Huisman, J. A., Baatz, R., Hendricks Franssen, H-J., and Vereecken, H. (2013). Accuracy of the cosmic-ray soil water content probe in humid forest ecosystems: the worst case scenario. Water Resour. Res. 49, 5778–5791. doi: 10.1002/wrcr.20463
Bogena, H. R., Huisman, J. A., Hübner, C., Kusche, J., Jonard, F., Vey, S., et al. (2015). Emerging methods for non-invasive sensing of soil moisture dynamics from field to catchment scale: a review. WIREs Water 2, 635–647. doi: 10.1002/wat2.1097
Bogena, H. R., Montzka, C., Huisman, J. A., Graf, A., Schmidt, M., Stockinger, M., et al. (2018). The TERENO-Rur hydrological observatory: a multiscale multi-compartment research platform for the advancement of hydrological science. Vadose Zone J. 17, 1–22. doi: 10.2136/vzj2018.03.0055
Brakensiek, D. L., and Rawls, W. J. (1994). Soil containing rock fragments: effects on infiltration. Catena 23, 99–110. doi: 10.1016/0341-8162(94)90056-6
Brogi, C., Huisman, J. A., Herbst, M., Weihermüller, L., Klosterhalfen, A., Montzka, C., et al. (2020). Simulation of spatial variability in crop leaf area index and yield using agroecosystem modeling and geophysics-based quantitative soil information. Vadose Zone J. 19:e20009. doi: 10.1002/vzj2.20009
Brogi, C., Huisman, J. A., Pätzold, S., von Hebel, C., Weihermüller, L., Kaufmann, M. S., et al. (2019). Large-scale soil mapping using multi-configuration EMI and supervised image classification. Geoderma 335, 133–148. doi: 10.1016/j.geoderma.2018.08.001
Chan, S., Njoku, E. G., and Colliander, A. (2014). Soil Moisture Active Passive (SMAP), Algorithm Theoretical Basis Document, Level 1C Radiometer Data Product, Revision A, 20 pp, Jet Propulsion Laboratory. Pasadena, CA: California Institute of Technology.
Chrisman, B., and Zreda, M. (2013). Quantifying mesoscale soil moisture with the cosmic-ray rover. Hydrol. Earth Syst. Sci. 17, 5097–5108. doi: 10.5194/hess-17-5097-2013
Desilets, D., and Zreda, M. (2001). On scaling cosmogenic nuclide production rates for altitude and latitude using cosmic-ray measurements. Earth Planet. Sci. Lett. 193, 213–225. doi: 10.1016/S0012-821X(01)00477-0
Desilets, D., and Zreda, M. (2003). Spatial and temporal distribution of secondary cosmic-ray nucleon intensities and applications to in situ cosmogenic dating. Earth Planet. Sci. Lett. 206, 21–42. doi: 10.1016/S0012-821X(02)01088-9
Desilets, D., Zreda, M., and Ferré, T. P. A. (2010). Nature's neutron probe: land surface hydrology at an elusive scale with cosmic rays. Water Resour. Res. 46:W11505. doi: 10.1029/2009WR008726
Dong, J., and Ochsner, T. E. (2018). Soil texture often exerts a stronger influence than precipitation on mesoscale soil moisture patterns. Water Resour. Res. 54, 2199–2211. doi: 10.1002/2017WR021692
Dong, J., Ochsner, T. E., Zreda, M., Cosh, M. H., and Zou, C. B. (2014). Calibration and validation of the COSMOS rover for surface soil moisture measurement. Vadose Zone J. 13, 1–8. doi: 10.2136/vzj2013.08.0148
Ehlers, W., Köpke, U., Hesse, F., and Böhm, W. (1983). Penetration resistance and root growth of oats in tilled and untilled loess soil. Soil Tillage Res. 3, 261–275. doi: 10.1016/0167-1987(83)90027-2
Fentanes, J. P., Badiee, A., Duckett, T., Evans, J., Pearson, S., and Cielniak, G. (2019). Kriging-based robotic exploration for soil moisture mapping using a cosmic-ray sensor. J. Field Robot. 37, 122–136. doi: 10.1002/rob.21914
Fersch, B., Jagdhuber, T., Schrön, M., Völksch, I., and Jäger, M. (2018). Synergies for soil moisture retrieval across scales from airborne polarimetric SAR, cosmic ray neutron roving, and an in situ sensor network. Water Resour. Res. 54, 9364–9383. doi: 10.1029/2018WR023337
Finkenbiner, C. E., Franz, T. E., Gibson, J., Heeren, D. M., and Luck, J. (2019). Integration of hydrogeophysical datasets and empirical orthogonal functions for improved irrigation water management. Precis. Agric. 20, 78–100. doi: 10.1007/s11119-018-9582-5
Flint, A. L., and Childs, S. (1984). Physical properties of rock fragments and their effect on available water in skeletal soils. Erosion Prod. Soils Contain. Rock Frag. 13, 91–103. doi: 10.2136/sssaspecpub13.c10
Franz, T. E., Wang, T., Avery, W., Finkenbiner, C., and Brocca, L. (2015). Combined analysis of soil moisture measurements from roving and fixed cosmic ray neutron probes for multiscale real-time monitoring. Geophys. Res. Lett. 42, 3389–3396. doi: 10.1002/2015GL063963
Franz, T. E., Zreda, M., Rosolem, R., and Ferre, T. P. A. (2012). Field validation of a cosmic-ray neutron sensor using a distributed sensor network. Vadose Zone J. 11:vzj2012.0046. doi: 10.2136/vzj2012.0046
Franz, T. E., Zreda, M., Rosolem, R., Hornbuckle, B. K., Irvin, S. L., Adams, H., et al. (2013). Ecosystem-scale measurements of biomass water using cosmic ray neutrons. Geophys. Res. Lett. 40, 3929–3933. doi: 10.1002/grl.50791
Fu, J., Gasche, R., Wang, N., Lu, H., Butterbach-Bahl, K., and Kiese, R. (2017). Impacts of climate and management on water balance and nitrogen leaching from montane grassland soils of S-Germany. Environ. Pollut. 229, 119–131. doi: 10.1016/j.envpol.2017.05.071
Gibson, J., and Franz, T. E. (2018). Spatial prediction of near surface soil water retention functions using hydrogeophysics and empirical orthogonal functions. J. Hydrol. 561, 372–383. doi: 10.1016/j.jhydrol.2018.03.046
Gugerli, R., Salzmann, N., Huss, M., and Desilets, D. (2019). Continuous and autonomous snow water equivalent measurements by a cosmic ray sensor on an alpine glacier. Cryosphere 13, 3413–3434. doi: 10.5194/tc-13-3413-2019
Jakobi, J., Huisman, J. A., Vereecken, H., Diekkrüger, B., and Bogena, H. R. (2018). Cosmic ray neutron sensing for simultaneous soil water content and biomass quantification in drought conditions. Water Resour. Res. 54, 7383–7402. doi: 10.1029/2018WR022692
Kiese, R., Fersch, B., Bassler, C., Brosy, C., Butterbach-Bahl, K., Chwala, C., et al. (2018). The TERENO-preAlpine observatory: integrating meteorological, hydrological and biogeochemical measurements and modelling. Vadose Zone J. 17:180060. doi: 10.2136/vzj2018.03.0060
Köhli, M., Schrön, M., and Schmidt, U. (2018). Response functions for detectors in cosmic ray neutron sensing. Nucl. Instrum. Methods Phys. Res. B. 902, 184–189. doi: 10.1016/j.nima.2018.06.052
Köhli, M., Schrön, M., Zreda, M., Schmidt, U., Dietrich, P., and Zacharias, S. (2015). Footprint characteristics revised for field-scale soil moisture monitoring with cosmic-ray neutrons. Water Resour. Res. 51, 5772–5790. doi: 10.1002/2015WR017169
Korres, W., Reichenau, T. G., Fiener, P., Koyama, C. N., Bogena, H. R., Cornelissen, T., et al. (2015). Spatio-temporal soil moisture patterns—a meta-analysis using plot to catchment scale data. J. Hydrol. 520, 326–341. doi: 10.1016/j.jhydrol.2014.11.042
McJannet, D., Hawdon, A., Baker, B., Renzullo, L., and Searle, R. (2017). Multiscale soil moisture estimates using static and roving cosmic-ray soil moisture sensors. Hydrol. Earth Syst. Sci. 21, 6049–6067. doi: 10.5194/hess-21-6049-2017
Mekid, S., and Vaja, D. (2008). Propagation of uncertainty: expressions of second and third order uncertainty with third and fourth moments. Measurements 41, 600–609. doi: 10.1016/j.measurement.2007.07.004
Reichenau, T. G., Korres, W., Montzka, C., Fiener, P., Wilken, F., Stadler, A., et al. (2016). Spatial heterogeneity of Leaf Area Index (LAI) and its temporal course on arable land: combining field measurements, remote sensing and simulation in a Comprehensive Data Analysis Approach (CDAA). PLoS ONE 11:e0158451. doi: 10.1371/journal.pone.0158451
Robinson, D. A., Campbell, C. S., Hopmans, J. W., Hornbuckle, B. K., Jones, S. B., Knight, R., et al. (2008). Soil moisture measurement for ecological and hydrological watershed-scale observatories: a review. Vadose Zone J. 7:358–389. doi: 10.2136/vzj2007.0143
Rosolem, R., Shuttleworth, W. J., Zreda, M., Franz, T. E., Zeng, X., and Kurc, S. A. (2013). The effect of atmospheric water vapor on the cosmic-ray soil moisture signal. J. Hydrometeorol. 14, 1659–1671. doi: 10.1175/JHM-D-12-0120.1
Rudolph, S., van der Kruk, J., von Hebel, C., Ali, M., Herbst, M., Montzka, C., et al. (2015). Linking satellite derived LAI patterns with subsoil heterogeneity using large-scale ground-based electromagnetic induction measurements. Geoderma 241-242, 262–271. doi: 10.1016/j.geoderma.2014.11.015
Schrön, M. (2017). Cosmic-ray Neutron Sensing and Its Applications to Soil and Land Surface Hydrology — on Neutron Physics, Method Development, and Soil Moisture Estimation Across Scales (Ph.D. dissertation). University of Potsdam. pp. 224.
Schrön, M., Köhli, M., Scheiffele, L., Iwema, J., Bogena, H. R., Lv, L., et al. (2017). Improving calibration and validation of cosmic-ray neutron sensors in the light of spatial sensitivity — theory and evidence. Hydrol. Earth Syst. Sci. 21, 5009–5030. doi: 10.5194/hess-21-5009-2017
Schrön, M., Rosolem, R., Köhli, M., Piussi, L., Schröter, I., Iwema, J., et al. (2018b). Cosmic-ray neutron rover surveys of field soil moisture and the influence of roads. Water Resour. Res. 54, 6441–6459. doi: 10.1029/2017WR021719
Schrön, M., Zacharias, S., Womack, G., Köhli, M., Desilets, D., Oswald, S. E., et al. (2018a). Intercomparison of cosmic-ray neutron sensors and water balance monitoring in an urban environment. Geosc. Instrum. Method Data Syst. 7, 83–89. doi: 10.5194/gi-7-83-2018
Tian, Z. C., Li, Z. Z., Liu, G., Li, B. G., and Ren, T. S. (2016). Soil water content determination with cosmic-ray neutron sensor: correcting aboveground hydrogen effects with thermal/fast neutron ratio. J. Hydrol. 540, 923–933. doi: 10.1016/j.jhydrol.2016.07.004
Unger, P. W., and Jones, O. R. (1998). Long-term tillage and cropping systems affect bulk density and penetration resistance of soil cropped to dryland wheat and grain sorghum. Soil Tillage Res. 45, 39–57. doi: 10.1016/S0167-1987(97)00068-8
Vather, T., Everson, C., Mengistu, M., and Franz, T. (2019). Cosmic ray neutrons provide an innovative technique for estimating intermediate scale soil moisture. S. Afr. J. Sci. 114, 7–8. doi: 10.17159/sajs.2018/20170422
Vereecken, H., Huisman, J. A., Bogena, H., Vanderborght, J., Vrugt, J. A., and Hopmans, J. W. (2008). On the value of soil moisture measurements in vadose zone hydrology: a review. Water Resour. Res. 44:W00D06. doi: 10.1029/2008WR006829
Vereecken, H., Huisman, J. A., Hendricks Franssen, H. J., Brüggemann, N., Bogena, H. R., Kollet, S., et al. (2015). Soil hydrology: recent methodological advances, challenges, and perspectives. Water Resour. Res. 51, 2616–2633. doi: 10.1002/2014WR016852
Weihermüller, L., Huisman, J. A., Lambot, S., Herbst, M., and Vereecken, H. (2007). Mapping the spatial variation of soil water content at the field scale with different ground penetrating radar techniques. J. Hydrol. 340, 205–216. doi: 10.1016/j.jhydrol.2007.04.013
Wolf, B., Chwala, C., Fersch, B., Garvelmann, J., Junkermann, W., Zeeman, M. J., et al. (2016). The ScaleX campaign: scale-crossing land-surface and boundary layer processes in the TERENO-preAlpine observatory. Bull. Am. Meteorol. Soc. 98, 1217–1234. doi: 10.1175/BAMS-D-15-00277.1
Zacharias, S., Bogena, H. R., Samaniego, L., Mauder, M., Fuss, R., Puetz, T., et al. (2011). A network of terrestrial environmental observatories in Germany. Vadose Zone J. 10, 955–973. doi: 10.2136/vzj2010.0139
Zreda, M., Desilets, D., Ferré, T. P. A., and Scott, R. L. (2008). Measuring soil moisture content non-invasively at intermediate spatial scale using cosmic-ray neutrons. Geophys. Res. Lett. 35:L21402. doi: 10.1029/2008GL035655
Keywords: cosmic ray neutron sensing, error propagation, aggregation, cosmic ray rover, uncertainty
Citation: Jakobi J, Huisman JA, Schrön M, Fiedler J, Brogi C, Vereecken H and Bogena HR (2020) Error Estimation for Soil Moisture Measurements With Cosmic Ray Neutron Sensing and Implications for Rover Surveys. Front. Water 2:10. doi: 10.3389/frwa.2020.00010
Received: 23 January 2020; Accepted: 14 April 2020;
Published: 14 May 2020.
Edited by:
Jianzhi Dong, Agricultural Research Service (USDA), United StatesReviewed by:
Trenton Franz, University of Nebraska-Lincoln, United StatesLinna Chai, Beijing Normal University, China
Copyright © 2020 Jakobi, Huisman, Schrön, Fiedler, Brogi, Vereecken and Bogena. This is an open-access article distributed under the terms of the Creative Commons Attribution License (CC BY). The use, distribution or reproduction in other forums is permitted, provided the original author(s) and the copyright owner(s) are credited and that the original publication in this journal is cited, in accordance with accepted academic practice. No use, distribution or reproduction is permitted which does not comply with these terms.
*Correspondence: Jannis Jakobi, ai5qYWtvYmlAZnotanVlbGljaC5kZQ==