 Matthias Erdmann
 Markus von Berg
 Jochen Steffens
94% of researchers rate our articles as excellent or good
Learn more about the work of our research integrity team to safeguard the quality of each article we publish.
Find out more
ORIGINAL RESEARCH article
Front. Virtual Real., 19 March 2025
Sec. Augmented Reality
Volume 6 - 2025 | https://doi.org/10.3389/frvir.2025.1552321
The present study explores the development and evaluation of a mixed reality music visualization for a live music performance. Real-time audio analysis and crossmodal correspondences were used as design guidelines for creating the visualization, which was presented through a head-mounted-display. To assess the impact of the music visualization on the audience’s aesthetic experience, a baseline visualization was designed, featuring the same visual elements but with random changes of color and movement. The audience’s aesthetic experience of the two conditions (i.e., listening to the same song with different visualizations) was assessed using the Aesthetic Emotions Scale (AESTHEMOS) questionnaire. Additionally, participants answered questions regarding the perceived audiovisual congruence of the stimuli and questionnaires about individual musicality and aesthetic receptivity. The results show that the visualization controlled by real-time audio analysis was associated with a slightly enhanced aesthetic experience of the audiovisual composition compared to the randomized visualization, thereby supporting similar findings reported in the literature. Furthermore, the tested personal characteristics of the participants did not significantly affect aesthetic experience. Significant correlations between these characteristics and the aesthetic experience were observed only when the ratings were averaged across conditions. An open interview provided deeper insights into the participants’ overall experiences of the live music performance. The results of the study offer insights into the development of real-time music visualization in mixed reality, examines how the specific audiovisual stimuli employed influence the aesthetic experience, and provides potential technical guidelines for creating new concert formats.
Technological innovations have greatly enhanced the visual design of musical concerts beyond simple lighting design. The integration of multimedia elements and elaborate stage designs create immersive experiences, that have become an integral part of modern concerts (Cui et al., 2023). In order to develop approaches for new concert formats, the focus often lies on the development of multisensory systems that generate synergies between different modalities for the audience, such as music visualization (Olowe et al., 2017a; Olowe et al., 2017b) and automated stage lighting control (Moon et al., 2015; Hsiao et al., 2017).
Over the past decade, there has been a growing body of research focusing on the application of extended reality (XR) within musical contexts (Turchet et al., 2021). XR is a collective term that encompasses augmented reality (AR), mixed reality (MR), virtual reality (VR) and, in a broader sense, other related technologies such as 360-degree multi-projection environments and full domes (Weinel, 2020). Whereas AR systems let users view the real world with virtual objects overlaid and integrated into their surroundings, VR systems block out any visual input from the real world, replacing it with a fully rendered 3D virtual environment displayed in stereoscopic view. In contrast, MR can be conceived as a display paradigm where real and virtual objects are presented together simultaneously, existing at any position along the continuum between the real and virtual world (Turchet et al., 2021). The increasing use of XR technologies suggests that in the future, concert experiences could be largely complemented by immersive XR content, providing means to reinterpret the physical boundaries of the performance space and the music being played (Weinel, 2020).
XR is not solely aimed at a particular set of sensory modalities, though a vast amount of work primarily focuses on auditory and visual stimuli (Turchet et al., 2021). Existing musical XR formats range from concert recordings with 360-degree cameras (Young et al., 2022) to VR concerts with digitally generated stages and avatars (Turchet et al., 2021). Weinel (2020) describes MR as a particularly promising approach for enriching the experience for the audience on site. He argues that, as technology continues to improve and decreases in cost, new ways of augmenting and visualizing the music in a live context might emerge, enriching the concert experience in the long term. While there are already some studies that use smartphones and tablets for an augmented concert experience (Mazzanti et al., 2014; Selfridge and Barthet, 2019), the integration of MR using head-mounted displays (HMD) is still in its infancy due to technical limitations. Additionally, MR remains relatively unexplored for music visualization (Weinel, 2020). Furthermore, according to Turchet et al. (2021), numerous publications on general musical XR applications and performances concentrate on the documentation of these systems, while neglecting research on human perception and evaluations that focus on the experience of the audiences or performers. They therefore argue that, when investigating XR experiences, more attention should be directed to the users of those systems in order to understand the mechanisms underlying multisensory perception in musical contexts. In another publication, Turchet et al. (2018) emphasize the need for semantically meaningful audio analysis to establish relationships between different sensory modalities, highlighting its importance for the development of multimodal settings.
Considering the aspects outlined above, this paper presents both the realization and participants’ reception of a musical live performance enhanced with music visualization in MR. The audiovisual composition focused on linking both sensory modalities through audio analysis. The aim of this research was to develop a concert experience in MR and to investigate how this visualization affects the aesthetic experience of the audience compared to a visualization designed without these specific links between modalities. Furthermore, it was examined whether person-related characteristics of the participants influenced the evaluation of the audiovisual stimuli. Due to the live performance context, real-time audio analysis, the overall system architecture and the associated technical challenges of such a real-time application are addressed, presented, and discussed.
Although there is a variety of different scientific, technical, and artistic approaches dealing with music visualization (Weinel, 2020), three aspects are of particular importance for the MR concert presented in this paper: crossmodal correspondences between auditory and visual stimuli that serve as a theoretical foundation for designing the visualization, the use of real-time audio analysis, and the audience’s aesthetic experience of audiovisual stimuli. A literature review of crossmodal correspondences and real-time music visualization forms the basis for decisions regarding the technical setup and audiovisual content design of the MR concert, while the review of the aesthetic experience of audiovisual stimuli places the scientific question of this work within the context of existing studies.
A growing body of empirical research on multisensory perception demonstrates that even non-synaesthetic individuals experience crossmodal correspondences which can be described as compatibility effects between stimuli in different sensory modalities (Parise and Spence, 2012). For example, numerous studies have identified crossmodal correspondences between simple and complex auditory and visual stimuli, often revealing recurring correlations between acoustic properties and visual parameters (Evans and Treisman, 2010). Given the wide range of findings, only the crossmodal correspondences relevant to this research will be discussed. These include the relationship between pitch and position, loudness and size, timbre and shape, and emotion and color. It is important to note that a recent study (Sun et al., 2024) has suggested the possibility of cross-cultural differences in the perception of crossmodal correspondences regarding auditory and visual stimuli. The studies discussed below were conducted in Western countries and may therefore reflect cultural biases specific to this context.
Some studies have observed significant differences in the congruency effects between pitch and vertical position for simple audiovisual stimuli, with a closer association between vertical position and pitch compared to size and pitch. A vertically higher position tends to be associated with high tones, while low tones are associated with a vertically lower position (Chiou and Rich, 2012; Evans and Treisman, 2010). Furthermore, studies investigating loudness and size have shown that smaller objects are associated with softer sounds, while larger objects are related to louder sounds (Hauck and Hecht, 2019; Lipscomb and Kim, 2004). Studies investigating crossmodal relationships between musical timbre and geometric shapes suggest that harsh timbres are associated with sharp-edged shapes and soft timbres with rounded shapes (Adeli et al., 2014; Arai et al., 2023). Lipscomb and Kim (2004) also demonstrated the relationships between pitch and vertical position, loudness and size, and timbre and shape, respectively. Other studies investigated correspondences between music and colors. Bresin (2005), for example, found that music in a major key is associated with brighter colors than music in a minor key. Building on this, Palmer et al. (2013) demonstrated that fast music in a major mode leads to color selection that is more saturated, lighter, and yellower than music in minor mode which participants related to colors that are less saturated, darker, and bluer. Whiteford et al. (2018) confirmed these findings and further demonstrated that music-color associations can be mediated by emotional connotations. They observed that high-arousal music tends to evoke more saturated, darker, and redder colors compared to calm, less arousing music. Moreover, music with high valence evoked brighter and yellower colors than sad, negatively valenced music.
The crossmodal correspondences mentioned above are primarily studied in laboratory settings with pre-defined, often simple stimuli. However, connections between different modalities have also been explored to create various experiences such as music visualizations and new synergies in concert settings. In these contexts, diverse music-related information such as MIDI data (Nanayakkara et al., 2007), sensor data (Subramaniam and Barthet, 2017), or information extracted directly from the audio (Reddy and Rompapas, 2021) are used to create audiovisual formats. According to Turchet et al. (2018), one challenge in representing and analyzing multimodal content lies in enabling meaningful and relevant interactions by determining flexible mapping strategies. They therefore argue that sensor data and audio analysis using music information retrieval (MIR) techniques provides new approaches to the translation of different sensory modalities. Among other things, this would open new creative possibilities for the development and interpretation of musical XR experiences.
MIR research systematically deals with a wide range of computer-based music analysis, processing, and retrieval topics (Müller, 2015). Extracted information with little semantic meaning are generally considered as low-level features, whereas high-level features correspond to terms humans use to describe music, such as tempo or structure (Lerch, 2012). While most MIR applications focusing on high-level feature analysis mostly use pre-recorded music, real-time audio analysis has received less attention in this context (Turchet et al., 2018). However, real-time analysis is often necessary in live contexts, which this paper addresses, and therefore poses a significant technical challenge. Real-time MIR systems impose strict requirements on algorithm execution time and latency (Stefani and Turchet, 2022); therefore, extracting high-level features is computationally demanding. In offline MIR systems, the entire audio file is available, allowing for the inclusion of both future and past information in the analysis. On the contrary, real-time systems can only process a limited number of past and current input samples. Here, the size of the analysis window is generally kept small to ensure low latency between the input and the output signal (Stefani and Turchet, 2022), although this may lead to poorer accuracy of the results (Meier et al., 2023). In addition, these systems have a limited amount of time to process the input buffers before the succeeding buffer is delivered (Stefani and Turchet, 2022). Regarding latency, the perceived quality of digital musical instruments is higher when it is kept between 0 and 10 ms, compared to 10–20 ms (Jack et al., 2018). In contrast to applications solely focusing on music, the acceptable latency of applications that rely on visual feedback is higher. Depending on the audiovisual stimuli, the Just Noticeable Difference (JND) for the perception of asynchronicity can range from 75 to 258 milliseconds as shown in an experiment by Vroomen and Keetels (2010). For relatively short stimuli, such as auditory beeps and visual flashes, JND values between 25 and 50 milliseconds were observed in their study.
Some publications have already described real-time capable MIR systems for music visualization. Although these studies may have utilized crossmodal correspondences, either explicitly or unconsciously, for their design choices, the use of the audio features on the visual elements has not been extensively discussed in these publications. Additionally, these were mostly limited to low-level features. For example, Reddy and Rompapas, (2021) used varying amplitudes of individual frequency bands to influence the position, size, and color of visualizations in MR presented via a HMD. Taylor and Torres, (2007) utilized the pitch and volume of music played during a live performance to control visualizations projected onto a screen. Fonteles et al. (2013) mapped the musical parameters pitch, volume and timbre onto a particle system that visualizes classical music, also presented on a screen. While these studies extracted audio features of a stereo mix, Olowe et al. (2017a) proposed a system that analyzes various features of individual instrument groups in a live music performance. The authors argue that the use of multiple instances of an audio signal opens new possibilities for defining visual compositions more precisely. Furthermore, Graf et al. (2021) proposed a real-time capable MIR software that can be used as a plug-in within a digital audio workstation (DAW). Various low-level features can be extracted from different audio tracks and further processed via a graphical user interface. The audio features are made available via the Open Sound Control (OSC) network protocol and can be further processed by the libmapper library (Malloch et al., 2013).
While the approaches described above are mostly limited to the extraction of low-level features, the use of high-level features is considered to play a decisive role in the development of multimodal experiences due to their high semantic significance (Turchet et al., 2018). However, there are currently only a few published studies on this topic. For example, the influence on a lighting system has been explored by running music emotion recognition algorithms to classify the emotional connotations of the music. However, these analyses were not executed in real-time (Hsiao et al., 2017; Moon et al., 2015).
Many studies on XR systems (see Turchet et al., 2021 for an overview of relevant publications) have concentrated on technical aspects and the documentation of these systems, whereas human perception is often not investigated in depth. Yet, Turchet et al. (2021) argue that fundamental research on how different stakeholders interact with virtual elements and spaces in musical contexts could significantly benefit the design of future musical XR systems. Studies on music visualization that do involve the audience’s feedback (Correia et al., 2017; Perrotin, 2014; Sa et al., 2014) focus primarily on whether visualizations influenced by music during live electronic music performances can enhance the audience’s understanding of digital musical instruments. Among other things, the visualizations aim to establish a clear connection between the musicians’ gestures and the music being heard. To the authors’ knowledge, the extent to which music visualization controlled by MIR methods influences the aesthetic experience has not yet been thoroughly investigated. However, an initial study by Graf et al. (2021) showed that the transfer of audio features to visual parameters using MIR is perceived as a better visual complement to the music than visualizations without such audio mappings. Other studies have examined the effects of audiovisual congruence on aesthetic experience without considering MIR. For example, Lin et al. (2022) demonstrated that a music video in which the cuts align with the accented first beat of a measure in the music is perceived as more aesthetically pleasing than one with cuts incongruent to the music. Further studies investigating aesthetic experience in relation to music and paintings have so far yielded contradictory results. Limbert and Polzella, (1998), for instance, showed that listening to appropriate music while viewing paintings enhances the aesthetic experience. In contrast, Rančić and Marković, (2019) and Fink et al. (2023) found in their experiments that participants could recognize whether the paintings and the music clip matched in terms of complexity and regularity, but this congruence had no impact on the aesthetic experience. Other studies by Howlin et al. (2017), Howlin et al. (2020) investigating audiovisual congruence in dance performances found that incongruence between music and dance was perceived as more enjoyable than congruence.
A number of studies (Graf et al., 2021; Lin et al., 2022; Rančić and Marković, 2019) only evaluated the aesthetic experience based on whether the audiovisual stimuli are perceived as pleasant or fitting. Fewer studies have used a comprehensive evaluation of stimuli by assessing different emotions. Fink et al. (2023) for example, employed an extended evaluation using adjectives such as mood-congruent, moving, enjoyable, and interesting. Similarly, Limbert and Polzella (1998) used four differentiated scales to assess the stimuli: active-passive, organized-chaotic, soft-hard, and beautiful-ugly. However, the more extensive evaluation of the stimuli showed contradictory results between the two studies. Given the importance of emotions regarding the aesthetic experience and the need to conceptualize and measure these emotions, Schindler et al. (2017) developed the Aesthetic Emotions Scale (AESTHEMOS) questionnaire that differentiates the emotional signature of aesthetic stimuli with a total of 42 emotions. However, this has not yet been applied to the previously discussed topics of audiovisual artforms, but has been primarily used in a music-related context to investigate and compare various concert formats, such as live concerts, VR concerts, and streaming concerts (Scorolli et al., 2023). Finally, to the authors knowledge, only Fink et al. (2023) investigated how personal characteristics, such as musicality or artistic receptivity, influence the aesthetic experience, whereby no significant associations were observed.
Whether congruence or incongruence between modalities positively influence the aesthetic experience of audiovisual stimuli in an art context remains unclear. Research on paintings presents contradictory findings, while studies on dance performances consistently demonstrate that incongruency enhances enjoyment. Conversely, research on music videos and music visualization indicates that congruence typically fosters greater appreciation. To further test the robustness of the findings regarding music visualization, the present study examined the influence of a music visualization controlled by MIR methods on the aesthetic experience in more detail. While previous studies primarily focused on assessing only a few emotions, this study aimed to provide a more nuanced evaluation of the stimuli. Moreover, due to the growing relevance of MR, its focus on the visual modality, and its promising role in the development of new concert formats as outlined in the introduction of this paper, the music visualization was integrated into a MR live music performance. Given the live performance context, real-time MIR capabilities and the generation of visuals in real-time had to be incorporated. To facilitate a theory-based translation from the auditory to the visual domain, both high- and low-level features were used to control the visualization. While visual design choices in many previous studies have not been extensively discussed, the underlying work integrated crossmodal correspondences as a theoretical foundation for aligning visual elements with extracted MIR audio features. Although previous studies may have utilized crossmodal correspondences, either explicitly or unconsciously, this study places emphasis on design choices to offer a more detailed understanding and documentation of how the visual composition was constructed and created. The research questions primarily dealt with the evaluation of the aesthetic experience and the perceived audiovisual congruence of the respective stimuli. Here, four different hypotheses were formulated:
Hypothesis 1. Using real-time audio analysis to influence and control a music visualization developed specifically for this study creates a stronger audiovisual congruence between the musical and visual composition compared to a version of the same visualization controlled randomly.
Hypothesis 2. Using real-time audio analysis to select colors based on the emotional connotations of the music in a music visualization developed specifically for this study, results in higher approval ratings compared to a version where colors are assigned randomly.
Hypothesis 3. Using real-time audio analysis to influence and control a music visualization developed specifically for this study results in a more positive aesthetic experience compared to the same visualization controlled randomly.
Following Fink et al.’s (2023) investigation of individual differences in aesthetic experiences, we also included a fourth hypothesis on this matter.
Hypothesis 4. The responsiveness to art and musicality of the participants influences the aesthetic experience depending on the type of visualization created for this study.
The same musical piece was performed live twice by the same musician in front of each participant, who wore a MR-capable head mounted display (HMD), showing the real environment and overlaid virtual elements. The musician did not wear a HMD. The experiment employed a within-subjects design, with all participants exposed to both conditions. During one performance, participants saw a randomized visualization and during the other, a visualization controlled by audio features extracted with MIR methods. The exposure to both conditions required the musician to perform the same song live twice for each participant, with the audio analyzed and the visuals generated in real-time during each run-through. The song was composed before the study started and included no improvisatory elements. To ensure no variations in the musical performance during each experiment, the song was rehearsed extensively beforehand. Both the performer and participant were physically present in the same acoustically treated listening laboratory. The performer sat between two loudspeakers through which the music was played, while the participant was positioned approximately 3.5 m away. Through the HMD, the participant viewed the music visualization featuring virtual 3D geometries placed within the room, which dynamically deformed, moved, and changed colors in real-time according to the respective condition.
A total of 62 participants aged between 18 and 62 years (average age: 32.8 years, SD = 9.8) took part in the study; 44% identified themselves as female, 56% as male. Participants were recruited through various university mailing lists and private networks.
The development of the MR performance was based on the technical and design aspects discussed in the previous sections and characterized by modular components that are adaptable as well as expandable. The technical setup consisted of three main components: a real-time audio analysis software (RAS), the musical composition, and the visualization.
While the software described by Graf et al. (2021) can only be used as an audio-plug-in within a DAW, the software presented in this paper was implemented as a standalone application. On the one hand, this reduces the complexity of the MR system architecture by avoiding the integration of a DAW. On the other hand, this approach results in a more versatile software that can be used across various scenarios. The application is designed with a graphical user interface (GUI) that facilitates the selection of individual channels and various low- and high-level features. The MIR software library Essentia (Bogdanov et al., 2013) was used to extract the audio features. Essentia provides a vast amount of different algorithms for feature extraction, many of which can also be executed in real time (Moffat et al., 2015). Furthermore, a wide range of high-level feature descriptors is available (Alonso-Jiménez et al., 2020). Eight different low-level features can currently be extracted per audio channel: Pitch [Yin algorithm (de Cheveigné and Kawahara, 2002)], Spectral Centroid, Dissonance, Onset1 (High Frequency Content detection function), Onset2 (Spectral Flux detection function), RMS (Root Mean Square), Loudness, and the energy in mel bands of a spectrum. Parameters such as the confidence value of the pitch algorithm, the threshold, and the time interval for detecting an onset can be individually set for each audio channel. A detailed documentation of the algorithms can be found on the Essentia website. While low-level features such as pitch, volume, and timbre can be used for most of the crossmodal relationships described, the Essentia’s DL model emomusic-msd-musicnn was used for high-level feature analysis. The model predicts arousal (R2 = 0.646) and valence (R2 = 0.515) dimensions on a scale of 1–9, making it suitable for exploring crossmodal relationships between emotion and color. It has been trained on spectrograms of approximately one second each, allowing estimates for arousal and valence to be generated roughly once per second. Due to their short computation time, low-level features can be processed within the real-time audio thread. In contrast, the predictions from the DL model need to be handled in a separate thread, as their computation time exceeds the duration required to fill the audio buffer. A buffer size of 512 samples and a sampling rate of 48 kHz were used for the experiment. Following Graf et al.’s (2021) approach, the Libmapper software library (Malloch et al., 2013) was used to ensure intuitive mapping of the extracted information to visual parameters without the need for additional programming. Libmapper provides a network through which various software applications can feed and receive Open Sound Control (OSC) data. Multiple connections, manipulations and parallelization of this data can be carried out using the GUI Webmapper1. This promotes a fast and explorative approach to mapping various audio features to visual parameters. The software was implemented by the first author in C++ using the JUCE2 framework. Figure 1 depicts the MIR software (top) and the Webmapper interface (bottom).
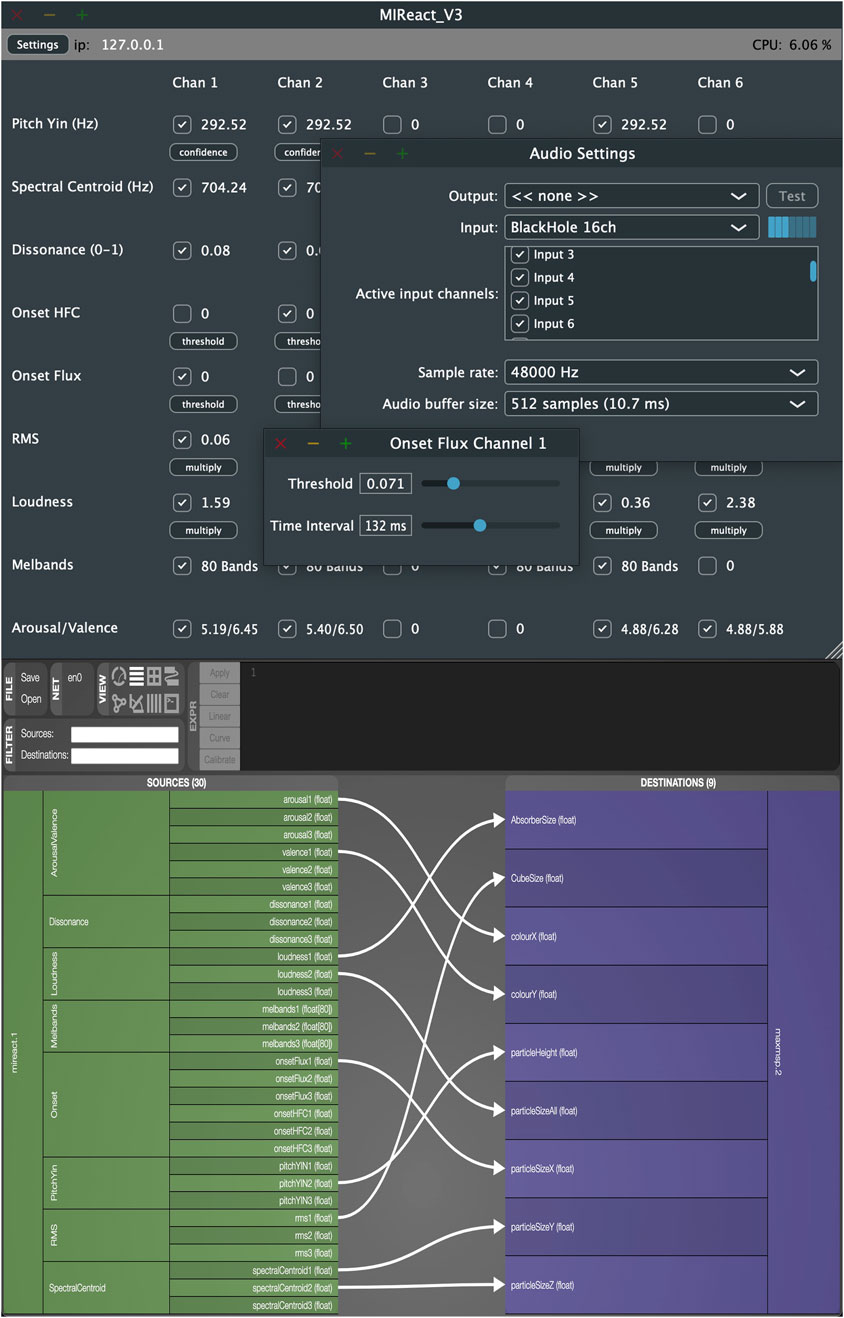
Figure 1. Illustration of the RAS (top) and the Webmapper1 interface (bottom).
The present work focuses on the approach proposed by Olowe et al. (2017b), who used different instrument groups for music visualization, enabling more precise visual compositions. To minimize costs and effort, a guitar piece was composed for the study instead of using a full band lineup. Different instrument groups were simulated through live looping techniques. To achieve this, various sequencers, pitch-shifting algorithms, and granular synthesis techniques were employed in the SuperCollider3 programming language to modulate and transform the guitar signal. The resulting composition blends musical style characteristics from ambient, noise, and pop genres. The composition starts with an ambient part and becomes rhythmic towards the end. A musical Instrument Digital Interface (MIDI) controller was utilized to dynamically influence various musical elements, such as starting the sequencer, applying specific effects to the guitar signal, and triggering live-looping processes.
The aforementioned crossmodal correspondences were used as design guidelines to align visual elements with extracted MIR audio features. In the first part of the composition, cylindrical elements emerged from the membranes of two speakers on the left and right side of the performer, respectively, imitating a waveform. The elements’ size was influenced by the volume (audio feature loudness) and the vertical position by the pitch. The geometry was influenced by timbre, using the audio feature dissonance (see Figures 2A–C). Essentia’s dissonance algorithm computes the sensory dissonance of an audio signal given its spectral peaks. “Sensory dissonance (to be distinguished from musical or theoretical dissonance) measures perceptual roughness of the sound and is based on the roughness of its spectral peaks”3. The higher the dissonance, the more angular and sharply defined the geometry became. In the second part of the music performance, onsets (audio feature spectral flux) were calculated for the various audio tracks to place and morph cuboid shapes in sync with the rhythm of the music. While the cuboid shapes appearing on the backwall diffusor panels were placed randomly, the positions of a total of four cuboid shapes laid on the floor were influenced by pitch. At higher pitches, the objects were placed towards the audience, whereas at lower pitches they were positioned closer to the musician (Figure 2D). Moreover, the objects’ size changed according to the volume of the music (audio feature loudness). In the third and final section of the composition, the visual elements of the previous parts were combined. Following the approach of Dharmapriya et al. (2021), the geometrical shapes’ colors were selected by mapping the RGB color circle to Russell’s (1980) Circumplex Model (Figure 3). This approach enabled the automatic assignment of specific colors to the arousal and valence values predicted by the DL model. Based on the findings of Whiteford et al. (2018), high arousal values were mapped onto redder colors, high valence values were mapped onto yellower colors. For low arousal and valence values, opposite colors on the RGB color wheel were used. Since the DL model predicts pairs of arousal and valence values about once per second, interpolation between successive color values was performed to ensure smooth color transitions. Furthermore, the DL analysis was performed on the stereo mix of the entire composition, and not on single audio channels, like the low-level features. Figures 2A–C depict the visualizations for the first part of the composition, which features musically negative arousal and valence values, resulting in colors predominantly found in the fourth quadrant of the Circumplex Model’s color spectrum. The second part of the composition (Figure 2D) shows positive values for both valence and arousal and is therefore primarily represented in the second quadrant of the color spectrum.
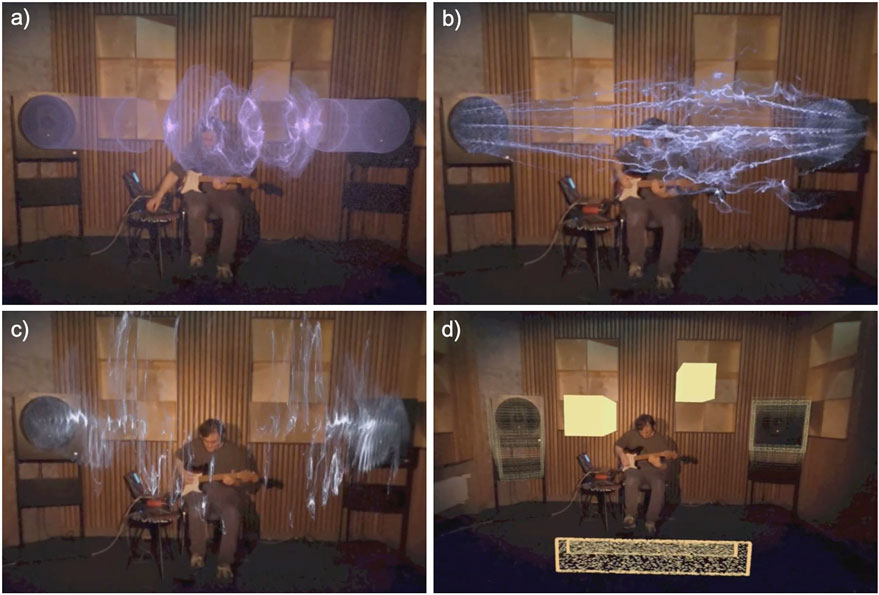
Figure 2. Participants view and the visual composition during different musical sections. (A) The effect of loudness on the size of the visual elements. The louder the audio, the larger the shape. (B) The influence of sensory dissonance on geometry. As sensory dissonance increases, the geometry becomes sharper. (C) The influence of pitch on the vertical position of the visual shape. Higher-pitched tones shift the shape further upwards. (D) Visual elements in the rhythmic part of the composition. Cubic forms were placed on the ground, with higher pitches closer to the participant and lower pitches nearer to the musician. In this particular excerpt, two notes with different pitches were played consecutively: a higher-pitched note, prominent in the foreground, and a lower-pitched note, already in decay, appearing smaller and quieter in the background near the musician.
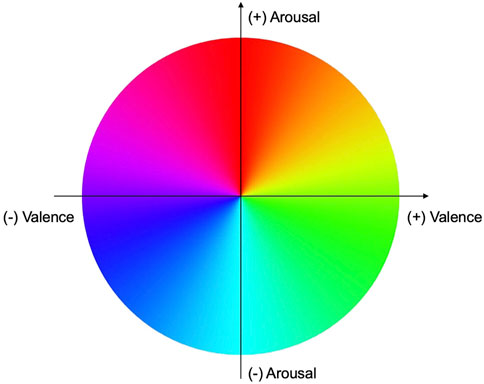
Figure 3. Mapping of the RGB color wheel onto the Russell Circumplex model. Quadrant 1: upper left, Quadrant 2: upper right, Quadrant 3: lower right, Quadrant 4: lower left.
The MR application that rendered the geometries was developed in Unity4, using VFX Graph to create the visual elements. VFX Graph is a node-based programming language integrated into Unity, which enables the creation of simple particle systems to complex simulations. To simplify the development process, the physical performance space was scanned with an iPad Pro equipped with a LiDAR system. The resulting 3D model was then used as a reference for positioning and scaling the generated visual elements in Unity. The Meta Quest 3 was used as the MR headset.
Finally, it is important to note that some geometries and the placement of the visual elements are based on design decisions. For instance, geometries, textures, and the positioning of visual elements (e.g., placed on the diffusers) were chosen to ensure a good integration into the space, achieving an aesthetically pleasing effect according to the developer/first author.
Figure 4 shows the overall system architecture. The guitar signal was fed into a laptop on stage and processed by SuperCollider. The individual channels were combined into a stereo mix and output to the respective speakers. Simultaneously, the individual channels were routed to the RAS, which then sent the extracted audio features via OSC to another computer where the data was processed by a Max/MSP5 patch handling tasks such as scaling or interpolation. The information was then forwarded to the Unity MR application via OSC. Due to the high computational demands of VFX Graph in Unity, the MR application was not rendered on the MR headset, but on the computer and streamed to the MR headset via a Quest Link.

Figure 4. System architecture of the MR performance.
The randomized performance used the same system architecture, with the RAS replaced by a Max/MSP patch that randomly adjusted the visual parameters shape, position, size, and color at randomized time intervals. Random values were generated from a uniform distribution. Figure 5A depicts values that control the deflection of one visual element during a defined segment of the composition. Here, deflection refers to the size and movement of the visual element as it extends from the speaker to the floor within the performance room. A value of 0 indicates no size (the element is not visible), while a value of 1 represents the full size, where the visual element spans from the speaker to the floor. In the randomized visualization (Rand-V), deflection was managed randomly, meaning visual elements moved in unpredictable ways without a direct link to the music. Conversely, in the visualization controlled by audio features extracted with MIR methods (MIR-V), visual elements were synchronized to the amplitude of the music, resulting in movements that correspond to the loudness of the audio. The values were afterwards scaled to the size of the performance venue. Figure 5B shows the randomized color selection during a single performance of Rand-V. Random points were selected at random time intervals on the color wheel. To create smooth transitions, an interpolation was applied between the current and new color. The timing of the interpolation varied depending on the distance between consecutive color points in the spectrum. Specifically, the longer the distance, the longer the interpolation time. To preserve the dramaturgy of the composition, the visual elements associated with each instrument group were visible only when the corresponding instruments were audible, as in the MIR-controlled visualization.
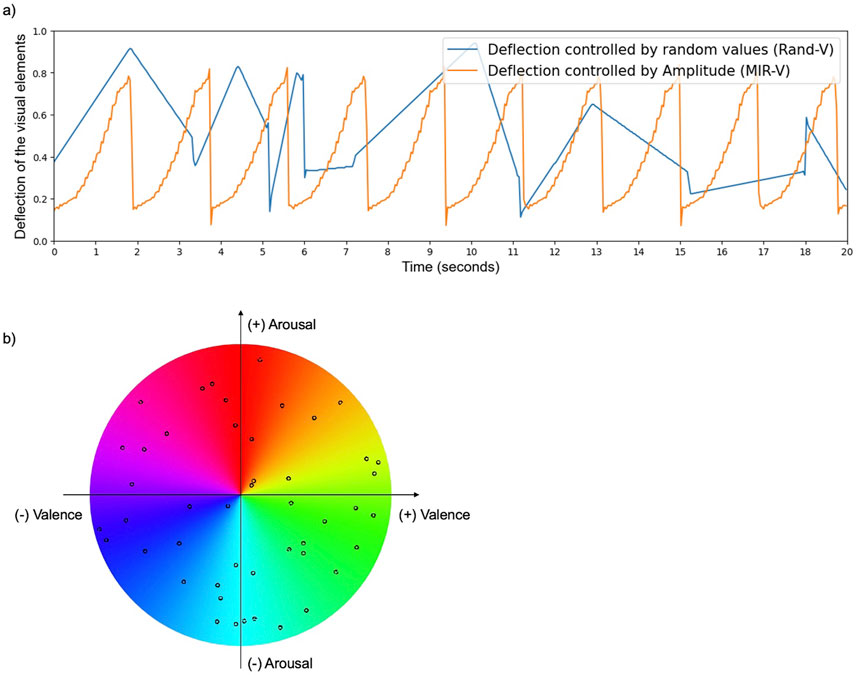
Figure 5. Deflection (A) and random color selection (B) of visual elements during the performance. (A) The deflection of the visual elements during a defined segment of Rand-V and MIR-V. The values were afterwards scaled to the size of the performance space. (B) Randomized colors for one entire performance. Points were selected at randomized time intervals and interpolated between each other to create smooth transitions. The timing of the interpolation varied depending on the distance between consecutive points.
The Aesthetic Emotions Scale (AESTHEMOS) questionnaire (Schindler et al., 2017) was used to assess the music performance in relation to the aesthetic experience for each condition on a five-point Likert scale. This questionnaire assesses a range of aesthetic emotions through 21 subscales, each with two items. While Schindler et al. (2017) prefer the 21 subscales for their theoretical depth, the items can also be grouped into seven superordinate factors: “prototypical aesthetic emotions” (e.g., the feeling of beauty and emotion), “epistemic emotions” (e.g., interest and insight), “negative emotions” (e.g., ugliness and confusion), “animation” (e.g., energy and vitality), “nostalgia/relaxation” (e.g., sentimentality and relaxation), “sadness” (e.g., grief and melancholy) and “amusement” (e.g., humor and joy). To reduce the size of the questionnaire, two less relevant factors regarding the study were excluded. The factor “amusement” was excluded as it emphasizes humor and fun, which was not expected to be relevant to the performance and research questions. “Sadness” was also excluded, as it is already partly covered by the negative emotion and nostalgia/relaxation factors. Furthermore, items from the remaining five factors were selected based on thematic relevance and high factor loading in the original paper, resulting in a questionnaire with a total of 24 (instead of 42) items. To assess the audiovisual congruence of the stimuli, three additional items addressing audiovisual synchronicity were incorporated, partly derived from Graf et al. (2021) and Fink et al. (2023). To obtain a better assessment of the color selection based on the predictions of the DL model, two items evaluating color congruence were included. Since Graf et al. (2021) used a ten-point Likert scale, these five items (see Table 1) were measured on the same scale.
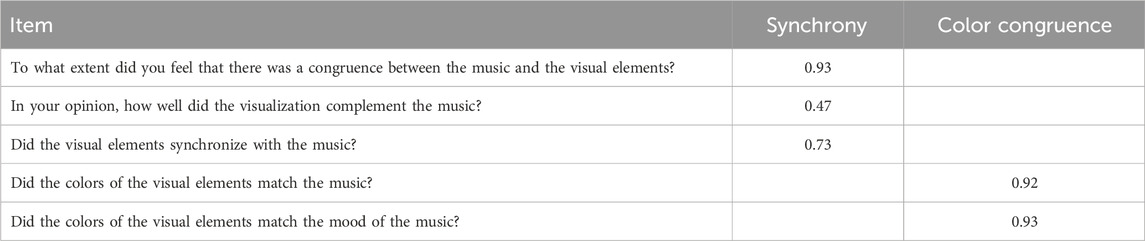
Table 1. Factor loadings of the five items for the dimensions Synchrony (S) and Color Congruence (CC).
To collect person-related characteristics of the participants, basic demographic information such as age and gender were obtained along with musical expertise measured by a shortened version of the Goldsmiths Musical Sophistication Index (Gold-MSI) (Müllensiefen et al., 2014), including only four of the seven dimensions: “active engagement,” “perceptual abilities,” “musical training,” and “general music sophistication,” whereby each dimension consisted of three items that were rated on 7-point Likert scales, consistent with the original questionnaire by Müllensiefen et al. Furthermore, the Aesthetic Responsiveness Assessment (AeR) questionnaire (Schlotz et al., 2021) was used, which was designed to evaluate an individual’s responsiveness to aesthetic experiences, including visual arts, music, dance, and performance, using a 5-point Likert scale, also consistent with the original. The questions are categorized into the factors of “aesthetic appreciation,” “intense aesthetic experience,” and “creative behavior,” all of which fall under the superordinate factor of “aesthetic receptivity”. After the experiment, open-ended interviews were conducted in which participants were asked to briefly describe their impressions of the performances. During the interview, the following questions were asked if participants did not address these by themselves: “How would you describe the overall audiovisual experience, including your perception of the musician?”, “What aspects did you like less, and do you have any suggestions for improvement?”, and “Can you imagine such concert formats in the future?” All items of the questionnaires are listed in the Appendix.
After a brief verbal introduction, the first performance of the musical piece started either with Rand-V or MIR-V. To control for sequence effects, the order of the visualizations was randomized across participants. After the approximately 4-min music performance, participants completed the first part of the questionnaire, which included the 24 items from the AESTHEMOS questionnaire and the five questions on audiovisual congruence. The same piece of music was then performed with the other visualization, and the same questionnaires were administered again. Afterwards, participants answered questions on demographic aspects, completed the Gold-MSI and the AeR questionnaire, and finally, the experiment ended with the open interview. Each test run included only one participant and took approximately 30 min. Participants were compensated with 5 €.
The five items related to the audiovisual congruence of the stimuli were tested for latent factors using exploratory factor analysis (EFA). To examine the differences in the ratings of audiovisual congruence and the aesthetic experience of the respective stimuli (Hypothesis 1, Hypothesis 2, Hypothesis 3), the Wilcoxon signed-rank test (Woolson, 2008) was applied due to the lack of normal distribution in the variables. To compute the effect size, the matched pairs rank biserial correlation r (Kerby, 2014) was used. To test Hypothesis 4 regarding the influence of personal characteristics on the aesthetic experience in relation to MIR-V and Rand-V, linear mixed-effects models were calculated to account for the repeated measurements of each participant in the data. These models included interaction effects between the different stimuli and person-related variables. The residuals of the models were visually inspected and confirmed to be appropriate. The factor scores from the AESTHEMOS questionnaire as well as the factor scores extracted by the EFA were used as dependent variables. The respondents’ IDs were included in the models as a random effect, while the fixed effect was defined by the person-related variables and the categorical variable presenting MIR-V and Rand-V. To further test for general associations of person-related variables and aesthetic experience independently of the visualization condition, mean values were calculated from the respective ratings per participant and tested for correlation using Spearman’s correlation coefficient, given the lack of normal distribution and the ordinal scale level. The framework of Braun and Clarke (2006) was used to analyze the interview responses. In this approach, various codes are extracted from the participants’ answers and then grouped by content into overarching themes.
The raw, unweighted scores of each Gold-MSI factor were transformed into percentiles based on data norms derived from a large sample of 147,633 participants by Müllensiefen et al. (2014). A histogram of the percentiles is shown in Figure 6. The mean values of these percentiles were 69.4% for “active engagement” (SD = 29%), 50.5% for “perceptual abilities” (SD = 31.5%), 49.6% for “musical training” (SD = 25.6%), and 47.1% for “general music sophistication” (SD = 32.5%). Furthermore, the analysis of the AeR questionnaire shows an average level of aesthetic receptivity (M = 2.84; SD = 0.76), which is defined by the factors “creative behavior” (M = 2.23; SD = 1.13), “aesthetic appreciation” (M = 3.69; SD = 0.61), and “intensive aesthetic experience” (M = 2.57; SD = 0.85).
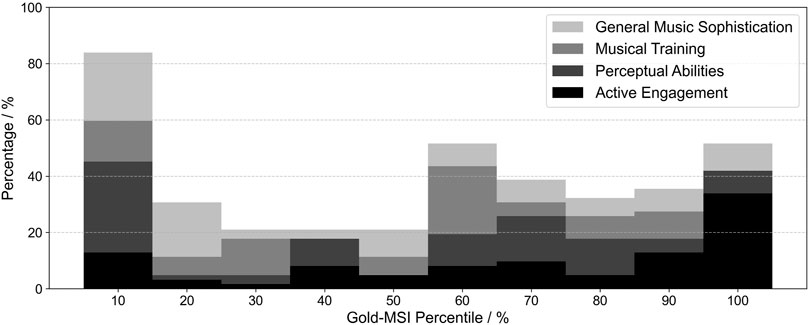
Figure 6. The distribution of the musical experience within the sample of 64 participants, using frequencies of the percentile for each factor of the Gold-MSI.
Regarding the five items on audiovisual congruency, the Wilcoxon signed-rank test showed that all items were rated significantly higher for MIR-V than for Rand-V. The results are presented in Figure 7, showing the ratings of each item and the two conditions, averaged across participants, along with the significant differences and rank biserial correlation coefficients as effect size measures. For more concise hypothesis testing, we decided to aggregate these items. Since the items were partly derived from prior research and partly developed independently, lacking a predefined latent structure, an EFA was chosen to identify latent factors using principal axis factoring and oblique factor rotation (KMO = 0.68; Bartlett’s test: χ2 = 302.03, df = 10, p < 0.001). Minimum Average Map, visual scree plot, and parallel analysis supported a two-factor solution. Based on the factor loadings of the individual items (see Table 1), the two factors were named “synchrony” (S) and “color congruence” (CC). To calculate the latent factor scores, the items for S, CC, AESTHEMOS, AeR, and Gold-MSI questionnaires were averaged according to their factor composition.
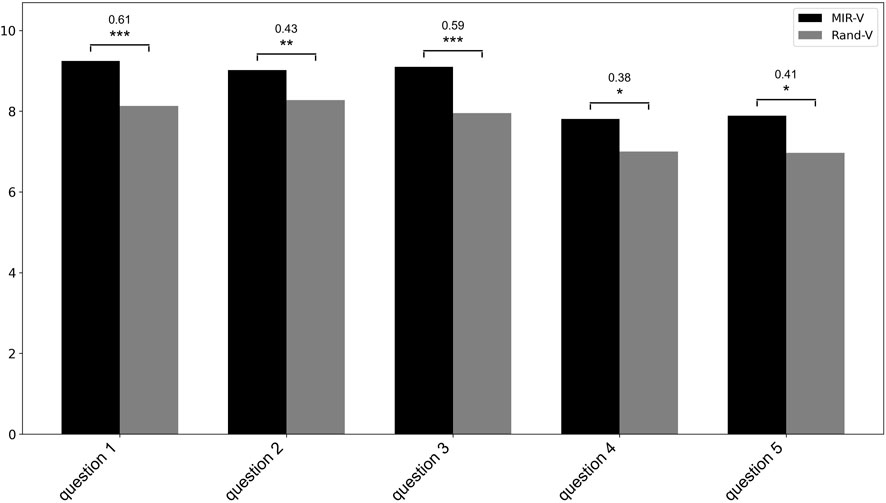
Figure 7. Ratings on audioviusal congruency, averaged across participants. Question 1: To what extent did you feel that there was a congruence between the music and the visual elements? Question 2: In your opinion, how well did the visualization complement the music? Question 3: Did the visual elements synchronize with the music? Question 4: Did the colors of the visual elements match the music? Question 5: Did the colors of the visual elements match the mood of the music? Significant differences between conditions are indicated by brackets (Significance levels: *α = 0.05, **α =0.01, ***α = 0.001) and annotated with rank biserial correlation coefficients as effect size measures.
Regarding the formulated hypotheses, the Wilcoxon signed-rank test showed that audiovisual congruence was rated significantly higher for MIR-V than for Rand-V, both in terms of the factor “synchrony” (Z = −4.36, p < 0.001, r = 0.66) and the factor “color congruence” (Z = −2.72, p < 0.01, r = 0.42), thus confirming Hypothesis 1 and Hypothesis 2. Furthermore, the results show that MIR-V received significantly higher ratings for the factors “prototypical aesthetic emotions” (Z = −3.38, p < 0.001, r = 0.51) and “animation” (Z = −2.21, p = 0.027, r = 0.35). In contrast, there were no differences between the two conditions with regard to the factors “epistemic emotions” (Z = −2.39, p = 0.142), “negative emotions” (Z < 0.01, p = 0.693) and “nostalgia/relaxation” (Z = −0.60, p = 0.597). Therefore, Hypothesis 3 can only partly be confirmed. Despite the significantly higher rating for MIR-V, it is worth noting that Rand-V was also rated as overall positive. The results are presented in Figure 8, showing the ratings of the different factors and the two conditions, averaged across participants, along with the significant differences and rank biserial correlation coefficients as effect size measures.
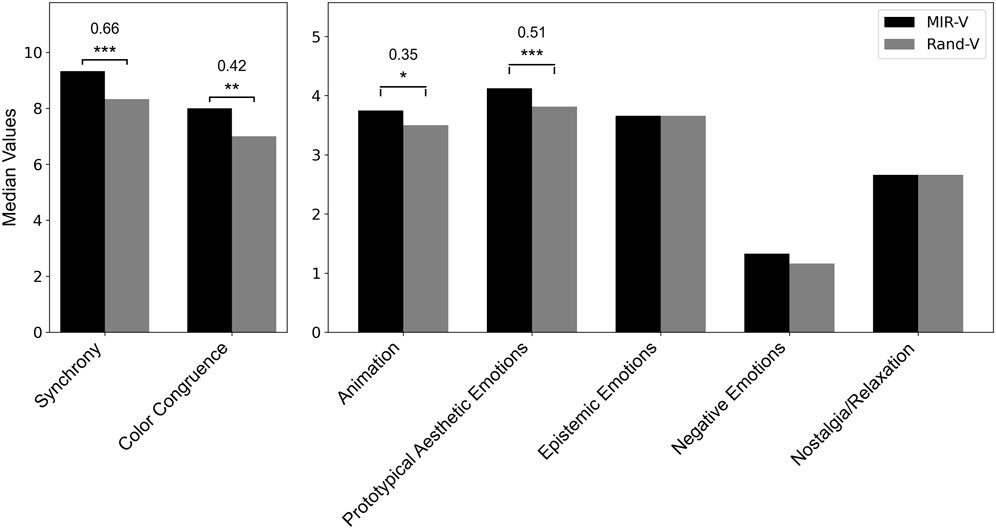
Figure 8. Ratings of the different factors, averaged across participants and the two musical conditions MIR-V and Rand-V. Synchrony and Color Congruence are based on a ten-point Likert scale, whereas aesthetic emotions are based on a five-point Likert scale. Significant differences between conditions are indicated by brackets (Significance levels: *α = 0.05, **α = 0.01, ***α = 0.001) and annotated with rank biserial correlation coefficients as effect size measures.
The linear mixed-effects models showed no significant interactions between person-related factors and the type of stimuli (MIR-V and Rand-V) in predicting the aesthetic experience, indicating that Hypothesis 4 cannot be confirmed. However, significant correlations emerged when the ratings were averaged across the two audiovisual conditions. While the musical characteristics of the Gold-MSI questionnaire show no relationships, all factors of the AeR questionnaire show at least one positive significant correlation. Specifically, these were observed between “creative behavior” and “animation,” “creative behavior” and “nostalgia/relaxation,” “aesthetic appreciation” and “epistemic emotions,” “aesthetic appreciation” and “synchrony,” “intense aesthetic experience” and “epistemic emotions,” “intense aesthetic experience” and “animation,” “aesthetic receptivity” and “animation,” and “aesthetic receptivity” and “epistemic emotions”. Table 2 provides an overview of all significant relationships.
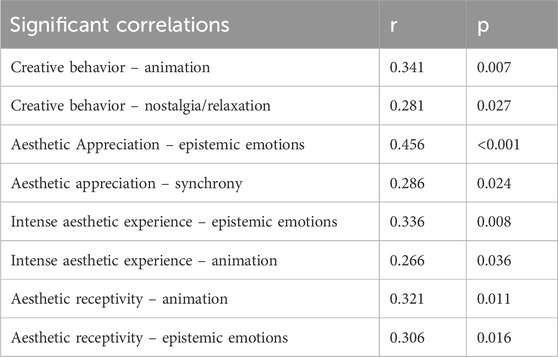
Table 2. Significant Spearman correlations between person-related factors and ratings averaged across musical conditions.
A total of 289 codes were extracted which were divided into seven overarching themes: Positive feedback, suggestions for improvement and criticism, perception of the overall performance, comparison of both conditions, associations, future formats, and miscellaneous. Furthermore, the different themes were divided into various sub-themes, which are presented in more detail below. However, due to the diverse aspects covered under the miscellaneous topic area, this will not be further discussed.
In addition to a generally high level of enthusiasm due to the novelty of the format (56 codes), the integration of the visual elements into the space was rated as positive (13 codes). It was also emphasized that the visualization contributed to a better understanding of the music (14 codes). Participants felt, for example, that they could “better concentrate on the individual components in the music” and “were more intensively engaged with individual notes that they might not have noticed otherwise. In addition, some participants judged that “the electronic sounds became more comprehensible through the visualization” and the “dramaturgy of the piece became visible”.
In the rhythmic part of the MIR-V in particular, some participants perceived certain elements as out of sync and described as “slightly lagging” in relation to the music (7 codes). It was also suggested that an interaction between the performer and the visual elements could be interesting (5 codes) and felt that the lighting in the room should be darker (9 codes).
The majority of participants focused primarily on the visual elements, with the performer receding into the background (24 codes). While some participants felt that the visual elements were depicted much more sharply than the performer and thus came to the forefront (5 codes). Others perceived the performer and the visualizations as a cohesive whole (7 codes) or reported continuously shifting their focus between the two (5 codes). Others described the performer as a conductor that directed and controlled the visualizations (10 codes).
MIR-V was described as more energetic (8 codes), more harmonious (10 codes), more synchronous (11 codes), more calming (5 codes), but also more hectic and chaotic (8 codes). Some participants also mentioned that “the music was easier to get into” (4 codes). In contrast, others felt that no connection with the music could be established for Rand-V (5 codes). Furthermore, Rand-V was judged as more relaxed (5 codes) and more harmonious (3 codes). It should also be noted that a significant difference described by many respondents was the distinct color scheme of the two stimuli (35 codes). Furthermore, some participants mentioned that the music of MIR-V was perceived as faster (5 codes), while others believed that the two stimuli were different musical pieces (3 codes).
Some respondents described the performance as trance-like and drew comparisons to drug influences (11 codes), while others compared it to classic music visualizers such as the iTunes Visualizer (Lipscomb and Kim, 2004) due to its aesthetic characteristics (9 codes).
Most participants can imagine such a concert format in the future, although wearing an HMD is seen as problematic due to poor video quality, the weight of the glasses, and the lack of social interaction (51 codes). Based on the current state of the art, some participants saw potential in smaller and more experimental concert format (4 codes) or as an extension for headphone concerts (4 codes). Participants also expressed the desire to experience such concerts and visualizations in their own living room (4 codes).
The present study describes the development of a music visualization in mixed reality in the context of a live music performance and explores its impact on the audience’s aesthetic experience. Whereas research on paintings presents contradictory findings and studies on dance performances consistently demonstrate that incongruency enhances enjoyment, research on music videos and music visualization indicates that congruence typically fosters greater appreciation. To further test the robustness of these findings in the context of music visualization, the present study examined the influence of a music visualization controlled by MIR methods on the aesthetic experience in more detail. One visualization was driven by real-time audio analysis (MIR-V) and considerations of crossmodal correspondences, while the other visualization featured the same visual elements but with random changes of color and movement (Rand-V). As expected, results indicate that MIR-V was perceived as more synchronous and color-accurate than Rand-V, confirming hypotheses Hypothesis 1 and Hypothesis 2. The results further align with previous studies dealing with music and paintings, where participants frequently perceived differences in terms of audiovisual regularity and complexity (Fink et al., 2023; Rančić and Marković, 2019). While these studies show contradictory results regarding the aesthetic experience of audiovisual stimuli, the findings of this work provide further evidence that congruence rather than incongruence between music and visual displays enhance the aesthetic experience, thus confirming the robustness of previous studies regarding music visualization and music video. More precisely, MIR-V achieved significantly higher ratings for the factor “prototypical aesthetic emotions,” which includes items such as “I was impressed,” “I was moved,” and “I liked it”. There were also significant differences regarding the factor “animation” subsuming items such as “Motivated me to act,” “Spurred me on” or “Energized me”. The significant difference of the factor ‘animation’ is further supported by trends observed in the evaluation of the interview questions, where participants described MIR-V as more energetic, faster, and more hectic, but also more synchronous and harmonious in the overarching comparison of both stimuli. No significant differences, by contrast, were found for the factors “epistemic emotions,’ “negative emotions” and “nostalgia/relaxation”. The aim of the AESTHEMOS questionnaire was to develop a domain-general measure of aesthetic emotions, including those that do not bear a strong similarity to the prototypical aesthetic emotions (Schindler et al., 2017). Given this broader scope, the confirmation of Hypothesis 3 is supported by the fact that the factor ‘prototypical aesthetic emotions’ encompasses the central aesthetic emotions. “These emotions capture aesthetic appreciation irrespective of the pleasingness (in terms of purely positive affective valence) of the aesthetic experience” (Schindler et al., 2017). The significant difference regarding the factor “animation” likely stems from the synchronization in MIR-V, as well as the programming of randomized values in MIR-Rand. The randomized values controlling Rand-V were generated quickly with random time intervals, but the resulting movement variations may not have been as fast as those observed in MIR-V. This is due to some successive randomized values being generated in closer proximity to each other, which might have resulted in less noticeable differences in deflection of the visual elements.
A major limitation of the study that should be discussed is that even though the differences between the audiovisual conditions are significant, both MIR-V and Rand-V were perceived positively and the difference in ratings between the two versions is small. This may be because, also in Rand-V, the visual elements associated with each instrument group were displayed only when the corresponding instruments were audible in order to preserve the composition’s dramaturgy. Consequently, a certain level of audiovisual consistency was maintained with Rand-V, even though the movement of the visual elements was randomized. Additionally, the novelty of the approach, along with the generally high level of enthusiasm among participants, as revealed by the interview analysis, may have contributed to the positive evaluation of both conditions. Due to the small difference in ratings, it can be argued that Rand-V might not have served as an accurate baseline visualization for deriving more generalizable results. Therefore, the findings of the study apply only to the specific music visualization created for the experiment, and the small difference in ratings between the respective stimuli might undermine the convincingness of the results. From an industry and production perspective of new immersive concert formats, it could be argued that using complex real-time MIR may not be worth the effort, considering production costs and technical complexity. A more robust baseline might involve even randomizing the display of the visual elements associated with each instrument group to ensure complete randomization. Additionally, it should be noted that the study used a solo guitar performance that simulated different instrument groups through live-looping techniques. Therefore, the experimenter was the only musician present, and much of the music was not clearly connected to his visible actions. This was done for practical reasons, as engaging a musical ensemble to spend a whole week in the laboratory would have been barely feasible. However, caution should be advised when generalizing the findings of this study to performances featuring a full band lineup, singing, or an orchestra. In these settings, there is usually a clearer relationship between the music and the performers’ actions and movements, which might alter the aesthetic judgement of the overall music performance and increase the risk of competition for attention between the performance of the musicians and the visualization.
While visual design choices in many previous studies have not been extensively discussed, the underlying work integrated crossmodal correspondences as a theoretical foundation for aligning visual elements with extracted MIR audio features. Another limitation is that, despite MIR-V being rated as more synchronous and color congruent, no conclusions can be drawn about the specific impact of single audiovisual mappings on the evaluation. For example, it cannot be inferred from the collected data whether the combination of pitch and position, timbre and form, or loudness and size had a significant impact on the aesthetic experience. Additionally, the interview responses suggest that the coloring of the visual elements were often perceived as a significant difference between the two conditions and could therefore have significantly influenced the ratings. Nevertheless, the overall improvement in synchrony indicates that the crossmodal correspondences used in combination with the audio features were effective guidelines for designing audiovisual stimuli. Therefore, they should be considered and examined more thoroughly in future studies. A literature-based summary of correspondences beyond those addressed in this paper would provide the opportunity to facilitate theory-driven design of audiovisual stimuli through additional guidelines, and potentially integrate these into existing frameworks (see Turchet et al., 2021 for relevant publications) for designing XR experiences. In addition, the developed RAS provides a tool for the translation of the two sensory modalities that has significantly simplified the development and design of the audiovisual composition. To meet the requirements of future studies on live performances, the software should be enhanced by incorporating additional audio features, implementing filters for audio pre-processing, and integrating a digital multiplex (DMX) interface. In future studies, a comprehensive evaluation of the RAS and the overall system architecture could be conducted, incorporating methodologies from references such as Olowe et al. (2017a) and Graf et al. (2021).
Considering the influence of personal characteristics on the aesthetic experience including differences between conditions, no significant relationships were found which would provide empirical support of Hypothesis 4. These were only observed if the ratings were collapsed across the two conditions. For example, it was found that the AeR’s overarching factor ‘aesthetic receptivity’ showed a small but significant positive correlation with the AESTHEMOS factor ‘epistemic emotions’ including items such as “Challenged me intellectually” or “Was mentally challenging”. This is in line with the findings of Furnham and Walker (2001), which demonstrated that personal attributes such as art education and the frequency of visits to art galleries are associated with more positive ratings of abstract paintings. Schindler et al. (2017) also point out the possibility that domain experts might show more intense epistemic emotions than novices. Additional factors contributing to these relationships, such as the cognitive styles of music listening (Kreutz et al., 2008), could be explored in future studies. It should also be noted that, due to financial and technical constraints, the musical performance was presented to only one person at a time. The extent to which MR glasses and music visualizations influenced social aspects of the performance could therefore not be assessed. Rietveld et al. (2013), for example, addressed this issue and argued that enhancing visual elements in a club context could negatively impact the collective experience. Furthermore, it is worth mentioning that the musician knew a few people participating in the study, which may have had a minor impact on the participants’ ratings. To fully capture the concert experience, future studies should draw on the methodological approaches proposed by Wald-Fuhrmann et al. (2023). Here, among other factors, social interaction, liveness, and affective pre- and post-effects were examined in relation to different concert formats. These aspects define the current scientific discourse in concert research and should also be considered when developing new concert formats. Additionally, insights from computational modeling of expressive musical performances (Cancino-Chacón et al., 2018; Bontempi et al., 2023) could inform novel approaches and methodologies in feature selection, mapping strategies, and performance automation, leading to more sophisticated interactive expressive systems across diverse contexts. Building on this, the insights gained could also be valuable for enhancing audience engagement through visualizations, which could be further explored in future studies.
Additional aspects related to the overall MR experience were predominantly captured through the evaluation of interview responses. It became clear that the participants devoted most of their attention to the visual elements, and not on the performer. One contributing factor may be the dominance of the visualizations, which constituted a substantial portion of the overall experience. Another might have been the used HMD’s rather poor quality of the video displaying the real environment. While the visual elements were sharp, the performer appeared slightly blurred due to the HMD’s camera resolution. Here, participants suggested spotlights in the performance space or an interaction between the performer and the visual elements as potential solutions. While the latter could be a potential future approach, performance space illumination is currently problematic due to technical constraints as, in room with only a few spotlights and other areas kept in dark, the video quality of the MR headset would be expected to further deteriorate.
Another aspect that should be addressed is the asynchrony in the rhythmic part of MIR-V mentioned by some participants. With a buffer size of 512 samples and a sampling rate of 48 kHz, the maximum latency before detecting an onset was approximately 11 milliseconds. In addition, during the experiment, Libmapper only transmitted OSC data into the network every 16 milliseconds. It should also be noted that Unity’s frame rate can vary due to complex calculations, which can result in additional delays. As a result, the cumulative latencies might have occasionally exceeded the JND threshold, at which prominent audiovisual stimuli may have been perceived as asynchronous. While a smaller buffer size is likely to lead to poorer accuracy of the MIR calculations, future studies should increase the frequency of data transmission by Libmapper and use only high-performance computers to avoid perceivable asynchronies. It should also be mentioned that some of the MIR algorithms, such as the onset algorithms or the pitch algorithm, were developed more than 20 years ago and may not align with state-of-the-art MIR. This field is nowadays dominated by Deep Learning methods (Steiner et al., 2021). To improve the results of the algorithms, future research should evaluate newer approaches for their applicability in real-time scenarios and compare them to the algorithms used in this study.
In conclusion, given the overall strong interest of participants in MR concerts and the impact of technical innovations on concerts, it can be anticipated that XR will play a significant role in the development of new concert formats. Accordingly, the findings presented in this paper should be expanded and explored through empirical research in future studies. This should include consideration of the aforementioned aspects to identify additional guiding principles for developing new concert formats in mixed reality.
The original contributions presented in the study are included in the article/Supplementary Material, further inquiries can be directed to the corresponding author.
The studies involving humans were approved by the Ethik-Kommission | Robert-Koch-Str. 9-11 | 45147 EssenMedizinische Fakultät der Universität Duisburg-Essen24-12025-BO. The studies were conducted in accordance with the local legislation and institutional requirements. The participants provided their written informed consent to participate in this study. Written informed consent was obtained from the individual(s) for the publication of any potentially identifiable images or data included in this article.
ME: Writing–original draft, Writing–review and editing. MvB: Writing–original draft, Writing–review and editing. JS: Writing-original draft, Writing-review and editing.
The author(s) declare that financial support was received for the research and/or publication of this article. Funded by the Deutsche Forschungsgemeinschaft (DFG, German Research Foundation) - 532148125 and supported by the central publication fund of Hochschule Düsseldorf University of Applied Sciences.
The authors declare that the research was conducted in the absence of any commercial or financial relationships that could be construed as a potential conflict of interest.
The author(s) declare that no Generative AI was used in the creation of this manuscript.
All claims expressed in this article are solely those of the authors and do not necessarily represent those of their affiliated organizations, or those of the publisher, the editors and the reviewers. Any product that may be evaluated in this article, or claim that may be made by its manufacturer, is not guaranteed or endorsed by the publisher.
The Supplementary Material for this article can be found online at: https://www.frontiersin.org/articles/10.3389/frvir.2025.1552321/full#supplementary-material
1https://github.com/libmapper/webmapper
3https://supercollider.github.io/
Adeli, M., Rouat, J., and Molotchnikoff, S. (2014). Audiovisual correspondence between musical timbre and visual shapes. Front. Hum. Neurosci. 8, 352. doi:10.3389/fnhum.2014.00352
Alonso-Jiménez, P., Bogdanov, D., Pons, J., and Serra, X. (2020). “Tensorflow audio models in Essential,” in IEEE international conference on acoustics, speech and signal processing (ICASSP), 266–270. doi:10.1109/ICASSP40776.2020.9054688
Arai, K., Hirao, Y., Narumi, T., Nakamura, T., Takamichi, S., and Yoshida, S. (2023). “TimToShape: supporting practice of musical instruments by visualizing timbre with 2D shapes based on crossmodal correspondences,” in Proceedings of the 28th international conference on intelligent user interfaces, 850–865. doi:10.1145/3581641.3584053
Bogdanov, D., Wack, N., Gómez, E., Gulati, S., Herrera, P., Mayor, O., et al. (2013). “ESSENTIA: an open-source library for sound and music analysis,” in Proceedings of the 21st ACM international conference on multimedia, 855–858. doi:10.1145/2502081.2502229
Bontempi, P., Canazza, S., Carnovalini, F., and Rodà, A. (2023). Research in computational expressive music performance and popular music production: a potential field of application? Multimodal Technol. Interact. 7 (2), 15. doi:10.3390/mti7020015
Braun, V., and Clarke, V. (2006). Using thematic analysis in psychology. Qual. Res. Psychol. 3 (2), 77–101. doi:10.1191/1478088706qp063oa
Bresin, R. (2005). What is the color of that music performance? International conference on mathematics and computing. Available online at: https://api.semanticscholar.org/CorpusID:15069605.
Cancino-Chacón, C. E., Grachten, M., Goebl, W., and Widmer, G. (2018). Computational models of expressive music performance: a comprehensive and critical review. Front. Digital Humanit. 5, 25. doi:10.3389/fdigh.2018.00025
Chiou, R., and Rich, A. N. (2012). Cross-modality correspondence between pitch and spatial location modulates attentional orienting. Perception 41 (3), 339–353. doi:10.1068/p7161
Correia, N. N., Castro, D., and Tanaka, A. (2017). “The role of live visuals in audience understanding of electronic music performances,” in Proceedings of the 12th international audio mostly conference on augmented and participatory sound and music experiences, 1–8. doi:10.1145/3123514.3123555
Cui, Y., Shan, X., and Chung, J. (2023). A study on the impact of modern technological development on the form of music concerts. Int. J. Internet, Broadcast. Commun. 15 (3), 88–93. doi:10.7236/IJIBC.2023.15.3.88
de Cheveigné, A., and Kawahara, H. (2002). YIN, a fundamental frequency estimator for speech and music. J. Acoust. Soc. Am. 111 (4), 1917–1930. doi:10.1121/1.1458024
Dharmapriya, J., Dayarathne, L., Diasena, T., Arunathilake, S., Kodikara, N., and Wijesekera, P. (2021). “Music emotion visualization through colour,” in 2021 international conference on electronics, information, and communication (ICEIC), 1–6. doi:10.1109/ICEIC51217.2021.9369788
Evans, K. K., and Treisman, A. (2010). Natural cross-modal mappings between visual and auditory features. J. Vis. 10 (1), 6–12. doi:10.1167/10.1.6
Fink, L., Fiehn, H., and Wald-Fuhrmann, M. (2023). The role of audiovisual congruence in perception and aesthetic appreciation of contemporary music and visual art. doi:10.31234/osf.io/76c32
Fonteles, J. H., Rodrigues, M. A. F., and Basso, V. E. D. (2013). Creating and evaluating a particle system for music visualization. J. Vis. Lang. and Comput. 24 (6), 472–482. doi:10.1016/j.jvlc.2013.10.002
Furnham, A., and Walker, J. (2001). Personality and judgements of abstract, pop art, and representational paintings. Eur. J. Personality 15 (1), 57–72. doi:10.1002/per.340
Graf, M., Opara, H. C., and Barthet, M. (2021). An audio-driven system for real-time music visualisation. J. Audio Eng. Soc. doi:10.48550/arXiv.2106.10134
Hauck, P., and Hecht, H. (2019). The louder, the longer: object length perception is influenced by loudness, but not by pitch. Vis. Basel, Switz. 3 (4), 57. doi:10.3390/vision3040057
Howlin, C., Orgs, G., and Vicary, S. (2017). “The impact of soundtrack congruency on the aesthetic experience of contemporary dance: exploring aesthetic interaction in terms of arousal and enjoyment ratings in three audio settings,” in Proceedings of the 25th anniversary conference of the European society for the cognitive sciences of music. Available online at: https://api.semanticscholar.org/CorpusID:34599086.
Howlin, C., Vicary, S., and Orgs, G. (2020). Audiovisual aesthetics of sound and movement in contemporary dance. Empir. Stud. Arts 38 (2), 191–211. doi:10.1177/0276237418818633
Hsiao, S.-W., Chen, S.-K., and Lee, C.-H. (2017). Methodology for stage lighting control based on music emotions. Inf. Sci. 412–413, 14–35. doi:10.1016/j.ins.2017.05.026
Jack, R. H., Mehrabi, A., Stockman, T., and McPherson, A. (2018). Action-sound latency and the perceived quality of digital musical instruments. Music Percept. 36 (1), 109–128. doi:10.1525/mp.2018.36.1.109
Kerby, D. S. (2014). The simple difference formula: an approach to teaching nonparametric correlation. Compr. Psychol. 3 (11). doi:10.2466/11.IT.3.1
Kreutz, G., Schubert, E., and Mitchell, L. A. (2008). Cognitive styles of music listening. Music Percept. 26, 57–73. doi:10.1525/mp.2008.26.1.57
Lerch, A. (2012). An introduction to audio content analysis: applications in signal processing and music informatics. IEEE Press. doi:10.1162/COMJ_r_00208
Limbert, W. M., and Polzella, D. J. (1998). Effects of music on the perception of paintings. Empir. Stud. Arts 16 (1), 33–39. doi:10.2190/V8BL-GBJK-TLFP-R321
Lin, C., Yeh, M., and Shams, L. (2022). Subliminal audio-visual temporal congruency in music videos enhances perceptual pleasure. Neurosci. Lett. 779, 136623. doi:10.1016/j.neulet.2022.136623
Lipscomb, S. D., and Kim, E. M. (2004). “Perceived match between visual parameters and auditory correlates: an experimental multimedia investigation,” in In proceedings of the 8th international conference on music perception and cognition, 72–75. Available online at: https://api.semanticscholar.org/CorpusID:45787623.
Malloch, J., Sinclair, S., and Wanderley, M. M. (2013). Libmapper: (A library for connecting things). CHI ’13 Ext. Abstr. Hum. Factors Comput. Syst., 3087–3090. doi:10.1145/2468356.2479617
Mazzanti, D., Zappi, V., and Brogni, A. (2014). “Augmented stage for participatory performances,” in Proceedings of the international conference on new interfaces for musical expression. Available online at: https://zenodo.org/records/1178871.
Meier, P., Schwär, S., Krump, G., and Müller, M. (2023). Real-time pitch estimation for creative music game interaction. DAGA. doi:10.18420/inf2023_97
Moffat, D., Ronan, D., and Reiss, J. D. (2015). “An evaluation of audio feature extraction toolboxes,” in Proceedings of the 18th international conference on digital audio effects (DAFx-15). Available online at: https://api.semanticscholar.org/CorpusID:3295745.
Moon, C. B., Kim, H., Lee, D. W., and Kim, B. M. (2015). Mood lighting system reflecting music mood. Color Res. and Appl. 40 (2), 201–212. doi:10.1002/col.21864
Müllensiefen, D., Gingras, B., Musil, J., and Stewart, L. (2014). The musicality of non-musicians: an index for assessing musical sophistication in the general population. PloS One 9 (2), e89642. doi:10.1371/journal.pone.0089642
Müller, M. (2015). Fundamentals of music processing: audio, analysis, algorithms. Applications. Springer International Publishing. doi:10.1007/978-3-319-21945-5
Nanayakkara, S. C., Taylor, E., Wyse, L., and Ong, S. H. (2007). “Towards building an experiential music visualizer,” in 2007 6th international conference on information, communications and signal processing, 1–5. doi:10.1109/ICICS.2007.4449609
Olowe, I., Barthet, M., and Grierson, M. (2017a). “FEATUR.UX: an approach to leveraging multitrack information for artistic music visualization,” in Proceedings of the 12th international audio mostly conference on augmented and participatory sound and music experiences, 1–5. Available online at: https://api.semanticscholar.org/CorpusID:15047369.
Olowe, I., Grierson, M., and Barthet, M. (2017b). “User requirements for live sound visualization system using multitrack audio,” in Proceedings of the 12th international audio mostly conference on augmented and participatory sound and music experiences, 1–8. doi:10.1145/3123514.3123527
Palmer, S. E., Schloss, K. B., Xu, Z., and Prado-León, L. R. (2013). Music–color associations are mediated by emotion. Proc. Natl. Acad. Sci. 110 (22), 8836–8841. doi:10.1073/pnas.1212562110
Parise, C. V., and Spence, C. (2012). Audiovisual crossmodal correspondences and sound symbolism: a study using the implicit association test. Exp. Brain Res. 220 (3–4), 319–333. doi:10.1007/s00221-012-3140-6
Perrotin, O. (2014). “Visualizing gestures in the control of a digital musical instrument,” in Proceedings of the international conference on new interfaces for musical expression. Available online at: https://zenodo.org/records/1178901.
Rančić, K., and Marković, S. (2019). The perceptual and aesthetic aspects of the music-paintings congruence. Vision 3 (4), 65. doi:10.3390/vision3040065
Reddy, G. S. R., and Rompapas, D. (2021). “Liquid hands: evoking emotional states via augmented reality music visualizations,” in Proceedings of the 2021 ACM international conference on interactive media experiences, 305–310. doi:10.1145/3452918.3465496
Rietveld, H., Attias, B., and Gavanas, A. (2013). DJ culture in the mix: power, technology, and social change in electronic dance music.
Russell, J. A. (1980). A circumplex model of affect. J. Personality Soc. Psychol. 39 (6), 1161–1178. doi:10.1037/h0077714
Sa, A., Caramiaux, B., and Tanaka, A. (2014). The fungible audio-visual mapping and its experience. J. Sci. Technol. Arts, 85-96 Páginas 6, 85. doi:10.7559/CITARJ.V6I1.131
Schindler, I., Hosoya, G., Menninghaus, W., Beermann, U., Wagner, V., Eid, M., et al. (2017). Measuring aesthetic emotions: a review of the literature and a new assessment tool. PLOS ONE 12 (6), e0178899. doi:10.1371/journal.pone.0178899
Schlotz, W., Wallot, S., Omigie, D., Masucci, M. D., Hoelzmann, S. C., and Vessel, E. A. (2021). The Aesthetic Responsiveness Assessment (AReA): a screening tool to assess individual differences in responsiveness to art in English and German. Psychol. Aesthet. Creativity, Arts 15 (4), 682–696. doi:10.1037/aca0000348
Scorolli, C., Naddei Grasso, E., Stacchio, L., Armandi, V., Matteucci, G., and Marfia, G. (2023). Would you rather come to a tango concert in theater or in VR? Aesthetic emotions and social presence in musical experiences, either live, 2D or 3D. Comput. Hum. Behav. 149, 107910. doi:10.1016/j.chb.2023.107910
Selfridge, R., and Barthet, M. (2019). “Augmented live music performance using mixed reality and emotion feedback,” in Proceedings of the 14th international symposium on computer music multidisciplinary research, 210–221. Available online at: https://hal.science/hal-02382500.
Stefani, D., and Turchet, L. (2022). “On the challenges of embedded real-time music information retrieval,” in Proceedings of the 25th international conference on digital audio effects. Available online at: https://www.dafx.de/paper-archive/details/LYb7opaG05nemAwGW6CRFA.
Steiner, P., Jalalvand, A., Stone, S., and Birkholz, P. (2021). “Feature engineering and stacked echo state networks for musical onset detection,” in 2020 25th international conference on pattern recognition (ICPR), 9537–9544. doi:10.1109/ICPR48806.2021.9413205
Subramaniam, A., and Barthet, M. (2017). “Mood visualiser: augmented music visualisation gauging audience arousal,” in Proceedings of the 12th international audio mostly conference on augmented and participatory sound and music experiences, 1–8. doi:10.1145/3123514.3123517
Sun, Y., Yao, L., and Fu, Q. (2024). Crossmodal correspondence mediates crossmodal transfer from visual to auditory stimuli in category learning. J. Intell. 12 (9), 80. doi:10.3390/jintelligence12090080
Taylor, R., and Torres, D. (2007). Real-time music visualization using responsive imagery. Available online at: https://api.semanticscholar.org/CorpusID:17329025.
Turchet, L., Fischione, C., Essl, G., Keller, D., and Barthet, M. (2018). Internet of musical things: vision and challenges. IEEE Access 6, 61994–62017. doi:10.1109/ACCESS.2018.2872625
Turchet, L., Hamilton, R., and Camci, A. (2021). Music in extended realities. IEEE Access 9, 15810–15832. doi:10.1109/ACCESS.2021.305293
Vroomen, J., and Keetels, M. (2010). Perception of intersensory synchrony: a tutorial review. Atten. Percept. and Psychophys. 72 (4), 871–884. doi:10.3758/APP.72.4.871
Wald-Fuhrmann, M., O’Neill, K., Weining, C., Egermann, H., and Tröndle, M. (2023). The influence of formats and preferences on the aesthetic experience of classical music concert streams. Psychol. Aesthet. Creativity, Arts. doi:10.1037/aca0000560
Weinel, J. (2020). “Cyberdreams: visualizing music in extended reality,” in Technology, design and the arts—opportunities and challenges. Editors R. Earnshaw, S. Liggett, P. Excell, and D. Thalmann (Springer International Publishing), 209–227. doi:10.1007/978-3-030-42097-0_12
Whiteford, K. L., Schloss, K. B., Helwig, N. E., and Palmer, S. E. (2018). Color, music, and emotion: bach to the blues. I-Perception 9 (6), 2041669518808535. doi:10.1177/2041669518808535
Woolson, R. F. (2008). “Wilcoxon signed-rank test,” in Wiley encyclopedia of clinical trials (John Wiley and Sons, Ltd), 1–3. doi:10.1002/9780471462422.eoct979
Young, J., Thompson, S., Downer, H., Allen, B., Pantidi, N., Stoecklein, L., et al. (2022). “TeleFest: augmented virtual teleportation for live concerts,” in ACM international conference on interactive media experiences, 69–78. doi:10.1145/3505284.3529968
Was impressed, Felt deeply moved, Baffled me, Liked it, Fascinated me, Touched me, I found it beautiful, Surprised me, Challenged me intellectually, Was mentally engaged, Made me curious, Motivated me to act, Spurred me on, Energized me, Felt something wonderful, I found it distasteful, Felt confused, Made me aggressive, Was unsettling to me, Felt indifferent, Worried me, Made me feel sentimental, Calmed me, Relaxed me.
I spend a lot of my free time doing music-related activities, I often read or search the internet for things related to music, Music is kind of an addiction for me - I couldn’t live without it, I have never been complimented for my talents as a musical performer, I can play _ musical instruments, I would not consider myself a musician, I find it difficult to spot mistakes in a performance of a song even if I know the tune, I can tell when people sing or play out of time with the beat, I can tell when people sing or play out of tune, When I sing, I have no idea whether I’m in tune or not, I am able to hit the right notes when I sing along with a recording, I am not able to sing in harmony when somebody is singing a familiar tune.
I visit museums or go to musical/dance performances, I notice beauty when I look at art, I am emotionally moved by music, When viewing artistic works, I am impressed by their harmony, I sculpt, paint, draw, direct films, or do design work, When I look at art, I feel positive energy or invigoration, I write poetry or fiction, When I look at art, my heart beats faster, I perspire, get dizzy, or have other physical effects, I appreciate the visual design of buildings, Presently (or in the past) I take (or have taken) classes in art, creative writing, or aesthetics, I experience awe, fear, or a feeling of being overwhelmed when I look at art, When viewing artistic works, I feel a oneness, unity, or connectedness with the universe/nature/existence/my deity, I am deeply moved when I see art, I experience joy, serenity, or other positive emotions when looking at art.
To what extent did you feel that there was a congruence between the music and the visual elements? In your opinion, how well did the visualization complement the music? Did the visual elements synchronize with the music? Did the colors of the visual elements match the music? Did the colors of the visual elements match the mood of the music?
Keywords: music visualization, mixed reality, real-time audio analysis, music information retrieval, aesthetic experience, concert formats
Citation: Erdmann M, von Berg M and Steffens J (2025) Development and evaluation of a mixed reality music visualization for a live performance based on music information retrieval. Front. Virtual Real. 6:1552321. doi: 10.3389/frvir.2025.1552321
Received: 27 December 2024; Accepted: 28 February 2025;
Published: 19 March 2025.
Edited by:
Andrea Sanna, Polytechnic University of Turin, ItalyReviewed by:
Hu Xin, City University of Macau, Macao SAR, ChinaCopyright © 2025 Erdmann, von Berg and Steffens. This is an open-access article distributed under the terms of the Creative Commons Attribution License (CC BY). The use, distribution or reproduction in other forums is permitted, provided the original author(s) and the copyright owner(s) are credited and that the original publication in this journal is cited, in accordance with accepted academic practice. No use, distribution or reproduction is permitted which does not comply with these terms.
*Correspondence: Matthias Erdmann, bWF0dGhpYXMuZXJkbWFubkBocy1kdWVzc2VsZG9yZi5kZQ==
Disclaimer: All claims expressed in this article are solely those of the authors and do not necessarily represent those of their affiliated organizations, or those of the publisher, the editors and the reviewers. Any product that may be evaluated in this article or claim that may be made by its manufacturer is not guaranteed or endorsed by the publisher.
Research integrity at Frontiers
Learn more about the work of our research integrity team to safeguard the quality of each article we publish.