 Savannah L. Buchner
 Abigail Rindfuss
 Jennifer Wood
 Hanspeter Schaub
 Allison P. Hayman
- 1Bioastronautics Laboratory, Ann & H.J. Smead Department of Aerospace Engineering Sciences, University of Colorado, Boulder, CO, United States
- 2Autonomous Vehicle Systems Laboratory, Ann & H.J. Smead Department of Aerospace Engineering Sciences, University of Colorado, Boulder, CO, United States
Introduction: Remote supervision and monitoring of autonomous systems is an important modality for future operations including spaceflight, manufacturing, and transportation. However, monitoring presents many challenges for the operator, which may be reduced through novel interfaces and display design. Virtual reality (VR) shows promise for direct control teleoperation paradigms, but it is unclear if VR is useful for future supervisory paradigms that will primarily involve monitoring systems rather than directly controlling them. This paper investigates the impacts of 3D visualizations and VR in displays for the remote monitoring of a satellite servicing mission.
Methods: Three different displays, with different degrees of 3D visualizations and immersion, are compared through human subject testing (n = 33) on factors of situation awareness, workload, usability, and subjective utility. These displays include an immersive, visualization based VR display, a non-immersive screen-based 3D visualization, and a nonimmersive, non-visualized baseline display.
Results: Visualizations improve level 2 (comprehension, p = 0.009) and level 3 (projection, p = 0.014) situation awareness, and VR reduces level 1 situation awareness (perception, p < 0.005). No differences are found among workload, usability, and utility; however, the results of subjective utility are trending towards significance (p = 0.069).
Discussion: This research indicates there are benefits to including visualizations for display design for remote monitoring of satellites, but these initial results find little evidence that VR provides additional benefits.
1 Introduction
Remote supervision of autonomous agents where a human operator is working remotely with an autonomous system to achieve a shared goal is a challenging yet important modality for future exploration or operational environments, including spaceflight, undersea robotics, manufacturing, and transportation. These environments are characterized by highly trained operators, where there are often consequences to safety and performance due to improper action, particularly when there is uncertainty in the state of the system. During supervisory control, human operators spend the majority of their time monitoring autonomous agents, and only a small portion of their time providing intermittent inputs to the system. Monitoring is critical for understanding system states, anticipating future issues, and quickly detecting and responding to failures (Sheridan, 2012), and is the portion of supervisory control of interest in this work. Monitoring requires operators to process complex data from many sources, often without the environmental context afforded to traditional modes of operation (Cummings et al., 2019). Remote operations are especially challenging because operators are separated spatially and/or temporally from the environment they seek to control. Thus, the operator’s perceptual processing abilities are decoupled from the physical environment (Chen et al., 2007), which creates a host of new challenges for human information display, including compromised situation awareness (SA). (Chen et al., 2007; Endsley, 2000). SA can be defined as having three levels where level 1 is “the perception of critical elements in the environment”, level 2 is “the comprehension of their meaning” and level 3 is “the projection of their status into the future” (Endsley, 1988). Low SA can make operations a difficult and cognitively challenging task, reducing mission effectiveness and task completion.
Spaceflight operations is one such monitoring application that is becoming increasingly important and has been chosen as the basis of this paper. Beyond the challenges described above, rendezvous missions and in-orbit servicing of satellites is an area of increasing interest and research focus for spacecraft owners and operators. On-orbit servicing requires satellites working in close proximity, with approach orbits controlled by complex, non-intuitive flight dynamics, and the relative motion sensing is impacted by time-varying lighting and space environment conditions. The close proximity of the satellites during a servicing mission increases the risk of collision. This risk is exacerbated by the uncertainty introduced by imperfect knowledge of the state of the satellites on-orbit (i.e., their exact positions, velocities, and orientations.) The close proximity reduces decision times compared to standard operations, particularly for the timing of collision avoidance maneuvers which may be required to be performed in seconds (Sellmaier and Frei, 2022).
One identified key necessity for next-generation supervisory control rooms is the development of a system capable of managing large volumes of data and presenting it in a way that enhances SA (Sim et al., 2008). Currently, spaceflight displays involve densely packed telemetry data. 2D graphical representations of system status, such as an orbital component vs. time, may be shown on occasion (Sim et al., 2008). These displays present information on 2D monitors, where human operators interact with the system using keyboards and mice. This can increase workload for operators, especially when the work involves processing and interacting with 3D data on a 2D screen (Bualat et al., 2013; Dan and Reiner, 2017; Woods and David, 2011). Thus, for spaceflight and similar operational environments, there is a need for improved understanding and SA, which VR or 3D visualizations may be able to provide. However, there is a gap in the literature in understanding how these display changes can affect spaceflight operations.
Virtual reality (VR), has been proposed as an alternative to traditional 2D display interfaces in many situations that would benefit from increased immersion in the environment and 3D interactions. Such displays increase telepresence, which is the feeling of being present in an environment other than where one is physically (Sheridan, 1992). VR may enhance performance through the improvement of perception, increased field of view, and the ability to change viewpoints without the loss of telepresence (Chen et al., 2007; Tittle et al., 2002; Elor et al., 2021). The ability to change viewpoints (i.e., teleportation) offers improvements in performance over a fixed viewpoint but comes with the risk of increasing cognitive load (Naceri et al., 2021). Furthermore, the ability to increase the field of view through natural head motions in VR can help improve collision avoidance and understanding of future vehicle states over the reduced field of view 2D displays. In prior work, immersive displays has been studied in the context of data visualizations and immersive analytics, and have been shown to improve estimations of depth, size, distance, cluster identification, and trajectories (Kraus et al., 2020; Whitlock et al., 2020; Kraus et al., 2022; Etemadpour et al., 2013; Hurter et al., 2019), further promoting the hypothesis that VR may be useful for operational monitoring.
Most of the prior research into using VR and remote operations has focused on direct teleoperation, where the human operator manipulates or controls a robot (Chen et al., 2007; Dima et al., 2019; Wilde et al., 2014; Naceri et al., 2021; Whitney et al., 2020a). This includes situations such as operating undersea robots (Elor et al., 2021), remotely driving a car (Hosseini and Lienkamp, 2016), or remotely manipulating robotic arms (Whitney et al., 2020a). Whitney et al. (Whitney et al., 2020a) found that using VR to complete a teleoperation task with a robotic arm led to faster completion time, lower workload, and improved usability compared to traditional monitor and keyboard interfaces. Similarly, Elor et al. concluded that stereoscopic VR displays led to faster completion times, increased usability, and increased perceived presence and performance over desktop displays in an underwater capture task. However, no differences were found in other metrics of workload (Elor et al., 2021).
Consistently, studies found that VR displays can improve depth perception and collision avoidance and lead to faster task completion, increased sense of presence, increased usability, and reduced perceived effort compared to the 2D displays (Chen et al., 2007; Tittle et al., 2002; Elor et al., 2021; Whitney et al., 2020a). However, there are mixed results on the effects of VR on task performance. For example, some studies find VR does not change workload (Elor et al., 2021) while others reported a decrease (Whitney et al., 2020b; a). With regards to SA, some studies have found improvements (Hosseini and Lienkamp, 2016), while others have reported no differences (Read and Saleem, 2017) between VR and screen displays. Some of these differences may be attributed to display design choices as there is a lack of validated design principles for VR operations and ineffective display design choices may result in reduced performance. In addition, the task type or complexity may also influence the outcome, as VR may not be appropriate for all direct control tasks.
A gap in prior work is the use of VR for remote supervisory and monitoring operations, particularly with a lack of research on satellite operations. The direct control paradigms that have been studied in depth may not be appropriate for all future operations, such as spaceflight, where time delay and bandwidth limitations inhibit direct control. Instead, autonomous systems are capable of performing many of the tasks needed while operators act in a supervisory control modality (Sheridan, 2021). Although there has been limited work assessing VR for monitoring, some of the benefits seen with direct control, such as improved collision avoidance, may still apply. However, other benefits may not be as applicable due to the differing control authority and cognitive demands on the operator. Manual control tasks tend to have higher workload (Hooey et al., 2018), which VR has been shown to reduce (Whitney et al., 2020b; a). Unlike direct control, monitoring tasks already have a low workload (Hooey et al., 2018) so VR might not reduce it further (Lager and Topp, 2019). However, it is still important to study VR for monitoring tasks, as successful monitoring relies heavily on an operator’s SA which VR may improve.
VR has been proposed for use in operations for many monitoring control rooms, such as for spaceflight (Sittner et al., 2023), maritime (Lager and Topp, 2019; Tsigkounis et al., 2021), and air traffic control (Cordeil et al., 2016; Gorbunov and Nechaev, 2022). While there has been research focusing on these monitoring applications using augmented reality (van den Oever et al., 2024; Torres et al., 2024; Rohacs et al., 2016; Reisman and Brown, 2006; Bagassi et al., 2024), or for training (Moesl et al., 2023), there have been limited experimental studies into VR for operations, particularly for spacecraft operations. Lager et al. compared the use of traditional 2D GUI, 3D screen-space GUI, and 3D VR GUI to remotely monitor autonomous surface vehicles and found that users were better able to detect collisions and had improved SA in both the 3D and VR displays compared to the 2D display. The 3D GUI had significantly reduced cognitive load (as measured through a proxy variable of a secondary task) compared to both the VR GUI and 2D GUI. However, participants subjectively felt that if they had many hours of training, the VR display would be best for the task, indicating that VR has the potential for monitoring applications (Lager and Topp, 2019). Other research has studied VR for maritime control room monitoring and has found that VR could replace complex monitoring dashboards (Tsigkounis et al., 2021). Although an experiment was conducted, no comparisons were made between VR and current maritime traditional displays, representing a gap in VR monitoring research and understanding how VR can facilitate improvements. A different study comparing VR to physical displays for the monitoring of autonomous cars found that VR increased task load and simulator sickness, and decreased usability (Kalamkar et al., 2023). However, the authors acknowledge that these differences are likely attributed to the hardware used (i.e., headset weight and resolution) and the fact that their VR display was not designed or optimized for use in VR, indicating that it is important to design with VR in mind. Finally, for air traffic control applications, VR has been demonstrated to reduce the number of errors and aid in identifying dangerous situations compared to the typical 2D view controllers see (Gorbunov and Nechaev, 2022), but no comparison was made to a 3D view, making it unclear if the benefits come from increased immersion or 3D visualizations.
While VR has promise as an operational display, there are also limitations present. Most of the current VR displays lack the resolution to display large blocks of text in a readable and understandable way, indicating that it is important to ensure text is readable before use. Interaction and selection techniques, such as controllers or raycast, can also be adjusted given design needs. However, using an inappropriate choice can result in selection errors, longer competition time, and decreased usability (Wentzel et al., 2024; Luong et al., 2023), resulting in a need to ensure the controls are appropriate. In addition, information overload and misinterpretation of the data are possible in a VR-based environment representation (Van de Merwe et al., 2019), especially with large chunks of data. As such, it is critical to verify that users are able to correctly interpret the data. Finally, operator buy in and susceptibility to cybersickness are influenced by display design choices, including viewpoint selection, field of view, amount of control over the environment, and headset properties (van Emmerik et al., 2011; Davis et al., 2014). Some of these limitations are due to hardware properties and are actively improving as technology progresses, but must still be considered to ensure current operational use and operator buy in. These limitations also necessitate subjective user evaluations of new displays to ensure the usability is not compromised.
The objective and contribution of this research is to compare the effects of 3D visualization and VR on a remote operator’s understanding of uncertainties using a specific application: monitoring of a satellite during operations. We focused only on monitoring tasks as it is how the operator spends the majority of their time during remote supervision and has critical implications towards being able to take appropriate actions. Throughout this work, the term visualization refers to the presentation of data in a simulated system representation, as opposed to plots of raw telemetry values. Immersion is defined as “the extent to which the computer displays are capable of delivering an inclusive, extensive, surrounding and vivid illusion of reality to the senses of a human participant” (Slater et al., 1996). In this work immersion is provided through head-mounted display VR. This work considers three displays with varying degrees of visualization and immersion, and their effects on SA, workload, usability, and subjective understanding of uncertainties. We hypothesize that 3D visualizations will improve SA, lower workload, and improve usability and subjective utility over displays without 3D visualizations. We further hypothesize that immersive displays, such as VR, will provide additional benefits over 3D visualizations.
2 Methods
In this research, three displays of increasing levels of visualization and immersion are designed and implemented to simulate the remote monitoring of spacecraft operations. The simulated remote monitoring task is a rendezvous mission scenario in which a servicer approaches a target vehicle, performs corrective burns, and changes its orientation to inspect the target. The three display designs are compared through a human subject evaluation.
2.1 Scenario design
Participants were tasked with monitoring the proximity operations portion of a satellite rendezvous mission. The underlying trajectories used for the simulation were developed using Basilisk, a high fidelity, flight-proven, physics-based satellite simulation tool (Kenneally et al., 2020)1. The scenario consists of two satellites in orbit around Earth: a non-operational, tumbling, debris satellite and an active servicer satellite, supervised by a remote operator, sent to inspect the debris satellite. The debris satellite has no communications, fuel, or battery, thus there is uncertainty in its location.
The scenario is broken into three phases. Pre-burn, the servicer satellite is approaching the debris satellite on a parallel orbit. There are checks to ensure that the thruster plume from the burn will not impinge on the debris satellite. The servicer burns and enters an orbit to inspect the satellite. This orbit is no longer parallel to the debris satellite, and instead the servicer satellite spiral about the debris satellite with some out-of-plane motion. In the post-burn, pre-sensor update phase, there is uncertainty in the servicer satellite’s current location and future location due to uncertainty in the magnitude and direction of the delta-v imparted by the thruster burn. The combination of this and the debris satellite state uncertainty leads to a potential for collision. As the scenario continues after the thruster burn, the knowledge of the servicer satellite of its position relative to the debris satellite improves, simulating the gathering of data from sensor updates. The gathered data results in a reduction of both uncertainties, which leads to a change in collision risk. Although in a real rendezvous scenario, the satellite operations would continue, in this trial post sensor update the participants’ scenario is terminated after a randomly assigned length of time. The duration of the rendezvous simulation as experienced by an operator is compressed, with 15 s of simulation time displaying per 1 s of the operator’s real world time.
2.2 Display design
Three different displays were designed for this experiment to investigate the impact of 3D visualization of data and immersion of display, as seen in Table 1 and Figure 1. The VR display was designed first and then modified to make the other two displays. All displays were designed with a consistent focus on using relevant display design principles to ensure readability (i.e., legibility, contrast, minimizing information access cost) and interpretability (i.e., avoiding absolute judgment limits (Wickens et al., 2013)) so that the results are not skewed due to fundamental differences in how they were developed.
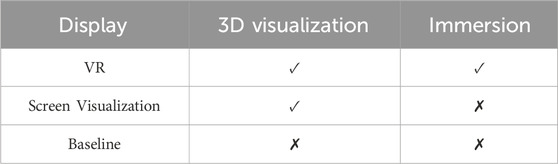
Table 1. Display designs on scales of 3D visualizations and immersion.
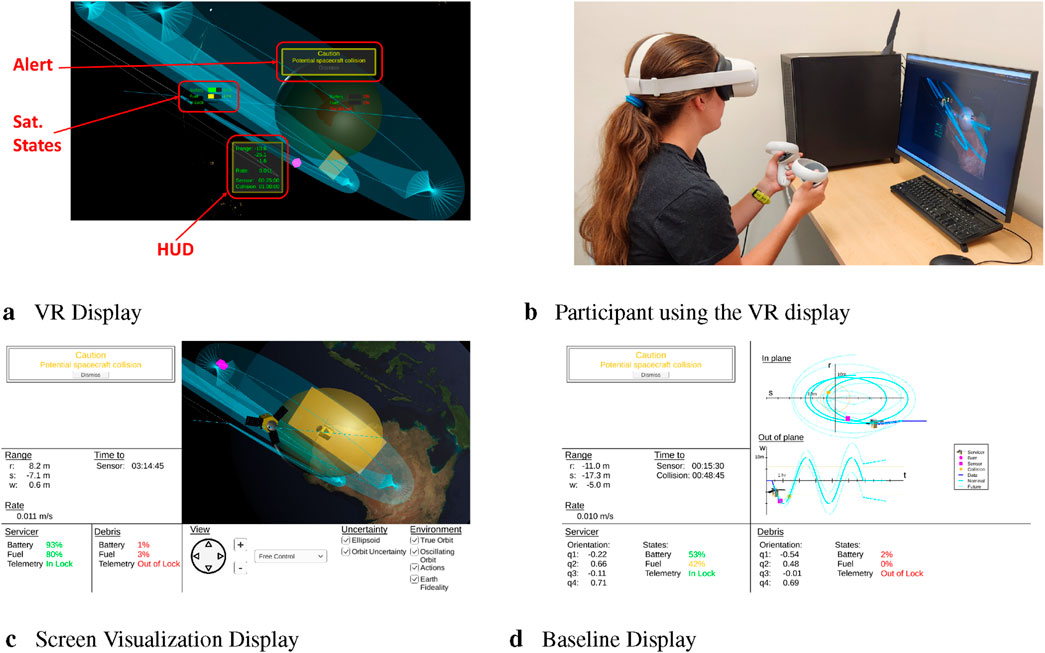
Figure 1. The three different display designs and an example participant (person shown is part of the research team) using the VR display. The VR display is annotated in red to show the location of the HUD, the satellite states text, and the caution and warning alerts. (A) VR display. (B) participant using the VR display. (C) Screen visualization display. (D) Baseline display.
The VR design philosophy was based on a combination of Heads Up Displays (HUD) (Iacovides et al., 2015; O’Hara and Fleger, 2020; Flightcrew alerting Part 25 Section 14 CFR, 2004), traditional aerospace displays guidelines (MIL-SPEC and FAA regulations) (O’Hara and Fleger, 2020; Flightcrew alerting Part 25 Section 14 CFR, 2004), and best practices for VR (Naceri et al., 2021; Wickens et al., 2000) and visualizations (Proctor and Zandt, 2017; Wickens et al., 2013). As seen in Figure 1A the VR consists of several parts. The underlying immersive visualization was built as an extension of Vizard, a spacecraft simulation visualization software application2 that provides the satellite models, relative orbit lines, location relative to Earth, and appropriate Earth-Sun lighting (Wood et al., 2018). Overlaying the relative orbit lines and satellites are transparent display objects designed to illustrate the uncertainties and locations of upcoming actions, including burns and sensor updates. The uncertainty of the servicer satellite’s future position is represented by a blue tapered extrusion along the curve of the projected orbit with increasing diameter representing increasing uncertainty. The ellipsoid surrounding the debris satellite denotes the uncertainty of its position and can be used to monitor the likelihood of a collision. Any overlap of these two uncertainty visualizations indicates a potential collision and is highlighted in the same color as the ellipsoid. The ellipsoid color is changed to indicate the level of concern to the operator. Yellow represents a caution, where there is a chance of collision but also the operator will still receive more information through a sensor update. Red represents a warning, where there is a chance of collision, but no chance of receiving new information from a sensor update. These colors are based off of the standard alert colors for aircraft displays (O’Hara and Fleger, 2020; Flightcrew alerting Part 25 Section 14 CFR, 2004).
The operator can change their viewpoint as desired through panning, zooming, and teleportation using the left VR hand controller. In addition, operators could change their view through natural movements like turning their head or body. The ability to change viewpoints or switch between preset viewpoints has been shown to improve performance and increase operator understanding of the environment as different perspectives may be beneficial for different aspects of a task (Naceri et al., 2021; Wickens et al., 2000).
In addition to visualization, critical information is displayed in text-based form (annotated in Figure 1A). A HUD panel displays information critical to the mission including the satellite’s relative ranges, rates, and time until the next action. The HUD is always in the same location relative to the VR headset; ensuring the HUD remains visible even if the operator turns their head. The HUD is located in the periphery of the operator’s vision allowing them to access the information through eye movements, minimizing the information access effort (Wickens, 1993) and blockage of the visualization. Location and text size were based on VR recommendations (Yao et al., 2014; Mckenzie and Glazier, 2017), and adjusted based on user evaluations for readability and accessibility during pilot testing. The satellite states, which are critical to a specific element of the mission, like battery, fuel, and telemetry status, are presented in text-based form and move along with their associated satellite. This difference in text display choices is attributed to the desire to minimize the amount of text in the HUD. While HUD are important to display critical information that an operator should always be aware of, they also reduce the immersion experiences in a VR display (Iacovides et al., 2015; Rosyid et al., 2021). Attaching text to elements in the scenario minimizes disruptions to immersion, and thus is a way to display text that may be important, but not required to always be visible (Marre et al., 2021; Caroux and Isbister, 2016).
Finally, cautions and warnings are displayed through an alert at the top of the screen. These alerts are triggered automatically based on certain events in the scenario, such as a warning about collision potential. The cautions and warnings are highlighted and presented in a salient location; designed to be easily noticed by the operator. Cautions and warnings and are color-coded yellow and red respectively. Like traditional spacecraft and aviation displays, the operator can dismiss these alerts (O’Hara and Fleger, 2020; Flightcrew alerting Part 25 Section 14 CFR, 2004). The dismissal of alerts is completed with the VR controller and allows the operator to regain areas of their visual field. The operators can interact with the display using a radial menu system to toggle on and off different aspects of the visualizations and displayed information, which was controlled through the right VR hand controller3. This allows the operator to customize their view in a way that allows them to hide information that is not currently relevant and to more clearly understand the information that is relevant. During development the VR display underwent evaluations where student volunteers were asked to perform a series of tasks. Then they commented on and used a six-point Likert scale to evaluate the display’s readability, controllability, and interpretability. This resulted in multiple iterations, until all scores were positive, to increasingly improve the text readability, display location, intuitiveness of the controls, and ensured that aspects of the visualization were interpretable.
The screen visualization display maintains aspects of visualization but does not have the immersion (i.e., presented on a 2D screen vs. in VR) that VR allows for and is seen in Figure 1C. It uses the same underlying visualization as the VR display, where the operator can still pan, zoom, and interact with the visualization components in a 3-dimensional manner, however, it is now on a 2D computer screen and thus not immersive. The HUD information, satellite states, and alerts that were previously in text form in VR are now displayed outside the visualization on the screen creating a consistent scan pattern for operators, and grouped with similar constructs.
Finally, the “baseline” display (Figure 1D) contains no visualization or immersion. All telemetry and system states are presented on a 2D display in graphical and textual form without 3-dimensional modeling or display components. This display is representative of traditional satellite monitoring displays used in current that primarily contain text-based information, but also includes graphs of telemetry, as consistent with current operations. It has the same text as the screen visualization layout, however, instead of the 3D visualization view, 2D graphs of the relative in-plane and out-of-plane orbits between the satellites are presented. Operators are unable to customize their viewpoint or interact with the baseline display.
The same information is available to the operator in all three displays, though the presentation of the information differs. Customization of the display by the operator is supported in both the VR and screen visualization displays, however there is no ability to control the satellites in any display. This remote supervision task addresses an important aspect of remote supervision by requiring the operators to continuously monitor the satellites without the ability to intervene.
2.3 Experimental protocol
The study was approved by the University of Colorado at Boulder Institutional Review Board (Protocol #23-0100). Informed consent was obtained from all participants. Thirty five participants from around the University of Colorado Boulder campus were enrolled. Two participants did not demonstrate an understanding of the task and did not finish data collection. Thus, 33 participants completed the experiment (15 Female, 18 Male; ages 18-57, median age 25 years). All participants were aware of the high-level project goals from the informed consent but naive to the alternative display conditions or exact manipulations of the scenario. Participants were screened for vision correctable to 20/20, no colorblindness, and a score of less than 90% on the Motion Sickness Susceptibility Questionnaire (Golding, 1998) as a means to identify individuals who would be highly susceptible to simulator sickness prior to data collection.
Participants were randomly assigned to one of the three display conditions: VR, screen visualization (Scr. Viz), and Baseline (11 participants per condition; 5 F, 6 M). Those in the VR condition wore a Meta Quest headset, while those in the other conditions used a computer and 2D monitor. Participants in VR had the option to sit in a spinning chair or stand and walk around. All opted for the chair, but often used head movements and body rotations, in addition to panning, to change their view. Participants in both screen conditions sat in a chair in front of the computer.
A flowchart of the experiment design can be seen in Figure 2. All participants completed a demographic questionnaire on their background including familiarity with orbital mechanics, familiarity with spacecraft operations, and prior VR experience. Participants were then trained using a PowerPoint presentation. The presentation covered any background orbital and operational knowledge needed to be able to complete the experiment. It also provided context for the scenario they would experience, and values specific to the satellites they would be monitoring (e.g., amount of fuel needed to complete a burn). They were also trained on the specifics of the display modality they were assigned to. After the training PowerPoint, participants were quizzed to ensure an understanding of the scenario and tasks they would perform. They then completed two training trials. The first trial provided an opportunity to become comfortable with the system controls and the location of items within the display. For this trial, there was no monitoring objective. When participants felt comfortable with the display, they were asked a series of questions to ensure they could find critical information and understand the visualization. The second training trial followed the format of a real trial. Participants had to achieve accuracy on the tasks and had to feel comfortable before moving on. These training trials were done to minimize the effect of participants being unfamiliar with the controls or task, rather than due to the display itself.
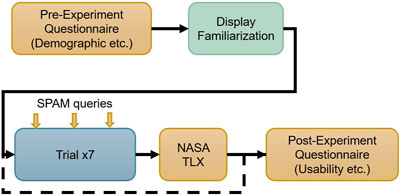
Figure 2. Experimental design flowchart. The orange boxes indicate data collection through surveys or queries.
After training, participants completed seven trials of the experiment. The order in which the participants saw the trials in was randomized; however, all participants experienced the same seven trials. Each trial used the same underlying orbits, but the uncertainty surrounding the debris, the uncertainty resulting from the servicer’s burn, and the location of the sensor update varied which varied the likelihood of collision of the two satellites. Additionally, the servicer satellite’s initial fuel and battery value varied. The length of each trial varied, but all trials were approximately 8 min long.
SA was measured throughout the course of the trial through two different mechanisms. Level 1 SA, or perception, was measured through SA callouts (Hainley et al., 2013; Karasinski et al., 2016): Participants were instructed to report the servicer’s battery and fuel values in 10% increments (e.g., 90%, 80%) and the time to any action (burn, sensor, collision) in 15 min increments (e.g., 15 min to burn). These values did not always change linearly; for example, the battery value would increase or decrease based on the orbital position of the satellite relative to the sun, and the fuel would change based on burns. Callouts made within 2 s of the actual event occurring were judged successful, while late callouts are considered missed. An experimenter marked callouts as they occurred; the callouts were then verified post-experiment from audio recordings. The number of total possible callouts varied per trial (between 15 and 21); however, the total percent correct of callouts made over all the trials was used in the data analysis to normalize the values across trials.
To understand level 2 and level 3 SA, the Situation Presence Assessment Method (SPAM) was used (Durso et al., 1998). This is a real time SA assessment method that is meant to mimic a control room and has been used often in other operational setting experiments, like air traffic control (Durso et al., 1999; Loft et al., 2013; 2015; Cunningham et al., 2015; Mirchi et al., 2015; Fujino et al., 2020). At three points throughout the trial, a beep was played. The location of the query was randomly selected within each of the 3 phases of the scenario. Participants were instructed to say ‘ready’ when they felt that they had a low enough workload to be asked queries. At this point, an experimenter would proceed to ask the participant two queries, one for SA level 2 and one for SA level 3. This mimics a second operator in a control room asking for information. The queries were randomly chosen from a list of potential queries. The list was generated through a process similar to goal directed task analysis (Endsley, 2000). Example questions include: “Is the servicer satellite currently in the sun?” (level 2), or “Will there be enough fuel to complete a burn at the time of the next burn?” (level 3). If a SA callout event occurred during a SPAM assessment, participants were instructed to not announce the SA callouts, and this was not counted against them when scoring Level 1 SA. For each SA level, the total percent of SPAM queries answered correctly was used in the data analysis.
After each trial participants assessed their workload through the NASA Task Load Index (TLX) (Hart and Staveland, 1988). They rated seven dimensions of their workload on a 21-point scale. This includes mental, physical, temporal, performance, effort, and frustration. At the end of all seven trials, participants then completed the comparisons between subscales. This allowed a weighted TLX workload score to be calculated, which included the subscale rating and relative importance of that subscale, resulting in a workload score between 0 and 100. Additionally, after the end of each trial participants verbally rated their nausea on a scale of none, slight, moderate, and severe to help assess cybersickness. No participant reported symptoms of nausea.
After all trials were complete, participants also completed the System Usability Scale (SUS) (Brooke, 1996), which is a 10 question survey in which participants respond on a five-point scale. These are combined to give a resulting score from 0 to 100. In addition, participants answered questions relating to their perceived understanding of the servicer uncertainty, debris uncertainty, collision likelihood, ease of finding information, and awareness of critical events. The full text of this survey can be found in the supplementary materials.
2.4 Statistical analysis
The three displays were compared across the 3 SA levels, workload, usability, and subjective utility. For SA level 1 (perception) the subject averaged percent of correct callouts made was used. For SA levels 2 (comprehension) and 3 (projection), the subject averaged percent correct of SPAM queries for that SA level was used. Unlike traditional SPAM analysis where the response time is used as a measure and the percent correct is treated as the same across conditions (Durso et al., 1995), subject averaged percent correct was used as different conditions had different accuracies. For workload, the weighted TLX score was used, and for usability, the System Usability Scale score was used. For the utility questionnaire, each question was analyzed independently.
The study collected 231 trials over 33 participants. One trial for two separate subjects were removed as these subjects experienced technical difficulties during those specific trials. All other trials for those subjects were retained since the technical difficulties did not affect the other trials. For all 3 SA levels, usability, and utility there were 33 total data points as each subject had a single averaged measure. For workload, as trials were kept separated, 229 data points were used.
Prior to statistical analysis, SA and workload were inspected for potential confounding factors of trial order to capture undesirable learning effects, and for the scenario parameters experienced, as each participant experienced the scenarios in a different order. No effect of learning or trial experienced was identified, based on the slope of the particular metric over trial order on a per subject basis. In addition, the data was visually evaluated for potential confounds based on the participant’s background, including orbital experience, satellite operations experience, gender, and VR familiarity. The participant’s orbital mechanics experience was relevant for all three levels of the SA data, but no participant background was relevant for workload, usability, or utility. For all statistical tests the assumptions were met, unless otherwise noted. A criterion of
For all 3 SA levels, a linear mixed-effects model was used. The display modality was treated as a fixed effect, and the orbital mechanics experience (coded as none to low, or moderate to high) was treated as a random effect. The model was fit using the lme4 package in R via penalized maximum likelihood estimation (Bates et al., 2015). After fitting the model, the residuals were checked to ensure that they obeyed normality and independence. The significance of display modality was assessed using an F test with a type III ANOVA with a Satterthwaite approximation for degrees of freedom and was implemented using lmerTest package in R (Kuznetsova et al., 2017). Post-hoc tests were done between all pairwise comparisons using estimated marginal means (emmeans package in R (Lenth et al., 2023)) with a Tukey p-value correction and Kenward-Roger degrees of freedom correction. The effect size was calculated using the effectsize package in R (Ben-Shachar et al., 2020).
For workload and usability, no participant background was relevant. For workload, each trial was included as a separate data point and the participant was treated as a random effect nested within display modality. The same analysis pipeline was followed as for SA. For usability, no random effects were included so a linear model was fit between the system usability score and display modality. The residuals were then assessed for normality and independence. A type III ANOVA was used to compare the display modalities.
The subjective utility questions were each on a five-point Likert scale. Thus, ANOVAs could not be used, and instead, each question was analyzed using a Kruskal–Wallis one-way analysis of variance.
3 Results
A summary of the each metrics descriptive statistics can be seen in Table 2. Significant differences are seen between the display modalities for the 3 SA measures shown in Figure 3. There is a significant difference in the level 1 SA as measured by the subject average percent callouts made. The ANOVA comparing the linear mixed effect models found significance between conditions (F (2, 29.06) = 11.62, p
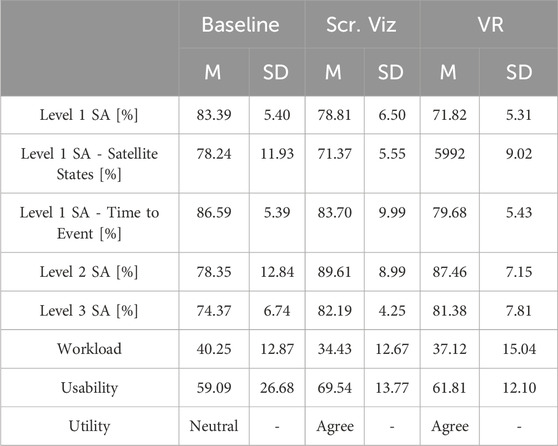
Table 2. Summary of Metrics including mean and standard deviation for each condition. The utility data is on a likert scale so the median is reported.
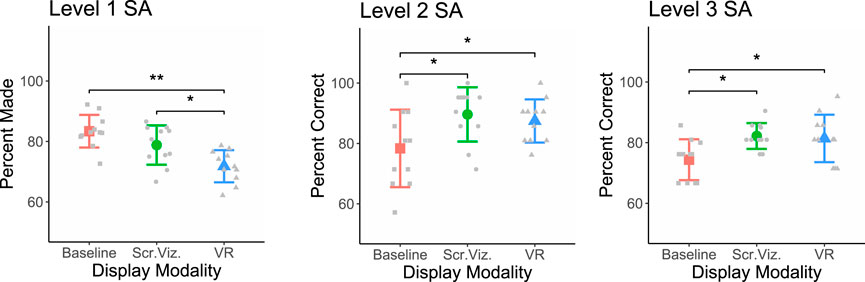
Figure 3. The level 1 (left), 2 (center), and 3 (right) SA results. Level 1 SA shows the subject average percent of callouts successfully made over the condition. Level 2 and 3 SA plots the subject averaged percent of SPAM queries of that level answered correctly. All figures show the data mean and standard deviation error bars and significance is noted between the conditions.
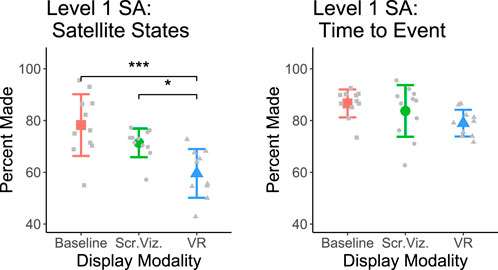
Figure 4. The level 1 SA sub analysis: satellite states (left), time to the next events (right). Both show the subject average percent of callouts successfully made over the condition within a category. The satellite state locations move in VR, the time to next event has a static location. All figures show the data mean and standard deviation error bars and significance is noted between the conditions.
For both level 2 and 3 SA there is a significant difference between display modalities as measured by the subject averaged percent correct of the SPAM queries asked. For level 2 the ANOVA found a difference (F (2, 29.02) = 5.57, p = 0.0089,
No significant differences are found between the other measures collected. The comparison of workload between displays found no significant difference (F (2, 30) = 0.51, p = 0.61,
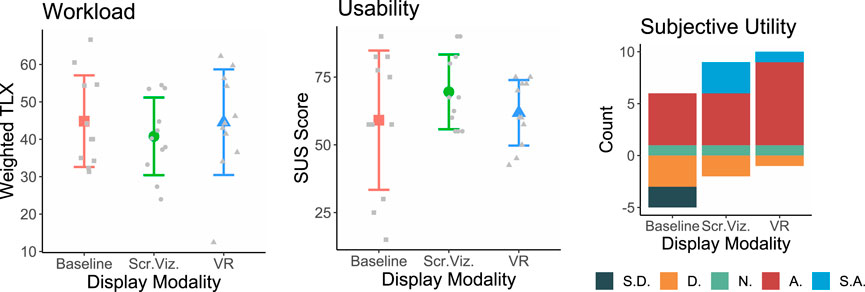
Figure 5. The Workload (left), usability (center), and utility (right) results. Workload shows the subject average weighted TLX score, and usability shows the System Usability Scale score. Each modality’s data means and standard deviation error bars are overlayed. The utility plot shows the results of the question that was closest to being statistically significant: “I found this system enabled me to understand the uncertainty associated with the servicer” (S.D. = Strongly Disagree, D. = Disagree, N. = Neither Agree nor Disagree, A. = Agree, S.A. = Strongly Agree).
In sum, these results are in support of the hypothesis that 3D visualizations improve SA. They support the idea that 3D visualizations can improve level 2 and 3 SA, but not workload, usability, and utility. These results are contrary to the hypothesis that immersiveness will provide additional benefits over 3D visualizations.
4 Discussion
This study is one of the first to investigate the use of VR for remote monitoring of spacecraft rendezvous operations. The objective measure of SA shows significant differences between display modalities, with 3D visualizations improving Level 2 and Level 3 SA, but with VR harming Level 1 SA. Contrary to our hypothesis, the subjective measures of workload, and usability, did not show statistical differences. Similarly, subjective assessment of utility did not reach statistical significance but trended toward higher evaluations for displays with visualizations and immersion. In sum, these results provide insight into the understudied area of the utility of 3D visualizations and VR for operators in a remote supervisory, rather than direct command, of autonomous systems.
3D Visualizations and VR impact levels 1, 2, and 3 SA differently. Improving SA is critical for improving performance and enabling appropriate decisions, and poor SA has been a contributor to many accidents or errors (Endsley, 1995). All three levels of SA are important, and typically build off each other, such that level 2 SA requires level 1 SA, and level 3 SA requires level 2 SA. However, for remote monitoring and supervision of unintuitive orbital systems, operators will need to have an appropriate level 3 SA to understand collision risk and project the consequences of avoidance maneuvers (Endsley, 1995), particularly under uncertainty. For satellite operations in particular this is especially critical as collisions can adversely effect the viability of space operations across all orbital regimes (Oltrogge and Vallado, 2019).
While the SA level 1 results indicate that VR led to significantly worse performance over the baseline and screen visualization displays, the difference was only derived from information that was not in a fixed location on the VR display. When comparing the SA callouts, further analysis found no differences in the display modalities for items that were always present in the same location. For the VR display, this includes information in the heads up display. However, there were significant differences in the analysis of items that are in a static location in the baseline and screen visualization display but are tied to specific objects and change location over time in the VR display. The dynamic motion of the satellite states in VR made it so these objects are less salient, and more effort is required to find them. Participants are thus unable to have a consistent scan pattern. Scan patterns are often described using the SEEV (Salience, effort, expectancy, and value) model. Effort and salience are important aspects of this model which has been shown to be predictive of level 1 SA (Wickens et al., 2005). Although it may be desired to have all the data in a glanceable HUD which can improve monitoring performance over other information displays (Lu et al., 2020), this also can block visualized information, increase clutter, and disrupt immersion (Iacovides et al., 2015; Rosyid et al., 2021; Caroux et al., 2023). While tying some information to the satellites may reduce level 1 SA, it still is an important design consideration to avoid some of the pitfalls of HUD, such as putting too much information into the HUD obscuring the visualization. These results imply that information most critical to the success of the mission or information that needs to be consistently monitored should be located in a stationary component of a VR display.
The SA level 2 and 3 results found that 3D visualizations lead to an improved performance over the baseline display without 3D visualizations, but found no differences between the screen visualization and the VR displays. These initial results indicate that in this monitoring task VR does not impact performance. This agrees with the results of a prior remote monitoring VR study (Lager and Topp, 2019), which used a proxy for SA. These results are also in agreement with a monitoring study that compared only 3D visualizations to 2D visualizations and found that the 3D visualizations increased SA (Rottermanner et al., 2020). Other studies found that VR improves SA, although they consider a direct control paradigm of interacting with robotic systems (Whitney et al., 2020a). The amount of control authority an operator has may be a contributing factor to these differences in results. There is a need for future work to consider other control paradigms that fall between direct control and monitoring, such as supervisory control.
The subjective measures of workload show no differences between display modalities. There are inconsistencies in previous literature as to whether VR increases (Lager and Topp, 2019) or decreases (Whitney et al., 2020a) workload over non-immersive displays. This research finds no differences. This may be due to the task and experimental paradigm itself: remote supervision, especially monitoring, is typically lower workload compared to direct control (Hooey et al., 2018; Huey and Wickens, 1993; Grier, 2015). Thus, it is not unexpected that most users experienced similar levels of workload, as they had no control authority. Additionally, participants using the baseline display could not customize their display, while users in screen visualization and VR display could. The effort towards customizing the display or finding appropriate camera viewpoints could inflate the workload of visualization-based displays relative to the baseline. Most of the previous tasks that have found workload differences have been for direct control, where the operators are interacting with a system either through VR or a computer display and there is typically a higher workload overall (Elor et al., 2021; Whitney et al., 2020a; Hooey et al., 2018; Huey and Wickens, 1993). Due to inconsistencies in the literature and the varied degrees of operator engagement, future work should investigate other degrees of control authority, like supervisory control. While an ideal display would decrease workload over alternative displays, these results may be considered positive in that they did not exacerbate workload, indicating overall good display design.
For usability and utility, no significant differences are found between display modalities. In prior work operators often subjectively rate VR displays to have a higher usability and prefer to work with them (Elor et al., 2021; Lager and Topp, 2019), or prefer 3D visualizations over 2D visualizations (Weiss et al., 2021). In this research, statistical significance is not achieved, but the utility results trend toward significance. As such, these results are consistent with that of the literature where users trended to subjectively prefer the utility of the VR display. A critical difference between our results and those in the literature is that many of these studies used a within subjects design where participants had a chance to experience multiple display modalities and thus their responses reflect these comparisons. By not doing a within subjects design, this study is unable to capture some of these subjective preferences. Like workload, no differences in usability may be positive, as having a significantly worse display may be more indicative of poor display design or issues due to limitations with VR technology.
A challenge of this research was implementing a VR display that leverages appropriate display design principles. Effort was made, through human factors evaluation, to ensure that results were not influenced by a participant’s inability to read the display or interpret and control the visualization effectively. Established principles for aerospace displays (such as MIL-SPEC and FAA regulations) and human factors (i.e., minimizing information access cost, contrast, and avoiding absolute judgment limitss) guided the layout of the VR display, but few VR-specific design principles are established, highlighting a need for further research into VR display design guidelines. The design guidelines applied here (such as the use of HUD and tying text to specific elements) and their impact on this study’s results can be extended by future designers of VR displays.
There are some limitations to this study. Our subject pool may not be representative of operators who would be trained in or use these types of systems and had varying backgrounds and familiarity with orbital mechanics and VR. While subject background knowledge is accounted for in our statistical analysis to reduce these effects, having a more representative subject pool would be ideal. Additionally, using participants with no prior familiarity with traditional displays makes it unclear how current, highly-trained operators would react to visualizations or a new system they are not as familiar with. Previous research for air traffic control found that while 3D visualizations improved SA among all participants, but those with extensive operational experience provided lower subjective ratings to 3D (Rottermanner et al., 2020). Future work should assess to see if the same is true for satellite operations, and if so how to best mitigate the issue of switching displays. In addition, the between-subject design used may impact the subjective measures as participants did not have a chance to experience all three displays and thus did not have the ability to compare between the features and limitations of each display.
While we monitored for symptoms of nausea during the experiment, we did not measure other cybersickness symptoms like eye strain or fatigue. These other symptoms may influence the outcomes of the metrics assessed in the study or may discourage the use of VR during future operations. Additionally, this research considers the monitoring aspect of remote supervisory control of a simplified, faster than real time satellite operation, in which participants had no control authority. This work focuses on the monitoring of a remote system, which is how operators in such systems will spend the majority of their time in supervisory control paradigms, and therefore foregoes the inclusion of the ability to intermittently provide input to the autonomous system. It is critical to understand how display modalities can impact monitoring performance. If a display fails to facilitate effective monitoring, it will be difficult to use in supervisory control. Future work could include the addition of opportunities for intermittent control or increased complexity in the monitored system. Finally, this research considers VR and immersion as applied through a head-mounted display. There are many other ways of providing an immersive environment, such as a CAVE system, and using a single display type represents a limitation of our work. Future research can study the impact of different degrees of immersion using different immersive systems on monitoring.
Future work involves expanding this experiment to consider remote supervision paradigms to understand how VR impacts these situations. This also more closely represents what operators might encounter during normal operations when remotely supervising autonomous or semi-autonomous agents. Understanding the impacts of display on monitoring is an important first step, as it is how the majority of an operator’s time is spent, providing the operator with limited control authority to make interventions while in supervisory mode may allow display differences to be seen in metrics of workload, usability, and utility. This will also fill in the gap of understanding the effect VR has on various degrees of control authority, as remote supervision is understudied. Additionally, while these results are specific towards satellite monitoring displays, these results may be applicable towards other systems that rely on remote monitoring of multiple systems under uncertainty such as air traffic control, submarine/maritime control rooms, and monitoring self driving cars. Future work should investigate the extent to which these conclusions transfer to other types of monitoring systems. Future work can also study changing the complexity or the pacing of the scenario used to understand if that changes the outcome. Furthermore, as VR display design principles continue to solidify, future work will continue to incorporate emerging best practices from the literature and human factors; these design decisions may impact results.
5 Conclusion
This study compares the effects of 3D visualizations and VR for remote monitoring of spacecraft operations on SA, workload, usability, and utility. Three displays, with varying degrees of 3D visualizations and immersion, were designed and evaluated through human subject testing. The results of this work indicate 3D visualizations may improve display interfaces for monitoring satellites; however, there is little evidence that VR such as that provided by VR, yields additional improvements. 3D visualizations improve level 2 and level 3 SA as measured through SPAM queries. VR reduces level 1 SA as measured through callouts; this reduction was only noticed when considering information that was not always present on the VR display. There are no differences between displays in workload, usability, and utility. While VR has been demonstrated to be a promising modality for direct control tasks, the benefits do not translate to remote monitoring of autonomous agents. Future work should assess the impact of VR and immersion in remote supervision of autonomous systems, where operators can make intermittent commands. These conclusions can also inform interface designs for future monitoring of spaceflight systems.
Data availability statement
The raw data supporting the conclusions of this article will be made available by the authors, without undue reservation.
Ethics statement
The studies involving humans were approved by University of Colorado Boulder Institutional Review Board. The studies were conducted in accordance with the local legislation and institutional requirements. The participants provided their written informed consent to participate in this study. Written informed consent was obtained from the individual(s) for the publication of any potentially identifiable images or data included in this article.
Author contributions
SB: Writing–original draft, Conceptualization, Formal Analysis, Investigation, Methodology, Software. AR: Writing–review and editing, Investigation. JW: Writing–review and editing, Software. HS: Writing–review and editing, Conceptualization, Funding acquisition, Project administration, Supervision. AH: Writing–review and editing, Conceptualization, Funding acquisition, Supervision, Methodology, Project administration.
Funding
The author(s) declare that financial support was received for the research, authorship, and/or publication of this article. This material is based upon work supported by a SpaceWERX STTR under grant number FX21S-TCSO1-0345. Any opinions, findings, and conclusions or recommendations expressed in this material are those of the author(s) and do not necessarily reflect the views of the Space Force.
Conflict of interest
The authors declare that the research was conducted in the absence of any commercial or financial relationships that could be construed as a potential conflict of interest.
Publisher’s note
All claims expressed in this article are solely those of the authors and do not necessarily represent those of their affiliated organizations, or those of the publisher, the editors and the reviewers. Any product that may be evaluated in this article, or claim that may be made by its manufacturer, is not guaranteed or endorsed by the publisher.
Supplementary material
The Supplementary Material for this article can be found online at: https://www.frontiersin.org/articles/10.3389/frvir.2025.1487281/full#supplementary-material
Footnotes
1https://hanspeterschaub.info/basilisk/index.html
2https://hanspeterschaub.info/basilisk/Vizard/Vizard.html
3Video demonstration: https://www.youtube.com/watch?v=-bWKuk4W6UU
References
Bagassi, S., Corsi, M., De Crescenzio, F., Santarelli, R., Simonetti, A., Moens, L., et al. (2024). Virtual/augmented reality-based human–machine interface and interaction modes in airport control towers. Sci. Rep. 14. doi:10.1038/s41598-024-63731-3
Bates, D., Mächler, M., Bolker, B., and Walker, S. (2015). Fitting linear mixed-effects models using lme4. J. Stat. Softw. 67, 1–48. doi:10.18637/jss.v067.i01
Ben-Shachar, M. S., Lüdecke, D., and Makowski, D. (2020). Effectsize: estimation of effect size indices and standardized parameters. J. Open Source Softw. 5, 2815. doi:10.21105/joss.02815
Brooke, j. (1996). “SUS: a ’quick and dirty’ usability scale,” in Usability evaluation in industry. London: CRC Press, 6.
Bualat, M., Fong, T., Allan, M., Bouyssounouse, X., Cohen, T., Fluckiger, L., et al. (2013). “Surface telerobotics: development and testing of a crew controlled planetary rover system,” in AIAA SPACE 2013 conference and exposition (San Diego, CA: American Institute of Aeronautics and Astronautics). doi:10.2514/6.2013-5475
Caroux, L., Delmas, M., Cahuzac, M., Ader, M., Gazagne, B., and Ravassa, A. (2023). Head-up displays in action video games: the effects of physical and semantic characteristics on player performance and experience. Behav. and Inf. Technol. 42, 1466–1486. doi:10.1080/0144929X.2022.2081609
Caroux, L., and Isbister, K. (2016). Influence of head-up displays’ characteristics on user experience in video games. Int. J. Human-Computer Stud. 87, 65–79. doi:10.1016/j.ijhcs.2015.11.001
Chen, J. Y. C., Haas, E. C., and Barnes, M. J. (2007). Human performance issues and user interface design for teleoperated robots. IEEE Trans. Syst. Man, Cybern. Part C Appl. Rev. 37, 1231–1245. doi:10.1109/TSMCC.2007.905819
Cordeil, M., Dwyer, T., and Hurter, C. (2016). “Immersive solutions for future air traffic control and management,” in Proceedings of the 2016 ACM companion on interactive surfaces and spaces. New York, NY: Association for Computing Machinery, 25–31. doi:10.1145/3009939.3009944
Cummings, M., Huang, L., Zhu, H., Finkelstein, D., and Wei, R. (2019). The impact of increasing autonomy on training requirements in a UAV supervisory control task. J. Cognitive Eng. Decis. Mak. 13, 295–309. doi:10.1177/1555343419868917
Cunningham, J. C., Battiste, H., Curtis, S., Hallett, E. C., Koltz, M., Brandt, S. L., et al. (2015). Measuring situation awareness with probe questions: reasons for not answering the probes. Procedia Manuf. 3, 2982–2989. doi:10.1016/j.promfg.2015.07.840
Dan, A., and Reiner, M. (2017). EEG-based cognitive load of processing events in 3D virtual worlds is lower than processing events in 2D displays. Int. J. Psychophysiol. 122, 75–84. doi:10.1016/j.ijpsycho.2016.08.013
[Dataset] Lenth, R. V., Bolker, B., Buerkner, P., Giné-Vázquez, I., Herve, M., Jung, M., et al. (2023). Emmeans: estimated marginal means, aka least-squares means
Davis, S., Nesbitt, K., and Nalivaiko, E. (2014). “A systematic review of cybersickness,” in Proceedings of the 2014 conference on interactive entertainment (Newcastle NSW Australia: ACM, 1–9. doi:10.1145/2677758.2677780
Dima, E., Brunnstrom, K., Qureshi, T., Andersson, M., Edlund, J., Johanson, M., et al. (2019). View position impact on QoE in an immersive telepresence system for remote operation, in International conference on quality of multimedia experience (QoMEX), 3, 1–3. doi:10.1109/qomex.2019.8743147
Durso, F., Truitt, T., Hackworth, C., Crutchfield, J., Ohrt, D., Nikolić, D., et al. (1995). Expertise and chess: a pilot study comparing situation awareness methodologies
Durso, F. T., Hackworth, C. A., and Truitt, T. R. (1999). Situation awareness as a predictor of performance in en route air traffic controllers . doi:10.1037/e402702004-001
Durso, F. T., Hackworth, C. A., Truitt, T. R., Crutchfield, J., Nikolic, D., and Manning, C. A. (1998). Situation awareness as a predictor of performance for en route air traffic controllers, 6. Air Traffic Control Q., 1–20. doi:10.2514/atcq.6.1.1
Elor, A., Thang, T., Hughes, B. P., Crosby, A., Phung, A., Gonzalez, E., et al. (2021). “Catching jellies in immersive virtual reality: a comparative teleoperation study of ROVs in underwater capture tasks,” in Proceedings of the 27th ACM Symposium on virtual reality Software and technology (osaka Japan: acm), 1–10. doi:10.1145/3489849.3489861
Endsley, M. R. (1988). Design and evaluation for situation awareness enhancement, 32. Proc. Hum. Factors Soc. Annu. Meet., 97–101. doi:10.1177/154193128803200221
Endsley, M. R. (1995). Measurement of situation awareness in dynamic systems. Hum. Factors. 37. 65–84. doi:10.1518/001872095779049499
Endsley, M. R. (2000). “Direct measurement of situation awareness: validity and use of SAGAT,” in Situation awareness analysis and measurement (Mahwah, NJ, US: Lawrence Erlbaum Associates Publishers), 147–173.
Etemadpour, R., Monson, E., and Linsen, L. (2013). “The effect of stereoscopic immersive environments on projection-based multi-dimensional data visualization,” in 2013 17th international conference on information visualisation, 389–397. doi:10.1109/IV.2013.51ISSN.2375-0138
Flightcrew alerting Part 25 Section 14 CFR (2004). ARAC WG report FAR/JAR 25.1322 and AC/ACJ 25.1322. Federal Aviation Administration.
Fujino, M., Lee, J., Hirano, T., Saito, Y., and Itoh, M. (2020). “Comparison of SAGAT and SPAM for seeking effective way to evaluate situation awareness and workload during air traffic control task,” in Proceedings of the 2020 HFES 64th international annual meeting (virtual). doi:10.1177/1071181320641442
Golding, J. F. (1998). Motion sickness susceptibility questionnaire revised and its relationship to other forms of sickness. Brain Res. Bull. 47, 507–516. doi:10.1016/s0361-9230(98)00091-4
Gorbunov, A. L., and Nechaev, E. E. (2022). “Augmented reality technologies in air transport control systems,” in 2022 systems of signals generating and processing in the field of on board communications (IEEE), 1–5. doi:10.1109/IEEECONF53456.2022.9744399
Grier, R. (2015). How high is high? A metanalysis of NASA TLX global workload scores. 59, 1727–1731. doi:10.1177/.1541931215591373
Hainley, C. J., Duda, K. R., Oman, C. M., and Natapoff, A. (2013). Pilot performance, workload, and situation awareness during lunar landing mode transitions. J. Spacecr. Rockets 50, 793–801. doi:10.2514/1.a32267
Hart, S. G., and Staveland, L. E. (1988). Development of NASA-TLX (task load Index): results of empirical and theoretical research. 139–183. doi:10.1016/S0166-4115(08)62386-9
Hooey, B. L., Kaber, D. B., Adams, J. A., Fong, T. W., and Gore, B. F. (2018). The underpinnings of workload in unmanned vehicle systems. IEEE Trans. Human-Machine Syst. 48, 452–467. doi:10.1109/THMS.2017.2759758
Hosseini, A., and Lienkamp, M. (2016). Enhancing telepresence during the teleoperation of road vehicles using HMD-based mixed reality. 2016 IEEE Intell. Veh. Symp. IV, 1366–1373. doi:10.1109/IVS.2016.7535568
Huey, B. M., and Wickens, C. D. (1993). Workload transition: implications for individual and team performance. Tech. Rep.
Hurter, C., Riche, N. H., Drucker, S. M., Cordeil, M., Alligier, R., and Vuillemot, R. (2019). FiberClay: sculpting three dimensional trajectories to reveal structural insights. IEEE Trans. Vis. Comput. Graph. 25, 704–714. doi:10.1109/TVCG.2018.2865191
Iacovides, I., Cox, A., Kennedy, R., Cairns, P., and Jennett, C. (2015). Removing the HUD: the impact of non-diegetic game elements and expertise on player involvement. In Proc. 2015 Annu. Symposium Computer-Human Interact. Play. 15, 13–22. doi:10.1145/2793107.2793120
Kalamkar, S., Biener, V., Beck, F., and Grubert, J. (2023). “Remote monitoring and teleoperation of autonomous vehicles—is virtual reality an option?,” in 2023 IEEE international symposium on mixed and augmented reality (ISMAR) (IEEE), 463–472. doi:10.1109/ISMAR59233.2023.00061
Karasinski, J. A., Robinson, S. K., Duda, K. R., and Prasov, Z. (2016). “Development of real-time performance metrics for manually-guided spacecraft operations,” in 2016 IEEE aerospace conference big sky MT, USA: IEEE, 1–9. doi:10.1109/.AERO.2016.7500734
Kenneally, P. W., Piggott, S., and Schaub, H. (2020). Basilisk: a flexible, scalable and modular astrodynamics simulation framework, 17. J. Aerosp. Inf. Syst., 496–507. doi:10.2514/1.i010762
Kraus, M., Fuchs, J., Sommer, B., Klein, K., Engelke, U., Keim, D., et al. (2022). Immersive analytics with abstract 3D visualizations: a survey. Comput. Graph. Forum 41, 201–229. doi:10.1111/cgf.14430
Kraus, M., Weiler, N., Oelke, D., Kehrer, J., Keim, D. A., and Fuchs, J. (2020). The impact of immersion on cluster identification tasks. IEEE Trans. Vis. Comput. Graph. 26, 525–535. doi:10.1109/TVCG.2019.2934395
Kuznetsova, A., Brockhoff, P. B., and Christensen, R. H. B. (2017). lmerTest package: tests in linear mixed effects models. J. Stat. Softw. 82, 1–26. doi:10.18637/jss.v082.i13
Lager, M., and Topp, E. A. (2019). Remote supervision of an autonomous surface vehicle using virtual reality. IFAC-PapersOnLine 52, 387–392. doi:10.1016/j.ifacol.2019.08.104
Loft, S., Bowden, V., Braithwaite, J., Morrell, D. B., Huf, S., and Durso, F. T. (2015). Situation awareness measures for simulated submarine track management, 57. Hum. Factors, 298–310. doi:10.1177/0018720814545515
Loft, S., Morrell, D., and Huf, S. (2013). Using the situation present assessment method to measure situation awareness in simulated submarine track management. Int. J. Hum. Factors Ergonomics 2, 33–48. doi:10.1504/.IJHFE.2013.055975
Lu, F., Davari, S., Lisle, L., Li, Y., and Bowman, D. A. (2020). “Glanceable AR: evaluating information access methods for head-worn augmented reality,” in 2020 IEEE conference on virtual reality and 3D user interfaces (VR), 930–939. doi:10.1109/VR46266.2020.00113.ISSN.2642-5254
Luong, T., Cheng, Y. F., Möbus, M., Fender, A., and Holz, C. (2023). Controllers or bare hands? A controlled evaluation of input techniques on interaction performance and exertion in virtual reality. IEEE Trans. Vis. Comput. Graph. 29, 4633–4643. doi:10.1109/TVCG.2023.3320211
Marre, Q., Caroux, L., and Sakdavong, J.-C. (2021). Video game interfaces and diegesis: the impact on experts and novices’ performance and experience in virtual reality. Int. J. Human–Computer Interact. 37, 1089–1103. doi:10.1080/10447318.2020.1870819
Mirchi, T., Vu, K.-P., Miles, J., Sturre, L., Curtis, S., and Strybel, T. Z. (2015). Air traffic controller trust in automation in NextGen. Procedia Manuf. 3, 2482–2488. doi:10.1016/j.promfg.2015.07.509
Moesl, B., Schaffernak, H., Vorraber, W., Braunstingl, R., and Koglbauer, I. V. (2023). Multimodal augmented reality applications for training of traffic procedures in aviation. Multimodal Technol. Interact. doi:10.3390/mti7010003
Naceri, A., Mazzanti, D., Bimbo, J., Tefera, Y. T., Prattichizzo, D., Caldwell, D. G., et al. (2021). The vicarios virtual reality interface for remote robotic teleoperation. J. Intelligent and Robotic Syst. 101, 80. doi:10.1007/.s10846-021-01311-7
O’Hara, J., and Fleger, S. (2020). Human-system interface design review guidelines. Tech. Rep. BNL–216211-2020-FORE, 1644018. doi:10.2172/1644018
Oltrogge, D. L., and Vallado, D. A. (2019). “enDebris Risk Evolution and Dispersal (DREAD) for post-fragmentation modeling,” in 2019 15th hypervelocity impact symposium (Destin, FL, USA: American Society of Mechanical Engineers). doi:10.1115/HVIS2019-054V001T10A009
Proctor, R. W., and Zandt, T. V. (2017). Human factors in simple and complex systems. 3 edn. Boca Raton: CRC Press. doi:10.1201/9781315156811
Read, J. M., and Saleem, J. J. (2017). Task performance and situation awareness with a virtual reality head-mounted display. Proc. Hum. Factors Ergonomics Soc. Annu. Meet. 61, 2105–2109. doi:10.1177/.1541931213602008
Reisman, R., and Brown, D. (2006). “enDesign of augmented reality tools for air traffic control towers,” in 6th AIAA aviation technology, integration and operations conference (ATIO) (Wichita, Kansas: American Institute of Aeronautics and Astronautics). doi:10.2514/6.2006-7713
Rohacs, J., Rohacs, D., and Jankovics, I. (2016). Conceptual development of an advanced air traffic controller workstation based on objective workload monitoring and augmented reality. Proc. Institution Mech. Eng. Part G J. Aerosp. Eng. 230, 1747–1761. doi:10.1177/0954410016636154
Rosyid, H. A., Pangestu, A. Y., and Akbar, M. I. (2021). “Can diegetic user interface improves immersion in role-playing games?,” in 2021 7th international conference on electrical, electronics and information engineering (ICEEIE), 200–204. doi:10.1109/ICEEIE52663.2021.9616732
Rottermanner, G., de Jesus Oliveira, V. A., Lechner, P., Graf, P., Kreiger, M., Wagner, M., et al. (2020). “Design and evaluation of a tool to support air traffic control with 2D and 3D visualizations,” in 2020 IEEE conference on virtual reality and 3D user interfaces (VR), 885–892. doi:10.1109/VR46266.2020.00011.ISSN.2642-5254
Sellmaier, F., and Frei, H. (2022). “Operations of on-orbit servicing missions,” in Spacecraft operations. Editors F. Sellmaier, T. Uhlig, and M. Schmidhuber (Cham: Springer International Publishing), 491–529. doi:10.1007/978-3-030-88593-9_25
Sheridan, T. B. (1992). Musings on telepresence and virtual presence. Presence Teleoperators Virtual Environ. 1, 120–126. doi:10.1162/pres.1992.1.1.120
Sheridan, T. B. (2012). Human supervisory control of automation. In Handbook of human factors and ergonomics (New York, UNITED STATES: John Wiley and Sons.
Sheridan, T. B. (2021). “Human supervisory control of automation,” in Handbook of human factors and ergonomics. John Wiley and Sons, Ltd, 736–760. doi:10.1002/9781119636113.ch28
Sim, L., Cummings, M. L., and Smith, C. A. (2008). Past, present and future implications of human supervisory control in space missions. Acta Astronaut. 62, 648–655. doi:10.1016/j.actaastro.2008.01.029
Sittner, F., Hartmann, O., Montenegro, S., Friese, J.-P., Brubach, L., Latoschik, M. E., et al. (2023). “An update on the virtual mission control room,” in 37th annual small satellite conference (logan Utah).
Slater, M., Linakis, V., Usoh, M., and Kooper, R. (1996). “Immersion, presence and performance in virtual environments: an experiment with tri-dimensional chess,” in Proceedings of the ACM symposium on virtual reality software and technology - vrst ’96 (Hong Kong: ACM Press), 163–172. doi:10.1145/3304181.3304216
Sarter, N. B., and Woods, D. D. (1991). Situation awareness: a critical but ill-defined phenomenon. Int. J. Aerosp. Psychol. 1 (1), 45–57. doi:10.1207/s15327108ijap0101_4
Tittle, J. S., Roesler, A., and Woods, D. D. (2002). The remote perception problem, 46. Proc. Hum. Factors Ergonomics Soc. Annu. Meet., 260–264. doi:10.1177/154193120204600309
Torres, n., Molina, J. P., García, A. S., and González, P. (2024). EnglishPrototyping of Augmented Reality interfaces for air traffic alert and their evaluation using a Virtual Reality aircraft-proximity simulator. IEEE Computer Society, 817–826. doi:10.1109/VR58804.2024.00101
Tsigkounis, K., Komninos, A., Politis, N., and Garofalakis, J. (2021). “Monitoring maritime industry 4.0 systems through VR environments,” in CHI Greece 2021: 1st international Conference of the ACM Greek SIGCHI chapter (online (athens, Greece) Greece: acm), 1–8. doi:10.1145/3489410.3489429
Van de Merwe, D. B., Van Maanen, L., Ter Haar, F. B., Van Dijk, R. J. E., Hoeba, N., and Van der Stap, N. (2019). “Human-robot interaction during virtual reality mediated teleoperation: how environment information affects spatial task performance and operator situation awareness. In virtual, augmented and mixed reality. Applications and case studies. Lect. Notes Comput. Sci. doi:10.1007/978-3-030-21565-1_11
van den Oever, F., Fjeld, M., and Sætrevik, B. (2024). A systematic literature review of augmented reality for maritime collaboration. Int. J. Human–Computer Interact. 40, 4116–4131. doi:10.1080/10447318.2023.2209838
van Emmerik, M. L., de Vries, S. C., and Bos, J. E. (2011). Internal and external fields of view affect cybersickness. Displays 32, 169–174. doi:10.1016/j.displa.2010.11.003
Weiss, H., Liu, A., Byon, A., Blossom, J., and Stirling, L. (2021). Comparison of display modality and human-in-the-loop presence for on-orbit inspection of spacecraft. Hum. Factors. doi:10.1177/00187208211042782
Wentzel, J., Lakier, M., Hartmann, J., Shazib, F., Casiez, G., and Vogel, D. (2024). A comparison of virtual reality menu archetypes: raycasting, direct input, and marking menus. IEEE Trans. Vis. Comput. Graph. PP, 1–15. doi:10.1109/TVCG.2024.3420236
Whitlock, M., Smart, S., and Szafir, D. A. (2020). “Graphical perception for immersive analytics,” in 2020 IEEE conference on virtual reality and 3D user interfaces (VR) (IEEE), 616–625. doi:10.1109/VR46266.2020.00084
Whitney, D., Rosen, E., Phillips, E., Konidaris, G., and Tellex, S. (2020a). “Comparing robot grasping teleoperation across desktop and virtual reality with ROS reality,” in Robotics research. Springer proceedings in advanced robotics. Editors N. M. Amato, G. Hager, S. Thomas, and M. Torres-Torriti (Cham: Springer International Publishing), 335–350. doi:10.1007/978-3-030-28619-4_28
Whitney, D., Rosen, E., Phillips, E., Konidaris, G., and Tellex, S. (2020b). “Comparing robot grasping teleoperation across desktop and virtual reality with ROS reality,” in Robotics research. Series title: springer proceedings in advanced robotics. Editors N. M. Amato, G. Hager, S. Thomas, and M. Torres-Torriti (Cham: Springer International Publishing), 10, 335–350. doi:10.1007/978-3-030-28619-4_28
Wickens, C. D., Hollands, J. G., Banbury, S., and Parasuraman, R. (2013). Engineering psychology and human performance. fourth edition edn. Boston: Pearson.
Wickens, C. D., McCarley, J. S., Alexander, A., Thomas, L. C., Ambinder, M., and Zheng, S. (2005). Attention-situation awareness (A-SA) model of pilot error. Tech. Rep.
Wickens, C. D., Thomas, L. C., and Young, R. (2000). Frames of reference for the display of battlefield information: judgment-display dependencies, Hum. Factors. 42, 660–675. doi:10.1518/001872000779698015
Wilde, M., Chua, Z. K., and Fleischner, A. (2014). Effects of multivantage point systems on the teleoperation of spacecraft docking. IEEE Trans. Human-Machine Syst. 44, 200–210. doi:10.1109/THMS.2013.2295298
Wood, J., Margenet, M. C., Kenneally, P., Schaub, H., and Piggott, S. (2018). “Flexible basilisk astrodynamics visualization software using the unity rendering engine,” in AAS guidance and control conference (Breckenridge, CO: American astronautical society).
Keywords: virtual reality, display modalities, situation awareness, human factors, supervisory control
Citation: Buchner SL, Rindfuss A, Wood J, Schaub H and Hayman AP (2025) Impacts of 3D visualizations and virtual reality in display designs for remote monitoring of satellite operations. Front. Virtual Real. 6:1487281. doi: 10.3389/frvir.2025.1487281
Received: 27 August 2024; Accepted: 27 January 2025;
Published: 27 February 2025.
Edited by:
Doug A. Bowman, Virginia Tech, United StatesReviewed by:
Guilherme Gonçalves, University of Porto, PortugalMissie Smith, Facebook Reality Labs Research, United States
Copyright © 2025 Buchner, Rindfuss, Wood, Schaub and Hayman. This is an open-access article distributed under the terms of the Creative Commons Attribution License (CC BY). The use, distribution or reproduction in other forums is permitted, provided the original author(s) and the copyright owner(s) are credited and that the original publication in this journal is cited, in accordance with accepted academic practice. No use, distribution or reproduction is permitted which does not comply with these terms.
*Correspondence: Savannah L. Buchner, c2F2YW5uYWguYnVjaG5lckBjb2xvcmFkby5lZHU=