 Tania Roy
 Hunt Jackson Sparra
 Andrey Skripnikov2
95% of researchers rate our articles as excellent or good
Learn more about the work of our research integrity team to safeguard the quality of each article we publish.
Find out more
ORIGINAL RESEARCH article
Front. Virtual Real. , 17 March 2025
Sec. Virtual Reality and Human Behaviour
Volume 6 - 2025 | https://doi.org/10.3389/frvir.2025.1469409
This paper presents a Google Cardboard VR simulation to raise awareness among participants aged 11 to 16 about marine ecosystem protection. Focusing on the impact of everyday pollutants on sea turtles, a user study (N = 12) gauged the VR sessions’ impact on student motivation. Mixed-effects modeling was conducted on Likert scale ratings on both the pre- and post-session surveys, finding scores for motivation to learn about nature- and VR-related topics to be significantly higher than 3 (“Neither agree or disagree”) after the VR simulation, while also showing that the simulation had some impact on increasing participant interest across both environmental and VR topics. Qualitative feedback emphasized the desire for more interactivity, improved graphics, and enhanced authenticity. Despite these suggestions, participants effectively grasped the educational message, highlighting VR’s potential in environmental conservation education. This study’s findings underscore the potential of VR-based educational tools in fostering a deeper understanding and commitment among young students towards environmental stewardship, suggesting a promising avenue for integrating technology into environmental education curricula.
The impact of litter and waste on marine habitat is a significant environmental issue, and its threat is expected to grow with each passing year. In the last 2 decades, worldwide plastic production has more than doubled to 459 million tons yearly. Of this, it is estimated that one to two million tons of new plastic waste pollute the oceans annually (Ritchie and Roser, 2018). These plastics are documented to have affected 54% of marine mammal species, 56% of seabird species, and all species of sea turtle, entangling over 30,000 animals and having been ingested by over 13,000 more. In over 25,000 instances, entanglement or ingestion resulted in the direct harm or even death of an animal due to drowning, suffocation, lacerations, gut blockage, the introduction of toxins, or other effects (Gall and Thompson, 2015). Furthermore, plastic waste can facilitate the spread of invasive species, leading to even more ecological issues (García-Gómez et al., 2021). It is essential that we take action to decrease our use of plastics and find more sustainable alternatives to safeguard our planet and its inhabitants (Shi, 2023).
Even though environmental pollution is a widely discussed issue, many people find it challenging to connect small daily choices about plastic consumption to their significant cumulative effects on marine habitats. However, the food packaging, grocery bags, beverage bottles, and disposable hygiene products people use every day are what become marine pollutants (OECD, 2022). Since plastic consumption begins at the individual level, educating people about the consequences of their plastic waste is crucial to addressing the ecological threat of plastics through behavior change (Straßmann et al., 2020).
Virtual reality (VR) simulations have been successfully applied to education and awareness campaigns (Pellas et al., 2020). In K-12 education, VR has been used to improve learning outcomes and student engagement in mathematics (Roussou et al., 2006), (Xu and Ke, 2016), chemistry (Limniou et al., 2008), (Ucar et al., 2017), and physics (Slater and Wilbur, 1997). In industry, VR provides training simulations for auto manufacturing plants (Stork et al., 2012), (Parmar, 2017), mining operations (Bertrand et al., 2017), and aviation maintenance (Gómez-Cambronero et al., 2023). In awareness campaigns, VR has been effectively used to influence behavioral changes (Grace Ahn, 2015) that helped addiction recovery (Segawa et al., 2020), phobia treatment (Segawa et al., 2020), (Rothbaum et al., 1995), and weight management (Grace Ahn, 2015). The primary reason for using VR in all these settings is its unique combination of both immersive and interactive elements, something that is missing in static learning materials such as 360-degree videos and in traditional interactive experiences such as computer video games.
This paper describes the design, development, and educational effectiveness of a Google Cardboard Virtual Reality application (“JellyBean”) in raising awareness about the impact of everyday pollutants on marine ecosystems. We conducted a user study with this simulation and the purpose of this study is to (1) demonstrate the viability of low-end, affordable VR in education and (2) introduce a framework for fully remote VR usability studies. This study’s findings underscore the potential of VR for fostering a deeper understanding and commitment towards environmental stewardship, and its technologies suggest that VR-based educational tools can be affordable and easily accessible to researchers, educators, and individuals. Additionally, with the study being conducted during the COVID-19 pandemic, our results show that VR studies can be conducted sanitarily and not limited to researchers’ locations. This opens the door to future VR studies over a larger geographic area and under a wider variety of circumstances.
Virtual reality (VR) simulations have been extensively used in several educational and awareness-related settings (Pellas et al., 2020).
VR has been used to engage K-12 students in different areas of sciences. In mathematics, Xu and Ke used their VR environment to teach fractions (Roussou et al., 2006), (Xu and Ke, 2016). In chemistry, Ucar et al. and Limniou et al. proved that virtual reality lessons increased student motivation and engagement (Limniou et al., 2008), (Ucar et al., 2017). In physics, Pirker and Guetl found that students found both room size and mobile VR more engaging and effective than traditional lessons (Pirker et al., 2018). VR has also been a powerful tool in industry training simulations for auto manufacturing plants (Stork et al., 2012), (Parmar, 2017), mining operations (Bertrand et al., 2017), and aviation maintenance (EDIIIE, 2002). The primary reason for using VR in learning environments in K12, industry training, and other specialized professional settings is VR’s ability to provide an immersive and interactive environment, which is missing in other digital learning mediums such as interactive video games, YouTube videos, or 360-degree experience videos.
Head-mounted displays (HMD) are classified as tethered headsets (e.g., Oculus Rift S), stand-alone headsets (e.g., Oculus Quest 2), and smartphone VR or handheld VR viewers/headsets (“Types of VR headsets). Immersion and presence in VR, as defined by Slater et al., are the abilities of a technology to envelop a player in a multisensory environment and to allow for interaction with that environment (Slater and Wilbur, 1997), (Draper et al., 1998). Both immersion and presence are central to creating engaging experiences, and the hardware capabilities of HMDs impact both these factors.
In the world of awareness campaigns, VR has effectively been used to influence behavior change in the form of a persuasive technology (Ahn, 2015). Examples of such campaigns can be found in healthcare settings to aid in addiction recovery (Weser et al., 2021), creating exposure environments for phobia treatments (Rothbaum et al., 1995), (Anderson et al., 2001), and helping change attitudes toward long-term health goals such as weight management (Ahn, 2015). All these simulations engage players by exposing them to scenarios in a controlled environment and commonly incorporate gamification techniques to engage them.
In the application of VR to environmental campaigns, it is crucial to create experiences that resonate on an organic level, fostering innate emotional responses that drive behavioral change. Research suggests that experiential visualization and emotional engagement are critical factors in increasing engagement and awareness levels regarding strategies used for environmental awareness programs (Bailey et al., 2015). Particularly, approaches that use the “window to the future” (Sheppard et al., 2008) and the “shock and awe” approach have been impactful. Mixed reality visualizations in weather channels that use these two strategies have helped viewers understand the impact of rapid weather phenomena like flash floods and wind strength during hurricanes (Branston, 2007). VR (tethered and wireless HMDs) had also been used to educate and raise awareness about environmental issues. Chirico et al. conducted a study to determine how to present statistical evidence about plastic consumption using 3 VR modalities. Numerical modality, concrete modality of using heaps of 3D plastic objects to make information more tangible, and a mixed modality were used. Preliminary results indicated that concrete and mixed modalities can promote pro-environmental attitudes and behaviors. In the realm of climate change education, VR has been used to teach ocean acidification (OA), demonstrating how VR can address issues that other learning environments cannot. The issues they focused on were students’ inability to understand the chemistry of OA, its magnitude, and their personal connection to the issue. The inability to understand chemical equations prevented students from grasping the causes and impacts of OA. Additionally, the invisible nature of OA made it impossible for educators to convey the magnitude of impact using other learning frameworks such as YouTube videos and video games. Lack of a personal connection to these geographical areas also challenged the learning outcomes. VR was impactful in addressing these three challenges to some degree (Fauville et al., 2021), (Markowitz et al., 2018). Strassman et al.’s work emphasized using physical movement via an ICAROS device and VR application to raise awareness about underwater plastic pollution. The study concluded that participants in a plastic-polluted underwater environment in VR expressed stronger feelings on the PANAS scale and engaged with content related to ecology conservation (Strassmann et al., 2020).
Virtual reality (VR) simulations in general serve as a fertile ground for organic creativity in educational landscapes, enabling K-12 students to naturally explore and engage with scientific concepts in a manner that traditional learning environments might not facilitate. In the realm of environmental awareness, VR’s immersive nature allows for a more intuitive understanding of ecosystems, making abstract concepts like marine ecology tangibly impactful. By simulating environments and scenarios that students can manipulate and explore, VR catalyzes a spontaneous connection with the subject matter, fostering a more profound and personal understanding of environmental issues.
While previous research studies predominantly used tethered VR headsets, the advent of the Oculus Quest 2 like wireless headsets has marked a transition towards wireless technology (Aniwaa, 2018). Across all studies, the common design themes that arise are that immersion and engagement help nudge players towards behavioral and attitude changes. Although our current work focuses on handheld or smartphone VR technology (Google Cardboard), these themes were still relevant to our design process. The extensive use of VR in educational settings, as demonstrated in the literature discussed above, highlights VR’s potential for immersive learning experiences. This aligns with our study’s objective to investigate VR’s efficacy in teaching complex environmental concepts. Moreover, studies showing VR’s impact on enhancing environmental awareness reinforce the relevance of our research in exploring how VR can be leveraged to cultivate a deeper understanding and concern for marine ecology among students. Thus, the existing body of work not only provides a foundation for our study but also underscores the significance of our investigation in the broader context of innovative educational technologies.
Shome et al., in their work on communication strategies for climate change, presented several theories such as “promotion vs. prevention focus,” “bringing the message close to home framing,” and the “matter now vs. future frame” (Shome and Marx, 2009). We incorporated the following strategies in our design and development process: a) immersive, b) time-bound, c) prevention-focused, and d) “bring the message close to home”. Everyday plastic pollution impacts communities around the world; however, for this case study, the emphasis was to create a digital game-based learning environment (Araujo-Junior et al., 2021) that focused on 1) particular species of marine life local to the area, 2) playing environments such as small to mid-sized boats that are omnipresent in the area, 3) underwater flora and fauna that is native to the area, and 4) four everyday pollutants and their impacts.
The target audience for this application is middle and high school students, as there has been documented evidence that engaging younger community members in activities related to sustainability programs has the potential to have broader reach (Mitchell et al., 2015). The application created in this study has been designed in a modular fashion, which will enable us to adapt the text to engage other age groups. Our study builds upon these concepts, harnessing the naturalistic engagement of VR to educate about marine ecology. By focusing on local marine life and pollution, we aim to stimulate the innate curiosity and creativity of middle and high school students, encouraging them to explore and understand their local environment’s ecological challenges. This approach not only educates but also inspires creative solutions and personal investment in environmental preservation. The following sections in the paper describe our choice of development platform, simulation features, methodology of user study, and findings.
Our project began at the onset of 2020 amidst the COVID-19 pandemic outbreak. The restrictions on face-to-face interactions and in-person user studies necessitated a remote study, presenting a new set of challenges not experienced by past in-person studies and thus requiring a more versatile and accessible virtual reality solution.
In a traditional remote study, participants must either already own the VR device used by the study or be provided one. Unfortunately, the traditional VR devices (wireless and tethered) used in past studies have prices starting at $300 and running upwards of $1000. This makes VR costly for research institutions and future deployment locations (Ex. K12 schools) requiring bulk purchases and an unaffordable luxury for most families. Additionally, chip shortages due to supply chain issues brought on by the pandemic led to retailers running out of stock.
The Google Cardboard (“Quickstart for Google Cardboard for) headset addresses these pricing and availability issues with its low cost (∼$20) and low requirements (a smartphone). It is a lightweight VR platform for mobile devices that works on most phones, including older ones such as the iPhone 5 from 2012 and Android devices on Android 4.4 “KitKat” from 2013. Although smartphones are not cheap, they are a versatile purchase that most students and families can access or already have. For research teams, the affordability of Google Cardboard and low-end smartphones allow for more devices to be purchased, making the study more scalable (Google developers, 2019).
In remote studies, the research team cannot set up the VR device and “play area” in advance, leaving it to the participant to properly set up. Traditional tethered and wireless headsets present impractical login requirements and setups, such as outlining the “play area”. With the research team unable to verify the participant’s setup in-person, this complexity is a significant barrier to reproduceable and consistent study environments.
The Google Cardboard headset’s simple setup solves this problem. Participants only need to download the Google Cardboard app, scan a QR code on their headset, and download the study’s app. These three steps are familiar to smartphone users and, to further reduce the setup burden, participants were sent a video demonstrating the headset’s controls and usage before the study began. This simplicity made setup a non-issue.
The study was conducted during the COVID-19 pandemic, making sanitization of the headsets a major concern. Fortunately, Google Cardboard’s low cost allowed a separate headset to be purchased for each participant, removing the need for sanitization and its associated risks.
Shome et al., in their work on communication strategies for climate change, emphasized the importance of framing messages in a context that is emotionally resonant with its audience. Informed by their work, our overall design goal became to create a VR simulation that framed the issue of marine pollution in “close to home,” “promotion,” “prevention,” and “matters now” contexts (Shome and Marx, 2009) (Shome et al., 2009). To make plastic pollution a “close to home” issue, we planned our simulation to feature the personal boats and marine life native to the participants’ area. We also chose to focus on four everyday pollutants participants were likely to use: plastic bottles, soda cans, soda rings, and plastic grocery bags. For the “promotion” and “prevention” contexts, we planned to show the health of marine life before and after pollution so that participants would be encouraged to both preserve the present environment and to prevent damage to it. Finally, to make the issue “matter now,” we planned to immerse participants in the consequences of pollution: a dying coral reef and a sea turtle choking on a plastic bag.
After identifying our strategies and focus, we grouped them into three lessons:
1. Marine debris can come from anyone.
2. Marine debris damages habitats.
3. Marine debris harms animals.
We realized these lessons in virtual reality by building on the design practices for virtual reality knowledge demonstration proposed by Horst and Dörner (Horst and Dörner, 2019a). Specifically, we applied the design practices for dynamic structure, puzzle, show-and-tell, and setting. We used setting to leverage the unique immersive capacity of virtual reality by transporting participants to where pollution happens, and we used dynamic structure to show the impact of that pollution. Puzzle was used to add interactivity to the second lesson by having participants locate and remove trash. For all lessons, show-and-tell was implemented as billboards that provided additional information on the lessons and marked where interactable objects were.
As our target user group included middle school students, we kept the text concise and the reading comprehension level to fifth grade. Additionally, we followed the usability guidelines of Dingler et al. (2018) for text in virtual reality: show-and-tell billboards were kept within 4.5–7 m of participants, paragraphs were no more than 39 characters wide, and text used a 60 pt sans-serif font for a body height of 23–37 mm per meter of distance from the participant. Additionally, we made our billboards taller than recommended for readability and used a dark font on a light background to stand out from the underwater virtual reality environment. While the dark font on a light background is the opposite of Dingler et al.‘s findings, their study used a dark virtual reality environment while ours uses a brighter environment.
Once our simulation was designed, we developed the playable version using Unity 2019.4.7f1. Unity is a professional game engine that can create VR applications. Its games consist of playable “scenes” made up of visual and audio “assets” manipulated by “component” scripts. We created separate scenes for the three lessons so that each could have unique visuals and behavior tailored to the lesson. Having separate scenes also allowed participants to “move” between locations despite the limitations of Google Cardboard. Between lessons, participants stand on a boat (Figure 1), where they can select one of the three lessons by gazing at the option and pressing the headset trigger:
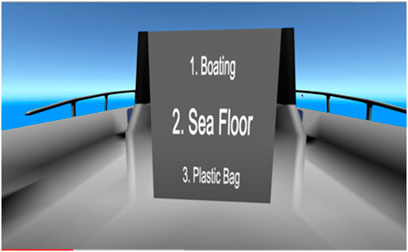
Figure 1. (Left): Initial menu scene on a boat where the player chooses a Scene to interact with.
Boating (Figure 2): The participant moves to the bow of the boat and faces a billboard explaining how litter can enter the ocean. Next to the billboard is a bottle, a soda can, and a plastic bag. When the participant is done reading the billboard, they are instructed to gaze at the items and press the trigger on their headset. This causes the trash to shake and fall into the ocean, acting out what was just read. After this, the participant returns to the boat’s stern to select the next scenario.
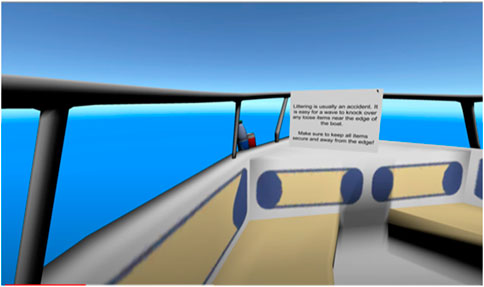
Figure 2. (Right): In Lesson 1, we depict unintentional littering as trash falls from a boat into the ocean.
Sea Floor (Figures 3, 4, 5): The participant is taken to a coral reef on the ocean floor, where a sea turtle swims overhead. The three pieces of trash from the “Boating” scenario (Lesson 1) are lodged in the ocean floor and tangled in coral next to billboards explaining how trash damages marine habitat. The participant is instructed to gaze at the trash and press the trigger on the headset to pick up the trash, turning it into bubbles. Once the participant has done this for all three pieces of trash, they are returned to the stern of the boat to select the next scene.
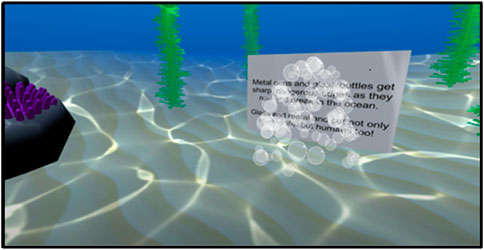
Figure 3. (Left) In Lesson 2, the player spots and collects the trash dropped in Lesson 1 by pressing the trigger button. When collected, the trash transforms into bubbles, signifying task completion.
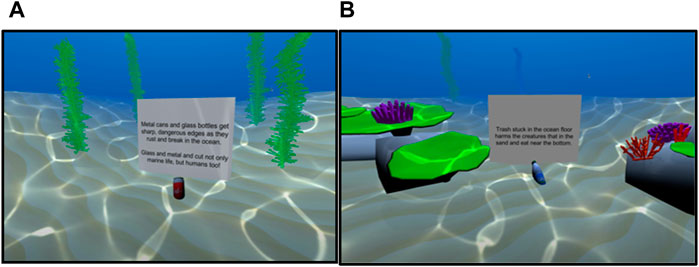
Figure 4. [(A)-Center and (B)_Right] Lesson 2 showcase more trash items with coral and sea grass as environmental markers.
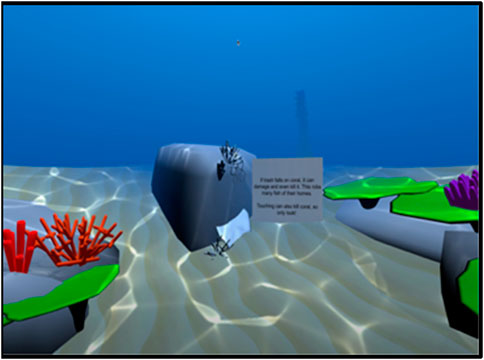
Figure 5. (Left): Scene 3 showcasing a plastic bag and JellyBean the turtle in the background approaching.
Plastic Bag (Figures 6, 7): The participant is taken to an open area on the ocean floor. A plastic bag floats above a rock. Beside it is a billboard explaining why loggerhead sea turtles eat plastic bags and how this harms them. The participant is instructed to gaze at the plastic bag and press the headset trigger. At this point, the sea turtle from the “Sea Floor” scene (Lesson 2) swims over, mistakes the bag for a jellyfish, eats the bag, chokes for a few seconds, and finally swims away. After the animation ends, the participant returns to the boat’s stern.
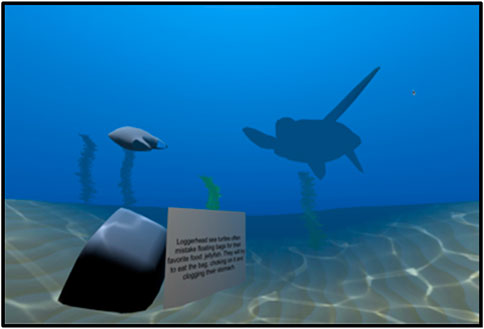
Figure 6. (Left): Scene 3 showcasing a plastic bag and JellyBean the turtle in the background approaching.
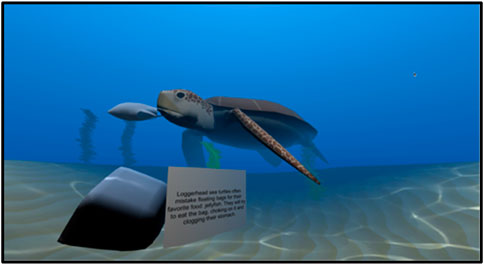
Figure 7. (Center) Scene 3 depicts JellyBean consuming a plastic bag.
To prevent disorientation when transitioning between scenes, the participant’s view fades to black over the course of a second before loading the scenario, and, once the scenario loads, the participant’s view returns to normal over the course of a second. Additionally, several visual cues tell the player where they are and create a connection with the previous scenes. Examples of visual cues are the boat visible in the menu and first two lessons, the trash present in the first and second lesson, and the sea turtle in the second and third lesson.
Within these scenes, we attempted to reduce information into “information nuggets” with a “functional coating,” as was suggested by Horst and Dörner (Horst and Dörner, 2019b). Generally, an “information nugget” is a reusable combination of Unity assets, whereas a “functional coating” is a component that gives the nugget some behavior or interactivity. For reusability across scenes, nuggets and functional coatings can be combined into a Unity “prefab.” In particular, the show-and-tell (billboards) and puzzle (interactable trash) patterns worked well as reusable, independent prefabs. However, unlike Horst and Dörner, we found that some knowledge dissemination patterns did not translate well into reusable Unity prefabs. The dynamic structure and setting patterns require several coordinated unique models, animations, and sound effects that were neither reusable across scenes nor self-contained enough for a single prefab. Despite this, we felt that the hand-crafted animations contributed to immersion during lessons and were worth the additional effort.
Game telemetry, information on how the simulation is running and how the participant is interacting with it, can provide additional quantitative data to studies and help improve and optimize simulations (Hullett et al., 2012). During traditional in-person studies using a VR headset, game telemetry is stored on the attached computer or in the headset and retrieved after the research session has concluded (Mottelson and Hornbæk, 2017), (Steed et al., 2016). However, in our remote study using mobile VR, it was unreasonable to ask participants to send us their smartphones. Instead, during the simulation, we stream the game telemetry to a research server in near real-time (Figure 8). Not only is this streaming convenient for researchers and participants, but it also allows the simulation to recover from intermittent internet outages and unexpected application exits.
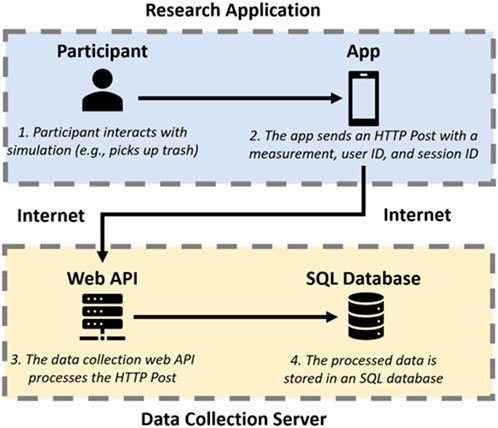
Figure 8. (Left): Visualization of the application’s data flow.
In our framework (Figure 9), telemetry consists of a user ID, session ID, and specific measure sent via HTTP Post to an API endpoint on the research server. The endpoint was implemented using ASP.NET Core, and the server stores the received telemetry in a MySQL database. The user ID is generated once when the simulation connects to the research server for the first time, and it is shared across all research sessions. In contrast, the session ID is regenerated each session. Together, these allow telemetry to be linked to a session and an anonymized participant. We chose to capture three measures that allowed us to “observe” participants’ patterns and verify their reported experiences after the session concluded. These measures were: “scene loading,” “reading duration,” and “user input” (Table 1).
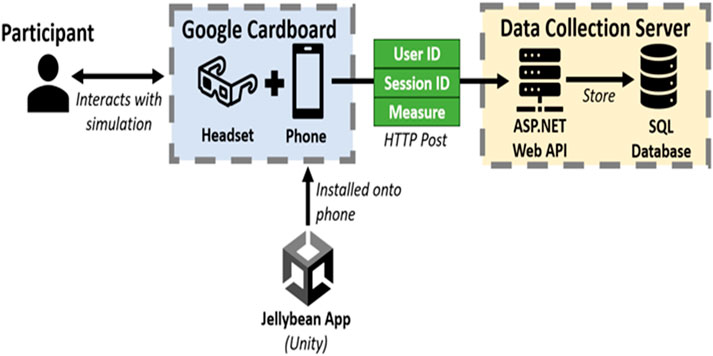
Figure 9. (Right): Visualization of the system architecture.
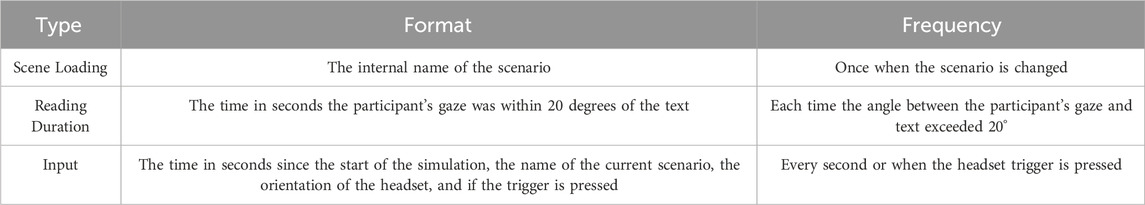
Table 1. Measures captured by the server for game telemetry related data.
In the study, we used the “scene loaded” measure to verify the lessons participants experienced and the “reading duration” measure to support qualitative information about the time participants spent reading text.
While it was unused for this study, the “input” measure can be used to replay the research session on researchers’ machines. A prototype of this worked by queueing up the “input” measures for a specific user ID–session ID pair and updating the simulation’s camera orientation and internal trigger-pressed state to match the telemetry. Not only does this allow researchers to watch the session as if it was in-person, but new measures can be generated from the replay. For example, the same “reading duration” measures can be generated from the replayed session.
To ensure the informed consent of participants, the simulation begins with a prompt to read and agree to the following data being collected during the research session:
• “Phone orientation/rotation”
• “What [scenario] is loaded.”
• “If a specific interaction (picking up trash) occurred.”
The participant can consent by pressing the trigger on the cardboard headset, and it is only after this that the VR application attempts to connect to the research server. Additionally, the API endpoint is only enabled during the research session, preventing accidental data collection when a researcher is not present.
To ensure the anonymity of a participant, user IDs and session IDs are randomly generated and no personal identifiers are stored. While it is possible to link a user ID to a particular research participant, it requires an intimate knowledge of the original research session that only the participant and researcher have. Furthermore, the MySQL database storing this data is maintained and only accessible by the research team.
After the development of the VR simulation and data collection framework, we conducted a user study for evaluation and feedback.
A user study was conducted with 12 middle and high school students with an average age of 13.5 years, including six female and six male participants, who were part of a STEM summer program hosted by our institution. Most of these students came from underserved communities, attending public school in two neighboring counties. The program focused on engaging students in activities that connect health of the Sarasota Bay to their personal wellbeing. Many students came from households where English was a second language and had reported challenges with science subjects in school. The summer program also aimed to support future first-time-in-college (FTIC) students and their families familiarizing them with college life and the admissions process.
Of the total 16 camp participants, all were involved in this study; however, only 12 were considered viable participants due to language barriers. The remaining four were primarily Spanish speakers still learning English and needed substantial assistance to read the simulation prompts. This study was conducted in 2022, a time when the community was transitioning out of hybrid learning for K-12 students, limiting participation in the in-person camp and our overall sample size.
Figure 10 illustrates the study protocol approved by NCF’s Full IRB board. As the participants were all minors, parental consent for data collection and participation was obtained in addition to the participant’s consent during the study. We conducted an interview study with pre-post simulation questionnaire in addition to open-ended questions. Participants were brought to the study location and asked to sit in front of a computer for audio recording. The study started after a brief introduction to Google Cardboard and mobile VR controls. Throughout the study, we obtained game telemetry data using the framework detailed in Section 5 of the paper. Additionally, we recorded audio throughout the entire study session to capture comments made during or after the study.

Figure 10. Flowchart illustrating the user study process.
Throughout the duration of the study, a “think aloud protocol” (Fonteyn et al., 1993) was implemented to capture participants’ responses while they engaged with the simulation. Table 1 illustrates the questions which were asked for both pre and post surveys, questions asked only during post survey.
For the post-study survey, we employed a modified version of Slater et al.'s presence, immersion, and engagement questionnaire (Slater, 1999). To avoid potential comprehension difficulties that could lead to inaccurate responses, we chose not to administer the full questionnaire. Instead of using the complete Simulator Sickness Questionnaire (SSQ) (Kennedy et al., 1993), we opted to ask participants only about nausea and motion sickness during the simulation, requesting a simple thumbs-up or thumbs-down response. Additionally, we conducted open-ended interview questions that expanded upon these survey responses, with the thematic analysis provided in Section 6.2. Alongside questions on presence and engagement, we sought to understand participants’ interest in, and prior exposure to, technology and environmental topics, as shown in Table 2.
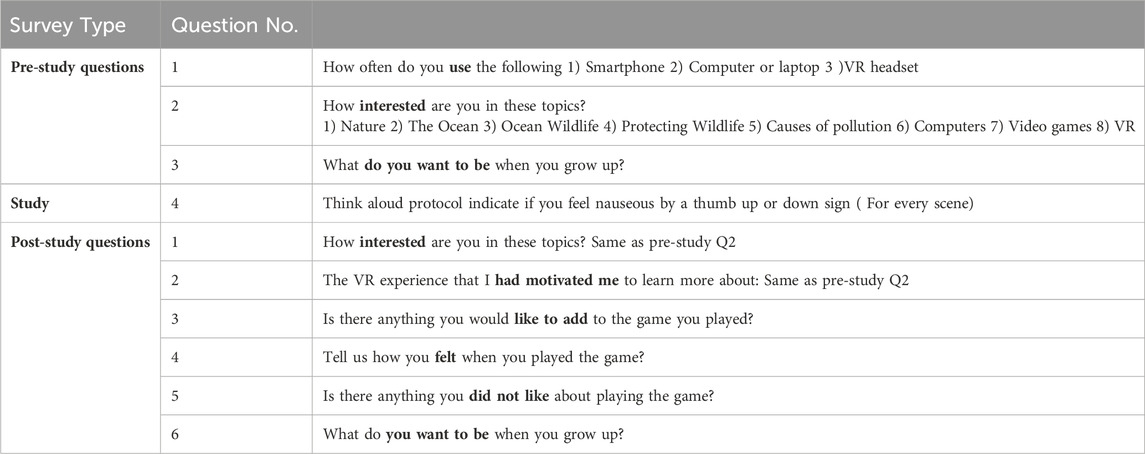
Table 2. Likert scale and open-ended questions presented during the user study sessions.
Our study followed a mixed-methods approach to assess the effectiveness of a Google Cardboard VR simulation in fostering motivation, interest, and awareness about environmental issues—specifically marine pollution—and participants’ perceptions of VR as a tool for education.
We collected and analyzed the pre and post survey data (Table 2) to demonstrate the effectiveness of the Google Cardboard VR simulation. First, we decided on eight topics that addressed students’ interest and motivation about 1) environmental issues and 2) virtual reality. In particular, the first five topics focus on the environment (nature, ocean, marine life, pollution), while the last three pertain to VR and technology (computer, video games, virtual reality).
With those topics in mind, to infer the causal impact of the VR simulation on students’ motivation post completion, we asked them to use the Likert scale from one to five to rate their response to the following statement for each of the eight main topics: ‘The VR experience I had inspired me to delve deeper into [Pre-study Q2 from Table 2].’ To model these responses, we used an item-subject mixed-effects statistical approach (Baayen et al., 2008), subjects are equivalent to study participants, while items are the topics mentioned earlier. More specifically, we used the following formula: Lij = μ + itemi + subjj + εij, where Lij represents the Likert score for the jth subject (study participant) when answering about ith item (topic), μ is the average Likert score across all subjects and items, itemi is the random effect of the ith item, subjj is the random effect of the jth subject, and εij is the modeling error term. The random effects (itemi, subjj) allow us to carefully capture the dependence between responses for the same topics and from the same subjects. We used the ‘lmer package’ in the R Statistical package (“lmer function”) to fit that model (Lmer function, 2009).
We ran the same model (Baayen et al., 2008) separately for the environmental topics (Table 2 pre-study Q2.1- Q2.5) and the VR/technology-related pre-study question (Table 2 pre-study Q2.6- Q2.8) to distinguish between the impact the VR session might have on students’ motivation towards learning more about the content presented via VR (environmental issues) as opposed to the VR medium itself. Subsequently, we conducted statistical inference to find out whether a typical Likert response was higher than the average Likert category of 3 (“Neither agree nor disagree”). In particular, we conducted a statistical test for the hypothesis H0:μ = 3, obtaining a p-value to gauge statistical significance. We also calculated a 95% confidence interval for μ, thereby providing the entire range of plausible values for the typical Likert score.
Results for the above-mentioned motivation questions are presented in the “1. Motivation: Content” and “2. Motivation: VR/Tech” entries of Figure 11. The Likert scores for motivation questions being significantly above three for both the environment/nature content and VR medium itself (with p-values of <0.05). The corresponding 95% confidence intervals indicate a stronger motivation for nature related content, where the lower bound of the confidence interval (3.4) is noticeably higher than for the motivation to learn more about VR/Tech itself (3.2).
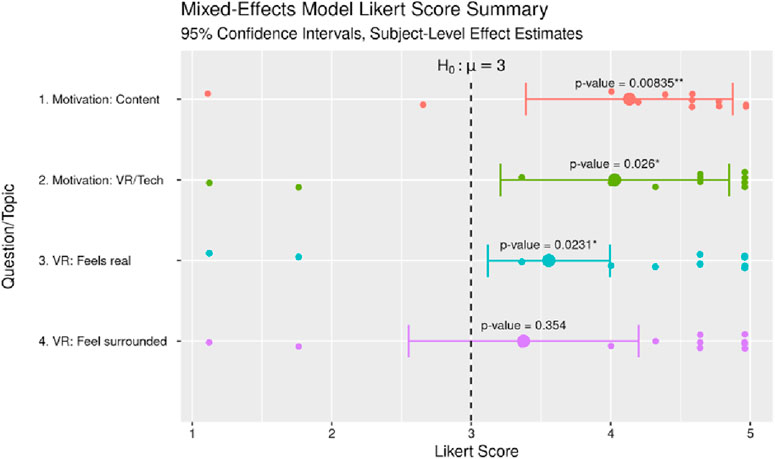
Figure 11. Graphical representation of the fitted item subject mixed-effects models to estimate the typical Likert score μ provided after simulation for topics pertaining to a specific research question. The bands correspond to 95% confidence intervals for that score μ, while small points represent subject-level random effect estimates. The dashed line indicates the null hypothesis value of 3 (“neither agree nor disagree”).
In addition to the motivation questions, we asked six questions on a five-point Likert Scale post-completion of the VR session shown in Table 3.

Table 3. Post-study Likert scale questionnaire to measure engagement, realism and presence.
In particular, the first question (#Q1) evaluated how engaging the game was, questions #Q1, #Q2 & #Q6 address how real the VR experience felt, and questions #Q4 and #Q5 (Table 3) focused on whether the students felt surrounded or immersed in the scene.
For the first question (#Q1), the median score of 4 and average of 3.6 indicated an above-average rating for the engagement level of the game. However, the small sample size (with one question, we only have 12 observations) does not allow us to make a definitive conclusion for that hypothesis. For the questions pertaining to realism (Table 3. #Q2, #Q3, #Q6) and whether students felt part of the scene (#Q4, #Q5), we carried out the same subject-item mixed-modeling framework as discussed above to calculate statistical inference on whether the average Likert score was above 3 (“Neither agree nor disagree”) (Baayen et al., 2008). Figure 11 shows the results of the analysis, demonstrating statistically significant evidence towards above-average responses to the questions about the VR scene feeling real.
The “3. VR: Feels real” and “4. VR: Feel surrounded” entries of Figure 11 show the results of the analysis, demonstrating statistically significant evidence towards above-average responses to the questions about the VR scene feeling real (p-value <0.05), although the 95% confidence interval indicates a relatively low range of plausible values (lower bound of 3.11, upper bound of 3.99). As for students feeling surrounded or a part of the scene, there was not enough statistical evidence to claim significance (p-value of 0.354), with the 95% confidence interval of plausible values for the average Likert score being (2.55, 4.2), with the score of three being well within the interval. One could also notice that the interval for “4. VR: Feel surrounded” is much wider than for “3. VR: Feels real”, which could be a byproduct of having only two questions (as opposed to three for “3. VR: Feels real”), and a larger sample size would typically be preferred to yield more conclusive evidence at a set significance level.
Lastly, we also conducted a pre-and post-study survey that consisted of the same question to be answered on the Likert scale concerning each of the eight topics mentioned Table 2 above: “How interested are you in this topic?”. To analyze the potential change in interest, we added a fixed treatment effect parameter to the mixed-effects item-subject model from (Baayen et al., 2008) to represent the difference in scores between the post- and pre-session surveys. Our modeling formula became: Lijk = μ +β trtijk + itemi + subjj + εijk, k = 1,2, where k = 1 indicates the pre survey answers, k = 2 - post survey answers, trtijk is an indicator variable (it is 0 when k = 1, and one when k = 2), and β is the fixed treatment effect to represent the impact of the VR session on student interest in respective topics.
We conducted statistical tests for the hypothesis H0:β = 0, obtaining p-values to gauge statistical significance of VR session’s impact. We also calculated 95% confidence intervals for β, thereby providing the entire range of plausible values for that effect. Results are presented in Table 4, including separate models for interest in content and in VR/technology, respectively, as well as a model that combines the data from both categories. Results for separate models do not show a statistically significant effect at the typical level of 0.05 for either the environment or technology interest (p-values of 0.126 and 0.109, respectively), but still present some evidence for the increased interest in topics after the VR session due to most of the plausible values being above 0 for both the content- and VR-related topics. The model which included all questions, on the other hand, showed statistical significance at the 0.05 level (p-value of 0.048). That goes to confirm the intuition of the VR session having an impact on student interest in topics, and how it helps to borrow strength across multiple questions given the small sample size of student participants.
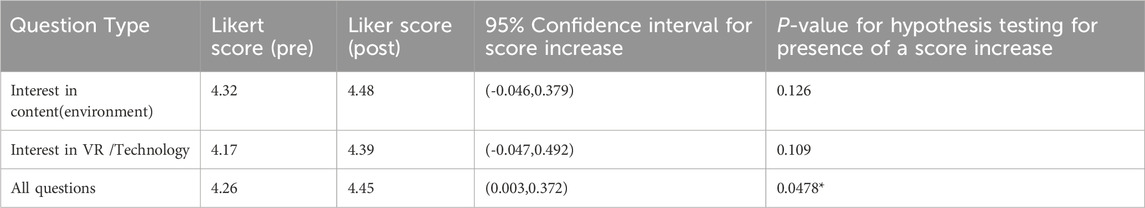
Table 4. Summaries of estimated Likert scores for topic interest questions before and after the VR session and confidence interval for those changes.
Our in-game telemetry data (Figure 12), collected during the study, revealed that some participants spent longer reading informational text inside the game than others. In the trash pickup scene (Lesson 1), participants spent an average of 34.49 s looking at each information panel about pollution and littering. Between the three written information panels in Scene 2 (Figure 11), participants spent an average of 59.24 s reading written information in the trash collection scene. Participants spent an average of 83 s inside the game scene, picking up trash. On average, participants spent a total of 95 s reading written information in the game, compared to an average of 260 s spent in the game total, which is around 36% of their total game time reading written information, suggesting that the content needed to be optimized and participants voiced that during the discussion phase.
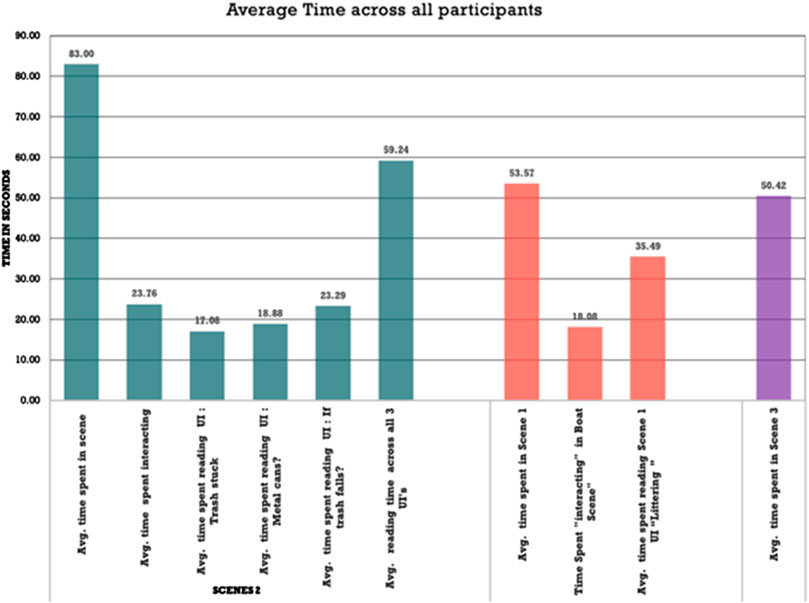
Figure 12. illustrating average time spent in seconds across Scene 1, Scene 2 and Scene 3 along with average time spent reading text UI in Scene 1 and Scene 2.
The qualitative responses collected were audio recorded and then transcribed to generate reoccurring themes, and this section elaborates on the responses and themes (Guest et al., 2011). Our qualitative data analysis follows a tiered approach and an inductive methodology (Planning a qualitative study, 2018) to generate themes. In Tier 1, the initial coder examined the transcript identifying recurring themes, clustering them based on similarity and using the descriptive coding methodology to label them. This clustering formed the foundation for subsequent analysis. Moving to Tier 2, a second coder independently reviewed the clustered themes and descriptive terms associated with them, providing validation by either corroborating existing clusters or proposing new ones as necessary. Finally, Tier 3 involved collaborative discussions between both coders to assess the relevance and significance of the clustered themes and descriptive terms associated with them. Through iterative deliberations and consensus-building, the final classification of themes was determined.
Career Interests and Environmental Awareness - Participants showed a common interest in careers related to arts and healthcare. Their passion for environmental protection was notable. One participant mentioned how art in public spaces can showcase the dangers of ecological challenges, and another participant stressed the importance of clean air and how both plants and humans depend on it. These participants were also passionate about helping others in their community and globally. They also recognized how their career interests relate to environmental protection. Participant [PID 060603] mentioned how, as an artist, they could make a “drawing to represent helping/supporting sealife” to “help some people understand about the situation going on”. Another participant, [PID 060703], wanted their future career to focus on “mak(ing) people (become) more aware of different disparities like global warming” and “(not) focus on the wrong (but also) bring solutions.” The desire to help humans and animals placed participants in a pivotal position to relate to the game’s mission to educate the audience on the importance of marine ecosystem protection and conservation.
Realism and engagement through action items- Participants were satisfied with the game but believed that the game could be more engaging. This theme is consistent with the post-study survey response regarding engagement and realism (Figure 11), where participants, although providing mostly positive feedback on the VR simulation feeling real (the effect was found to be statistically significant at 0.05 level), had mixed responses regarding the engagement aspect and feeling part of the scene (not statistically significant). Participants suggested adding more interactive elements, enhanced graphics, and action items. Environmental markers, such as more marine animals or trash and action items (i.e., moving more, grabbing the bag before the sea turtle did, etc.) or improving the graphics in the game, would make participants feel more immersed in the game. However, one participant commented that “(there was) nothing they did not like” and that the “game was self-explanatory” (and) successfully conveyed the intended message. This dichotomy between wanting to add more interaction and having an easy-to-navigate simulation is insightful for educational VR developers, particularly ones focused on low-cost VR applications. For the survey question related to engagement, realism, and their desire to help the turtle (Table 2), participants suggested adding more items in the surrounding areas in the underwater and boat scenes. [PID 060705] proposed an improvement for the game where there would be “a little bit more garbage” and “birds in the air and garbage in the water.” during the boat scene. Several participants, including [PID 060702], wanted to” grab. the plastic bag” before the turtle choked. In addition to increasing the readability of the text information in the simulation, participants wanted increased interactivity by trying to make it more interactive by adding, “more trash. to pick up more trash. [and to] see the turtle eat more trash and how they react to it” [PID 060722]. The same participant wanted to add a more “engaging font,” such as “bubble letters. [or] bold letters [to] make it pop out more”. [PID 060705] mentioned they liked the game because “it spreads. awareness towards that cause of pollution. Plastic bottles and bags. to save the turtles and stuff.” [PID 060607] wanted to learn more about pollution and wanted “more information on different types of pollution.” [PID 060606] brainstormed ways to incorporate environmental awareness into their careers, such as creating art depicting the ocean and coral bleaching. Overall, the participants connected with the simulation’s message, and there were strong indicators that they wanted to incorporate these into their daily and future lives.
Educational simulations vs. games, expectation challenges: An additional noteworthy finding emerged from the open-ended responses, shedding light on the stark contrast in participants’ expectations between a “VR game” and an “Educational VR simulation.” These responses underscored the significance of framing and categorization in virtual reality experiences. Participants approached this simulation as a game created solely for entertainment. For the pre-study question on how often they interact with smartphones and computers, most responded affirmatively to the option “few times a week.” Responding to the question, “How interested are you in the topic of video games?” nine out of the 12 participants expressed a range of interest from “strongly interested” to simply “interested.” A traditional VR gaming experience expectation does not align with the goal of our awareness simulation, where the focus is not on competition or challenges but on immersive learning and informational value.
This expectation disparity suggests that the choice of terminology and the context in which VR experiences are presented can significantly influence participants’ perceptions and engagement. This finding underscores the importance of effectively communicating VR simulations’ educational intent and benefits to participants. It highlights the need for clear and accurate labeling and marketing of VR content to ensure that users have appropriate expectations and can fully appreciate the educational value that VR simulations can offer. Additionally, it emphasizes the potential for optimizing the design and presentation of educational VR experiences to align with users’ educational objectives and preferences, ultimately enhancing the effectiveness of VR-based learning tools.
Emotional connection and awareness goals: A central topic of interest shared by many participants was the interaction between the sea turtle and the plastic bag in the underwater scene. While some participants wanted the opportunity to save the sea turtle, others were introduced to or learned more about the issue of turtles eating plastic bags, mistaking them for jellyfish. It is essential that participants were focused on the underwater scene because it connects directly to the message and overall purpose of the game: to educate the audience on common obstacles created by plastic pollution and to encourage additional environmental actions once the player concludes playing the game. In addition, participant data reveals that nine (out of twelve) agree on a five-point scale that the turtle is real. This is also consistent with the results illustrated in Figure 11.
Acknowledging the Limitations of Google Cardboard VR: Participants recognized the limitations of Google Cardboard VR, including lower-quality graphics and limited interactivity. However, as most could grasp the study’s goal, it is feasible to work within realistic expectations of the platform and leverage the educational value and accessibility of Google Cardboard VR for wider reach.
In the study’s conclusions, participants demonstrated an alignment between their career interests and environmental awareness, indicating a fertile ground for integrating environmental education within various professional fields. The desire for more dynamic and graphically immersive elements in VR suggests a need for educational simulations that balance interactivity with informative content. The study also highlights the importance of setting clear expectations for VR experiences to enhance educational engagement. Emotional connections, particularly through realistic simulations, emerged as key to deepening environmental understanding. Finally, despite its limitations, the Google Cardboard VR’s accessibility suggests its potential for broadening educational outreach and impact.
Here, we discuss the insights drawn from both data analyses, emphasizing the implications for educational VR design and the potential of VR-based environmental education.
Motivational Impact of VR on Environmental Awareness: The results demonstrate that the VR simulation positively influenced students’ motivation to learn more about environmental topics. The student responses for the Likert scale ratings related to environmental motivation were significantly above the neutral score of 3, with a lower bound of the confidence interval at 3.4. This statistically significant finding suggests that the VR experience engaged students and increased their interest in environmental issues, including topics such as marine life, pollution, and conservation. This engagement was evident in students’ feedback. For example, Participant [PID 060607] expressed a desire to “learn more about different types of pollution”. These responses underscore the potential of VR to evoke a strong interest in environmental protection, suggesting that VR-based simulations can be powerful tools to foster environmental stewardship among young audiences.
Realism, Presence, and Engagement in the VR Experience: The study revealed nuanced perceptions regarding the realism and immersive quality of the VR simulation. The quantitative data indicated that students rated the VR environment as moderately realistic, with average scores significantly above 3. However, responses related to feeling “surrounded” or “immersed” did not reach statistical significance, with a wide confidence interval that included the neutral score. This suggests that while students found the simulation visually realistic, they did not feel fully immersed in the environment—a limitation likely tied to the low-fidelity, single-sensory nature of Google Cardboard VR. Qualitative feedback corroborates these findings, highlighting both positive reactions and limitations in perceived immersion. Participant [PID 060705] suggested the simulation would feel more immersive if there were “birds in the air” or more visible garbage in the water during the boat scene, adding that “grabbing the plastic bag” before the turtle choked could increase interactivity. This feedback emphasizes the importance of balancing realism with interactivity in educational VR, especially when using low-cost VR tools like Google Cardboard.
For future environmental educational simulations, it would be advantageous to incorporate these analogies and encourage participants to actively engage in conservation as responsible citizens and motivate them to pursue careers in environmental preservation.
Emotional Engagement and Connection to Environmental Issues: The VR simulation’s emotional impact emerged as a central theme in students’ responses, particularly concerning scenes depicting marine pollution’s impact on wildlife. The underwater scene where a sea turtle mistakes plastic for food resonated deeply with students. Likert scale responses showed that students felt a connection to the turtle and the environmental issues presented, with high ratings in motivation to learn more about environmental protection. Participants’ comments reflected this too, where several expressed a desire to help the turtle or engage more deeply with the scene. For instance, some participants voiced disappointment at not being able to “save the turtle,” suggesting a desire for more direct involvement in the scenario. The focus on this scene highlights how VR can elicit empathy and raise awareness about environmental challenges. By creating emotionally impactful scenarios, VR simulations may inspire young audiences to think critically about environmental issues and consider personal actions or future careers that contribute to conservation (Springer, 2008).
Balancing Accessibility and Quality in VR for Education: The Google Cardboard VR platform, while accessible and affordable, introduced limitations that affected the perceived quality and realism of the experience. Although the participants rated the simulation as relatively realistic, impact of limited immersion due to the single-sensory and low-fidelity display was evident. Several participants commented on these limitations, with several mentioning that the graphics were “blurry” or that the simulation lacked detail in certain scenes. Despite these critiques, many participants recognized the accessibility advantages of Google Cardboard, with one participant noting that the VR experience “spread awareness toward pollution” effectively despite the limitations in graphic quality.
This feedback underscores a key consideration for educational VR design: while high-fidelity VR systems offer greater immersion, they may be inaccessible for resource-constrained settings. Google Cardboard VR provides a feasible alternative for wider educational outreach, but developers may need to compensate for its limitations by carefully designing engaging content that leverages the platform’s strengths. For instance, increasing interactive elements and optimizing text readability within the simulation could improve engagement without requiring higher-resolution displays. Additionally, the pandemic demonstrated the need for cost-effective technologies solutions when reusing headsets is not feasible, Google Cardboard VR provides a suitable alternative solution where we want to reach a broader community to have meaningful long-lasting impact.
Our pilot study highlights the potential of Google Cardboard VR, as an effective and accessible tool for raising awareness about environmental issues and engaging participants in a meaningful way however there were several limitations to this study.
The remote data collection framework introduced in Section 5 represents a step towards real-time game analytcs data collection for handeld or smartphone based VR viewers. However, our framework was unable to clearly distinguish time spent reading billboards if the player looked around the environement too frequently and we were also unable to collect granular data on the time spent on observing objects in the environment. These challenges in fine-grain telemetry data analysis, such as tracking participants’ reaction times and gaze behavior are limitations of our current framework that require future work. Moreover, the possibility of replaying the simulation remains an avenue for future investigation and development.
Frame rate constraints, particularly the challenges of deploying this app across diverse mobile devices, led to a design decision to reduce the fidelity of the graphic elements in the game. Slower frame rates cause severe issues with engaging users, but creating a realistic simulation causes the simulation to have longer loading times. Although Google Cardboard platform addressed the challenges of a remote VR study, Google Cardboard is designed for a regular mobile device, it cannot produce photorealistic real-time environments, limiting any VR simulation to a more cartoon style and mostly static environment. Google Cardboard also lacks a controller and does not have positional headtracking, limiting player interaction to looking around the environment from a sitting position and pressing a button on their headset. We plan to investigate ways to further optimize our simulation and balance fidelity and engagement.
The small sample size of our participant pool is also a limitation. As we conducted this study when our school system was still transitioning out of hybrid learning we were unable to recruit more participants at that time. For future work we propose expanding this study to include more participants to get robust feedback.
As we navigate the post-COVID-19 landscape, it is evident that some practices, like remote learning, are here to stay, and Google Cardboard VR can play a vital role in engaging students in immersive, time-bound virtual experiences. Our findings indicate a promising strategy to utilize the platform’s accessibility for broader community outreach, extending the environmental message beyond the confines of the classroom to achieve a more substantial and enduring impact.
For future work, we also plan to incorporate participants’ requests for the expansion of our existing simulation, by adding more items for trash collection. One such scenario can be to addres the pressing concern of pandemic-related waste products in the ocean highlighting the importance of more interactable elements. From a development perspective, expanding any application is greatly aided by reusable assets and, while some of the design patterns we followed produced these, just as often we had to handcraft “one-off” animations and interactions (Table 5). Participants expressed an interests in both reusable (trash collection) and one-off assets (choking sea turtle), showing that both have value. “One-off” assets require considerable time to produce compared to their limited use, so future work is needed to create new techniques for efficiently adapting “one-off” assets to new scenarios and expanding their use. Additionally, future investigations into which design patterns best achieve learning and advocacy goals is needed to help researchers focus their design and development, improve outcomes, and reduce the development burden. We believe this future work to be important because the simplicity and reach of Google Cardboard VR offers promising prospects for public engagement in environmental challenges.
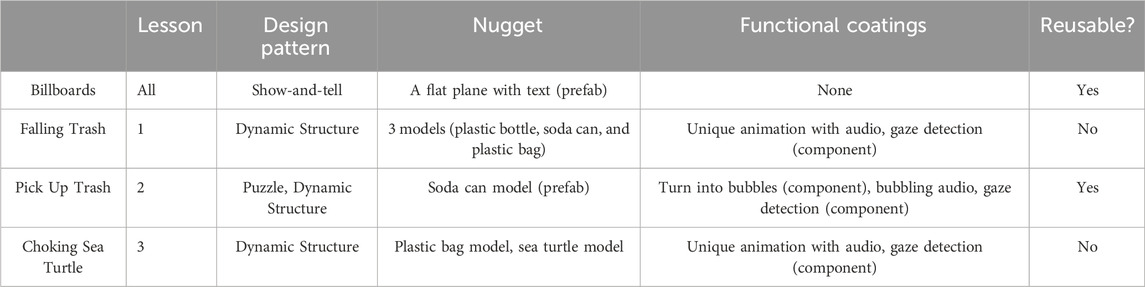
Table 5. Implementation of VR design patterns in Unity showcasing reusability.
In conclusion, Google carboard VR as an educational tool, with its accessibility and versatility, presents an exciting avenue for raising awareness about environmental challenges and engaging the public. Our research has laid the groundwork, and future work will focus on refining data collection, enhancing simulations, and addressing emerging environmental concerns. Our current simulation design emphasizes that VR can be a powerful catalyst for organic creativity, particularly in the context of environmental education. By creating experiences that align with natural human instincts and emotions, we aim to foster an innate connection with the environment and stimulate the emotional connection necessary for innovative problem-solving and environmental stewardship. An adaptive approach such as this, can be instrumental in developing educational content that is not only accessible but also rich in experiential learning, preparing a blueprint for future educational technologies that are inclusive and effective across various learning settings.
The raw data supporting the conclusions of this article will be made available by the authors, without undue reservation.
The studies involving humans were approved by New College of Florida Institutional Review Board. The studies were conducted in accordance with the local legislation and institutional requirements. Written informed consent for participation in this study was provided by the participants’ legal guardians/next of kin.
TR: Conceptualization, Data curation, Formal Analysis, Funding acquisition, Investigation, Methodology, Project administration, Resources, Software, Supervision, Validation, Visualization, Writing–original draft, Writing–review and editing. HS: Conceptualization, Methodology, Resources, Software, Visualization, Writing–original draft, Writing–review and editing. AS: Formal Analysis, Investigation, Methodology, Resources, Validation, Visualization, Writing–review and editing. SG: Conceptualization, Investigation, Resources, Writing–review and editing.
The author(s) declare that financial support was received for the research, authorship, and/or publication of this article. Cross College Alliance’s Environmental Discovery Awards Program 2022.
We thank Cross College Alliance for providing the Environmental Discovery Awards 2022 which funded the summer program held at New College of Florida which was the site for our user study.
The authors declare that the research was conducted in the absence of any commercial or financial relationships that could be construed as a potential conflict of interest.
All claims expressed in this article are solely those of the authors and do not necessarily represent those of their affiliated organizations, or those of the publisher, the editors and the reviewers. Any product that may be evaluated in this article, or claim that may be made by its manufacturer, is not guaranteed or endorsed by the publisher.
Ahn, S. J. (2015). Incorporating immersive virtual environments in health promotion campaigns: a construal level theory approach. Health Commun. 30 (6), 545–556. doi:10.1080/10410236.2013.869650
Anderson, P. L., Rothbaum, B. O., and Hodges, L. (2001). Virtual reality: using the virtual world to improve quality of life in the real world. Bull. Menn. Clin. 65 (1), 78–91. doi:10.1521/bumc.65.1.78.18713
Aniwaa (2018). Types of VR headsets: PC VR, standalone VR, smartphone VR. Available online at: https://www.aniwaa.com/guide/vr-ar/types-of-vr-headsets/.
Araujo-Junior, R., Bodzin, A., Hammond, T., Anastasio, D., Lam, B., Mack, J., et al. (2021). Work-in-Progress-Watershed explorers: designing a virtual reality game to promote local watershed literacy, 1–3. doi:10.23919/iLRN52045.2021.9459394
Baayen, R. H., Davidson, D. J., and Bates, D. M. (2008). Mixed-effects modeling with crossed random effects for subjects and items. J. Mem. Lang. 59 (4), 390–412. doi:10.1016/j.jml.2007.12.005
Bailey, J. O., Bailenson, J. N., Flora, J., Armel, K. C., Voelker, D., and Reeves, B. (2015). The impact of vivid messages on reducing energy consumption related to hot water use. Environ. Behav. 47 (5), 570–592. doi:10.1177/0013916514551604
Bertrand, J., Bhargava, A., Madathil, K. C., Gramopadhye, A., and Babu, S. V. (2017). “The effects of presentation method and simulation fidelity on psychomotor education in a bimanual metrology training simulation,” in 2017 IEEE symposium on 3D user interfaces (3DUI) (IEEE), 59–68. Available online at: https://ieeexplore.ieee.org/abstract/document/7893318/.
Branston, G. (2007). The planet at the end of the world. New Rev. Film. Telev. Stud. 5 (2), 211–229. doi:10.1080/17400300701432936
Dingler, T., Kunze, K., and Outram, B. (2018). “VR reading UIs: assessing text parameters for reading in VR,” in Extended abstracts of the 2018 CHI conference on human factors in computing systems, Montreal QC Canada. 1–6. doi:10.1145/3170427.3188695
Draper, J. V., Kaber, D. B., and Usher, J. M. (1998). Telepresence. Hum. Factors J. Hum. Factors Ergon. Soc. 40 (3), 354–375. doi:10.1518/001872098779591386
EDIIIE (2002). Ame (aircraft maintenance engineering) training through vr,” EDIIIE. Available online at: https://www.ixrlabs.com/blog/ame-aircraft-maintenanceengineering/
Fauville, G., Queiroz, A. C. M., Hambrick, L., Brown, B. A., and Bailenson, J. N. (2021). Participatory research on using virtual reality to teach ocean acidification: a study in the marine education community. Environ. Educ. Res. 27 (2), 254–278. doi:10.1080/13504622.2020.1803797
Fonteyn, M. E., Kuipers, B., and Grobe, S. J. (1993). A description of think aloud method and protocol analysis. Qual. Health Res. 3 (4), 430–441. doi:10.1177/104973239300300403
Gall, S. C., and Thompson, R. C. (2015). The impact of debris on marine life. Mar. Pollut. Bull. 92 (1), 170–179. doi:10.1016/j.marpolbul.2014.12.041
García-Gómez, J. C., Garrigós, M., and Garrigós, J. (2021). Plastic as a vector of dispersion for marine species with invasive potential. A review. Front. Ecol. Evol. 9, 629756. doi:10.3389/fevo.2021.629756
Gómez-Cambronero, Á., Miralles, I., Tonda, A., and Remolar, I. (2023). “Immersive virtual-reality system for aircraft maintenance education: a case study,” Appl. Sci., 13, 5043, 8. doi:10.3390/app13085043
Google developers (2019). Quickstart for Google cardboard for unity. Available online at: https://developers.google.com/cardboard/develop/unity/quickstart.
Horst, R., and Dörner, R. (2019a). “Integration of bite-sized virtual reality applications into pattern-based knowledge demonstration,” in Proceedings of the 16th workshop virtual and augmented reality of the GI group VR/AR (Shaker Verlag: Gesellschaft für Informatik), 137–148.
Horst, R., and Dörner, R. (2019b). “Virtual reality forge: pattern-oriented authoring of virtual reality nuggets,” in 25th ACM symposium on virtual reality software and technology (Parramatta NSW Australia: ACM, Nov.), 1–12. doi:10.1145/3359996.3364261
Hullett, K., Nagappan, N., Schuh, E., and Hopson, J. (2012). “Empirical analysis of user data in game software development,” in Proceedings of the ACM-IEEE international symposium on Empirical software engineering and measurement (Lund Sweden: ACM), 89–98. doi:10.1145/2372251.2372265
Kennedy, R. S., Lane, N. E., Berbaum, K. S., and Lilienthal, M. G. (1993). Simulator sickness questionnaire: an enhanced method for quantifying simulator sickness. Int. J. Aviat. Psychol. 3 (3), 203–220. doi:10.1207/s15327108ijap0303_3
Limniou, M., Roberts, D., and Papadopoulos, N. (2008). Full immersive virtual environment CAVETM in chemistry education. Comput. Educ. 51 (2), 584–593. doi:10.1016/j.compedu.2007.06.014
Lmer function (2009). Lmer function - RDocumentation. Available online at: https://www.rdocumentation.org/packages/lme4/versions/1.1-35.5/topics/lmer
Markowitz, D. M., Laha, R., Perone, B. P., Pea, R. D., and Bailenson, J. N. (2018). Immersive virtual reality field trips facilitate learning about climate change. Front. Psychol. 9, 2364. doi:10.3389/fpsyg.2018.02364
Mitchell, I. K., Ling, C., Krusekopf, C., and Kerr, S. (2015). Pathways toward whole community transformation: a case study on the role of school engagement and environmental education. Environ. Dev. Sustain. 17 (2), 279–298. doi:10.1007/s10668-014-9587-9
Mottelson, A., and Hornbæk, K. (2017). “Virtual reality studies outside the laboratory,” in Proceedings of the 23rd ACM symposium on virtual reality software and technology (Gothenburg Sweden: ACM, Nov.), 1–10. doi:10.1145/3139131.3139141
OECD (2022). Global plastics outlook: economic drivers, environmental impacts and policy options. Paris: Organisation for Economic Co-operation and Development. Available online at: https://www.oecd-ilibrary.org/content/publication/de747aef-en.
Parmar, D. (2017). Evaluating the effects of immersive embodied interaction on cognition in virtual reality. Clemson University. Doctoral dissertation. Available online at: https://tigerprints.clemson.edu/all_dissertations/1987.
Pellas, N., Kazanidis, I., and Palaigeorgiou, G. (2020). A systematic literature review of mixed reality environments in K-12 education. Educ. Inf. Technol. 25 (4), 2481–2520. doi:10.1007/s10639-019-10076-4
Pirker, J., Lesjak, I., Parger, M., and Gütl, C. (2018). “An educational physics laboratory in mobile versus room scale virtual reality - a comparative study,” Springer International Publishing, 1029–1043. doi:10.1007/978-3-319-64352-6_95
Planning a qualitative study (2018). Qualitative analysis: deductive and inductive approaches, Andrea J. Bingham. Available online at: https://www.andreajbingham.com/resources-tips-and-tricks/deductive-and-inductive-approaches-to-qualitative-analysis.
Ritchie, H., and Roser, M. (2018). Plastic pollution. Our World Data. Available online at: https://ourworldindata.org/plastic-pollution.
Rothbaum, B. O., Hodges, L. F., Kooper, R., Opdyke, D., Williford, J. S., and North, M. (1995). Virtual reality graded exposure in the treatment of acrophobia: a case report. Behav. Ther. 26 (3), 547–554. doi:10.1016/s0005-7894(05)80100-5
Roussou, M., Oliver, M., and Slater, M. (2006). The virtual playground: an educational virtual reality environment for evaluating interactivity and conceptual learning. Virtual Real. 10 (3), 227–240. doi:10.1007/s10055-006-0035-5
Segawa, T., Baudry, T., Bourla, A., Blanc, J. V., Peretti, C. S., Mouchabac, S., et al. (2020). Virtual reality (VR) in assessment and treatment of addictive disorders: a systematic review. Front. Neurosci. 13 (Jan). doi:10.3389/fnins.2019.01409
Sheppard, S. R., Shaw, A., Flanders, D., and Burch, S. (2008). Can visualization save the world? Lessons for landscape architects from visualizing local climate change. Digit. Des. Landsc. Archit., 29–31. Available online at: https://citeseerx.ist.psu.edu/document?repid=rep1&type=pdf&doi=a9380569f606fe92753c73a5dfe5fc45a5849301. doi:10.1016/j.futures.2011.01.009
Shi, Y. (2023). Analysis of marine plastic pollution and environmental problems. Highlights Sci. Eng. Technol. 59, 56–61. doi:10.54097/hset.v59i.10049
Shome, D., and Marx, S. M. (2009). “The psychology of climate change communication: a guide for scientists, journalists, educators, political aides, and the interested public”. doi:10.7916/D8-BYZB-0S23
Slater, M., and Wilbur, S. (1997). A framework for immersive virtual environments (FIVE): speculations on the role of presence in virtual environments. Presence Teleoperators Virtual Environ. 6 (6), 603–616. doi:10.1162/pres.1997.6.6.603
Slater, M. (1999). Measuring presence: a response to the Witmer and Singer presence questionnaire. Presence Teleoperators Virtual Environ. 8 (5), 560–565. doi:10.1162/105474699566477
Springer. Designing virtual environments for attitudes and behavioral change in plastic consumption: a comparison between concrete and numerical information (2008). Available online at: https://link.springer.com/article/10.1007/s10055-020-00442-w
Steed, A., Frlston, S., Lopez, M. M., Drummond, J., Pan, Y., and Swapp, D. (2016). An ‘in the wild’experiment on presence and embodiment using consumer virtual reality equipment. IEEE Trans. Vis. Comput. Graph. 22 (4), 1406–1414. doi:10.1109/tvcg.2016.2518135
Stork, A., Neyir, S., Daniel, W., Dominic, G., Christian, S., Matthias, L., et al. (2012). “Enabling virtual assembly training in and beyond the automotive industry,” in 2012 18th international conference on virtual systems and multimedia. IEEE, 347–352. doi:10.1109/VSMM.2012.6365944
Strassmann, C., Arntz, A., and Eimler, S. C. (2020). “Under the (plastic) sea - sensitizing people toward ecological behavior using virtual reality controlled by users’ physical activity,” in 2020 IEEE international conference on artificial intelligence and virtual reality (AIVR) (Utrecht, Netherlands: IEEE), 166–173. doi:10.1109/AIVR50618.2020.00036
Straßmann, C., Arntz, A., and Eimler, S. C. (2020). “Under the (plastic) sea - sensitizing people toward ecological behavior using virtual reality controlled by users’ physical activity,” in 2020 IEEE international conference on artificial intelligence and virtual reality (AIVR), 166–173. doi:10.1109/AIVR50618.2020.00036
Ucar, E., Ustunel, H., Civelek, T., and Umut, I. (2017). Effects of using a force feedback haptic augmented simulation on the attitudes of the gifted students towards studying chemical bonds in virtual reality environment. Behav. Inf. Technol. 36 (5), 540–547. doi:10.1080/0144929X.2016.1264483
Weser, V. U., Duncan, L. R., Sands, B. E., Schartmann, A., Jacobo, S., François, B., et al. (2021). Evaluation of a virtual reality E-cigarette prevention game for adolescents. Addict. Behav. 122, 107027. doi:10.1016/j.addbeh.2021.107027
Keywords: educational game-based learning, environmental awareness, virtual reality, mobile VR, embodiment
Citation: Roy T, Sparra HJ, Skripnikov A and Gilchrist S (2025) Fostering environmental responsibility with JellyBean: a Google Cardboard VR-based case study on cultivating awareness in middle and high school students about marine ecology and the impact of everyday pollutants. Front. Virtual Real. 6:1469409. doi: 10.3389/frvir.2025.1469409
Received: 23 July 2024; Accepted: 21 February 2025;
Published: 17 March 2025.
Edited by:
Akrivi Katifori, Athena Research Center, GreeceReviewed by:
Bui Van Hong, Ho Chi Minh City University of Technology and Education, VietnamCopyright © 2025 Roy, Sparra, Skripnikov and Gilchrist. This is an open-access article distributed under the terms of the Creative Commons Attribution License (CC BY). The use, distribution or reproduction in other forums is permitted, provided the original author(s) and the copyright owner(s) are credited and that the original publication in this journal is cited, in accordance with accepted academic practice. No use, distribution or reproduction is permitted which does not comply with these terms.
*Correspondence: Tania Roy, dHJveUBuY2YuZWR1
†These authors have contributed equally to this work
Disclaimer: All claims expressed in this article are solely those of the authors and do not necessarily represent those of their affiliated organizations, or those of the publisher, the editors and the reviewers. Any product that may be evaluated in this article or claim that may be made by its manufacturer is not guaranteed or endorsed by the publisher.
Research integrity at Frontiers
Learn more about the work of our research integrity team to safeguard the quality of each article we publish.