 Emel Ugur
 Bahriye Ozlem Konukseven
 Mehmet Ergen
 Mehmet Emin Aksoy
 Serhat Ilgaz Yoner
- 1Vocational School of Health Sciences -Audiometry, Acibadem Mehmet Ali Aydinlar University, Istanbul, Turkey
- 2Department of Audiology, Acibadem Altunizade Hospital, Istanbul, Turkey
- 3Institute of Graduate Study - Health Sciences Audiology Department, Istanbul Aydin University (Retired), Istanbul, Turkey
- 4Department of Physiology, School of Medicine, Acibadem Mehmet Ali Aydinlar University, Istanbul, Turkey
- 5Department of Biomedical Device Technology, Acibadem Mehmet Ali Aydinlar University, Istanbul, Turkey
Background: Virtual reality is no longer created solely with design graphics. Real life 360° videos created with special shooting techniques are now offered as open access to users’ experience. As a result, this widespread use of VR systems has increased the incidence of visually induced motion sickness.
Objective: In the present study, we aimed to investigate impact of brightness-contrast levels of real-life 360° videos on susceptibility to visually induced motion sickness during immersive virtual reality headset viewing.
Methods: In this study, 360° real-world day and night driving videos publicly available on YouTube VR were used as stimuli. Stimuli were presented in 2-min segments. Electrodermal activity was recorded throughout the stimulus presentation, and SSQ was administered immediately afterward.
Results: No significant difference was found between the experiments in terms of dermal activity. There is a statistically significant difference in total SSQ scores and in symptoms of fatigue, eye strain, head fullness, blurred vision, and dizziness (p < 0.005; p < 0.01) after then the night video.
Conclusion: The present study examined the likely impact of brightness and contrast levels in VR environments on VIMS provocation.
1 Introduction
The magical visual world that virtual reality (VR) technology offers us is used not only for education or entertainment purposes but also in many areas, from virtual travel to rehabilitation and in various professional trainings (Dawe et al., 2014; Jensen and Konradsen, 2018). Therefore, VR systems are becoming a part of the everyday life of thousands of people.
Despite their increased usage, VR systems have not yet completed their development. A new design and a new application are introduced almost every day. Nevertheless, VR triggered visually induced motion sickness (VIMS), characterized by headache and oculomotor symptoms, remain as a constraint in its utility (Davis et al., 2014; Dawe et al., 2014; Fineschi and Pozzebon, 2015; Jensen and Konradsen, 2018; Weech et al., 2019). Differences emerge when VR systems are compared with the real world, especially in light perception. To simulate the perception of the real world in virtual scenes, reproducing the effects of incident light on the visual system is essential and very difficult. Traditional head-mounted VR displays (HMDs) are not capable of displaying high dynamic brightness and color range of the human eye perception in the real world (Keshavarz et al., 2014). For this reason, various research-development projects are ongoing to prevent VIMS symptoms in order to optimize issues like resolution, light quality, contrast adjustment, brightness, and flicker rate (Cha et al., 2021; Keshavarz et al., 2015). Additionally, the widespread usage of 360° videos has incited researchers to study on optimizing contrast and brightness of 360° VR videos to avoid VIMS (Luidolt et al., 2020).
VR systems are already used in various Motion Sickness (MS) studies (Clausen et al., 2019; Ehinger et al., 2019) and, for vestibular rehabilitation in MS (Bala et al., 2018). Additionally, its utility for rehabilitation in various peripheral vestibular disorders has gained broad acceptance (Petel et al., 2022; Recenti et al., 2021). VR technology in vestibular rehabilitation offers excellent opportunities in terms of boosting patient motivation and integration of rehabilitation sessions into everyday life. However, VR systems are clearly a trigger for VIMS (Cha et al., 2021; Keshavarz et al., 2014; Keshavarz et al., 2015). Electrodermal activity (EDA) was first associated with simulator disease in a seminal study by J. G. Andreassi in the early 1980s (Meusel et al., 2014). Subsequently, EDA has been used in various studies investigating motion sickness, and visually induced motion sickness (Dennison et al., 2016; Schneider et al., 2022). Accordingly, EDA is a suitable tool for measuring physiological responses that virtual environments may trigger. In our study, with reference to previous studies, it was decided to use EDA as a data collection tool to document the participants’ physiological responses objectively. Sensory decoding and perceptual construction of visual scene with low ambient light (e.g., nighttime driving) includes greater ambiguity leading to more process demanding. Relatively slow and effortful visual perceptual processing is expected to impair the visual vestibular matching, hence greater EDA response. In order to create a gradual challenge environment, which is the basis of rehabilitation protocols, we thought that easily tolerable stimuli should be used first, followed by more difficult tolerable stimuli, and this would be better reflected in EDA activity. Triggering VIMS in individuals with pre-existing sensitive or damaged vestibular system may lead to frustration and discontinuation of the rehabilitation. In addition, the more stimuli are recruited from real life, the more patients are demanded to integrate rehabilitation practices into their real lives. In the present study, we aimed to investigate impact of brightness-contrast levels of real-life 360° videos on susceptibility to VIMS during immersive VR headset viewing. We believe the results of this study, obtained from healthy volunteers, might address some basis for optimization of future protocols of vestibular rehabilitation.
2 Material and method
2.1 Participants
Participants were healthy volunteers within the age range of 22–40 years. Volunteers who were diagnosed with any systemic, neurologic, or neuro-otologic diseases including motion sickness were excluded. In order to exclude participants with undiagnosed motion sickness, we applied Motion Sickness Susceptibility Questionnaire (MSSQ) and Visual Induced Motion Sickness Symptom Questionnaire (VIMSSQ). Participants with total score percentile of less than 50% (total raw score < 11.3) in MSSQ were included. The other specific inclusion criterion required participants to deny any prior experience of intolerable symptoms of VIMS that compelled them to discontinue or avoid visual displays. (i.e., answering the 2nd question of VIMSSQ as “Never”) (Table 1). The study was calculated to have at least 20 participants, and with power analysis (alpha = 0.05 and ß = 0.95), 24 participants were included.
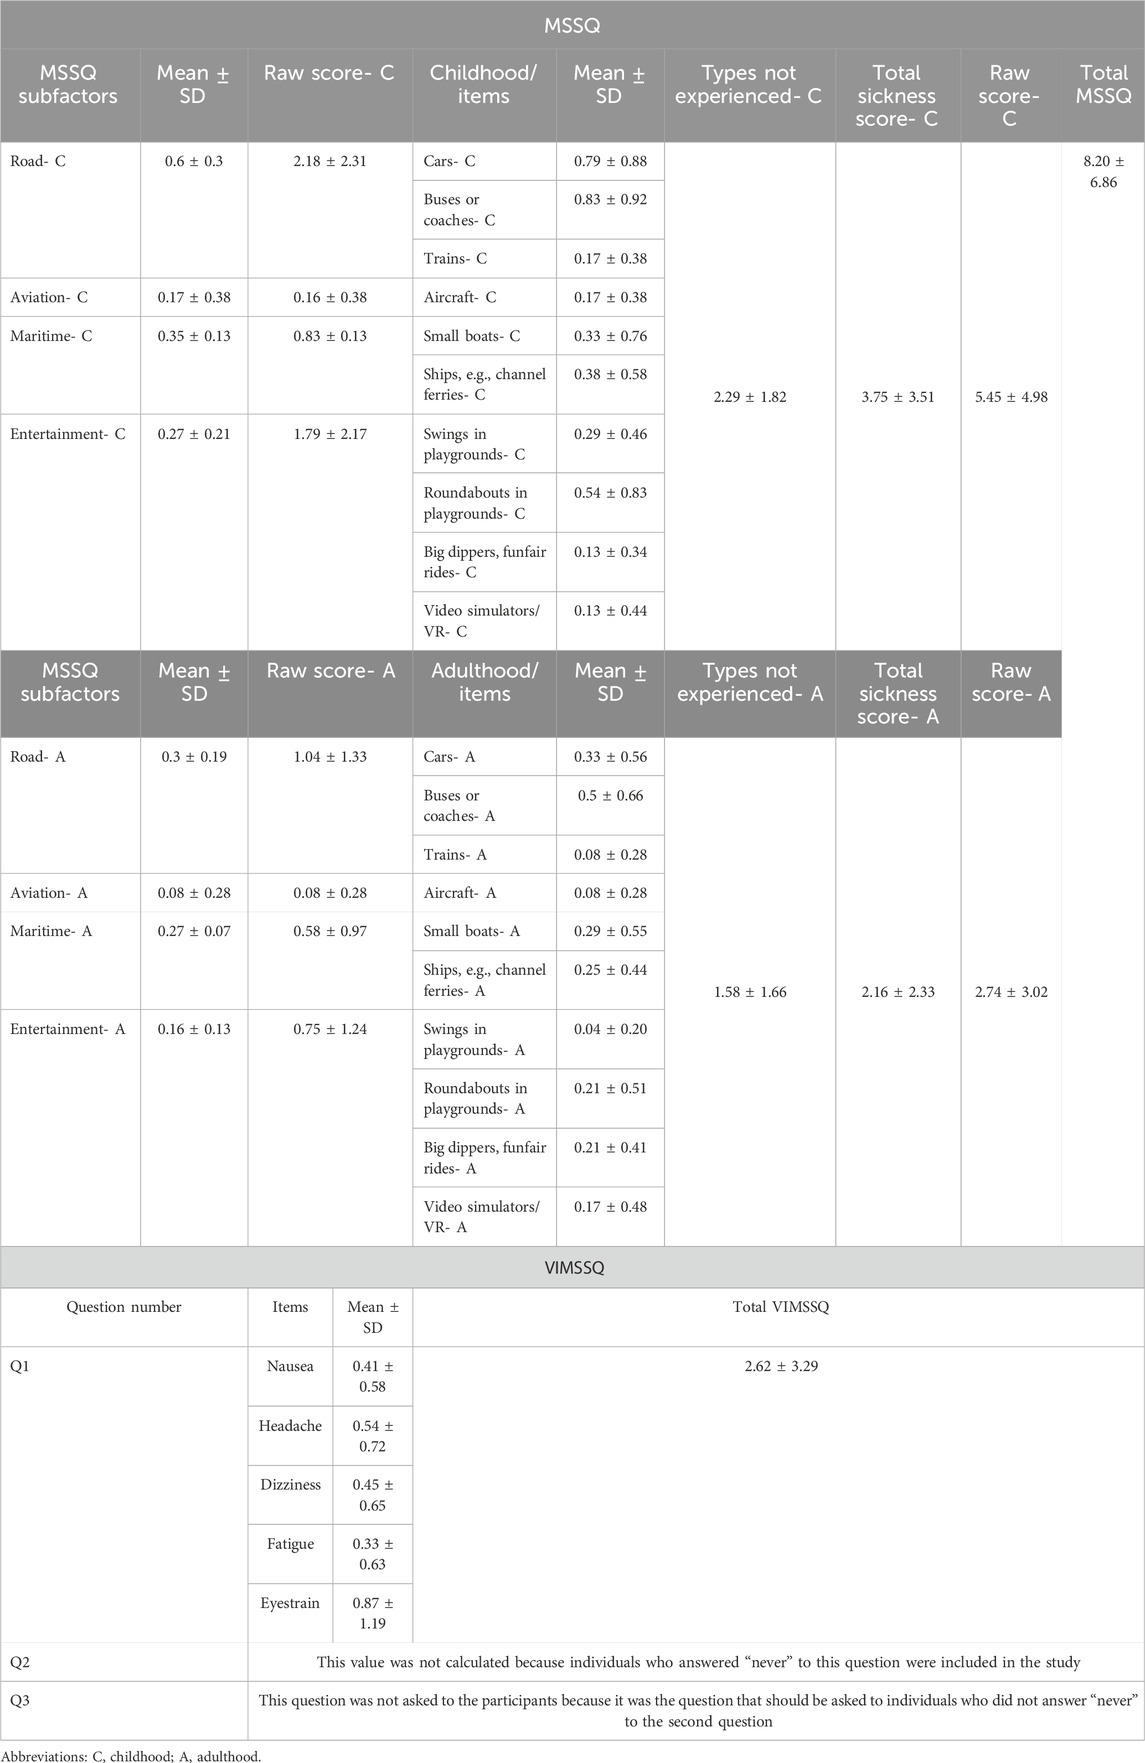
Table 1. Descriptive statistics of MSSQ ad VIMSSQ.
2.2 Stimulus
Two open-access 360° VR videos were searched in the YouTube VR with the criteria as follows: real world videos at night or daylight with natural brightness-contrast features, at least 4K resolution, driving in traffic from first-person point of view. Two min of day light driving (0:00- 2.00 min) (Utah, 2018) and night driving (6.25- 8.25) (ActionKid, 2020) were clipped. The clipped videos included similar traffic density, number of turns. Therefore, the two VR video clips were comparable in terms of inducing visual vestibular mismatch except for ambient light conditions of the scene.
The literature has reported that VR exposure longer than 10 min triggers VIMS, and the severity of the symptoms increases as the exposure duration increases (Chang et al., 2020). However, there is evidence that even short-term VR exposure (<10 min) can cause VIMS (Dennison et al., 2016; Kim et al., 2005). When the studies of Kim and Dennison were examined, we observed that the skin conductivity had an initial rapid phase and showed a more linear increase in the following periods. Considering the superiority of today’s VR technology at that time, 2-min visual stimuli could provide sufficient stimulation. Considering that the rest period required for the regression of symptoms that may occur due to stimulation should be at least twice the stimulus duration, the rest period was planned as 5 min.
2.3 Laboratory environment
The room temperature of the VR laboratory was set at 22.5°C. Participants were seated on a swivel chair. The experiment was conducted in two blocks (Figure 1). The stimuli were presented through head mounted display (HDM) Oculus Quest II VR (Facebook Technologies, LLC/United States). Five-min break was given between blocks.
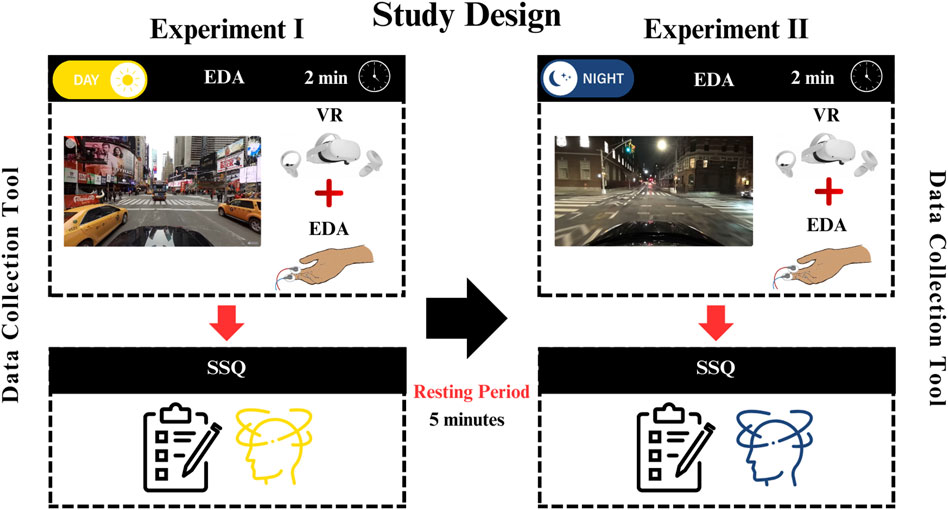
Figure 1. Study design.
2.4 Data collection
Electrodermal activity (EDA) was recorded by Shimmer3 GSR + Unit (Dublin, Ireland). GSR electrodes were then placed on the participants’ left index and middle fingers. VR google set to participants head and baseline EDA recording start (first 20 s). During the baseline EDA period participants explored the VR environment. Experiment blocks started after then baseline, and EDA recording continued during to the 2 min of VR stimulation. Simulator Sickness Questionnaire (SSQ) was collected immediately after each VR session (Figure 1).
2.5 EDA analysis
There are two time-domain measures available for high-accuracy analysis of electrodermal activity (EDA) signals collected from individuals under a specific workload: skin conductance level (SCL) and skin conductance response (SCR). SCL (unit micro-Siemens, µS) is a tonic measure dependent on small changes in EDA. Typically, it is calculated by averaging numerous measurements during a resting period in the absence of specific stimuli. SCR, on the other hand, represents rapid transient phenomena within EDA. Event-related SCR (ERSCR) is considered as the initial phasic measure. ERSCR is typically followed by a series of SCR called non-specific SCR (NSSCR which is considered as a tonic measure in the post-stimulus period. Both SCR responses can be elicited by the stimulus and whether to focus on NSSCR or ERSCR depends on the nature of the stimulus and study protocol.
In the present study, ERSCR analysis is applied. EDA data, exported in.csv format, were imported into MATLAB R2022a (Mathworks, United States) for further analysis. In order to retrieve pure SCL data, arithmetic means of the EDA signal for each individual during are calculated and compared with corresponding baselines. To retrieve pure ERSCR data, 40 Hz frequency which is known to be noise had to be digitally filtered using an envelope method. To this end, first, power spectrum analysis of all measured data is done. Second, amplitudes and durations of each ERSCR are calculated. From time domain perspective, ERSCR amplitudes are signal peaks (peak heights) through time and ERSCR durations are time required for each phasic response to subside (peak widths) (Figure 2). Then, statistical analysis of retrieved EDA data is carried out which is explained in detail under corresponding heading (Figure 2).
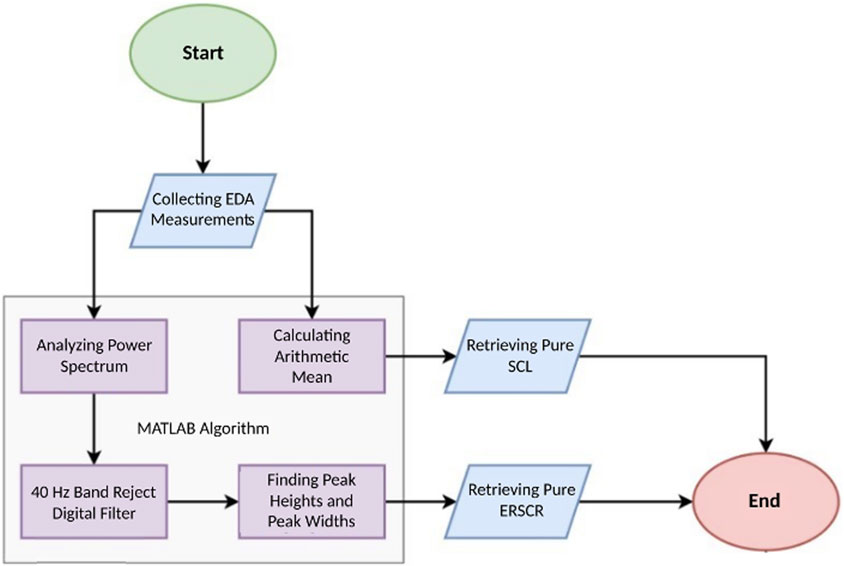
Figure 2. Flowchart of EDA data analysis.
2.6 Statistical analysis
IBM SPSS Statistics 26.0 software and GraphPad Prism 10.2.1 were used for statistical analysis. Descriptive statistics were used to summarize demographic variables. The Shapiro-Wilk test was conducted to evaluate the normality of the difference values of ERSCR number, ERSCR peak height, ERSCR peak width, and Total SSQ between Experiment I and Experiment II conditions. The Shapiro-Wilk test results rejected normality assumption as follows: for ERSCR number, W = 0.913 and p = 0.041; for ERSCR peak height, W = 0.800 and p = 0.000; for ERSCR peak width, W = 0.802 and p = 0.000; and for Total SSQ, W = 0.751 and p = 0.000. In this context, the Wilcoxon signed-rank test was used to compare EDA and SSQ data between day and night conditions. Spearman’s correlation analysis was performed to examine the relationship between EDA and SSQ measurements.
3 Results
The research was conducted with 24 participants between the ages of 22–40 (25.29 ± 5.27) and 66.7% of the participants were female (n = 16) and 33% (n = 8) were male. In terms of diagnostic criteria, none of the participants were susceptible to motion sickness (MS) (Mean Total Raw Score 8.20 ± 6.86) or VIMS. Descriptive statistics are presented in Table 1.
EDA recording during VR exposure and subsequent SSQ assessment were statistically compared between experiment conditions (daylight vs. night VR videos). In objective measurements with EDA, no significant difference could be obtained between the experiments in terms of dermal activity (Total Number of ERSCR p = 0.072; ERSCR Peak Heights p = 0.317; ER.SCR Peak Widths p = 0.864) (Table 2; Figure 3).
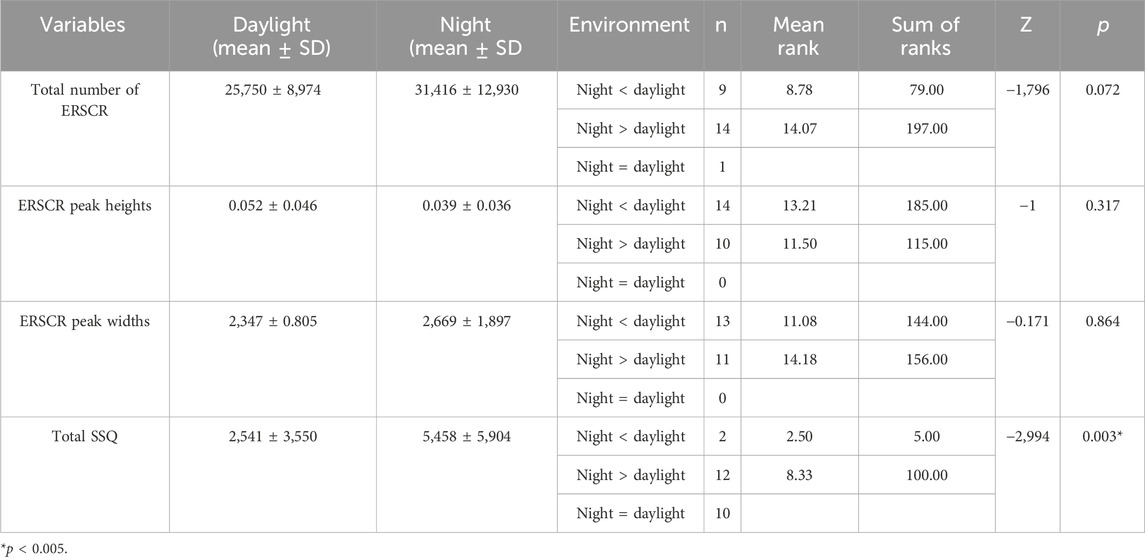
Table 2. Wilcoxon signed rank test results for the EDA and SSQ.
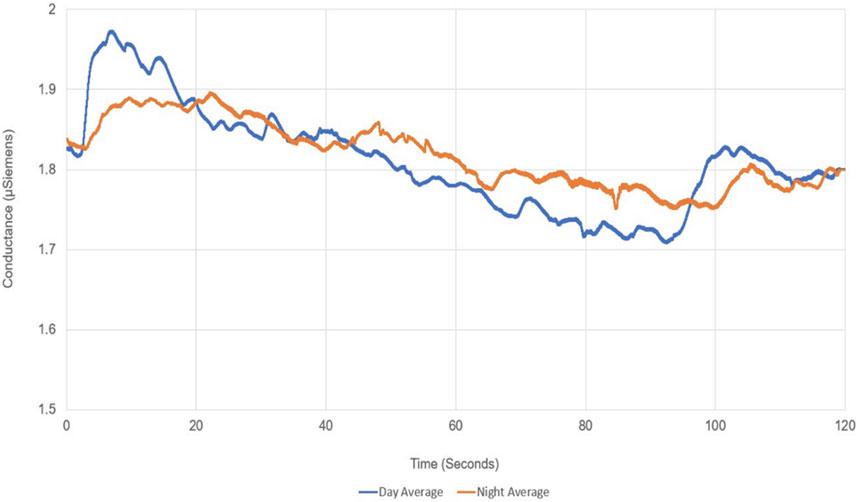
Figure 3. EDA averages.
In this study conducted with individuals without VIMS sensitivity. Post-VR SSQ scores revealed that participants reported more discomfort in all symptoms during exposure to the night video, and a statistically significant difference exists in total SSQ scores* (Table 2). Also, we found significant differences in fatigue, eye strain, the fullness of the head, blurred vision, and vertigo symptoms (p < 0.005; *p < 0.01). These symptoms are mainly oculomotor (fatigue, eye strain, fullness of head, blurred vision). It included only vertigo symptoms in the disorientation subfactor (Table 3; Figure 4).
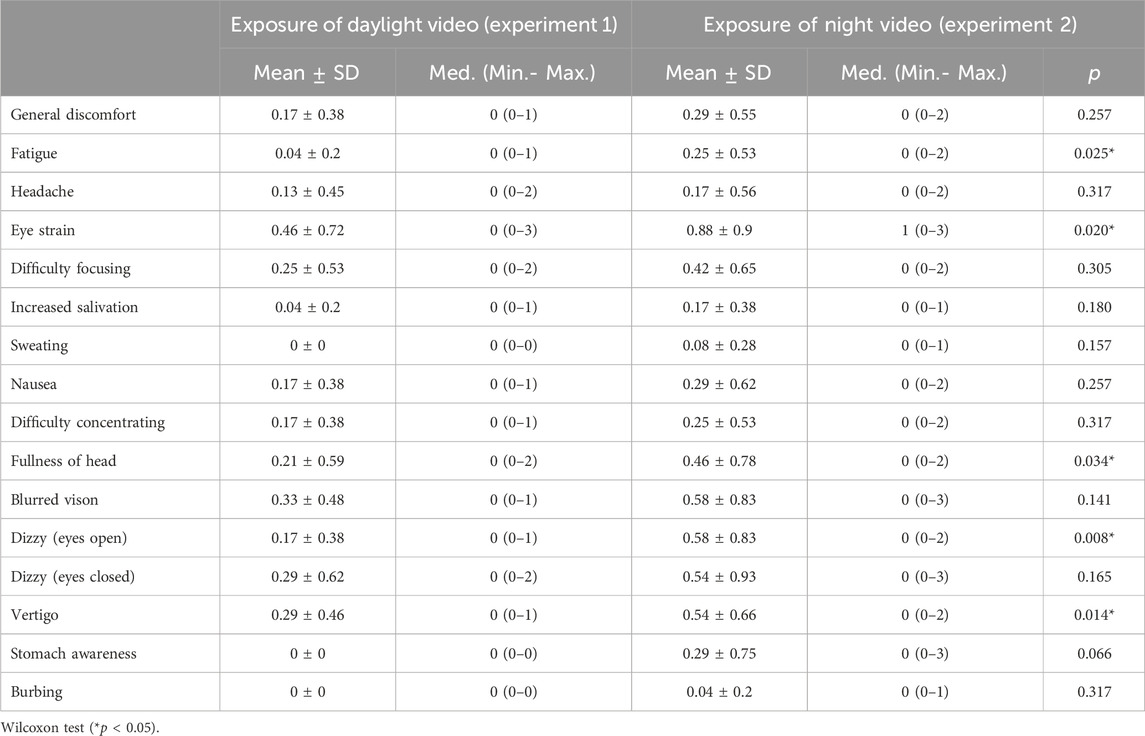
Table 3. SSQ changes after experiments.
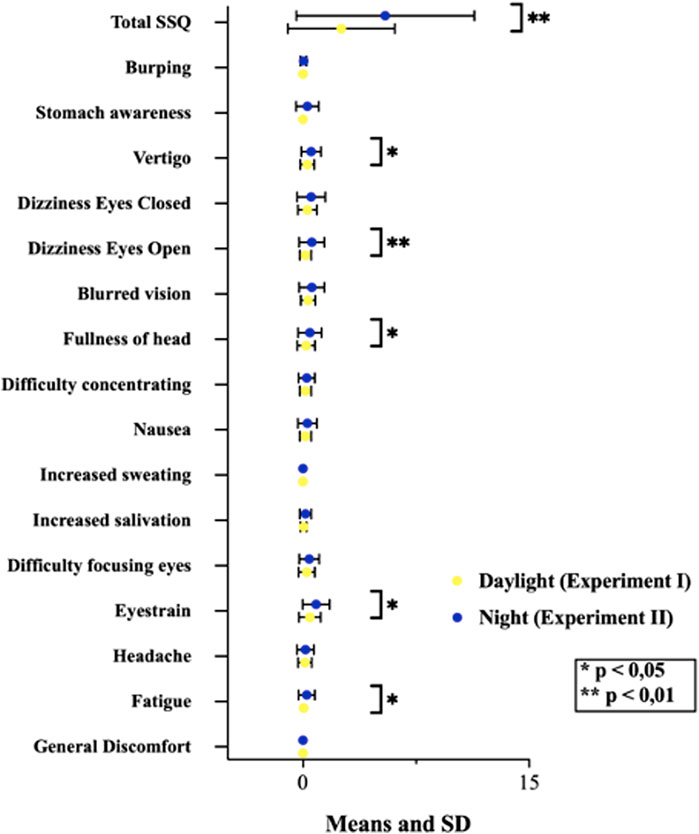
Figure 4. Wilcoxon signed rank test chart of SSQ change after experiments.
We observed a statistically significant negative correlation between the number of ERSCR, mean peak heights, and mean peak widths of ERSCR response to the daylight and night driving scene conditions. In these correlations, it was determined that as the number of EDA activities occurring during the experiments increased, the mean peak heights and peak widths of the waves decreased. In the night experiment, it was observed that as the number of ERSCR’s increased, both mean peak heights and mean peak widths of ERSCR decreased and showed a moderate negative correlation. In the daylight experiment, a week correlation was observed between peak heights and the number of ERSCR’s and a moderate negative correlation with the peak widths (Figure 5). The relationships of EDA and SSQ findings between daylight and night were examined. A moderate positive correlation was observed between daylight and night values of peak height and a high positive correlation between daylight and night values of total SSQ value (Figure 6).

Figure 5. Intergroup correlation of SSQ and EDA values.
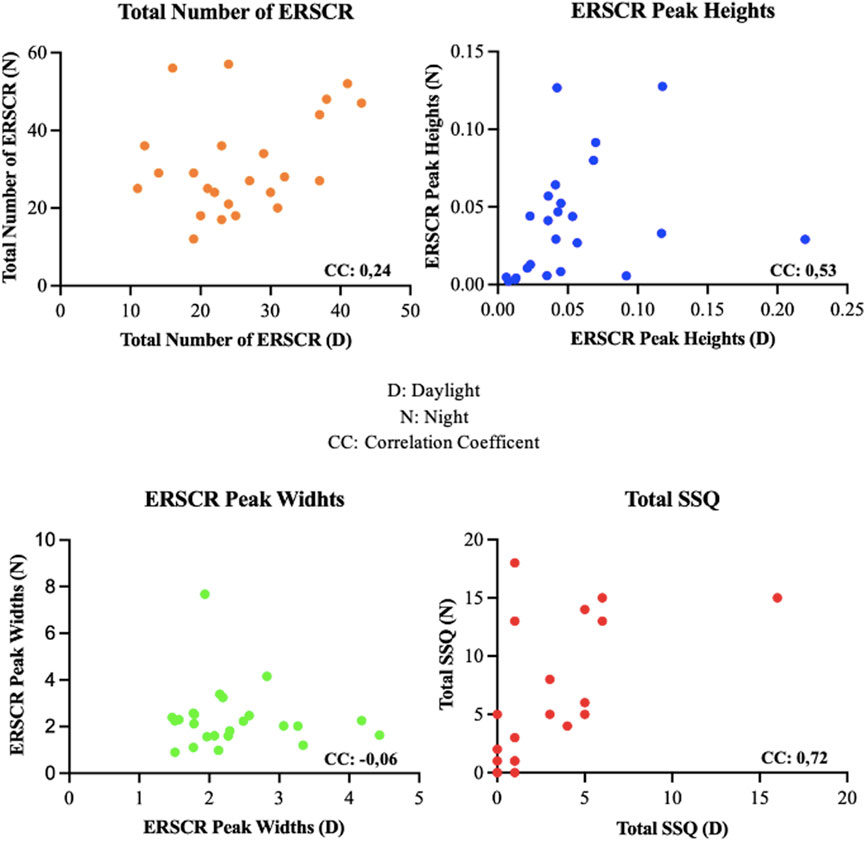
Figure 6. Intragroup correlation of SSQ and EDA values.
4 Discussion
This is a preliminary study providing insight for designing future rehabilitative VR environments. In this regard, we specifically focused on the potential impact of brightness and/or contrast levels on VIMS.
VR’s advantage of creating unlimited stimulus, scenarios and unlimited rehabilitation modules has made it more frequently preferred in rehabilitation applications. Various studies have shown that these applications are beneficial both in psychiatry practice such as stress control (Kim et al., 2021) and in the field of vestibular rehabilitation (Ugur and Konukseven, 2022; Xie et al., 2021). It is a foreseeable problem that, especially in vestibular disorders, triggering VIMS by visual stimuli will negatively affect patient motivation and jeopardize the sustainability of vestibular rehabilitation. Therefore, VR technology must solve this problem to provide a good, safe user experience and reach a broader user base.
In particular associations between migraine susceptibility and both VIMS and classical motion sickness have been known for a long time (Abouzari et al., 2020; Golding and Patel, 2017; Lukacova et al., 2023). Individuals with VIMS, MS, and Migraine often stay away from these technologies, even out of concern about experiencing these symptoms (Paroz and Potter, 2017). On the other hand, although the stimulus presentation technique of VR systems is challenging for this patient group, it will inevitably have an accelerating effect on adaptation (Keshavarz et al., 2014; Palmisano and Constable, 2022; Ugur and Konukseven, 2022). Many VR-based studies have been conducted to identify the characteristics of VIMS, MS, and migraine and to find ways to alleviate them. Some studies have attempted to define the relationship between visual features obtained from VR content (e.g., speed of content, color changes, visual objects, field of view, and latency) and levels of symptoms measured by questionnaires (Stauffert et al., 2020).
On the other hand, some of those studies have focused on physiological responses (Davis et al., 2014; Dennison et al., 2016; Naqvi et al., 2013). The most frequently preferred scale in these studies is the SSQ (Kennedy et al., 1993; Kennedy et al., 1993). Unlike the majority of previous studies that used scenes or game sections that are digitally produced/programmed by software’s, we utilized 360° VR videos of the first-person perspective and the actual driving moment were used in day and night conditions. In both experiments, a symptomatic self-report was taken with SSQ following the end of the stimuli. Which revealed that night-shot driving video induced more discomfort. Oculomotor symptoms such as phatic and blurred vision increased significantly after stimulation at night when darkness and contrast were more intense. Given that, these symptoms are the primary oculomotor symptoms of VIMS (Cha et al., 2021; Keshavarz et al., 2014; Ugur and Konukseven, 2022), our results suggest that the low illumination and high contrast may be prominent provoking factors for VIMS in VR scenes. For this reason, attention should be paid to brightness and contrast factors when planning rehabilitation protocols, and the patient should be rehabilitated with gradual increases if necessary. Particularly in the rehabilitation of chronic vestibular diseases such as Meniere’s Disease, Vestibular Migraine, or Motion Sickness, the triggering of VIMS may result in patients discontinuing the rehabilitation. Therefore, considering to these issues in VR-based vestibular rehabilitation applications is a crucial factor for the sustainability of rehabilitation.
VIMS is a condition characterized by oculomotor symptoms and disorientation and causes severe stress (Kennedy et al., 2010; Keshavarz et al., 2015; Naqvi et al., 2013). For this reason, various physiological measurement methods were utilized in research on MS and VIMS, such as heart rate, respiratory rate, skin temperature, electrodermal activity, electrocardiogram, and electroencephalography (Dennison et al., 2016; Draper et al., 2001; Groth et al., 2021). EDA is a preferred and trusted method in VR-based research. In Dennison et al.’ s study investigating the difference between cave and HDM concluded that presenting stimuli with HDM triggered electrodermal activity (Dennison et al., 2016). In Elena N. Schneider et al. reported that EDA showed a high correlation with MS (Schneider et al., 2022). In addition, it should also be kept in mind that thermoregulatory activity occurs with the symptom of nausea (Nalivaiko et al., 2014). The primary symptoms of VIMS are oculomotor symptoms such as headache, eye strain and neurologic involvement. Nausea is not the primary symptom (Cha et al., 2021; Ugur, 2024). According to the findings from our study, although oculomotor and disorientation were triggered, nausea was not. These findings may indicate that VIMS provocation was achieved. Therefore, it is understandable that no statistical significance was obtained in EDA activities. In future studies, stimulus durations should be increased, and the most effective duration should be determined in order to perform EDA analyses effectively. However, there are significant limitations to EDA measurements that must be acknowledged. One of the significant challenges related to EDA signals has always been the analysis of SCL and SCR due to high inter-individual variability, preventing the establishment of any standardization across individuals due to the frequently occurring second response before the last SCR, which can be visually detected but is challenging for automatic detection by the system.
Additionally, periodic shifts in the background SCL can be significant for data analysis if they originate from specific components. Whether a similar signal fragment is an SCR, or an artifact can be understood through simple visual analysis. Moreover, to accurately analyze NSSCRs, an observer needs to count all SCRs in the dataset, which can become problematic if there are motion-related artifacts during EDA measurements. Due to the mentioned potential challenges, an experienced observer is required to accurately calculate NSSCRs, limiting the potential of EDA (Boucsein, 2012; Navarro et al., 2022). Despite these limitations regarding EDA, we observed that EDA activity occurred by Dennison as a result of the analysis of EDA signals we collected from healthy individuals without VIMS susceptibility. In addition, considering the provocateur properties of the dark environment, the emergence of more EDA supports Elena N. Schneider’s report. As a result, VR environments with higher darkness and contrast presented using HDM can provoke VIMS symptoms even for healthy individuals.
5 Conclusion
The present study examined the likely impact of brightness and contrast levels in VR environments on VIMS provocation. Our results justified contribution of low illumination and boosted contrast are inducing factors to be considered for VIMS. We therefore recommend avoiding stimuli with low brightness and high contrast to improve the sustainability of rehabilitation when designing protocols in VR environments.
6 Limitation of the study
Our study is the first study using 360 VR. Therefore, the stimuli were limited to 2 min by being conservative. Determining the most effective stimulus duration should be prioritized in future studies.
Data availability statement
The original contributions presented in the study are included in the article/supplementary material, further inquiries can be directed to the corresponding author.
Ethics statement
The studies involving humans were approved by Acıbadem University and Acıbadem Healthcare Institutions Medical Research Ethics Committee (ATADEK). The studies were conducted in accordance with the local legislation and institutional requirements. The participants provided their written informed consent to participate in this study.
Author contributions
EU: Conceptualization, Data curation, Formal Analysis, Investigation, Methodology, Project administration, Resources, Software, Supervision, Validation, Visualization, Writing–original draft, Writing–review and editing. OK: Writing–review and editing, Supervision. ME: Data curation, Formal Analysis, Software, Validation, Writing–original draft, Writing–review and editing. MA: Writing–review and editing, Supervision. SY: Data curation, Formal Analysis, Software, Writing–original draft.
Funding
The author(s) declare that no financial support was received for the research, authorship, and/or publication of this article.
Conflict of interest
The authors declare that the research was conducted in the absence of any commercial or financial relationships that could be construed as a potential conflict of interest.
Publisher’s note
All claims expressed in this article are solely those of the authors and do not necessarily represent those of their affiliated organizations, or those of the publisher, the editors and the reviewers. Any product that may be evaluated in this article, or claim that may be made by its manufacturer, is not guaranteed or endorsed by the publisher.
References
Abouzari, M., Cheung, D., Pham, T., Goshtasbi, K., Sarna, B., Tajran, S., et al. (2020). The relationship between vestibular migraine and motion sickness susceptibility. Otology and Neurotol. official Publ. Am. Otological Soc. Am. Neurotol. Soc. Eur. Acad. Otology Neurotol. 41 (8), 1116–1121. doi:10.1097/mao.0000000000002705
ActionKid (2020). 360° NYC state of emergency: driving at night. Available at: https://www.youtube.com/watch?v=ew-QM8Iz16U.
Bala, P., Dionísio, D., Nisi, V., and Nunes, N. (2018). “Visually induced motion sickness in 360 videos: comparing and combining visual optimization techniques,” in Paper presented at the 2018 IEEE International symposium on mixed and augmented reality adjunct (ISMAR-Adjunct), Munich, Germany, October 16–20, 2018 (IEEE).
Cha, Y. H., Golding, J. F., Keshavarz, B., Furman, J., Kim, J. S., Lopez-Escamez, J. A., et al. (2021). Motion sickness diagnostic criteria: consensus document of the classification committee of the barany society. J. Vestib. Res. 31 (5), 327–344. doi:10.3233/VES-200005
Chang, E., Kim, H. T., and Yoo, B. (2020). Virtual reality sickness: a review of causes and measurements. Int. J. Hum. Comput. 36 (17), 1658–1682. doi:10.1080/10447318.2020.1778351
Clausen, O., Fischer, G., Furhmann, A., and Marroquim, R. (2019). Towards predictive virtual prototyping: color calibration of consumer VR HMDs. Pap. Present. A. T. 16th GI AR/VR Workshop.
Davis, S., Nesbitt, K., and Nalivaiko, E. (2014). “A systematic review of cybersickness,” in Paper presented at the Proceedings of the 2014 conference on interactive entertainment, Newcastle, Australia, December 2–3, 2014.
Dawe, S. R., Windsor, J. A., Broeders, J. A., Cregan, P. C., Hewett, P. J., and Maddern, G. J. (2014). A systematic review of surgical skills transfer after simulation-based training: laparoscopic cholecystectomy and endoscopy. Ann. Surg. 259 (2), 236–248. doi:10.1097/sla.0000000000000245
Dennison, M. S., Wisti, A. Z., and D’Zmura, M. (2016). Use of physiological signals to predict cybersickness. Displays 44, 42–52. doi:10.1016/j.displa.2016.07.002
Draper, M. H., Viirre, E. S., Furness, T. A., and Gawron, V. J. (2001). Effects of image scale and system time delay on simulator sickness within head-coupled virtual environments. Hum. factors 43 (1), 129–146. doi:10.1518/001872001775992552
Ehinger, B. V., Groß, K., Ibs, I., and König, P. (2019). A new comprehensive eye-tracking test battery concurrently evaluating the Pupil Labs glasses and the EyeLink 1000. PeerJ 7, e7086. doi:10.7717/peerj.7086
Fineschi, A., and Pozzebon, A. (2015). “A 3D virtual tour of the santa maria della Scala museum complex in siena, Italy, based on the use of Oculus rift HMD,” in Paper presented at the 2015 International Conference on 3D Imaging (IC3D), Liege, Belgium, December 4–15, 2015 (IEEE).
Golding, J. F., and Patel, M. (2017). Meniere’s, migraine, and motion sickness. Acta oto-laryngologica 137 (5), 495–502. doi:10.1080/00016489.2016.1255775
Groth, C., Tauscher, J.-P., Heesen, N., Grogorick, S., Castillo, S., and Magnor, M. (2021). “Mitigation of cybersickness in immersive 360 videos,” in Paper presented at the 2021 IEEE conference on virtual reality and 3D user interfaces abstracts and workshops (VRW), Lisbon, Portugal, March 27–April 01, 2021 (IEEE).
Jensen, L., and Konradsen, F. (2018). A review of the use of virtual reality head-mounted displays in education and training. Educ. Inf. Technol. 23, 1515–1529. doi:10.1007/s10639-017-9676-0
Kennedy, R. S., Drexler, J., and Kennedy, R. C. (2010). Research in visually induced motion sickness. Appl. Ergon. 41 (4), 494–503. doi:10.1016/j.apergo.2009.11.006
Kennedy, R. S., Lane, N. E., Berbaum, K. S., and Lilienthal, M. G. (1993). Simulator sickness questionnaire: an enhanced method for quantifying simulator sickness. Int. J. Aviat. Psychol. 3 (3), 203–220. doi:10.1207/s15327108ijap0303_3
Keshavarz, B., Hecht, H., and Lawson, B. D. (2014). Visually induced motion sickness: causes, characteristics, and countermeasures. 2nd Edn. Boca Raton, FL: CRC Press.
Keshavarz, B., Riecke, B. E., Hettinger, L. J., and Campos, J. L. (2015). Vection and visually induced motion sickness: how are they related? Front. Psychol. 6, 472. doi:10.3389/fpsyg.2015.00472
Kim, H., Kim, D. J., Chung, W. H., Park, K.-A., Kim, J. D., Kim, D., et al. (2021). Clinical predictors of cybersickness in virtual reality (VR) among highly stressed people. Sci. Rep. 11 (1), 12139. doi:10.1038/s41598-021-91573-w
Kim, Y. Y., Kim, H. J., Kim, E. N., Ko, H. D., and Kim, H. T. (2005). Characteristic changes in the physiological components of cybersickness. Psychophysiology 42 (5), 616–625. doi:10.1111/j.1469-8986.2005.00349.x
Luidolt, L. R., Wimmer, M., and Krösl, K. (2020). Gaze-dependent simulation of light perception in virtual reality. IEEE Trans. Vis. Comput. Graph. 26 (12), 3557–3567. doi:10.1109/tvcg.2020.3023604
Lukacova, I., Keshavarz, B., and Golding, J. F. (2023). Measuring the susceptibility to visually induced motion sickness and its relationship with vertigo, dizziness, migraine, syncope and personality traits. Exp. Brain Res. 241 (5), 1381–1391. doi:10.1007/s00221-023-06603-y
Meusel, C. R. (2014). Exploring mental effort and nausea via electrodermal activity within scenario-based tasks. MS thesis. Ames (United States): Iowa State University.
Nalivaiko, E., Rudd, J. A., and So, R. H. (2014). Motion sickness, nausea and thermoregulation: The “toxic” hypothesis Temperature 1 (3), 164–171. doi:10.4161/23328940.2014.982047
Naqvi, S. A. A., Badruddin, N., Malik, A. S., Hazabbah, W., and Abdullah, B. (2013). Does 3D produce more symptoms of visually induced motion sickness? Annu. Int. Conf. IEEE Eng. Med. Biol. Soc. 2013, 6405–6408. doi:10.1109/EMBC.2013.6611020
Navarro, D., Garro, V., and Sundstedt, V. (2022). Electrodermal activity evaluation of player experience in virtual reality games: a phasic component analysis. Pap. Present. A. T. VISIGRAPP (2 HUCAPP). doi:10.5220/0011006100003124
Palmisano, S., and Constable, R. (2022). Reductions in sickness with repeated exposure to HMD-based virtual reality appear to be game-specific. Virtual Real. 26 (4), 1373–1389. doi:10.1007/s10055-022-00634-6
Paroz, A., and Potter, L. E. (2017). “Cybersickness and migraine triggers: exploring common ground,” in Paper presented at the Proceedings of the 29th Australian Conference on Computer-Human Interaction, Brisbane, Australia, November 28–December 1, 2017.
Petel, A., Jacob, D., Aubonnet, R., Frismand, S., Petersen, H., Gargiulo, P., et al. (2022). Motion sickness susceptibility and visually induced motion sickness as diagnostic signs in Parkinson’s disease. Eur. J. Transl. Myology 32 (4), 10884. doi:10.4081/ejtm.2022.10884
Recenti, M., Ricciardi, C., Aubonnet, R., Picone, I., Jacob, D., Svansson, H. Á. R., et al. (2021). Toward predicting motion sickness using virtual reality and a moving platform assessing brain, muscles, and heart signals. Front. Bioeng. Biotechnol. 9, 635661. doi:10.3389/fbioe.2021.635661
Schneider, E. N., Buchheit, B., Flotho, P., Bhamborae, M. J., Corona-Strauss, F. I., Dauth, F., et al. (2022). Electrodermal responses to driving maneuvers in a motion sickness inducing real-world driving scenario. IEEE Trans. Human-Machine Syst. 52 (5), 994–1003. doi:10.1109/thms.2022.3188924
Stauffert, J.-P., Niebling, F., and Latoschik, M. E. (2020). Latency and cybersickness: impact, causes, and measures. A review. Front. Virtual Real. 1, 582204. doi:10.3389/frvir.2020.582204
Ugur, E. (2024). Investigation of the correlation between the visually induced motion sickness susceptibility questionnaire and the Turkish motion sickness susceptibility questionnaire. J. Audiol. Otol. 28 (1), 36–43. doi:10.7874/jao.2023.00122
Ugur, E., and Konukseven, B. O. (2022). The potential use of virtual reality in vestibular rehabilitation of motion sickness. Auris Nasus Larynx 49 (5), 768–781. doi:10.1016/j.anl.2022.01.012
Utah, J. (2018). New York city 8K - VR 360 drive. Available at: https://www.youtube.com/watch?v=2Lq86MKesG4.
Weech, S., Kenny, S., and Barnett-Cowan, M. (2019). Presence and cybersickness in virtual reality are negatively related: a review. Front. Psychol. 10, 158. doi:10.3389/fpsyg.2019.00158
Keywords: virtual reality, visually induced motion sickness, youtube VR, electrodermal activity, simulator sickness questionnaire
Citation: Ugur E, Konukseven BO, Ergen M, Aksoy ME and Yoner SI (2024) Is the brightness- contrast level of virtual reality videos significant for visually induced motion sickness? Experimental real-time biosensor and self-report analysis. Front. Virtual Real. 5:1435049. doi: 10.3389/frvir.2024.1435049
Received: 19 May 2024; Accepted: 14 August 2024;
Published: 30 August 2024.
Edited by:
Piotr Skrzypczynski, Poznań University of Technology, PolandReviewed by:
Leonard James Smart, Miami University, United StatesDariusz Rodzik, Military University of Technology in Warsaw, Poland
Copyright © 2024 Ugur, Konukseven, Ergen, Aksoy and Yoner. This is an open-access article distributed under the terms of the Creative Commons Attribution License (CC BY). The use, distribution or reproduction in other forums is permitted, provided the original author(s) and the copyright owner(s) are credited and that the original publication in this journal is cited, in accordance with accepted academic practice. No use, distribution or reproduction is permitted which does not comply with these terms.
*Correspondence: Emel Ugur, ZW1lbC51Z3VyQGFjaWJhZGVtLmNvbQ==