 Murat Yalcin
 Andreas Halbig
 Martin Fischbach
 Marc Erich Latoschik
- Human-Computer Interaction (HCI) Group, University of Würzburg, Würzburg, Germany
Cybersickness is still a prominent risk factor potentially affecting the usability of virtual reality applications. Automated real-time detection of cybersickness promises to support a better general understanding of the phenomena and to avoid and counteract its occurrence. It could be used to facilitate application optimization, that is, to systematically link potential causes (technical development and conceptual design decisions) to cybersickness in closed-loop user-centered development cycles. In addition, it could be used to monitor, warn, and hence safeguard users against any onset of cybersickness during a virtual reality exposure, especially in healthcare applications. This article presents a novel real-time-capable cybersickness detection method by deep learning of augmented physiological data. In contrast to related preliminary work, we are exploring a unique combination of mid-immersion ground truth elicitation, an unobtrusive wireless setup, and moderate training performance requirements. We developed a proof-of-concept prototype to compare (combinations of) convolutional neural networks, long short-term memory, and support vector machines with respect to detection performance. We demonstrate that the use of a conditional generative adversarial network-based data augmentation technique increases detection performance significantly and showcase the feasibility of real-time cybersickness detection in a genuine application example. Finally, a comprehensive performance analysis demonstrates that a four-layered bidirectional long short-term memory network with the developed data augmentation delivers superior performance (91.1% F1-score) for real-time cybersickness detection. To encourage replicability and reuse in future cybersickness studies, we released the code and the dataset as publicly available.
1 Introduction
Today, virtual reality (VR) is used in many different application areas. VR has shown its potential for gaming (Pallavicini et al., 2019), teaching and learning (Oberdörfer et al., 2017; Checa and Bustillo, 2020), tourism and hospitality (Huang et al., 2016), and marketing and advertising (Alcañiz et al., 2019; Loureiro et al., 2019). The power and benefits of VR are particularly prominent in the field of therapy. For example, VR can be used in psychology to treat fear of heights (Abdullah and Shaikh, 2018; Bălan et al., 2020), of spiders Hildebrandt et al. (2016); Miloff et al. (2016); Lindner et al. (2020), of speaking in front of an audience (Barreda-Ángeles et al., 2020; Glémarec et al., 2022), or of disorders of body perception by leveraging personalized photorealistic avatars (Wolf et al., 2021; 2020). It is also used to treat neurological disorders, for example, gait impairments as a result of Parkinson’s disease or strokes (Hamzeheinejad et al., 2019; Kern et al., 2019), as well as in orthopedics for the physical recovery after surgery (Gianola et al., 2020; Bartl et al., 2022; Gazendam et al., 2022).
While the areas of application for the utilization of VR technology constantly increase, immersive VR applications, in particular, still face the risk of potentially inducing cybersickness (CS). CS is a prominent risk factor potentially affecting the usability of VR applications (Chang et al., 2020; Stauffert et al., 2020), which is exceptionally critical for medical applications. Hence, to avoid and/or counteract potential occurrences of CS, we first need reliable methods to measure and detect CS. Measuring the occurrence and severity of CS is often done with subjective self-reports (Kennedy et al., 1993; Keshavarz and Hecht, 2011). Using such questionnaire tools, however, has notable drawbacks. Most prominently, it requires active user feedback, potentially inducing distraction and additional workload or breaking the current immersion and flow.
Here, alternative approaches to measuring CS use physiological and behavioral data, for example, using heart rate, skin conductance, electroencephalography (EEG), or eye-tracking data (Nakagawa, 2015; Dennison et al., 2016; Garcia-Agundez et al., 2019; Kim et al., 2019; Islam et al., 2020b; Tauscher et al., 2020). However, many of the existing solutions need an extensive setup (Jeong et al., 2018; Garcia-Agundez et al., 2019; Kim et al., 2019; Lee et al., 2019; Tauscher et al., 2020). Such elaborated setups and expensive devices render a widespread adaptation of objective CS detection unlikely for many use-cases. With this work, we address these problems and show how a CS detection that is based on a very simple setup can be realized. In our approach, we use wearable of-the-shelf sensors and the data provided by a standalone VR headset to achieve a reliable detection of CS. We apply a deep-learning-based data augmentation technique to achieve a significant improvement in CS detection even for smaller and imbalanced datasets.
1.1 Contribution
We first conducted a data-collection process with 20 participants who rode a VR rollercoaster while giving feedback about possible onsets of CS using a controller. We collected several types of physiological data using three different easy-to-use wearable sensors. We analyzed and compared the resulting data with different deep learning algorithms, aiming for automatic real-time detection of CS. Specifically, we used standard and bidirectional long short-term memory (LSTM) (Hochreiter and Schmidhuber, 1997; Schuster and Paliwal, 1997), a combination of convolutional neural networks (CNN) and LSTM, and a support vector machine (SVM) (Cortes and Vapnik, 1995) model for CS detection. Comprehensive performance analysis showed the highest accuracy for a four-layered bidirectional LSTM model, achieving 84.2% accuracy for our original dataset. To enhance detection performance, we pioneered the application of conditional generative adversarial networks (cGAN) to augment physiological time-series data in CS detection. The results increased to 91.7% accuracy and show that it is possible to detect the onset of CS with a fairly simple, unobtrusive setup based on wearable devices without the need for more complex electrode-based sensors and without a large dataset. The detection quality is higher than that in the previous works (Martin et al., 2020; Islam et al., 2021). However, we also propose that a mere accuracy metric is insufficient to evaluate a model's robustness and feasibility. Accordingly, we computed more detailed metrics that further confirmed the excellent performance of our developed method for detecting CS.
2 Related work
2.1 Phenomenology, causes, theories, and prevention of cybersickness
Cybersickness refers to symptoms accompanying VR applications, ranging from headache, dizziness, eyestrain, and blurred vision to nausea and vomiting (LaViola Jr, 2000; Sharples et al., 2008). CS is closely related to simulator sickness as they share many symptoms (Rebenitsch and Owen, 2016). However, Stanney et al. (1997) argue that the tow conditions have different profiles. While the sickness that occurs in simulators is mainly determined by oculomotor symptoms, the main symptom of CS is disorientation. Additionally, the symptoms of CS are approximately three times more severe than those of simulator sickness (Stanney et al., 1997).
CS and simulator sickness share not only a set of symptoms but also common origin theories because many of the theories that apply to simulators could be transferred relatively easily to head-mounted displays (HMDs) (see (Rebenitsch and Owen, 2016) for an overview). The sensory mismatch theory suggests that people experiencing VR receive input on different modalities that might be incongruent or conflicting, for example, visual and vestibular input (Oman, 1990). Because such incongruencies could have been triggered by toxins in the evolutionary history of humans, CS and simulator sickness could also be protective survival mechanisms of the body, deployed in the wrong context (Treisman, 1977). Another common theory references postural instability. It is similar to the sensory conflict theory and suggests that sickness symptoms occur in situations where humans do not have an effective strategy to maintain postural stability (Riccio and Stoffregen, 1991). When a person is using immersive technology, they may not receive the usual sensory input that helps them maintain their balance and posture (Chen Y.-C. et al., 2011). Possible triggers and causes for CS are also very diverse.
On the content level, one of the biggest factors is the optical flow. It is more likely for people to show sickness symptoms when they see moving visual content instead of static content (Chen W. et al., 2011; Lubeck et al., 2015). As the movement becomes faster, the severity of symptoms can increase (Chardonnet et al., 2015; Liu and Uang, 2012). Human factors such as age (Saredakis et al., 2020), gender Freitag et al., 2016), or motion sickness susceptibility (Llorach et al., 2014) can also play a role.
Moreover, some hardware-specific factors can increase the probability of the occurrence of CS. Decisive factors include tracking accuracy (Chang et al., 2016), motion-to-photon latency (the time that elapses between the movement of a tracked object and the graphical representation of the associated movement in the virtual environment) (Stauffert et al., 2020), or latency jitter (Stauffert et al., 2018). Too-high latency or too-inaccurate tracking also causes a mismatch between input modalities.
Through continuous advances in hardware manufacturing and tailored software solutions, for example, asynchronous timewarp (Oculus) or asynchronous reprojection (Valve), modern HMDs significantly reduce the risk for CS. Nevertheless, some symptoms occur regularly and as intensely in contemporary applications Caserman et al., 2021; Cobb et al., 1999). CS must be given particular importance in healthcare applications. Supervisors leading a therapy session, for example, have a special duty of care toward the health of their patients. People working in the healthcare sector who want to integrate VR into their work routines need support in averting potential hazards to their patients Halbig et al., 2022). One possible solution to assist supervisors in protecting their clients from negative effects would be to use a warning system that detects possible signs of CS and warns the supervisor.
Over the years, different techniques that prevent CS were developed and tested, for example, having a virtual nose as a rest frame (Wienrich et al., 2018) or a dynamic restriction of the field of view (Groth et al., 2021). Nevertheless, CS symptoms are still widespread when it comes to the usage of HMDs, as it was shown by a survey among gamers (Rangelova et al., 2020).
2.2 Cybersickness measurement and detection
There are several options for measuring CS. The most widely used technique is the self-report questionnaire (Davis et al., 2014; Chang et al., 2016). Typical examples are the Simulator Sickness Questionnaire (SSQ) (Kennedy et al., 1993) and the Fast Motion Sickness Scale (FMS) (Keshavarz and Hecht, 2011). In addition to the advantages, such as the easy implementation and simple evaluation, these subjective methods also have drawbacks. For example, they only allow a discrete evaluation of the user state. In addition, longer self-reports usually take place after exposure to the VR stimulus and are, therefore, based on the active recapitulation of the experience by the user. Shorter mid-immersion assessments avoid these problems and closely link feedback to experience. However, they require active participation, potentially inducing unwanted breaks (especially immersion) and additional work load.
Alternative approaches to subjective self-reports measure CS via (objective) physiological and behavioral data, for example, using heart rate, skin conductance, electroencephalography (EEG), or eye-tracking data (Nakagawa, 2015; Dennison et al., 2016; Garcia-Agundez et al., 2019; Kim et al., 2019; Islam et al., 2020b; Tauscher et al., 2020). The analysis of the physiological data usually happens with the help of machine learning (ML), deep learning, or similar techniques (Halbig and Latoschik, 2021; Yang et al., 2022). These techniques can overcome many of the drawbacks of subjective methods. They could be used in a continuous online monitoring system that can warn the user or a supervisor in case the user/client felt sick or could even apply automatic counter-measures.
Many existing solutions for classifying CS based on physiological and behavioral measures need an extensive setup. For example, many setups are based on EEG, which often requires the application and preparation of many (up to 128) individual electrodes (Jeong et al., 2018; Garcia-Agundez et al., 2019; Kim et al., 2019; Lee et al., 2019; Tauscher et al., 2020). Even the examples without EEG data are often based on elaborate setups with different single electrodes (Islam et al., 2020a). It is hard to imagine that physical therapists, psychologists, or physicians would be willing to integrate such setups in their daily working routines. In contrast to EEG systems, the sensors used in this study are easy to attach to a person’s body and non-disruptive to their behavior in the VR environment.
Several prominent ML algorithms have been applied to the CS detection task in the past (Yang et al., 2022), including the multilayer perceptron (MLP), SVM, linear discriminant analysis (LDA), and k-nearest neighbors (kNN) methods. However, these algorithms are not tailored to interpret time-series data and did not lead to satisfying results (Garcia-Agundez et al., 2019; Recenti et al., 2021). In recent years, deep learning has shown great performance for many classification and detection tasks. However, a limited number of works used deep learning for CS detection. Because deep learning models need very large amounts of data to train the models, they cannot be implemented if only a limited number of participants are available.
Some studies used wearable sensors and deep learning together. Islam et al. (2020a) used changes in physiological signals (heart rate, heart rate variability, galvanic skin response, and breathing rate) as CS predictors. They used an LSTM deep learning model with complicated electrode-based skin conductance and heart rate sensors. The hands were not moving freely, and the subjective feedback from SSQ was not consistently correlated with the physiological output. One of the recent works from Islam et al. (2021) used CNN + LSTM models and stereoscopic video data combined with eye-tracking (ET) and movement data. They achieved 52% accuracy using only video data, which is far from practical to be used as a CS detector. The same study used a physiological sensory setup with PPG EDA data and achieved 87% accuracy. Although they had an imbalanced dataset, they did not attempt to augment and balance it to get better results. Garcia-Agundez et al. (2019) proposed an electrode-based setup with ECG, EOG (electrooculographic), skin conductance, and respiratory data. They used SVM, kNN, and neural networks for binary CS detection and acquired 82% accuracy. Another interesting study Wang et al. (2023) used in-game characters’ movement and users’ eye motion data during gameplay in VR games. They trained an LSTM model to predict CS in real-time and acquired 83.4% accuracy.
2.3 Data augmentation
Collecting a huge amount of data for studies is often time-consuming, costly, and difficult. This becomes even harder if deep learning algorithms are used for classification or detection tasks. Because deep learning algorithms are data-hungry models, the size of the data should increase drastically to enhance the generalization capability of the models and to hinder overfitting issues. In some VR scenarios, physiological events that correspond to specific stimuli like CS, fear, or anxiety rarely occur, and this leads to imbalanced and skewed datasets. Recently, machine-learning approaches have been used for data augmentation, specifically for image classification tasks where images can be rotated, flipped, cropped, sheared, etc. (Shorten and Khoshgoftaar, 2019). However, unlike image data, physiological signals have a complex structure and dynamics that can be easily disrupted by transformations such as rotation or warping.
Especially in the medical and healthcare domains, when classifying time series physiological data, we often encounter imbalanced, skewed datasets in the literature. Some data augmentation techniques have already been proposed to tackle this problem (Iwana and Uchida, 2020; Wen et al., 2021). For example, Um et al. (2017) propose cropping, rotating, and wrapping the sensory data as a solution for this problem, but it also includes the risk of changing the respective data labels. In recent years, it can be seen that deep learning methods have increasingly been used for data augmentation on small and skewed datasets, and GAN, especially, increases classification performance. Harada et al. (2018) showed that using GAN to augment physiological data can improve the performance of the data classifier on imbalanced datasets. Specifically, conditioning GAN by target class labels offers two key advantages: it enhances GAN performance and facilitates the generation of samples belonging to a specific target class. Ehrhart et al. (2022) leveraged a cGAN to detect moments of stress. Nikolaidis et al. (2019) used cGAN for apnea detection tasks.
We address these limitations by using unobtrusive wearable devices with mid-immersion ground truth elicitation and proven deep learning models with the help of the cGAN data augmentation. Furthermore, to promote replicability and facilitate future research in cybersickness detection, we made our code and dataset publicly available.1
3 System description
Our end-to-end system mainly consists of sensory devices, virtual environment data acquisition, and data processing.
3.1 Sensory devices
We used three different devices to measure the participants’ physiological signals during their VR experience. Because wearable sensors offer superior practicability with respect to cost, ease of use, and portability, we selected a Polar H10 (Polar Electro Oy, Finland) sensory device, which is an electrode-based chest strap, and an Empatica E4 (Empatica Inc., United States) device, which is a medical-grade wristband. Both of these devices transmit the data to the computer via Bluetooth communication. The Pico Neo 2 Eye VR headset (Pico Interactive, China) HMD, with a resolution of 3,840 × 2,160 px per eye and a total field of view of 101° running at a refresh rate of 75 Hz, was provided to participants. The eye movements were captured by the HMD’s built-in eye tracker running at 90 Hz with a 0.5° accuracy. These sensors are easy to deploy and can, therefore, be used in a wide variety of scenarios without requiring too much effort. Figure 1 illustrates these sensory devices.
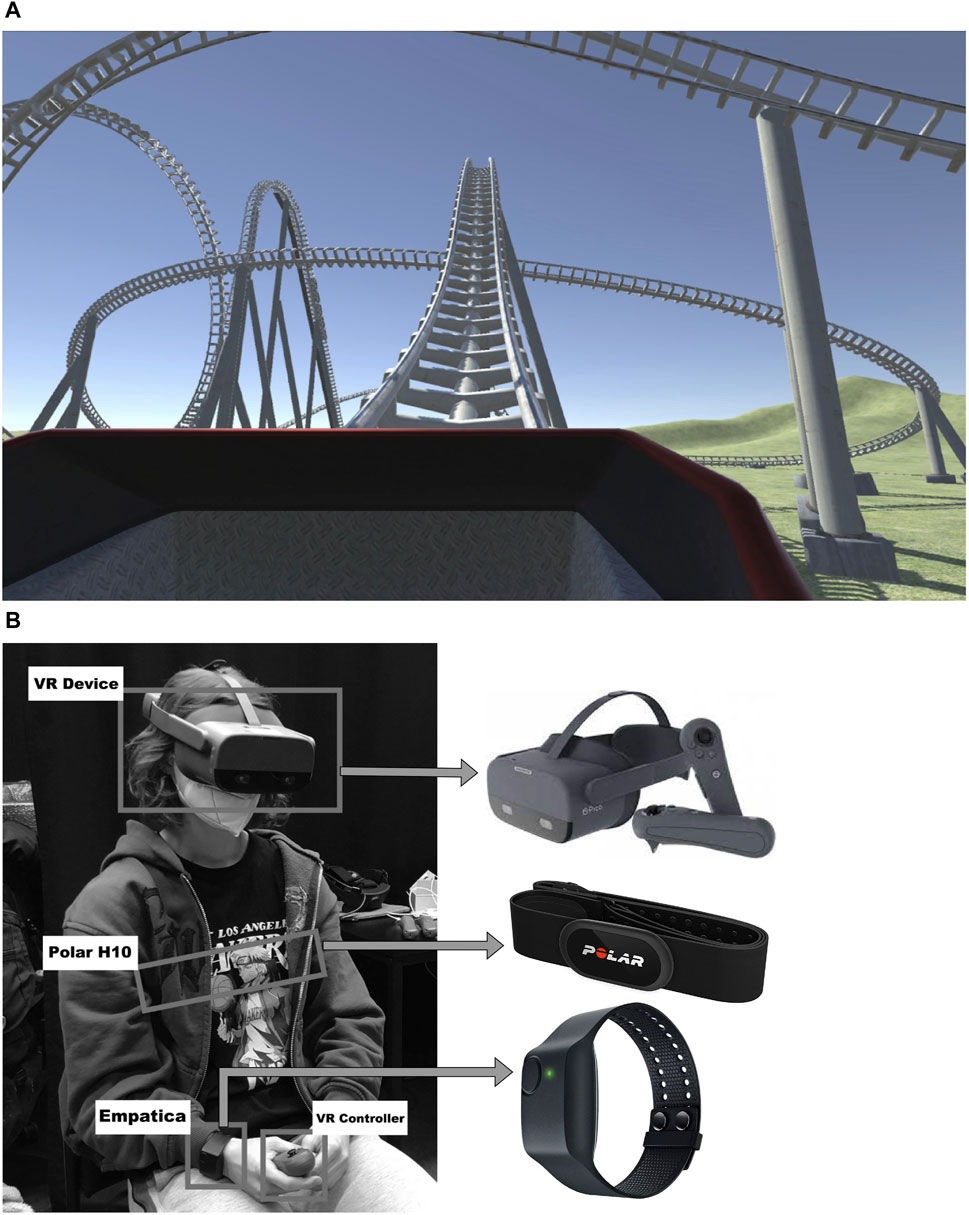
Figure 1. The overview of the CS detection setup. (A) Screenshot of the virtual roller coaster environment used to intentionally induce CS. (B) An equipped participant (center) and the respective sensors used during the experiments in detail.
3.2 Virtual environment
The rollercoaster experience in VR is a well-known experiment when investigating CS in VR due to abundant motion that can elicit certain related symptoms of CS (Cebeci et al., 2019; Islam et al., 2020a). We implemented such a virtual environment for our study by adapting a rollercoaster that has many up-and-down bends, loopings, and sharp turns. It was initially obtained from the Unity Asset Store (2023) as a development environment. Then, we made adjustments to the rollercoaster to have a slightly lower speed and acceleration in the first 30 s. To get the exact time interval when a participant felt cybersick during the rollercoaster ride, we added functionality to collect the timestamps when the participant pressed the trigger button of the right controller and while hold the trigger during the CS symptoms continued. The system was implemented using Unity 2020.3.11f1 LTS (Unity Technologies, 2020). A screenshot of the scenario and the participant with sensory devices is shown in Figure 1.
3.3 Study and data acquisition
We conducted an experiment to acquire physiological data for the development of our CS detection approach. The experiments were completed with 20 participants aged between 18 and 57 years. Twelve participants were men, and eight were women. All participants provided their written informed consent to participate in this study. Before the study, the participants were debriefed about the study’s purpose and noticeable effects of CS. In addition, they were informed and agreed to continue the study if the effects occurred during the study in terms of ethical considerations. During the study, no serious effects were observed or reported by the participants. At the start of the procedure, the participant filled out the pre-SSQ questionnaire to assess the level of CS before the VR exposure. Then, the participant put on the sensor devices and the connections between the sensors and the measurement engine (Viavr_Measurement_Engine, 2022) of the VIA-VR project (Viavr_Project, 2019) were established. Data streaming started simultaneously for every sensor. The participants started to have the rollercoaster experience. Whenever they felt symptoms, they reported CS occurrences by pressing the trigger button of the right controller and holding it as long as the symptoms were noticeable. Respective timesteps were stored in a *.CSV file, and all sensory data were stored in *.JSON files at the end of the experiments. The experiment and the data collection were stopped after one rollercoaster cycle that lasted 80 s. The participant filled out a post-SSQ questionnaire to assess the level of CS after the experiment.
The recorded data types are summed-up in Table 1: electrocardiography (ECG) and acceleration (ACC) data collected using the Polar H10 chest strap; photoplethysmography (PPG), ACC, electrodermal activity (EDA), inter-beat interval (IBI) and peripheral body temperature (TEMP) data collected using the Empatica E4 wristband; and eye-tracking (ET) data collected using the Pico Neo 2 Eye HMD. Table 1 shows the overview of the data types, sampling rates, and number of features that we extracted from the physiological data.
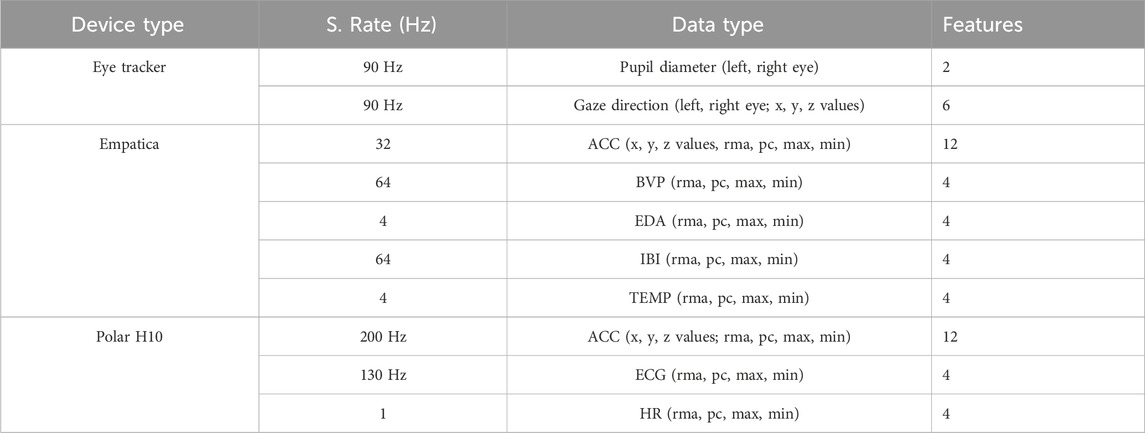
Table 1. The features extracted and preprocessed from the raw sensor data to train the cybersickness classifier.
3.4 Data processing and feature extraction
After raw data acquisition, the collected data were preprocessed to apply deep learning algorithms. Instead of using only raw data, we calculated pre-features as input to the models. First, the data were normalized. Z-score normalization (Dz) was used for the ET (pupil diameters and gaze directions) and ACC (x, y, and z-axes) data. Here, for each data sample Di, the Z-score normalization can be calculated with the mean of the training samples Du and the standard deviation of the training samples Ds in Eq. 1:
The new data sample value Dz replaces the old sample i. This standard technique guarantees that the model will learn more smoothly on the data because it is standard and normally distributed (Islam et al., 2020b). The normalization of the BVP, EDA, IBI, TEMP, and ECG data was done using a min–max scaler (Dminmax) as stated in Eq. 2 that sets the values in relation to their max and min values, which can vary for each person. Here, Dmin and Dmax refer to the minimum and maximum of the data samples per person, respectively:
The features were extracted from the normalized data collected by Empatica and H10 sensors by using a rolling moving average (Drma) in Eq. 3. This technique smooths the data by taking the average value over the last n samples instead of the raw signal. Given a fixed sampling rate, n corresponds to a time window. According to Courtney et al. (2010), an appropriate time for recognizing a change in physiological signals is 3 s. Depending on the sampling rate, this value defines the final choice for the parameter n. Hence, n = 3 × sampling rate.
For another feature class, the percentage of change (Dpc) was calculated from the normalized values using Eq. 4. It indicates how much the value has proportionally changed in the number of n timesteps rather than computing a nominal difference:
The last two features that were constructed from the normalized data are the maximum (max) and the minimum (min) in the last n timesteps. As an additional data source, the heart rate data were calculated from ECG data by using the algorithm in Christov (2004). This technique detects the current beat by leveraging specified thresholds and R-R interval analysis. The aforementioned four features (rolling moving average (rma), percent of change (pc), min, and max) were also calculated for the HR data.
Instead of utilizing HR data obtained from Empatica, we deliberately derived it from ECG data collected by the Polar H10 device due to its superior data quality. The Empatica wristband may be susceptible to motion artifacts, potentially leading to inaccuracies in heart rate readings compared to the Polar H10 chest strap, which is situated on a less-mobile body part. For instance, although Hadadi et al. (2022) gathered HR data using Empatica, they excluded it from their analysis due to its lower precision, reduced stability, and a notable increase in standard deviation.
4 Deep learning models for detection
After the feature extraction steps, the processed data contains 56 features (see Table 1) from the three different sensor devices for each sample to train the SVM and deep learning algorithms.
4.1 SVM
For the SVM model, we used a linear kernel and a class weight ratio of 1:8. Here, the class weight ratio automatically compensates for the data imbalance by increasing the weights of the minority class.
4.2 LSTM
To implement the LSTM model, we used the LSTM architecture described in Islam et al. (2020b). The model consists of four layers: an LSTM layer, a dropout layer, and two dense layers. The input for the LSTM layer is a tensor of shape (batch size, timesteps, and features). The LSTM module produces a tensor of shape (batch size and LSTM hidden size) as output, which contains the final hidden states of the input sequence after the last timesteps. After applying dropout, this output tensor is fed into the two dense layers, which both reduce the feature dimension. A ReLU activation function (Nair and Hinton, 2010) was used for the first dense layer, and no activation function was used for the second dense layer.
In addition to the four-layered LSTM network, we also used a bidirectional LSTM network (Schuster and Paliwal, 1997) with the same LSTM architecture for the detection task. Standard LSTM networks have restrictions as future input information cannot be reached from the current state. In contrast, bidirectional LSTM networks do not require input data to be in the same dimension. Moreover, their future input information can be reached from the current state. The main idea of bidirectional LSTM is to connect two hidden layers of opposite directions to the same output. By this structure, the output layer can access information from past and future states and interpret them better. The model can be seen in Figure 2.
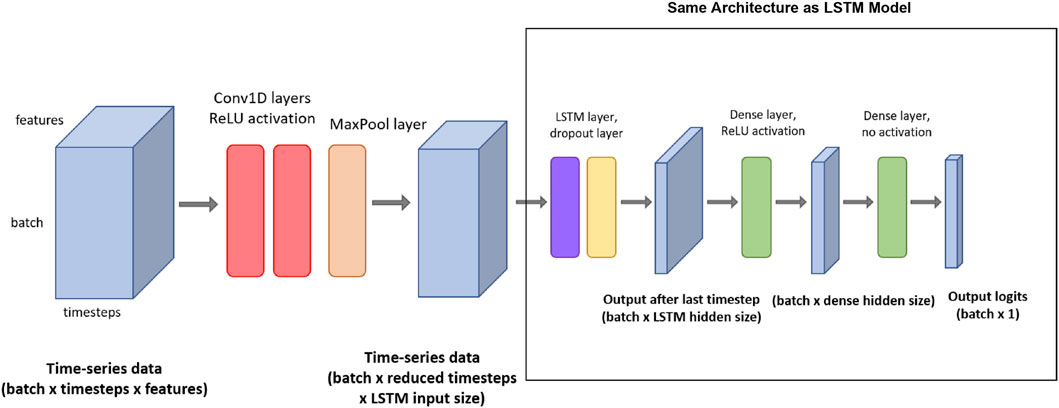
Figure 2. The architecture of the CNN + LSTM model with the respective input/output tensor shapes. (The red rectangle shows the whole CNN + LSTM model, and the black-colored rectangle shows the LSTM model used by itself as LSTM and bidirectional-LSTM models).
4.3 CNN + LSTM
To improve the classification performance, we also deployed from-scratch CNN + LSTM architecture to acquire the spatial features and time-invariant patterns. Figure 2 shows a visual representation of the CNN + LSTM model architecture. This model consists of seven layers: two 1D convolution layers (Conv1D), and a pooling layer, followed by the four layers that were also present in the LSTM model (an LSTM layer, a dropout layer, and two dense layers). The input tensor for the first Conv1D layer is of shape (batch size, timestep, and features). Then, two 1D convolutions are applied. For both Conv1D layers, the number of filters is equal to the input size for the LSTM layer. The kernel size is 4, and ReLU is applied as an activation function. After the Conv1D layers, max pooling is used in the pooling layer, with a pool size of 2 and a stride of 2. After the max pooling function, the output tensor is of shape (batch size, reduced timesteps, and LSTM input size) and can be used as an input for the LSTM layer. The following LSTM and dense layers are set up in a similar way to the LSTM model described previously.
4.4 Hyperparameter optimization and model training
After preprocessing and merging, the dataset was divided into a training set and a testing set in a ratio of approximately 0.80/0.20, resulting in the training set containing data from 16 participants and the testing set containing data from the other four participants. We consciously selected different persons for the testing set to investigate the generalization capability of each model on never-seen participants. Afterward, we randomly divided the training set into 10-fold subsets and separated one set as a validation set to check the optimization performance of the training model. This technique is known as k-fold cross-validation in the literature (Hastie et al., 2001), and it minimizes the bias effect of one validation set. 10-fold cross-validation then iterates through the folds and uses one of the 10 folds as the validation set while using all remaining folds as the training set at each iteration. This process is repeated until every fold has been used as a validation set.
We investigated the best hyperparameters by deploying the grid-search technique throughout the implementation of all methods. We specified the deep learning model dependent variables are hidden layer size, dense layer size, timesteps, dropout, and learning rate.
4.5 Merging data
To merge the data from different sensors that have different sampling rates, we specified a different variable as a hyperparameter called sensor buffer with 0.1 s and 0.5 s time windows to have a mean value for each buffer size of data from different sensors. As a result, each data source is prepared as input for the models without depending on sampling rates.
Additionally, we used a timespan of 0 s, 1 s, and 2 s around a CS occurrence as a CS buffer. The aim is to include the before and after effects of physiological responses that participants felt. We combined these parameters with the hyperparameters of the learning algorithm and did a grid search to determine the best hyperparameters for training the data. During the SVM training, the binary cross-entropy (BCE) (Good, 1952) loss is calculated. After that, predictions and loss calculations are repeated using the testing set. The LSTM and CNN + LSTM models are trained with a 256 batch size for 30 epochs on the training set. For LSTM and CNN + LSTM training, the training loss is calculated using binary cross-entropy in each batch. We used Adam (Kingma and Ba, 2014) as the optimization algorithm, with a learning rate of 0.001 or 0.005, respectively. Every five epochs, the model’s current performance is evaluated on the validation set by calculating the validation loss. Each model was trained on a machine with an Intel Core i7 9700K CPU and 32 GB of memory with NVIDIA RTX 2070 Super GPU. All models were trained by using the PyTorch 1.10 deep learning library.
5 Data augmentation using cGAN
To tackle the problems of small and imbalanced datasets, we deployed cGAN (Mirza and Osindero, 2014) to augment the original dataset. cGAN is the conditionally extended version of the GAN model (Goodfellow et al., 2014).
A GAN model architecture consists of two networks. One network generates candidate data (generator), and the other evaluates them (discriminator). Typically, the generative network learns to map from a latent space (sampled from Gaussian distribution) to a particular data distribution of interest, in our case, physiological data, while the discriminative network discriminates between instances from the true data distribution and candidates produced by the generator. The objective of the generator G) is to fool the discriminator D) such that it classifies generated data as real. Through the training, the generator learns to produce realistic-looking synthetic data. Consequently, the generated data distribution converges to the real data distribution. The generator
Here, the main difference between the cGAN and the two player minimax game objective function of the GAN is that cGAN includes labels as auxiliary information indicated as y. Hence, the objective function can be written as Eq. (6)
During the training process, Eq. (6) often results in mode collapse, which means that many samples out of the latent space map to the same generated sample. This results in a dataset with less diversity. To counteract this problem, the diversity term was introduced by Yang et al. (2019) to simply regularize and penalize the generator for producing the same samples. The diversity term is defined as Eq. 7
The logic in this approach is if two samples are different, but the generated sequences are the same, the term is 0. This results in the following new objective function in Eq. 8
where λ is a hyperparameter that describes the importance of the term in Eq. (8), and ‖ denotes a norm.
5.1 The cGAN architecture
5.1.1 Generator
The generator takes latent space and class labels as input. Sixteen hidden units per layer of stacked LSTM are used to generate the physiological signals. The mapping from the random space is performed via a dense layer using a Leaky ReLU (Xu et al., 2015) activation function. Then, the LSTM layer group was applied. The output was fed through a linear activation. The final output of the generator has the shape of the matrix, which is batch size times time window. Here, the time window for created data is 15 s. After training, we can apply random Gaussian noise N (0, 1) and labels to create the physiological data.
5.1.2 Discriminator
In our architecture, the temporal convolutional layers are used to extract features from the time series signal. The convolutional layer for the discriminator is chosen because in our experiments, we saw that the fully convolutional network (FCN) discriminator outperformed the recurrent discriminator. This indicates that the convolutional network, especially the FCN, provides the generator with better gradients during training. Therefore, 1D filters were applied to capture the changes in the signal according to the different classes of physiological signals. The filters per layer are 32, 64, and 32, and the kernel size per layer was set to 8, 5, and 3, respectively. After the three convolutional blocks, the resulting feature maps are followed by a pooling layer and a sigmoid activation function, which outputs a scalar value in the range of 0 to 1 for the sequence, indicating whether it is real or fake. For the optimization process, the Adam optimizer (Kingma and Ba, 2014), with a learning rate of 0.0002 and a beta value of 0.5 (Christopoulos et al., 2019), was used and trained for 1,650 epochs. A batch size of 32 was used to ensure stable training. Figure 3 depicts the overall cGAN algorithm with physiological data.
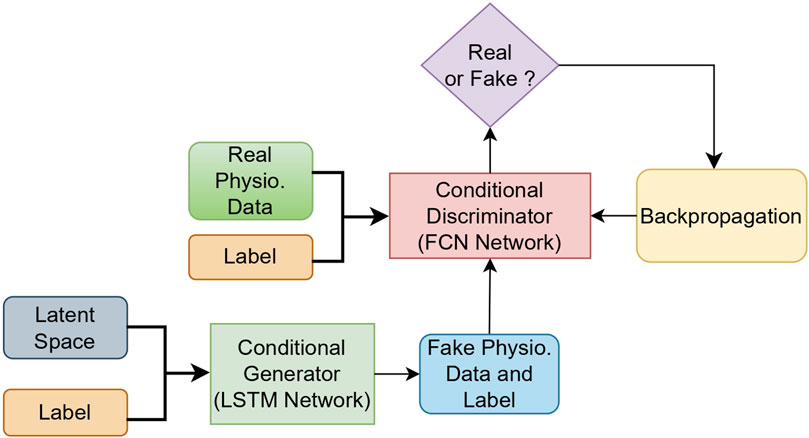
Figure 3. The overall cGAN data augmentation model with physiological data.
5.2 cGAN implementation
The original dataset that we collected during experiments is quite skewed and unbalanced. The data samples consist of 2539 CS labeled and 388 not-CS labeled timesteps (with a 0.5 s CS buffer). Because we have already split the dataset into testing and training sets, only the training set was used for the data augmentation process. After training our cGAN, we created 2,151 synthetic CS timesteps data as the first data augmentation and made the data equally distributed. In the second data augmentation, we wanted to investigate the result with the equally enriched synthetic data for both classes. After this process, we augmented the data, which includes 6,384 timesteps for each class. The data distribution per class can be seen in Figure 4 for the original dataset and the first and second augmented datasets.
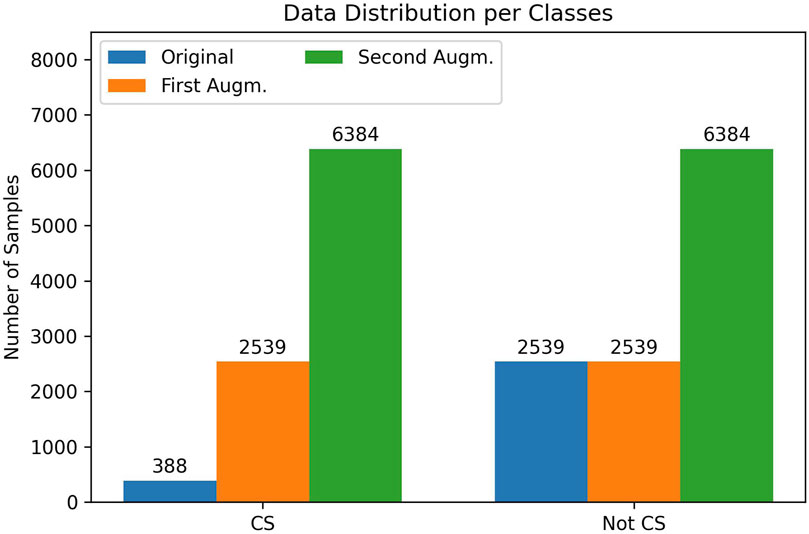
Figure 4. Data sample (timestep) distribution per class for the original dataset (blue), after the first data augmentation (orange) and after the second data augmentation (green).
5.2.1 Evaluation of the cGAN model
Synthetic data samples produced by the cGAN model are of good quality if real data and synthetic data are indistinguishable from each other. To measure the similarity, we used the classifier two-sample test (CTST) proposed by Lopez-Paz and Oquab (2017). In this approach, a binary classifier is trained to distinguish data samples belonging to the synthetic dataset from the real (original) dataset. For the training set, we randomly selected 214 synthetic and real timesteps data samples for CS and 528 synthetic and real timesteps data samples for non-CS sequences. For the training set, we randomly selected 87 synthetic and real timesteps data elements for CS and 161 synthetic and real timesteps data samples for non-CS sequences. We trained our CNN + LSTM and bidirectional LSTM model with the best hyperparameters (see Section 5.1). As can be observed in Table 3 the accuracy result is close to the chance level. Figure 5 depicts two synthetic ECG and EDA data samples for the CS label.
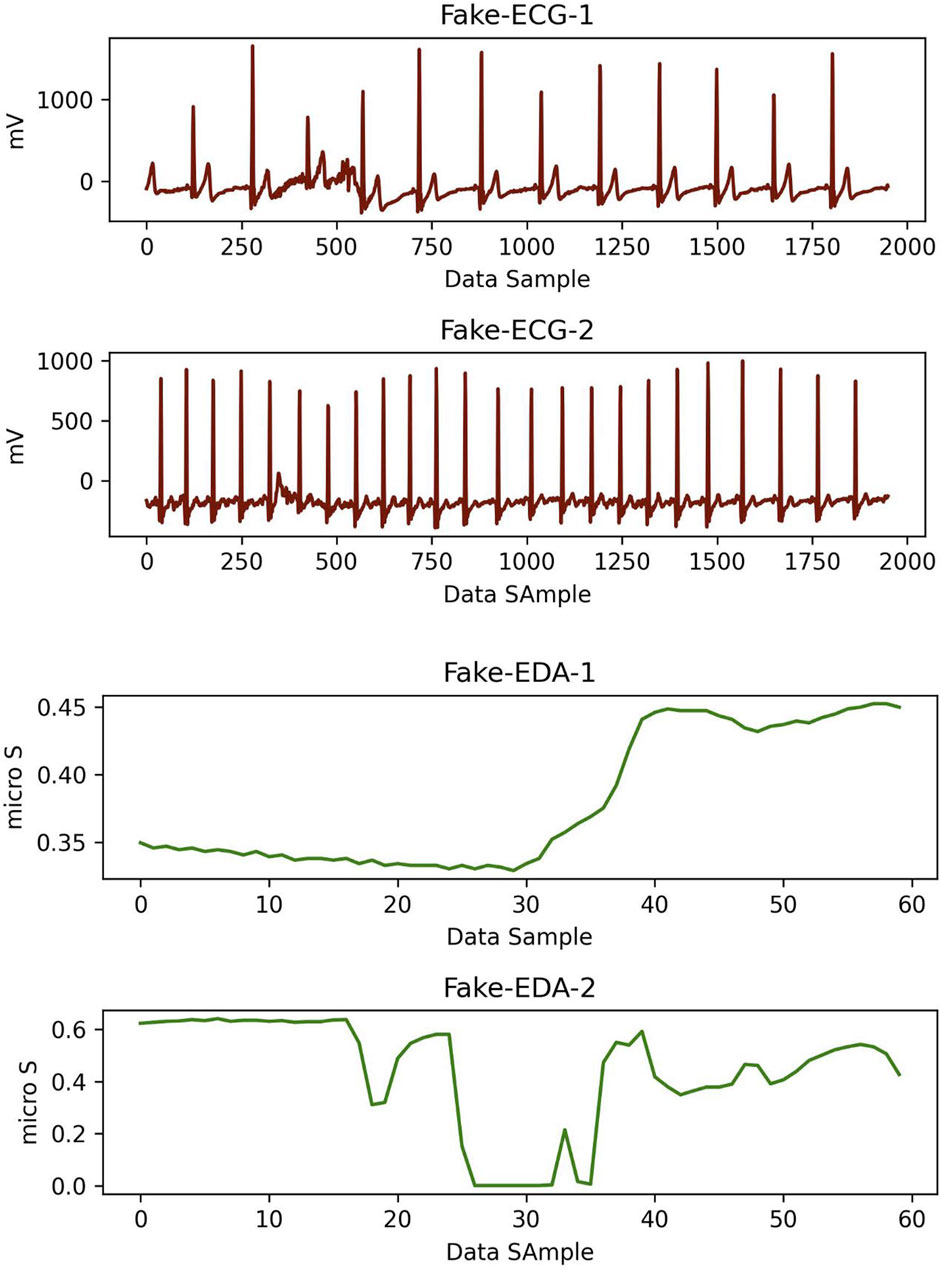
Figure 5. Two pairs of synthetic ECG (red) and EDA (green) data samples which were created using cGAN model for CS label. Here, time window for each data is 15 s.
5.3 Real-time CS detection
5.3.1 Data Capture
To start data streaming, all sensors must establish a connection to the measurement engine (viavr_measurement_engine). Here, socket programming (Socket, 2022) was used for the Empatica connection, and the Bleak library (Bleak, 2022) was used for the Polar H10 connection. The Pico Neo 2 includes a built-in eye tracker (Tobii Ocumen AB, 2021) that can collect raw eye-tracking data (binocular gaze, pupil size, and blink status) using the advanced API. The measurement engine starts recording the data when the “Streaming On” button is clicked. We implemented the data streaming via the threading method. The streaming of each data source is independent of each other and could be started or stopped separately. In the case of a connection breakdown related to the sensors, the engine log screen informs the user about the current state. To prevent the data drifting, we used the same data acquisition architecture for the real-time classification. Additionally, the sensor buffer was used to prevent a lack of data in the streaming. The sensor buffer gets the mean of the data for a specified period of time, and then one value for each data element can be calculated. Hence, we prevent potential missing data and system performance decrease.
5.3.2 Real-time data processing
After finding the best model for the detection task, we also implemented the whole procedure as a real-time CS detection system. All sensory devices are connected to the measurement engine, which was written in Python. Data are feed-forwarded to the four-layered bidirectional LSTM model. Each feed-forward data processing time is around 60 m. In every 5 s period of time, the measurement engine produces detection results by using already trained model parameters. Because the sensor buffer is 0.5 s for the best model, depending on the output of the last layer’s sigmoid function, the engine produces 10 different results in 5 s. If the mean value of the results is higher than 0.5, the engine detects CS; otherwise, it detects not CS. This period of time can easily be selected to be higher or lower because we selected 5 s as an example. Figure 6 shows the overview of the real-time detection system. Figure 7 shows the real-time Python GUI implementation of the measurement engine. The result of the classification is shown using the labels “high” and “low” on the GUI.
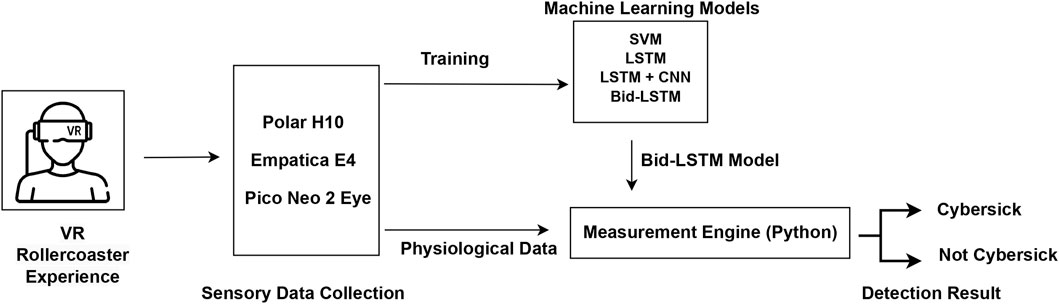
Figure 6. The final workflow scheme of the model for real-time CS detection.
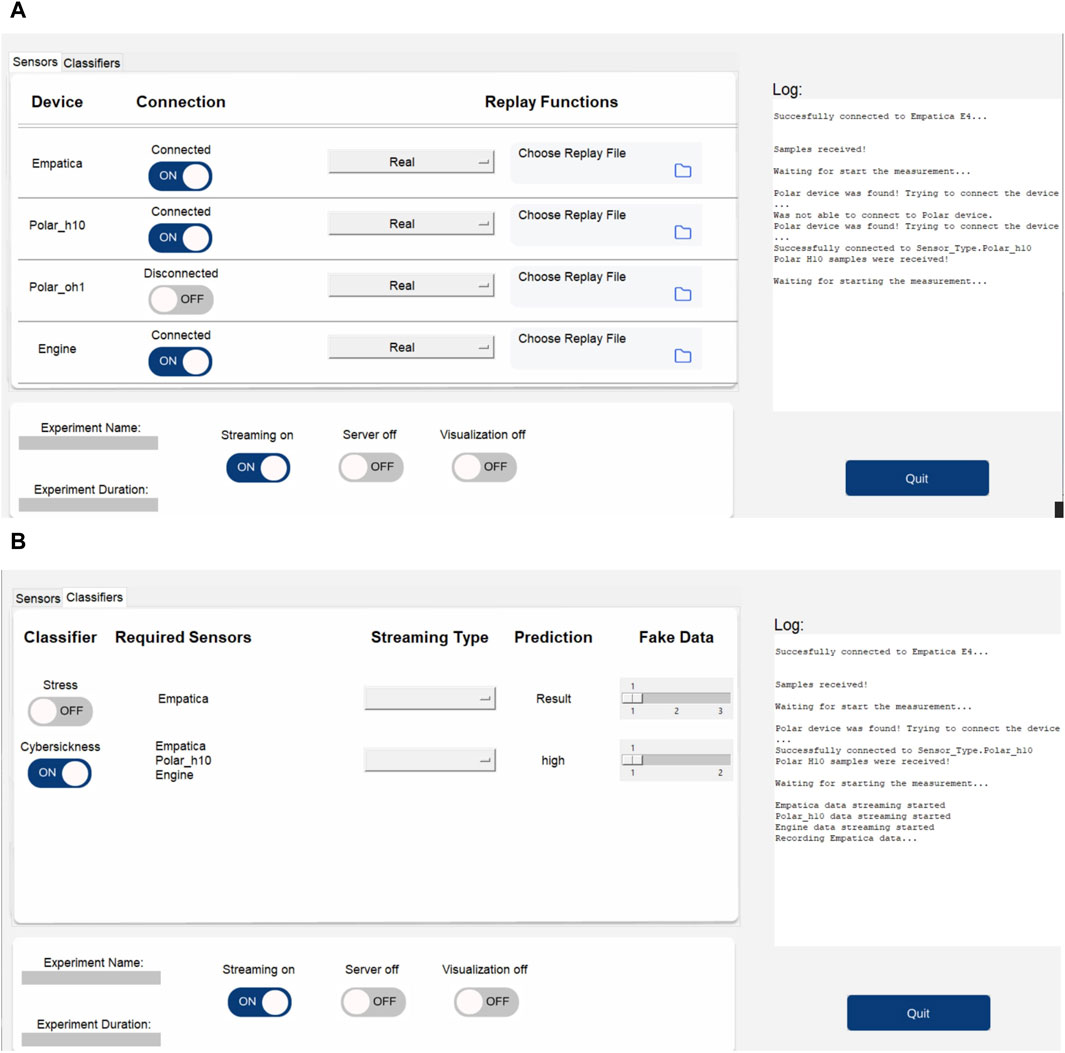
Figure 7. The measurement engine (viavr_measurement_engine) used in the study for data collection and real-time CS detection. (A) The GUI of the measurement engine shows the three connected sensors (Empatica, Polar H10, and Engine, which is the Unity application). (B) The GUI of the measurement engine shows the CS classifier and the detection result.
The system is ready to use in real-time VR applications. It demonstrates an average latency of 60 ms between classifying the data and providing feedback to the user, ensuring a seamless and responsive experience. The prototype achieves a high accuracy (91.7% with the testing set), indicating a high level of accuracy in detecting CS symptoms. Although we used a Pico Neo 2 in our study, any VR headset that included eye-tracking could be used in future studies.
6 Results
To find the best hyperparameters for the respective model type, we conducted a grid search covering 584 different model configurations with 10-fold cross-validation, resulting in 5,840 total model trainings. The best hyperparameters that led to the best classification results are shown in Table 2.
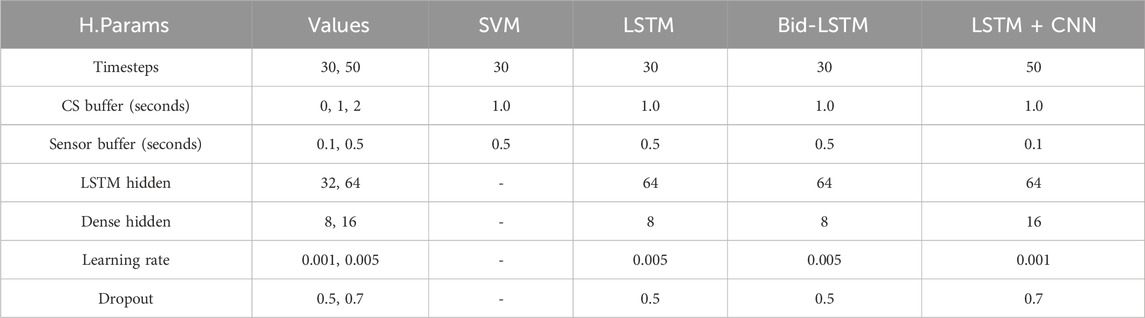
Table 2. The variables and their values that were used in the grid search to optimize the models’ hyperparameters and best-performing values for the respective model type.
After the training, we assessed each model’s performance based on the performance metrics accuracy, precision, recall, and F1-score on the testing set, and we also calculated these metrics for the validation set (10-fold cross-validation) to get a better insight into the model’s learning behavior. We also calculated a naive classifier to compare the results of the given classifier model with a baseline (for example, accuracy is the random occurrence of the CS label in this case). In addition to these metrics, the confusion matrix was also calculated to assess the ratio between true/false positives/negatives for a second augmented dataset.
All performance metrics are based on the true and false results and their real values. They are called true negative (TN), true positive (P), false negative (FN), and false positive (FP). TP is an outcome where the model correctly predicts the positive class (in our case, CS), while TN is an outcome where the model correctly predicts the negative class (in our case, not CS). FP is an outcome where the model incorrectly predicts the positive class, and FN is an outcome where the model incorrectly predicts the negative class. We can formulate these metrics as Eqs. 9–12, follows:
The results of the best-performing models are shown in Table 4 on the original, first, and second augmented training datasets. All model types achieved higher F1-scores on the training datasets with 10-fold cross-validation than on the testing set. To tackle the imbalanced dataset problem and increase the classifier performance, we augmented the dataset with the previously explained methods (see Section 5.2). After data augmentation and training with the new dataset, the results for all models increased significantly. The confusion matrices of the second data augmentation test results can be seen in Figure 8. We acquired the best result with a four-layered bidirectional LSTM model with 91.7% accuracy and a 91.1% F1-score. We also evaluated the cGAN performance using the CTST (see Section 5.2) method. As we can see in Table 3, after testing, accuracy is close to the chance level, which means that our cGAN model created synthetic data that are almost similar to real data.

Table 3. Results of the CTST evaluation method using CNN + LSTM and bidirectional LSTM models.
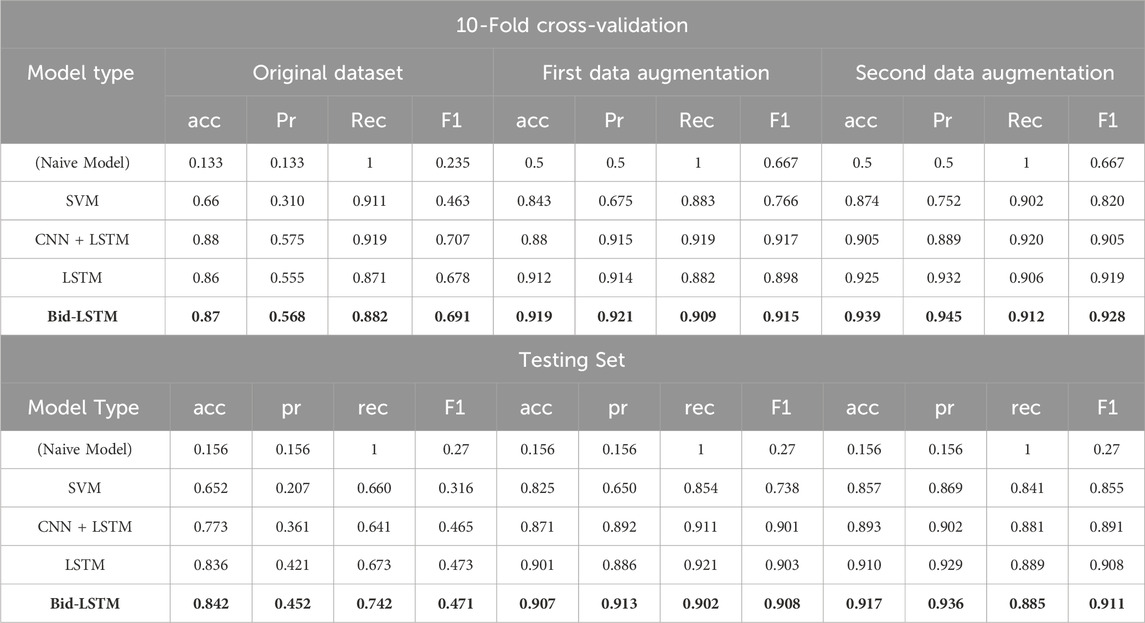
Table 4. First table shows the detection evaluation results (accuracy, precision, recall, and F1-score) for the best-performing models in each model type on the original, first augmented, and second augmented training sets (with 10-fold cross-validation). The second table shows the detection evaluation results for the testing set. The model name and the numbers in bold indicate the highest value of the experimental results.
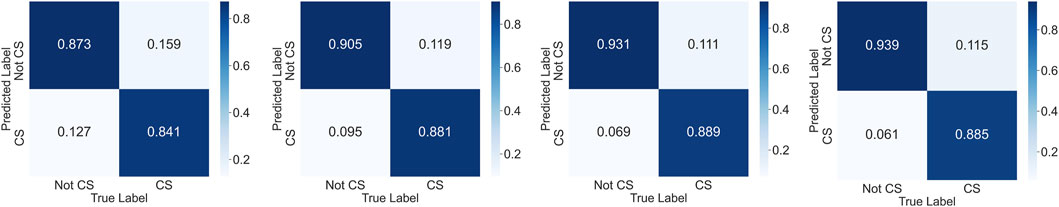
Figure 8. The confusion matrices which show the test results of the second augmented dataset. The matrices belong to the SVM, CNN + LSTM, LSTM, and bidirectional LSTM models, respectively.
Because SSQ results cannot provide actual data labels during the experiments, we only used the SSQ results for validation. Each participant answered 16 different questions with four options standing for 1–4 score scales as pre- and post-SSQ: “None,” “Rather not applicable,” “Rather applicable,” or “Often or a lot.” We calculated the SSQ scores for each participant and evaluated the SSQ results. We showed the average difference of pre- and post-SSQ scores per question in Figure 9. In SSQ results, the participant scores for questions 1 (general discomfort), 3 (headache), 5 (difficulty focusing), 6 (salivation increase), 7 (sweating), and 8 (nausea) were slightly higher than other questions. The average score of the difference of all the symptoms was 1.1, which indicates that the participants felt a bit worse after the experiment than before. This validates that the experiment resulted in a cybersick feeling for most participants, although it might be rather small. Hence, it justifies the correlation with physiological data.
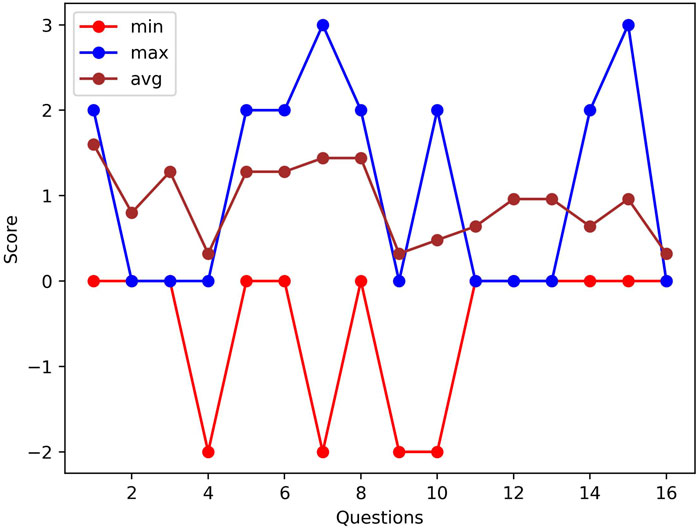
Figure 9. A comparison of the pre- and post-SSQ difference results of two participants who have min and max scores and the average differences of all participants per question.
7 Discussion
We have demonstrated that the utilization of unobtrusive wearable devices in a simple setup, combined with appropriate deep learning algorithms and a supportive data augmentation technique, yields excellent results in detecting CS. Our proposed approach involves the use of a bidirectional LSTM model in conjunction with conditional GAN data augmentation, achieving an accuracy of 91.7% and an F1-score of 91.1%. This outperforms previous works employing similar physiological sensory setups, including more complex ones such as EEG.
A comparison with recent literature is presented in Table 5 Hadadi et al. (2022) incorporated physiological data from an Empatica wristband and topological point cloud data from HMD. This combination was not sufficient to capture CS responses properly, using their (TDA + SVM) model. Garcia-Agundez et al. (2019) additionally used game parameters with electrode-based data using machine learning models (SVM, KNN, and NN) but could not reach satisfying classification performance. (Pane et al. (2018) and Kim et al. (2019) used EEG setups for their studies. However, EEG setups are not easy to deploy for studies because they have complex, error-prone, and time-consuming features. Although some studies worked on CS severity classification (Islam et al., 2021), the F1-scores of these works are not as high as the accuracy results because they also have imbalanced datasets. Furthermore, none of these works attempted:
• to implement data augmentation to overcome lower generalization capability issues for imbalanced datasets.
• to implement a real-time mid-immersion ground truth elicitation method.
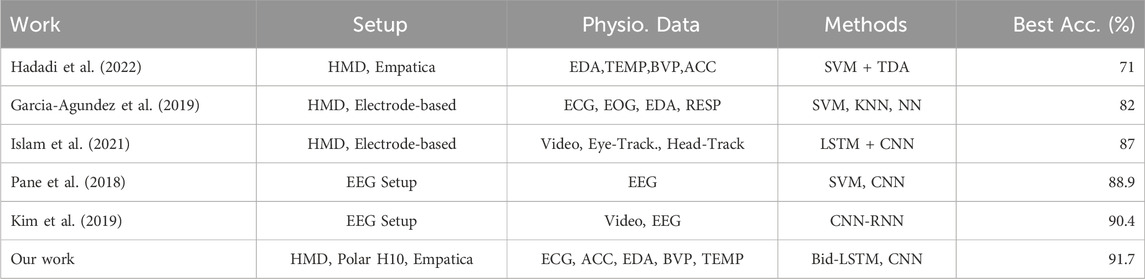
Table 5. Cybersickness detection accuracy results from the literature and comparison with our result.
In our work, we mainly pioneered to address these issues, hence improving the detection performance.
Upon evaluating the test results, we observed that the four-layered bidirectional LSTM model outperformed the CNN + LSTM and SVM models and slightly outperformed the standard LSTM model. Incorporating hidden layers in opposite directions, enabling access to past and future states, played a significant role in capturing sequential data patterns through the bidirectional LSTM. Notably, the recall scores for all models surpassed the precision scores in the original dataset, mainly due to the class imbalance issue. While the models correctly classified a substantial quantity of CS labels, they exhibited a high number of FPs, indicating a compromise in the quality of the classification. Additionally, both the training and testing sets on the original dataset showed a higher number of FPs than FNs.
One significant finding that we wish to emphasize is that our models with data augmentation exhibit remarkable generalization capability on a testing set comprising participants who differ from those used in the training set. Unlike previous research in the literature (see Table 5), our models effectively generalize their learning to new participants. With data augmentation, precision scores increased significantly by decreasing FPs, which is strong proof that the models gained enhanced detection capabilities for CS labels. Additionally, we successfully implemented a real-time CS detection system using our best model, which is a four-layered bidirectional LSTM. This system can be readily deployed in various VR scenarios, including medical and therapy applications.
During our experiments, we found that instructing participants to press the controller button when experiencing the rollercoaster simulation provided reliable ground truth data. However, this procedure resulted in an imbalanced dataset, as there were fewer instances of participants experiencing CS during the rollercoaster scenario than instances when they did not experience CS. This was particularly the case during the first 40 s of the experiment because it took time to elicit the CS effects. To capture the before and after effects on participants, we deployed a CS buffer as a hyperparameter during the optimization process. By labeling the data one second before and after CS occurrences, we observed an improvement in the classification performance. This can be attributed to the time required for participants to make decisions, such as pressing and releasing the button, and the continuation of physiological responses during the label transition phase. This hyperparameter also increased the number of CS-labeled data by approximately 5%.
Our data augmentation technique generates synthetic data that closely align with the data distribution of the original dataset. We evaluated the similarity between the synthetic and real data, and our results indicate that the bidirectional LSTM model achieves classification performance close to the chance level with 57.3% accuracy (see Table 3), which is evidence of an indistinguishable synthetic dataset. Moreover, we successfully addressed the issue of data imbalance through the implementation of the cGAN data augmentation model. Following the first round of data augmentation, the dataset achieved equal distribution per class, and the testing results revealed significant improvements not only in accuracy but also in other evaluation metrics. The recall and precision scores approached each other, indicating robust and accurate detection of both classes by the models. Performance evaluation of the second augmented dataset also indicated similar results across different metrics. Notably, precision and F1 scores surpassed those obtained from the original dataset, signifying improved accuracy in classifying instances of CS.
7.1 Limitations
We showed that the augmented physiological data can increase classifier performance significantly. However, the cGAN model is difficult to train in a stable way. We tried to overcome this problem with a diversity term. This could also improve the generalization capability of the learning models. In addition, the choice of the virtual scenario highly influences the responses from the participants. Even though many past experiments, for example, by Islam et al. (2020a) or Nalivaiko et al. (2015), chose to expose participants to a rollercoaster ride in VR, it might have influenced the resulting data negatively. A person might feel sick or nauseous during the experiment, not due to CS, but because a rollercoaster ride might have made them feel exactly the same way in real life. Because these borders are hard to define, another choice of virtual scenario might be an improvement. The rollercoaster ride might not be the perfect virtual scenario, but it can efficiently provoke CS symptoms. On the other hand, the measurement engine that we will provide can be used for data collection as well as a real-time detection system with the same sensory device setup. Hence, the system can be used by researchers in validation studies.
We used a relatively small data set in our study and enhanced the result with data augmentation to acquire generalization capability. However, more data can be collected in the future to acquire more robust results in different studies. A wider range of experimental scenarios would provide more variability and enable better model training and validation. Larger datasets that can be collected from a more extensive and diverse user population can help improve the model’s performance by reducing bias and overfitting and help ensure that the model is robust across different contexts.
8 Conclusion
In this work, we used a VR environment that includes a rollercoaster to elicit cybersickness and used a simple setup with sensory devices to collect physiological responses. We deployed three different deep learning models and one classical machine learning model to detect CS. In addition, we realized a completely real-time system using our best model. We demonstrated that a four-layered bidirectional LSTM with data augmentation gives superior results (91.7% accuracy; 91.1% F1-score), and this combination is the best solution for sensor-based CS detection in real-time applications, particularly for wearable devices. Furthermore, we showed that small, skewed, and imbalanced datasets can be augmented with our pioneered cGAN approach to increase the classifier performance significantly. In future works, we plan to investigate different VR scenarios for cybersickness elicitation and state-of-the-art models to enable multi-level CS classification.
Data availability statement
The raw data supporting the conclusions of this article will be made available by the authors, without undue reservation.
Author contributions
MY: methodology, software, visualization, writing–original draft, writing–review and editing, conceptualization, data curation, formal analysis, validation. AH: writing–review and editing, and software. MF: supervision, writing–review and editing, and investigation. ML: supervision, writing–review and editing, funding acquisition, and investigation.
Funding
The author(s) declare that financial support was received for the research, authorship, and/or publication of this article. This research has been funded by the German Federal Ministry of Education and Research (BMBF) in the project VIA-VR (project number: 16SV8444) and has been funded/was supported by the Bavarian State Ministry for Digital Affairs in the project XR Hub (Grant A5-3822-2-16). This publication was supported by the Open-Access Publication Fund of the University of Würzburg.
Acknowledgments
Special thanks to Jennifer Häfner, Felix Achter, Mohammad Farrahi and Marja Wahl for their help to this work and Florian Heinrich for proofreading and feedback.
Conflict of interest
The authors declare that the research was conducted in the absence of any commercial or financial relationships that could be construed as a potential conflict of interest.
The author(s) declared that they were an editorial board member of Frontiers, at the time of submission. This had no impact on the peer review process and the final decision.
Publisher’s note
All claims expressed in this article are solely those of the authors and do not necessarily represent those of their affiliated organizations, or those of the publisher, the editors, and the reviewers. Any product that may be evaluated in this article, or claim that may be made by its manufacturer, is not guaranteed or endorsed by the publisher.
Footnotes
1https://github.com/m1237/automatic-cybersickness-detection
References
Abdullah, M., and Shaikh, Z. A. (2018). An effective virtual reality based remedy for acrophobia. Int. J. Adv. Comput. Sci. Appl. 9. doi:10.14569/ijacsa.2018.090623
Alcañiz, M., Bigné, E., and Guixeres, J. (2019). Virtual reality in marketing: a framework, review, and research agenda. Front. Psychol. 10, 1530. doi:10.3389/fpsyg.2019.01530
Bălan, O., Moise, G., Moldoveanu, A., Leordeanu, M., and Moldoveanu, F. (2020). An investigation of various machine and deep learning techniques applied in automatic fear level detection and acrophobia virtual therapy. Sensors 20, 496. doi:10.3390/s20020496
Barreda-Ángeles, M., Aleix-Guillaume, S., and Pereda-Baños, A. (2020). Users’ psychophysiological, vocal, and self-reported responses to the apparent attitude of a virtual audience in stereoscopic 360°-video. Virtual Real. 24, 289–302. doi:10.1007/s10055-019-00400-1
Bartl, A., Merz, C., Roth, D., and Latoschik, M. E. (2022). “The effects of avatar and environment design on embodiment, presence, activation, and task load in a virtual reality exercise application,” in IEEE international symposium on mixed and augmented reality (ISMAR).
Caserman, P., Garcia-Agundez, A., Gámez Zerban, A., and Göbel, S. (2021). Cybersickness in current-generation virtual reality head-mounted displays: systematic review and outlook. Virtual Real. 25, 1153–1170. doi:10.1007/s10055-021-00513-6
Cebeci, B., Celikcan, U., and Capin, T. K. (2019). A comprehensive study of the affective and physiological responses induced by dynamic virtual reality environments. Comput. Animat. Virtual Worlds 30, e1893. doi:10.1002/cav.1893
Chang, C.-M., Hsu, C.-H., Hsu, C.-F., and Chen, K.-T. (2016). “Performance measurements of virtual reality systems: quantifying the timing and positioning accuracy,” in Proceedings of the 24th ACM international conference on Multimedia, 655–659.
Chang, E., Kim, H. T., and Yoo, B. (2020). Virtual reality sickness: a review of causes and measurements. Int. J. Human–Computer Interact. 36, 1658–1682. doi:10.1080/10447318.2020.1778351
Chardonnet, J.-R., Mirzaei, M. A., and Mérienne, F. (2015). “Visually induced motion sickness estimation and prediction in virtual reality using frequency components analysis of postural sway signal,” in International conference on artificial reality and telexistence eurographics symposium on virtual environments, 9–16.
Checa, D., and Bustillo, A. (2020). A review of immersive virtual reality serious games to enhance learning and training. Multimedia Tools Appl. 79, 5501–5527. doi:10.1007/s11042-019-08348-9
Chen, W., Chen, J. Z., and Richard, S. (2011a). Visually induced motion sickness: effects of translational visual motion along different axes. Contemp. ergonomics Hum. factors, 281–287. doi:10.1201/b11337-47
Chen, Y.-C., Dong, X., Hagstrom, J., and Stoffregen, T. (2011b). Control of a virtual ambulation influences body movement and motion sickness. BIO Web Conf. 1, 00016. doi:10.1051/bioconf/20110100016
Christopoulos, G. I., Uy, M. A., and Yap, W. J. (2019). The body and the brain: measuring skin conductance responses to understand the emotional experience. Organ. Res. Methods 22, 394–420. doi:10.1177/1094428116681073
Christov, I. (2004). Real time electrocardiogram QRS detection using combined adaptive threshold. Biomed. Eng. online 3, 28. doi:10.1186/1475-925X-3-28
Cobb, S. V., Nichols, S., Ramsey, A., and Wilson, J. R. (1999). Virtual reality-induced symptoms and effects (vrise). Presence Teleoperators Virtual Environ. 8, 169–186. doi:10.1162/105474699566152
Cortes, C., and Vapnik, V. (1995). Support-vector networks. Mach. Learn. 20, 273–297. doi:10.1023/A:1022627411411
Courtney, C., Dawson, M., Schell, A., Iyer, A., and Parsons, T. (2010). Better than the real thing: eliciting fear with moving and static computer-generated stimuli. Int. J. Psychophysiol. official J. Int. Organ. Psychophysiol. 78, 107–114. doi:10.1016/j.ijpsycho.2010.06.028
Davis, S., Nesbitt, K., and Nalivaiko, E. (2014). “A systematic review of cybersickness,” in Proceedings of the 2014 conference on interactive entertainment, 1–9.
Dennison, M. S., Wisti, A. Z., and D’Zmura, M. (2016). Use of physiological signals to predict cybersickness. Displays 44, 42–52. doi:10.1016/j.displa.2016.07.002
Ehrhart, M., Resch, B., Havas, C., and Niederseer, D. (2022). A conditional gan for generating time series data for stress detection in wearable physiological sensor data. Sensors 22, 5969. doi:10.3390/s22165969
Freitag, S., Weyers, B., and Kuhlen, T. W. (2016). Examining rotation gain in cave-like virtual environments. IEEE Trans. Vis. Comput. Graph. 22, 1462–1471. doi:10.1109/tvcg.2016.2518298
Garcia-Agundez, A., Reuter, C., Becker, H., Konrad, R. A., Caserman, P., Miede, A., et al. (2019). Development of a classifier to determine factors causing cybersickness in virtual reality environments. Games health J. 8, 439–444. doi:10.1089/g4h.2019.0045
Gazendam, A., Zhu, M., Chang, Y., Phillips, S., and Bhandari, M. (2022). Virtual reality rehabilitation following total knee arthroplasty: a systematic review and meta-analysis of randomized controlled trials. Knee Surg. Sports Traumatol. Arthrosc. 30, 2548–2555. doi:10.1007/s00167-022-06910-x
Gianola, S., Stucovitz, E., Castellini, G., Mascali, M., Vanni, F., Tramacere, I., et al. (2020). Effects of early virtual reality-based rehabilitation in patients with total knee arthroplasty: a randomized controlled trial. Medicine 99, e19136. doi:10.1097/md.0000000000019136
Glémarec, Y., Lugrin, J.-L., Bosser, A.-G., Buche, C., and Latoschik, M. E. (2022). Controlling the stage: a high-level control system for virtual audiences in virtual reality. Front. Virtual Real. – Virtual Real. Hum. Behav. 3. doi:10.3389/frvir.2022.876433
Good, I. J. (1952). Rational decisions. J. R. Stat. Soc. Ser. B Methodol. 14, 107–114. doi:10.1111/j.2517-6161.1952.tb00104.x
Goodfellow, I. J., Pouget-Abadie, J., Mirza, M., Xu, B., Warde-Farley, D., Ozair, S., et al. (2014). Generative adversarial networks. doi:10.48550/ARXIV.1406
Groth, C., Tauscher, J.-P., Heesen, N., Castillo, S., and Magnor, M. (2021). “Visual techniques to reduce cybersickness in virtual reality,” in 2021 IEEE conference on virtual reality and 3D user interfaces abstracts and workshops (VRW) (IEEE), 486–487.
Hadadi, A., Guillet, C., Chardonnet, J.-R., Langovoy, M., Wang, Y., and Ovtcharova, J. (2022). Prediction of cybersickness in virtual environments using topological data analysis and machine learning. Front. Virtual Real. 3. doi:10.3389/frvir.2022.973236
Halbig, A., Babu, S., Gatter, S., Latoschik, M., Brukamp, K., and von Mammen, S. (2022). Opportunities and challenges of virtual reality in healthcare – a domain experts inquiry. Virtual Real. 3, 837616. doi:10.3389/frvir.2022.837616
Halbig, A., and Latoschik, M. E. (2021). A systematic review of physiological measurements, factors, methods, and applications in virtual reality. Front. Virtual Real. 2, 89. doi:10.3389/frvir.2021.694567
Hamzeheinejad, N., Roth, D., Götz, D., Weilbach, F., and Latoschik, M. E. (2019). “Physiological effectivity and user experience of immersive gait rehabilitation,” in 2019 IEEE conference on virtual reality and 3D user interfaces (VR) (IEEE), 1421–1429.
Harada, S., Hayashi, H., and Uchida, S. (2018). Biosignal data augmentation based on generative adversarial networks. in 2018 40th annual international conference of the IEEE engineering in medicine and biology society (EMBC), 368–371.
Hastie, T., Tibshirani, R., and Friedman, J. (2001). The elements of statistical learning. in Springer series in statistics. New York, NY, USA: Springer New York Inc.
Hildebrandt, L. K., McCall, C., Engen, H. G., and Singer, T. (2016). Cognitive flexibility, heart rate variability, and resilience predict fine-grained regulation of arousal during prolonged threat. Psychophysiology 53, 880–890. doi:10.1111/psyp.12632
Hochreiter, S., and Schmidhuber, J. (1997). Long short-term memory. Neural Comput. 9, 1735–1780. doi:10.1162/neco.1997.9.8.1735
Huang, Y. C., Backman, K. F., Backman, S. J., and Chang, L. L. (2016). Exploring the implications of virtual reality technology in tourism marketing: an integrated research framework. Int. J. Tour. Res. 18, 116–128. doi:10.1002/jtr.2038
Islam, R., Desai, K., and Quarles, J. (2021). “Cybersickness prediction from integrated hmd’s sensors: a multimodal deep fusion approach using eye-tracking and head-tracking data,” in 2021 IEEE international symposium on mixed and augmented reality (ISMAR) (IEEE), 31–40.
Islam, R., Lee, Y., Jaloli, M., Muhammad, I., Zhu, D., and Quarles, J. (2020a). “Automatic detection of cybersickness from physiological signal in a virtual roller coaster simulation,” in 2020 IEEE conference on virtual reality and 3D user interfaces abstracts and workshops (VRW) (IEEE), 648–649.
Islam, R., Lee, Y., Jaloli, M., Muhammad, I., Zhu, D., Rad, P., et al. (2020b). “Automatic detection and prediction of cybersickness severity using deep neural networks from user’s physiological signals,” in 2020 IEEE international symposium on mixed and augmented reality (ISMAR), 400–411. doi:10.1109/ISMAR50242.2020.00066
Iwana, B. K., and Uchida, S. (2020). An empirical survey of data augmentation for time series classification with neural networks. PLoS ONE 16, e0254841. doi:10.1371/journal.pone.0254841
Jeong, D. K., Yoo, S., and Jang, Y. (2018). “Vr sickness measurement with eeg using dnn algorithm,” in Proceedings of the 24th ACM symposium on virtual reality software and technology, 1–2.
Kennedy, R. S., Lane, N. E., Berbaum, K. S., and Mg, L. (1993). Simulator sickness questionnaire: an enhanced method for quantifying simulator sickness. Int. J. Aviat. Psychol. 3, 203–220. doi:10.1207/s15327108ijap0303_3
Kern, F., Winter, C., Gall, D., Käthner, I., Pauli, P., and Latoschik, M. E. (2019). “Immersive virtual reality and gamification within procedurally generated environments to increase motivation during gait rehabilitation,” in 2019 IEEE conference on virtual reality and 3D user interfaces (VR) (IEEE), 500–509.
Keshavarz, B., and Hecht, H. (2011). Validating an efficient method to quantify motion sickness. Hum. factors 53, 415–426. doi:10.1177/0018720811403736
Kim, J., Kim, W., Oh, H., Lee, S., and Lee, S. (2019). “A deep cybersickness predictor based on brain signal analysis for virtual reality contents,” in Proceedings of the IEEE/CVF international conference on computer vision, 10580–10589.
Kingma, D. P., and Ba, J. (2014). Adam: a method for stochastic optimization. doi:10.48550/ARXIV.1412.6980
LaViola Jr, J. J. (2000). A discussion of cybersickness in virtual environments. ACM Sigchi Bull. 32, 47–56. doi:10.1145/333329.333344
Lee, S., Kim, S., Kim, H. G., Kim, M. S., Yun, S., Jeong, B., et al. (2019). Physiological fusion net: quantifying individual vr sickness with content stimulus and physiological response. In 2019 IEEE international conference on image processing (ICIP) (IEEE), 440–444.
Lindner, P., Rozental, A., Jurell, A., Reuterskiöld, L., Andersson, G., Hamilton, W., et al. (2020). Experiences of gamified and automated virtual reality exposure therapy for spider phobia: qualitative study. JMIR serious games 8, e17807. doi:10.2196/17807
Liu, C.-L., and Uang, S.-T. (2012). “A study of sickness induced within a 3d virtual store and combated with fuzzy control in the elderly,” in 2012 9th international conference on fuzzy systems and knowledge discovery (IEEE), 334–338.
Llorach, G., Evans, A., and Blat, J. (2014). “Simulator sickness and presence using hmds: comparing use of a game controller and a position estimation system,” in Proceedings of the 20th ACM symposium on virtual reality software and technology, 137–140.
Lopez-Paz, D., and Oquab, M. (2017). “Revisiting classifier two-sample tests,” in International conference on learning representations.
Loureiro, S. M. C., Guerreiro, J., Eloy, S., Langaro, D., and Panchapakesan, P. (2019). Understanding the use of virtual reality in marketing: a text mining-based review. J. Bus. Res. 100, 514–530. doi:10.1016/j.jbusres.2018.10.055
Lubeck, A. J., Bos, J. E., and Stins, J. F. (2015). Motion in images is essential to cause motion sickness symptoms, but not to increase postural sway. Displays 38, 55–61. doi:10.1016/j.displa.2015.03.001
Martin, N., Mathieu, N., Pallamin, N., Ragot, M., and Diverrez, J.-M. (2020). “Virtual reality sickness detection: an approach based on physiological signals and machine learning,” in 2020 IEEE international symposium on mixed and augmented reality (ISMAR), 387–399. doi:10.1109/ISMAR50242.2020.00065
Miloff, A., Lindner, P., Hamilton, W., Reuterskiöld, L., Andersson, G., and Carlbring, P. (2016). Single-session gamified virtual reality exposure therapy for spider phobia vs. traditional exposure therapy: study protocol for a randomized controlled non-inferiority trial. Trials 17, 60–68. doi:10.1186/s13063-016-1171-1
Mirza, M., and Osindero, S. (2014). Conditional generative adversarial nets. doi:10.48550/ARXIV.1411.1784
Nair, V., and Hinton, G. E. (2010). “Rectified linear units improve restricted Boltzmann machines,” in Proceedings of the 27th international Conference on international Conference on machine learning (madison, WI, USA: omnipress), ICML’10, 807–814.
Nakagawa, C. (2015). “Toward the detection of the onset of virtual reality sickness by autonomic indices,” in 2015 IEEE 4th global conference on consumer electronics (GCCE) (IEEE), 662–663.
Nalivaiko, E., Davis, S., Blackmore, K., Vakulin, A., and Nesbitt, K. (2015). Cybersickness provoked by head-mounted display affects cutaneous vascular tone, heart rate and reaction time. Aut. Neurosci. 192, 63. doi:10.1016/j.autneu.2015.07.032
Nikolaidis, K., Kristiansen, S., Goebel, V., Plagemann, T., Liestøl, K., and Kankanhalli, M. (2019). “Augmenting physiological time series data: a case study for sleep apnea detection,” in Machine learning and knowledge discovery in databases: European conference, ECML PKDD 2019, würzburg, Germany, september 16–20, 2019, proceedings, Part III (Berlin, Heidelberg: Springer-Verlag), 376–399. doi:10.1007/978-3-030-46133-1_23
Oberdörfer, S., Heidrich, D., and Latoschik, M. E. (2017). “Interactive gamified virtual reality training for affine transformations,” in DeLFI/GMW workshops.
Oman, C. M. (1990). Motion sickness: a synthesis and evaluation of the sensory conflict theory. Can. J. physiology Pharmacol. 68, 294–303. doi:10.1139/y90-044
Pallavicini, F., Pepe, A., and Minissi, M. E. (2019). Gaming in virtual reality: what changes in terms of usability, emotional response and sense of presence compared to non-immersive video games? Simul. Gaming 50, 136–159. doi:10.1177/1046878119831420
Pane, E. S., Khoirunnisaa, A. Z., Wibawa, A. D., and Purnomo, M. H. (2018). Identifying severity level of cybersickness from eeg signals using cn2 rule induction algorithm. 2018 Int. Conf. Intelligent Inf. Biomed. Sci. (ICIIBMS) 3, 170–176. doi:10.1109/iciibms.2018.8549968
Rangelova, S., Motus, D., and André, E. (2020). “Cybersickness among gamers: an online survey,” in Advances in human factors in wearable Technologies and game design. Editor T. Ahram (Cham: Springer International Publishing), 192–201.
Rebenitsch, L., and Owen, C. (2016). Review on cybersickness in applications and visual displays. Virtual Real. 20, 101–125. doi:10.1007/s10055-016-0285-9
Recenti, M., Ricciardi, C., Aubonnet, R., Picone, I., Jacob, D., Svansson, H. Á., et al. (2021). Toward predicting motion sickness using virtual reality and a moving platform assessing brain, muscles, and heart signals. Front. Bioeng. Biotechnol. 9, 635661. doi:10.3389/fbioe.2021.635661
Riccio, G. E., and Stoffregen, T. A. (1991). An ecological theory of motion sickness and postural instability. Ecol. Psychol. 3, 195–240. doi:10.1207/s15326969eco0303_2
Saredakis, D., Szpak, A., Birckhead, B., Keage, H. A., Rizzo, A., and Loetscher, T. (2020). Factors associated with virtual reality sickness in head-mounted displays: a systematic review and meta-analysis. Front. Hum. Neurosci. 14, 96. doi:10.3389/fnhum.2020.00096
Schuster, M., and Paliwal, K. (1997). Bidirectional recurrent neural networks. IEEE Trans. Signal Process. 45, 2673–2681. doi:10.1109/78.650093
Sharples, S., Cobb, S., Moody, A., and Wilson, J. R. (2008). Virtual reality induced symptoms and effects (vrise): comparison of head mounted display (hmd), desktop and projection display systems. Displays 29, 58–69. doi:10.1016/j.displa.2007.09.005
Shorten, C., and Khoshgoftaar, T. (2019). A survey on image data augmentation for deep learning. J. Big Data 6, 60. doi:10.1186/s40537-019-0197-0
Stanney, K. M., Kennedy, R. S., and Drexler, J. M. (1997). Cybersickness is not simulator sickness. in Proceedings of the human factors and ergonomics society annual meeting. CA: Los Angeles, CA: SAGE Publications Sage, 1138–1142. doi:10.1177/107118139704100292
Stauffert, J.-P., Niebling, F., and Latoschik, M. E. (2018). “Effects of latency jitter on simulator sickness in a search task,” in 2018 IEEE conference on virtual reality and 3D user interfaces (VR) (IEEE), 121–127.
Stauffert, J.-P., Niebling, F., and Latoschik, M. E. (2020). Latency and cybersickness: impact, causes, and measures. a review. Front. Virtual Real. 1, 582204. doi:10.3389/frvir.2020.582204
Tauscher, J.-P., Witt, A., Bosse, S., Schottky, F. W., Grogorick, S., Castillo, S., et al. (2020). Exploring neural and peripheral physiological correlates of simulator sickness. Comput. Animat. Virtual Worlds 31, e1953. doi:10.1002/cav.1953
Treisman, M. (1977). Motion sickness: an evolutionary hypothesis. Science 197, 493–495. doi:10.1126/science.301659
Um, T. T., Pfister, F. M. J., Pichler, D., Endo, S., Lang, M., Hirche, S., et al. (2017). “Data augmentation of wearable sensor data for Parkinson’s disease monitoring using convolutional neural networks,” in Proceedings of the 19th ACM international conference on multimodal interaction (New York, NY, USA: Association for Computing Machinery), 216–220. doi:10.1145/3136755.3136817
Viavr_Measurement_Engine, , Yalcin, M.H., Latoschik, A., and Erich, M. (2022). Measurement Engine–Technology Platform for Virtual Adventures (VIA-VR). Available at: https://hci.uni-wuerzburg.de/projects/via-vr/ (Accessed May 10, 2024).
Viavr_Project, , von Mammen, S., Latoschik, A., Botsch, M.E., and Brukamp, M. (2019). “VIA VR: A technology platform for virtual adventures for healthcare and well-being,” in 2019 11th International Conference on Virtual Worlds and Games for Serious Applications (VS-Games), 1–2. doi:10.1109/VS-Games.2019.8864580
Wang, J., Liang, H.-N., Monteiro, D. V., Xu, W., and Xiao, J. (2023). Real-time prediction of simulator sickness in virtual reality games. IEEE Trans. Games 15, 252–261. doi:10.1109/tg.2022.3178539
Wen, Q., Sun, L., Yang, F., Song, X., Gao, J., Wang, X., et al. (2021). Time series data augmentation for deep learning: a survey, 4653–4660. doi:10.24963/ijcai.2021/631
Wienrich, C., Weidner, C. K., Schatto, C., Obremski, D., and Israel, J. H. (2018). “A virtual nose as a rest-frame-the impact on simulator sickness and game experience,” in 2018 10th international conference on virtual worlds and games for serious applications (VS-Games) (IEEE), 1–8.
Wolf, E., Döllinger, N., Mal, D., Wienrich, C., Botsch, M., and Latoschik, M. E. (2020). “Body weight perception of females using photorealistic avatars in virtual and augmented reality,” in 2020 IEEE international symposium on mixed and augmented reality (ISMAR), 462–473.
Wolf, E., Merdan, N., Döllinger, N., Mal, D., Wienrich, C., Botsch, M., et al. (2021). “The embodiment of photorealistic avatars influences female body weight perception in virtual reality,” in Proceedings of the 28th IEEE virtual reality conference (VR 21), 65–74. doi:10.1109/VR50410.2021.00027
Xu, B., Wang, N., Chen, T., and Li, M. (2015). Empirical evaluation of rectified activations in convolutional network
Yang, A., Kasabov, N., and Cakmak, Y. (2022). Machine learning methods for the study of cybersickness: a systematic review. Brain Inf. 9, 24. doi:10.1186/s40708-022-00172-6
Keywords: virtual reality, cybersickness detection, deep learning, data augmentation, CGAN, physiological signals, data processing, sensors
Citation: Yalcin M, Halbig A, Fischbach M and Latoschik ME (2024) Automatic cybersickness detection by deep learning of augmented physiological data from off-the-shelf consumer-grade sensors. Front. Virtual Real. 5:1364207. doi: 10.3389/frvir.2024.1364207
Received: 01 January 2024; Accepted: 15 April 2024;
Published: 17 June 2024.
Edited by:
Daniele Giunchi, University College London, United KingdomReviewed by:
Diego Vilela Monteiro, ESIEA University, FranceNitesh Bhatia, Imperial College London, United Kingdom
Copyright © 2024 Yalcin, Halbig, Fischbach and Latoschik. This is an open-access article distributed under the terms of the Creative Commons Attribution License (CC BY). The use, distribution or reproduction in other forums is permitted, provided the original author(s) and the copyright owner(s) are credited and that the original publication in this journal is cited, in accordance with accepted academic practice. No use, distribution or reproduction is permitted which does not comply with these terms.
*Correspondence: Murat Yalcin, bXVyYXQueWFsY2luQHVuaS13dWVyemJ1cmcuZGU=