
94% of researchers rate our articles as excellent or good
Learn more about the work of our research integrity team to safeguard the quality of each article we publish.
Find out more
ORIGINAL RESEARCH article
Front. Virtual Real., 26 July 2024
Sec. Virtual Reality and Human Behaviour
Volume 5 - 2024 | https://doi.org/10.3389/frvir.2024.1353941
This article is part of the Research TopicUse of body and gaze in extended realityView all 6 articles
 Wilbert Tabone1
 Riender Happee1
 Yue Yang2Ehsan Sadraei2Jorge García de Pedro2
 Yee Mun Lee2Natasha Merat2
 Joost de Winter1*
Introduction: Augmented reality (AR) has been increasingly studied in transportation, particularly for drivers and pedestrians interacting with automated vehicles (AVs). Previous research evaluated AR interfaces using online video-based questionnaires but lacked human-subject research in immersive environments. This study examined if prior online evaluations of nine AR interfaces could be replicated in an immersive virtual environment and if AR interface effectiveness depends on pedestrian attention allocation.
Methods: Thirty participants completed 120 trials in a CAVE-based simulator with yielding and non-yielding AVs, rating the interface’s intuitiveness and crossing the road when they felt safe. To emulate visual distraction, participants had to look into an attention-attractor circle that disappeared 1 s after the interface appeared.
Results: The results showed that intuitiveness ratings from the current CAVE-based study and the previous online study correlated strongly (r ≈ 0.90). Head-locked interfaces and familiar designs (augmented traffic lights, zebra crossing) yielded higher intuitiveness ratings and quicker crossing initiations than vehicle-locked interfaces. Vehicle-locked interfaces were less effective when the attention-attractor was on the environment’s opposite side, while head-locked interfaces were relatively unaffected by attention-attractor position.
Discussion: In conclusion, this ‘AR in VR’ study shows strong congruence between intuitiveness ratings in a CAVE-based study and online research, and demonstrates the importance of interface placement in relation to user gaze direction.
Road accidents rank among the top ten causes of human fatalities in middle-income countries, as reported by the World Health Organisation (2020). Academia and industry have been researching a number of ways to curb this problem, such as through the use of smart infrastructure (Banks et al., 2018; Sewalkar and Seitz, 2019; Toh et al., 2020) and connectivity. The future urban environment will likely be more connected than today (Alam et al., 2017), and traffic partners may communicate with each other in order to facilitate traffic flow (Cao et al., 2022), resolve right of way conflicts (Li et al., 2020), and improve road safety for vulnerable road users, including pedestrians.
A specific solution is the use of external human-machine interfaces (eHMIs) on automated vehicles (AVs), which could take the form of projections onto the road, LED strips, LED screens, or anthropomorphic elements, amongst other examples (see Bazilinskyy et al., 2019; Rouchitsas and Alm, 2019; Dey et al., 2020, for reviews of such interfaces). Although eHMIs have been shown to effectively convince VRUs whether or not to cross in front of approaching vehicles (De Clercq et al., 2019), there exist a number of drawbacks related to current designs, including the use of text, especially if the language is unfamiliar, cases where the eHMI needs to signal to a single pedestrian in a group, cultural differences in interpretability, and lack of standardisation across designs (Weber et al., 2019; Rasouli and Tsotsos, 2020; Tabone et al., 2021a; 2023; De Winter and Dodou, 2022).
Augmented Reality (AR) has been proposed as a new type of communication in traffic, and as a possible solution to the aforementioned problems with eHMIs. In particular, AR offers the possibility of sending a customised signal to an individual pedestrian in a group (Tabone et al., 2021b; 2023; Tran et al., 2022). Most AR studies so far have focused on the driver as the user (Kim et al., 2018; Calvi et al., 2020; Pichen et al., 2020; Colley et al., 2021; Currano et al., 2021; Mukhopadhyay et al., 2023), or as a navigation assistant to VRUs (Dancu et al., 2015; Bhorkar, 2017; Ginters, 2019; Dong et al., 2021; Tran et al., 2023). However, more recently, studies have explored the use of AR as an assistive technology for pedestrians and other vulnerable road users, such as cyclists, to guide them in making safe crossing decisions by including road projections of zebra crossings, arrows, and safe paths (Hesenius et al., 2018; Pratticò et al., 2021; Li et al., 2022; Tran et al., 2022; 2023), visualisation of obstructed vehicles, remaining time for safely crossing an intersection, and conflict points (Tong and Jia, 2019; Von Sawitzky et al., 2020; Matviienko et al., 2022), and car overlays (Tran et al., 2022).
Nine novel AR interfaces for pedestrian-AV interaction were previously developed in Tabone et al. (2021b) to support pedestrians in crossing an urban road. These interfaces were designed using an experience-based approach through theoretically-informed brainstorming sessions and based on expert perspectives extracted from Tabone et al. (2021a). An expert (‘genius’)-based design method was used (Saffer, 2010), where the designers used established theories such as predictive aiding, ecological interface design (Kadar and Shaw, 2000), redundancy gain, and the proximity compatibility principle, amongst others (Wickens et al., 2004). Each of the AR interfaces was designed with two states (non-yielding and yielding) to represent whether a vehicle would stop or not for the pedestrian, since the goal of these interfaces is to assist pedestrians in the decision to cross the road in front of an approaching AV.
Tabone et al. (2023) assessed these AR interfaces through an online questionnaire completed by 992 respondents in Germany, the Netherlands, Norway, Sweden, and the United Kingdom. The nine interfaces were recorded in a virtual reality (VR) environment and presented as videos to the respondents; they rated the interfaces for intuitiveness and convincingness, aesthetics, and usefulness. Moreover, respondents were asked to provide free-text comments to further support their choices. Results indicated a preference for interfaces that incorporated familiar elements from existing traffic, as well as head-up displays (HUDs). These insights were possible through statistical and qualitative thematic analyses, which also revealed a number of unintended effects of certain designs.
Despite the rich body of information that was extracted from the online questionnaire study, one of the limitations of Tabone et al. (2023) was that it did not offer high ecological validity and presented only low perceived risks to the participants. A possible solution to this problem would be to use a VR simulation method that embodies the participant. The use of an immersive environment is important to test the distributed attention of participants, since in real traffic, accidents do occur because, similar to drivers, pedestrians may fail to look at the right object, at the right time (Lee, 2008; Ralph and Girardeau, 2020; Lanzer et al., 2023).
Two possible VR simulation methods are to use a head-mounted display (HMD) or a CAVE (Cave automatic virtual environment). An advantage of a CAVE setup is that it allows participants to see their bodies as they move around (Cordeil et al., 2017). Previous experiments with pedestrians in a CAVE investigated their overreliance on AVs equipped with eHMIs (Kaleefathullah et al., 2022) and crossing behaviour of pedestrians on a road with continuous traffic (Mallaro et al., 2017; Kalantari et al., 2023). In this study, we extend the research of Tabone et al. (2023) by assessing the nine AR interfaces delineated in Tabone et al. (2021b) within a CAVE-based pedestrian simulator, with the objective of examining the generalisability of findings from online questionnaire studies.
There exist fundamental differences among various types of AR designs (Carmigniani et al., 2011; Arena et al., 2022). Some AR designs are head-locked, meaning the displayed message remains fixed in the pedestrian’s field of view (FOV) as they move their head. This feature ensures that the message is always visible to the pedestrian, allowing the user to benefit regardless of where the pedestrian is looking (Tabone et al., 2021a). Alternatively, AR interfaces may be positioned on the road infrastructure (Hesenius et al., 2018). The supposed advantage of this approach is that the interface can be found at known and expected locations (e.g., on the other side of the road or on the road surface). However, a disadvantage of this approach is that the AR interface may be overlooked when the pedestrian glances left or right before deciding to cross the road. Finally, AR interfaces may be locked to the vehicle, similar to eHMIs. This approach has the advantage that the AR interface is congruent with the vehicle’s motion, such that the pedestrian can process the implicit communication of the vehicle concurrently with the explicit AR signal. Furthermore, this approach eliminates the need for pedestrians to distribute their attention towards multiple elements. However, a possible downside of vehicle-locked interfaces is that the vehicle must be identified before the pedestrian can benefit from the AR interface. For example, if a vehicle approaches from the right while the pedestrian happens to be looking to the left and does not immediately scan to the right, identifying the AR interface may be inefficient.
In this study, we examine the effects of initial visual attention using a novel technique to guide the pedestrian’s initial attention towards specific regions of the road before the arrival of the AV. Specifically, we used an attention-attractor circle placed either on the left, front, or right side of the scene, while the AV always approached from the right, to investigate the hypothesis of whether the effectiveness of the AR interface type would depend on the pedestrian’s initial attention allocation. The attention-attractor circle was used to emulate the behaviour of pedestrians who initially fail to observe the approaching vehicle, as attention resources are finite (e.g., Wickens et al., 2004; Ralph and Girardeau, 2020), and individuals cannot attend to the entire traffic scenario simultaneously.
The aim of the experiment is to examine the effects of the nine different AR interfaces (previously described in Tabone et al., 2021b; 2023) on pedestrian crossing behaviour and perceived intuitiveness, compared to a no-AR baseline condition, as well as to evaluate how these interfaces score relative to each other. It is expected that the quality ratings observed in Tabone et al. (2023) will be replicated in the present immersive CAVE-based environment. Moreover, the nine AR interfaces are anticipated to be regarded as clearer than the no-AR baseline condition.
Additionally, the current study investigates the effect of the above-mentioned position-based attention attractor on pedestrian crossing behaviour and perceived intuitiveness for different AR interfaces. We expected an AR/attention-attractor interaction where the effectiveness of the AR interface, expressed in terms of faster crossing initiation times, would depend on where the participant is looking, given the fact that the AV always came from the right. Specifically, it was hypothesised that head-locked AR interfaces (e.g., Nudge HUD, Pedestrian lights HUD) would be effective when the attention-attractor is presented on the left, while infrastructure-locked (road-mapped) AR interfaces (e.g., Augmented zebra crossing, Fixed pedestrian lights, Virtual fence) would be effective when the attention attractor is presented in the centre location, across the road. Finally, vehicle-locked AR interfaces (e.g., Planes on vehicle, Conspicuous looming planes, Field of safe travel, Phantom car) were expected to be more effective when the attention-attractor circle was presented on the right.
Thirty participants (20 male, 9 female, and 1 non-specified), aged between 22 and 53 (M = 31.50, SD = 7.98) were recruited for the study. The 30 participants were of 12 different nationalities, namely British (10), Chinese (5), Greek (3), Indonesian (3), Malay (2), German (1), Maltese (1), Norwegian (1), Romanian (1), Saudi (1), Turkish (1), and Zimbabwean (1). From the participant pool, 57% (n = 17) indicated that they had never been in a CAVE, while 43% (n = 13) indicated that they had. Further general characteristics of the 30 participants, which were collected in the demographic survey, are available in the Supplementary Material. Because the participants in the current experiment were recruited independently from the previous international online questionnaire, it is unlikely that the current participants have taken part in this online questionnaire before.
Participants were recruited using an opportunistic sampling approach. Internal emails were sent to a pool of people interested in participating in the University of Leeds Driving and Pedestrian Simulation studies, and to various schools at the University of Leeds. Moreover, adverts were posted on a Facebook group consisting of students studying at the same university, and a further group composed of residents of Leeds.
Criteria for participating in the study were highlighted in both the emails and adverts. Specifically, participants were only eligible to participate if they were over the age of 18, had a good command of English, did not suffer from severe mobility issues, and did not suffer from epilepsy, claustrophobia, or feelings of disorientation. Moreover, we asked participants to wear lenses if they had prescription glasses, and if they had long hair, to tie it back on the day of the experiment due to the eye-tracking equipment.
Participants were able to select an available time slot using an online calendar system linked to the experimenter’s and simulator’s calendars. The experiment ran for 2 weeks between June and July 2022, and the participants were financially compensated with a £15 Amazon gift voucher for their time spent, which was roughly 60–90 min. The experiment was approved by the University of Leeds Research Ethics Committee under ethics reference number LLTRAN-150.
The experiment was created using Unity v.2020.3.35f1 (Unity, 2022) and was performed in the Highly Immersive Kinematic Experimental Research (HIKER) simulator located at the University of Leeds (University of Leeds, 2022). The HIKER is a 9 × 4 m CAVE simulator, composed of eight 4K high resolution (3,840 × 2,400 px) projectors, and 10 Vicon Vero 2.2 IR cameras, which were calibrated and controlled using Vicon Tracker 3.9. The simulator supports both stereo and mono modes. For this experiment, mono mode was used.
Gaze data were sampled at 50 Hz and collected using the Tobii Pro Glasses 2 (firmware 1.25.6-citronkola-0; head unit 0.062) mobile eye-tracker, which was operated and calibrated using the Tobii Controller Software v.1.114.20033. Participants’ verbal statements were recorded using an Olympus VP-20 microphone. A Logitech web camera mounted on a tripod was used to record the entire experiment per participant in low resolution. High-resolution video clips for dissemination were recorded using a GoPro Hero 10 camera and an iPhone 13 Pro.
The entire experiment was run on an eight-computer rack, with seven Image Generator (IG) machines, each with an Intel® Core™i9-7900X CPU @ 3.30 GHz, 32 GB RAM, and an 8 GB Nvidia Quadro P6000 GPU, and the host machine equipped with an Intel® Core™i9-7900X CPU @ 3.30 GHz, 128 GB RAM, and an 8 GB Nvidia Quadro P4000 GPU.
The interfaces evaluated in this simulator study were adopted from the designs in Tabone et al. (2021b) and were identical to the VR implementation used in Tabone et al. (2023). In total, nine AR interfaces were designed and developed as functioning AR prototypes (Tabone et al., 2021b).
In general, the interfaces were split into three categories: interfaces that were locked to the infrastructure, to the vehicle, and the user’s head position (i.e., HUDs). There were three interfaces that were locked to the infrastructure:
• Augmented zebra crossing (labelled 1 in Figure 1), which was a conventional zebra crossing,
• Fixed pedestrian traffic lights (5), which depicted a familiar pedestrian traffic light design across the road, and
• Virtual fence (6), which displayed semi-translucent walls around a zebra-crossing and a gate that opened in the yielding state.
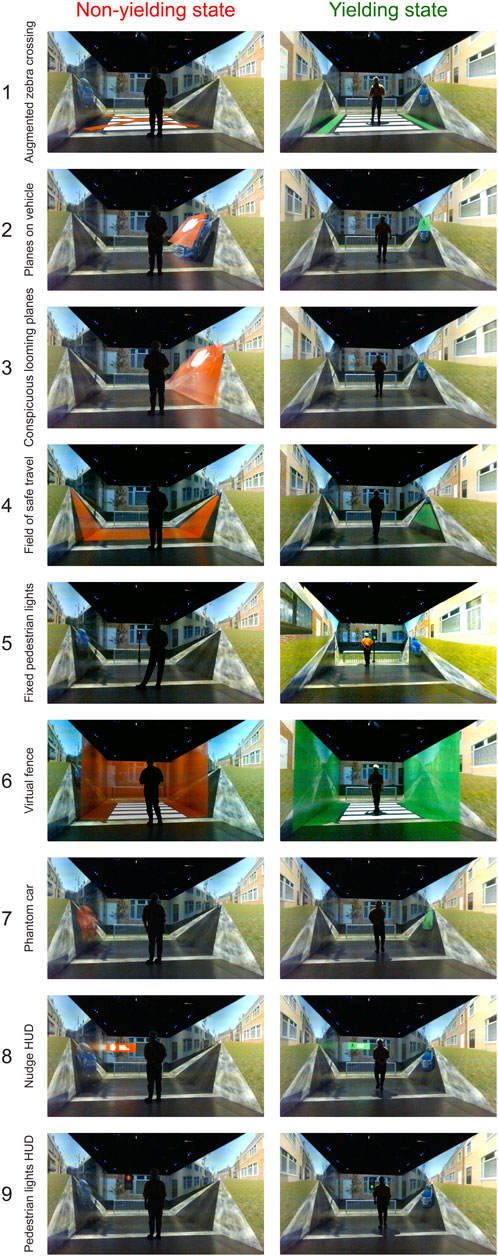
Figure 1. The nine AR concepts presented in the HIKER environment. Interfaces 1, 5, and 6 were infrastructure-locked, Interfaces 2, 3, 4, and 7 were vehicle-locked, and Interfaces 8 and 9 were head-locked.
The interfaces that were locked to the vehicle included:
• Planes on the vehicle (2), which displayed a plane on the windshield area of the vehicle,
• Conspicuous looming planes (3), which was a scaling version of (B), growing or shrinking as the vehicle approached the pedestrian depending on the AV’s yielding state,
• Field of safe travel (4) which projected a field on the road in front of the vehicle to communicate safety, and
• Phantom car (7), which projected the vehicle’s predicted future motion.
The final category of interfaces are HUDs that were head-locked to the user’s head position, i.e., they followed and remained in the user’s FOV. These are:
• Nudge HUD (8), which displayed a head-locked text message (‘SAFE TO CROSS’ vs ‘DANGER! VEHICLE IS APPROACHING’ with a corresponding icon on a green or red background, respectively, and
• Pedestrian lights HUD (9), which displayed a head-locked version of the pedestrian traffic lights.
Interfaces locked to the infrastructure or the vehicle were positioned within the environment or attached to the vehicle, respectively, while the HUDs moved with the participant’s head orientation. The Nudge HUD measured 65 cm in width and 20 cm in height and was situated 2.5 m away from the participant, while the Pedestrian lights HUD measured 20 cm in width and 40 cm in height. The bottom edge of the HUDs aligned with the participant’s eye level. In comparison to the online questionnaire study, the dimensions of the HUDs were reduced due to the restricted FOV in the CAVE. The red (RGB: 244, 0, 0) and green (RGB: 32, 244, 0) colours of the non-yielding and yielding states were chosen based on their high intuitiveness scores for signalling ‘please (do not) cross’ (Bazilinskyy et al., 2020).
The current study adopted the road environment and vehicle behaviours from Kaleefathullah et al. (2022) and Tabone et al. (2023). The AV spawned out of sight (Figure 2, point A) and moved at a constant speed of 48 km/h (30 mph). The AR interfaces were activated when the AV was 43 m away in virtual space (Figure 2, point B) from the participant, who was located at point E. For non-yielding states, the vehicle maintained its initial speed of 48 km/h throughout. In contrast, for yielding states, the vehicle started decelerating at Point C, which was 33 m from Point E (the participant), at a rate of 2.99 m/s2, and came to a complete stop at Point D, located 3 m from Point E.
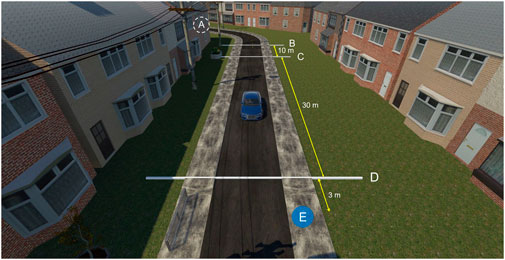
Figure 2. The simulation environment used for the HIKER experiment. Each salient point is demarcated by a label, together with the distance (in metres) between each point. (A) spawn point, (B) AR interface onset, (C) AV deceleration onset, (D) stopping point, (E) participant location. Image adapted from Tabone et al. (2023).
At the start of each trial, an attention-attractor circle was presented in the shape of a stationary open circle with cyan border (RGB: 0, 255, 255). The circle was displayed in one of three different positions: left, front-centre (i.e., across the street), and to the right of the participant (Figure 3). Cyan was chosen as this colour has been considered to be neutral and without any meaning in current traffic (Bazilinskyy et al., 2020). The circle would disappear if the participant looked into the area enclosed by its circumference for 1 s. The detection of whether the participant was looking into the circle was conducted through the head-tracker. If this condition was met, the trial commenced.
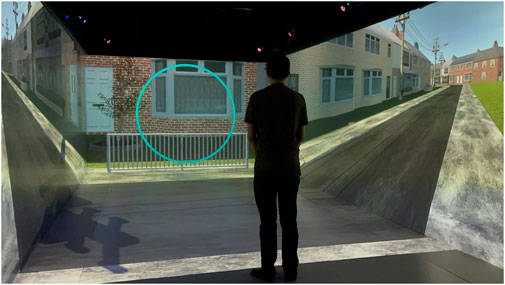
Figure 3. A participant standing on the blue marker and looking at the cyan attention-attractor circle, which is displayed in the centre position.
Two seconds after the vehicle appeared from behind the curve, the vehicle arrived at point B (see Figure 2) and the AR interface was activated (Figure 4B). If the condition was an interface in yielding state, the vehicle started decelerating at point C (see Figure 2). The circle disappeared 1 s after the AR interface was activated (see Table 1 for an overview of the different moments in a trial). If this constraint was not applied, participants may have looked at the car as soon as possible since they expect the car to appear from behind the corner of the road, or because they could see it in their peripheral vision.
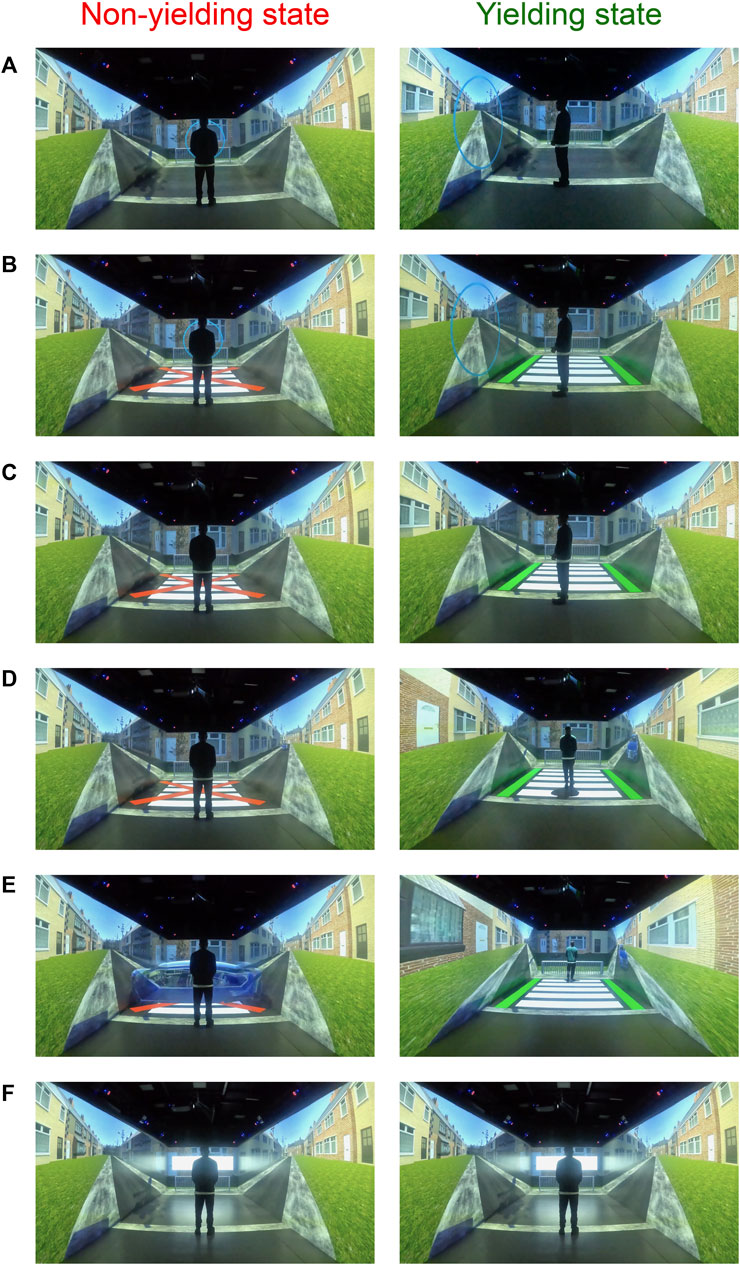
Figure 4. Timeline of the crossing experiment, with the left column representing the non-yielding condition, and the right column the yielding condition. For a definition of the corresponding moments in time, see Table 1.
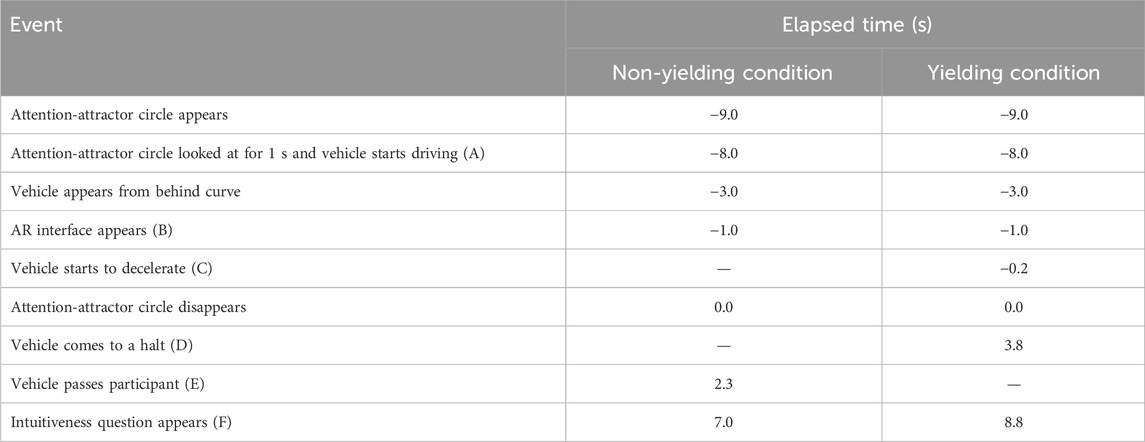
Table 1. Timings of events of trials, centred around the moment the circle disappeared. The letters in parentheses correspond to the positions in Figure 2.
The experiment used a within-subject design with 120 trials per participant: 90 trials with a yielding AV and 30 trials with a non-yielding AV. The yielding trials included 10 interface conditions (including Baseline) x 3 circle positions x 3 repetitions, whereas the non-yielding trials included 10 interface conditions x 3 circle positions x 1 repetition. The higher number of yielding trials was chosen because non-yielding trials did not require the participant to cross, and thus did not provide data on crossing timing. Each interface condition was presented in a separate block, resulting in ten blocks, counterbalanced across participants. Each block contained 12 trials (4 yielding/non-yielding conditions x 3 circle positions), presented in a random order for each block.
After each trial, a question was projected on the centre screen of the CAVE. Participants verbally indicated their agreement from 1 (Strongly disagree) to 7 (Strongly agree), with the statement: “The interface was intuitive for signalling: ‘Please cross the road’” (for yielding AVs) or “The interface was intuitive for signalling: ‘Please do NOT cross the road’” (for non-yielding AVs). In the case of the Baseline condition, which featured no AR interface, the word, “interface” was replaced by “situation”. Figure 5 demonstrates various moments in a trial.
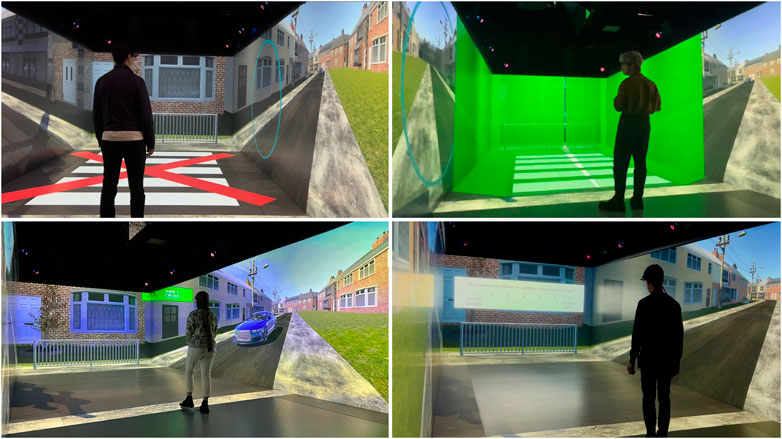
Figure 5. Top-left: Non-yielding state of the Augmented zebra crossing, before the attention-attractor circle on the right disappears. Top-right: Yielding state of the Virtual fence, before the circle on the left disappears. Bottom-left: Yielding state of the Nudge HUD. Bottom-right: Intuitiveness rating scale, displayed at the end of a trial.
Participants were welcomed into the room containing the CAVE simulator by an experimenter. An information sheet containing the experiment protocol (also sent to the participant by email previously) was presented. If the participant agreed with all the information, they were asked to sign the consent form. Participants were reminded that they can choose to stop the experiment at any time. Participants were then asked to complete a demographics questionnaire, which was developed using the Qualtrics XM (Qualtrics, 2022) survey platform. Details of the questionnaire are presented in the Supplementary Material.
Following the demographics questionnaire, the participants were asked to wear overshoe covers to protect the HIKER flooring, and the Tobii eye-tracker system, which was also equipped with infrared markers to track the head position and correctly align the CAVE to the participant’s FOV. The eye-tracker was subsequently calibrated, and the participant walked into the simulator and stood on a blue marker demarking the starting position for each trial (Figure 4A).
The experimenter then reminded the participant of some key points highlighted in the information sheet. They were asked to look into the cyan circle for 1 consecutive second (Figure 4B). If the participant violated this rule, a beeping sound was automatically produced to draw the attention of the participant back to the circle. If the participant adhered to the instructions, the vehicle would come out from behind the corner.
Furthermore, participants were reminded that they might encounter various informative interfaces, and that they were to cross the entire road (from one curb to the other) only if they felt that it was safe to do so (Figure 4D, right). If the vehicle drove past them (Figure 4E, left), then they no longer needed to cross. Once they had crossed the road, and the intuitiveness question was displayed (Figure 4F), they were allowed to walk back to the starting position and provide their answer there. The participants were also reminded about a digital mesh that appears across the nearest CAVE wall if they get too close, to warn participants to stop walking and avoid crashing into a physical barrier.
For improved understanding, two practice trials of the Baseline conditions, one with a non-yielding AV and one with a yielding AV, were conducted prior to the initiation of the main experiment. When the participant indicated that they had understood the procedure, the experimenter announced that the actual experiment was about to begin. At that point, the participant was asked to return to the blue marker, and the experimenter started the experiment.
Participants then completed 120 trials. After each block, a 3-min interview with the participant was conducted and recorded. The interview typically began by asking the participant whether they were comfortable. If the participant mentioned any form of discomfort, then the MISC scale was administered. Next, they were asked “what did you think of this particular interface/situation?”, and the participant was prompted to elaborate further on their answers. The line of questioning about the interface continued by asking the participant about preference between the red and green states, and whether their crossing decisions were based on the interface. Participants were corrected if they began commenting about the VR environment rather than the interfaces themselves.
Following all the trials, the participant was invited back to the table where they had signed the consent form. There they were presented with a sheet containing a table with screenshots of all nine interfaces in both their yielding and non-yielding states side by side. The participant was asked to assign a rank from 1 to 9 next to each interface according to their preference, with 1 being the most preferred and 9 being the least preferred. Each number could be assigned only once. When the participant had finished with the ranking, they were thanked and rewarded for their time.
The vehicle’s position and speed were logged during the experiment at a frequency of 120 Hz, generating a total of 3,600 log files from 30 participants each undergoing 120 trials. For the gaze data analysis (logged at 50 Hz) and head-tracking data (logged at 120 Hz), the VR environment was segmented into a number of areas of interest (AOIs):
• Road1, Road2, Road3: We used Road1 (near distance), Road2 (medium distance), and Road3 (far distance) segments (see Figure 6) to explore the distribution of the participants’ attention as the AV approaches. Given that the AV approached from the right in all trials, no AOIs to the left were created.
• Road: the rest of the road.
• Car: main body of the vehicle (Figure 6, inset).
• Circle: the region encompassed by the attention-attractor circle.
• AR interface: the region where the AR interface is projected.
• HUD region: the region where the HUD interfaces (8 and 9) would be projected. The HUD region follows the participant’s head rotation and is always in front of the participant, 2.5 m ahead and 0.25 m above the participant’s head.
• Traffic light region: the region where the Fixed Traffic Lights would be projected, i.e., a static region in front of the pedestrian.
• Windscreen region: the windscreen region on the vehicle (Figure 6, inset).
• Other: any other non-segmented area in the CAVE, or outside of it.
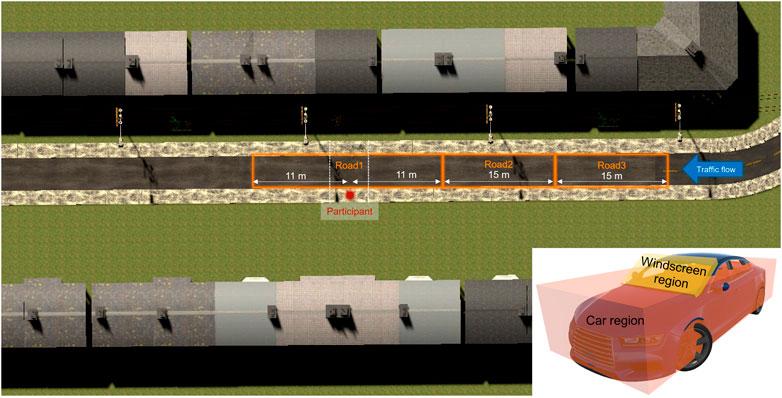
Figure 6. Top-down view of the environment. The road was segmented into three different regions for logging purposes. Inset: Two collider regions labelled as “Car” and “Windscreen region” were superimposed over the car 3D model in the environment. The labels were logged when the eye-tracking vector intersected with the colliders.
These regions were active for all tested conditions, except the AR Concept region for the Baseline condition. Therefore, some segmented regions were prioritised over others when a gaze vector intersected in a region where multiple segmented layers may have been overlaid on one another. Priorities were as follows: The AR Concept region took precedence over all other regions, followed by the Car, Windscreen region, Traffic light region, HUD region, Road1, Road2, Road 3, Circle, Road, and Other, in the order listed.
The post-block interviews were analysed using an approach introduced by Tabone and De Winter (2023). Specifically, the 300 post-block voice recordings were transcribed using Whisper-v2 (Radford et al., 2023). Each transcript was then automatically submitted to OpenAI’s ChatGPT-4o API (version: 26 May 2024; model: gpt-4o-2024-05-13). The API’s temperature setting, which controls the level of the randomness of the output, was set to 0.
The following prompt was used to summarise the transcript per interface condition: “Based on the participants’ interview responses, summarise the strengths and weaknesses of the interface concisely. Do not overly mention general characteristics such as ‘the interface is intuitive’, but report specific aspects that could aid designers. Keep it short, specific, and interesting, with a maximum of 4 sentences in total. Start the strengths with “STRENGTHS:” and start the weaknesses with “WEAKNESSES:” Do not refer to individual participants.” The prompt included the 30 transcripts of the 30 individual participants.
The following dependent measures were calculated:
• First glance at the AR interface: This measure was calculated using the Tobii eye-tracker data. Ray tracing was applied to determine the first moment the gaze vector intersected with the AR interface. This measure was not available for the Baseline condition. For each AR interface and circle position, the mean was calculated across the four available trials.
• Participant crossing initiation time: The measure was computed for each trial in which the AV yielded. The crossing initiation time was calculated by subtracting the moment the participant’s position in the CAVE environment exceeded a set position threshold, corresponding to the edge of the road, from the moment at which the attention-attractor circle disappeared. For each interface condition and circle position, the mean was calculated across the three available yielding trials.
• Intuitiveness ratings: The self-reported intuitiveness rating was available for each trial.
• Interface ranking: The mean rank per participant per interface condition was calculated from the responses to the post-experiment ranking questionnaire. In addition, the distribution of the ranking was analysed from a produced matrix (see Supplementary Material).
• Sentiment score: The transcripts from the post-block interviews were analysed using VADER (Valence Aware Dictionary and sEntiment Reasoner) sentiment analysis (Hutto and Gilbert, 2014) to generate sentiment scores. The mean sentiment scores of the 10 conditions were linearly scaled and shifted so that their mean was 0 and their standard deviation was 1.
In addition to calculating the above dependent measures, we plotted a number of graphs to better understand how participants used the AR interfaces. In order to visualise where the participants looked at during the trials, all timings were centred and normalised around the moment that the attention-attractor circle disappeared. Hence, all time values were rounded to the nearest multiple of the sampling rate (120 Hz). Then, for each 0.01-s timestamp between −9.0 and 9.0 s, the number of times each gaze region was viewed (eye-tracking) was recorded. These gaze counts over time were converted to percentages and plotted for vehicle-locked interfaces and HUDs, and left and right circle positions. The produced plots would provide a visualisation of where participants distributed their gaze across AOIs in the CAVE.
In order to judge the similarity of the simulator results with the results from the online questionnaire study, the Pearson product-moment correlations of means for the interface conditions were calculated. Moreover, to understand the effect of the attention-attractor circle on the dependent variables, a two-way repeated measures ANOVA of crossing initiation times and of the time of the first glance towards the AR interface was conducted, with the AR interface and circle position as within-subject factors. Additionally, 95% confidence intervals for each interface condition were generated using a method presented by Morey (2008), where the within-subject factor pertained to the three attention-attractor circle positions. Pairwise comparisons between the three circle positions were conducted using paired t-tests. To account for multiple comparisons, a Bonferroni correction was applied, resulting in an adjusted alpha value of 0.05/3 (given that there were three pairs for comparison).
All 3,600 trials were completed successfully. There were only three instances where blocks had to be restarted because of technical disruptions (e.g., the eye-tracker switched off). However, in each case, the previous intuitiveness scores were retained, and any missing log data re-recorded. Hence, there were no missing data by the end of the experiment.
For non-yielding AVs, according to a repeated-measures ANOVA of the intuitiveness score, with interface condition and circle position as within-subject factors, there was a significant effect of interface condition, F (9, 261) = 6.46, p < 0.001, partial η2 = 0.18, a significant effect of attention-attractor circle position, F (2, 58) = 4.77, p = 0.012, partial η2 = 0.14, and no significant interface condition × circle position interaction, F (18, 522) = 1.39, p = 0.129, partial η2 = 0.05.
For yielding AVs, according to a repeated-measures ANOVA of the intuitiveness score, with interface condition and attention-attractor circle position as within-subject factors, there was a significant effect of interface condition, F (9, 261) = 8.87, p < 0.001, partial η2 = 0.23, a significant effect of circle position, F (2, 58) = 5.65, p = 0.006, partial η2 = 0.16, and a significant interface condition × circle position interaction, F (18, 522) = 3.11, p < 0.001, partial η2 = 0.10.
Figures 7, 8 show scatter plots reporting the mean intuitiveness scores of each interface for both the CAVE simulator experiment and the online questionnaire study (Tabone et al., 2023). Since the online study did not have a baseline condition, the intuitiveness score for the baseline condition (yielding AV: 4.80 [SD = 1.37], non-yielding AV: 5.48 [SD = 1.53]) was omitted from the plots.
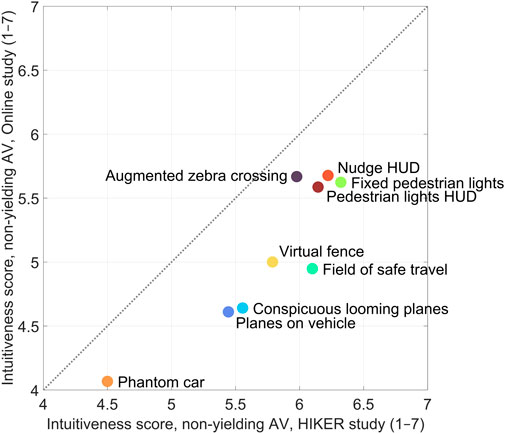
Figure 7. Scatter plot of the mean intuitiveness rating per AR interface in their non-yielding state, as reported in the current HIKER experiment and the previous online questionnaire study (Tabone et al., 2023). The diagonal dotted line represents a line of equal values.
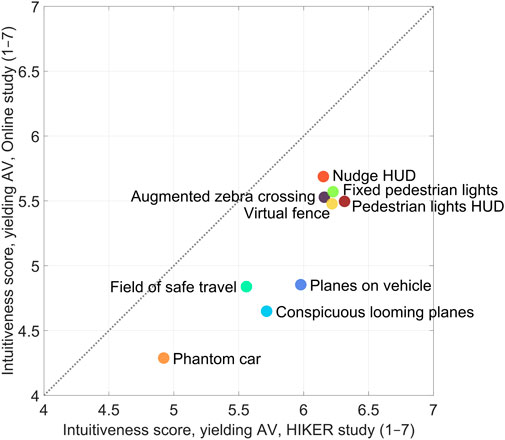
Figure 8. Scatter plot of the mean intuitiveness rating per AR interface in their yielding state, as reported in the current HIKER experiment and the previous online questionnaire study (Tabone et al., 2023). The diagonal dotted line represents a line of equal values.
Table 2 shows the correlation matrix for measures relating to the online questionnaire study and the simulator experiment conducted in the HIKER. The mean intuitiveness score from the HIKER experiment correlated strongly with the mean intuitiveness score from the online study (r = 0.91 for yielding AV, and r = 0.90 for non-yielding AV, respectively, n = 9 AR interfaces). Similar to the online questionnaire study, the Nudge HUD, Fixed pedestrian lights, Augmented zebra crossing, Pedestrian lights HUD, and Virtual fence interfaces scored the highest, while the Phantom car yielded the lowest intuitiveness rating.
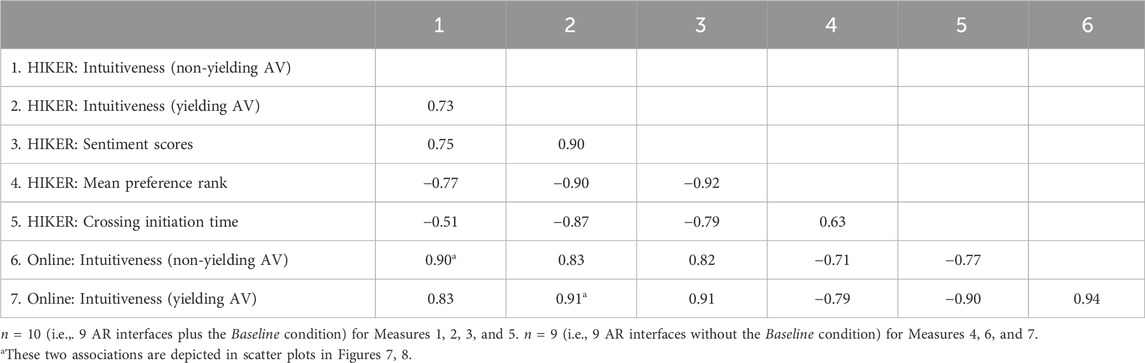
Table 2. Correlation matrix for measures relating to the online questionnaire study (Tabone et al., 2023) and the simulator study conducted in the HIKER.
According to a repeated-measures ANOVA of the crossing initiation time, with interface condition and circle position as within-subject factors, there was a significant effect of interface condition, F (9, 252) = 17.97, p < 0.001, partial η2 = 0.39, a significant effect of circle position, F (2, 56) = 56.09, p < 0.001, partial η2 = 0.67, and a significant interface condition × circle position interaction, F (18, 504) = 8.01, p < 0.001, partial η2 = 0.22. Note that out of a total of 2,700 trials (10 interface conditions × 3 yielding trials × 3 repetitions x 30 participants), participants did not initiate crossing in 53 instances. Out of 900 data points (10 interface conditions × 3 circle positions x 30 participants) that underlie the ANOVA, 7 data points were unavailable because participants did not initiate crossing.
Figure 9 shows the means and 95% confidence intervals of the crossing initiation times for all interface conditions. Among the infrastructure-locked interfaces, the Fixed pedestrian lights (which were always positioned on the opposite side of the street) demonstrated optimal performance when the attention-attractor circle was also presented centrally. Regarding the Augmented zebra crossing, the central and right circle presentation positions exhibited faster crossing initiation times as opposed to the left presentation, while the Virtual fence performance remained relatively consistent irrespective of the circle presentation position.
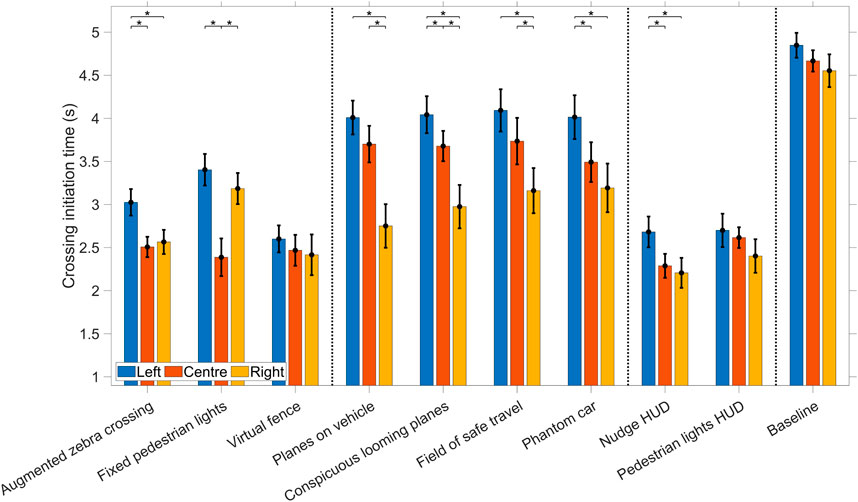
Figure 9. Means and 95% confidence intervals of the mean crossing initiation time as affected by the attention-attractor position for each interface condition. Vertical lines delineate the infrastructure-locked interfaces, vehicle-locked interfaces, HUDs, and the Baseline condition. * indicates p < 0.05/3.
Concerning the vehicle-locked interfaces, a consistent trend emerged, where superior performance was observed when the circle was presented on the right—the direction from which the AV approached.
Lastly, with respect to the HUDs and Baseline condition, a discernible pattern emerged, where the left circle presentation was less advantageous compared to central or right presentations. However, this effect was not statistically significant for the Baseline condition and Pedestrian lights HUD and was considerably smaller in magnitude than the vehicle-locked interfaces.
According to a repeated-measures ANOVA of the time of the first glance at the AR interface, with interface condition, and circle position as within-subject factors, showed a significant effect of interface condition, F (8, 200) = 21.05, p < 0.001, partial η2 = 0.46, a significant effect of circle position, F (2, 50) = 36.05, p < 0.001, partial η2 = 0.59, and a significant interface condition × circle position interaction, F (16, 400) = 15.17, p < 0.001, partial η2 = 0.38. Note that out of a total of 3,240 trials (9 AR interfaces × 4 trials × 3 repetitions x 30 participants), participants did not glance at the AR interface in 217 instances. Out of 810 data points (9 AR interfaces × 3 circle positions x 30 participants) that underlie the ANOVA, 8 data points were unavailable because participants did not look at the AR interface. Missing data may potentially be attributed to inaccuracies in the eye-tracker, or to a genuine lack of attention directed towards the AR interface by the participants.
The results presented in Figure 10 generally correspond to the crossing initiation times shown in Figure 9. Specifically, when the attention-attractor circle was centrally positioned, the Fixed pedestrian lights were quickly glanced at, whereas the vehicle-locked interfaces drew attention more quickly when the circle was displayed on the right as opposed to the centre or left. Regardless of the circle position, the HUDs were promptly noticed. Furthermore, the Virtual fence quickly captured attention, which can likely be attributed to its substantial size.
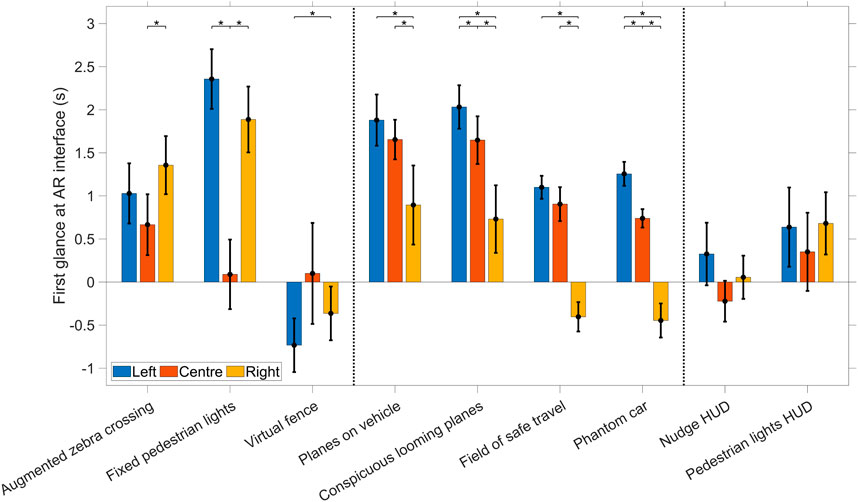
Figure 10. Means and 95% confidence intervals of the moment in which the participants first glanced at the AR interface as affected by the attention-attractor position for each AR interface. Vertical lines delineate the infrastructure-locked interfaces, vehicle-locked interfaces, and HUDs. A negative value indicates that participants, on average, first glanced at the AR interface before the attention-attractor circle had disappeared. This may be due to the large size of the AR interface (Virtual fence) and/or the AR interface being within the circle on the right. * indicates p < 0.05/3.
Figure 11 shows a sample of four gaze plots, pertaining to the yielding states of vehicle-locked interfaces (top panels) and HUDs (bottom panels), and for the attention-attractor circle presented on the left (left panels) or right (right panels). In each case, the area plot depicts the gaze distribution across time for the different AOIs. The two interface categories were chosen as they clearly demonstrate the effect of interface placement on the participants’ attention distribution.
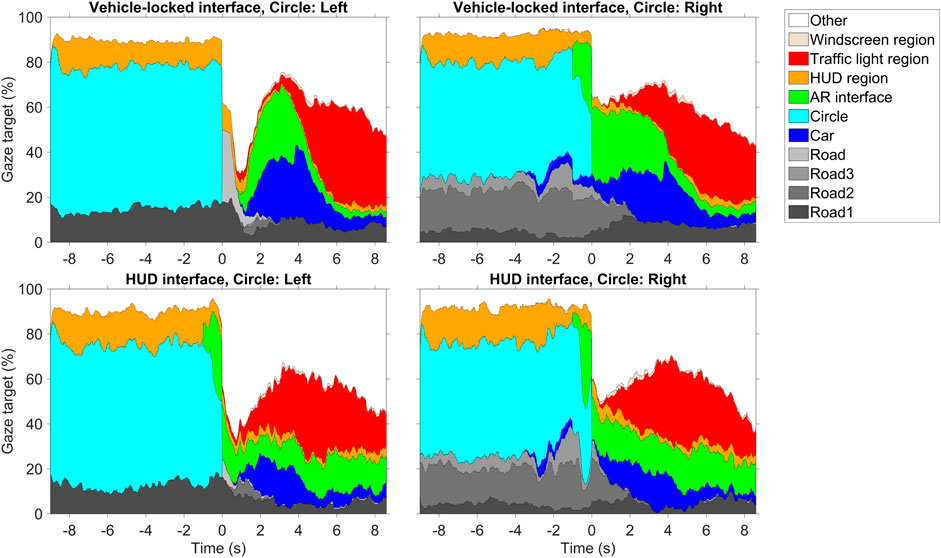
Figure 11. Plots of the gaze percentage for each area of interest (AOI) region in the environment. A distinction is made between vehicle-locked interfaces (Planes on vehicle, Conspicuous looming planes, Field of safe travel, and Phantom car combined) and HUDs (Nudge HUD and Pedestrian lights HUD combined), and between the attention-attractor circle presented on the left and right. Time = 0 s corresponds to the moment that the attention-attractor circle disappeared.
For the vehicle-locked interfaces, when the circle was presented on the right, the participants were able to direct their gaze to the presented AR interface (green area in right top of Figure 11) much earlier after time 0.0 s compared to when the circle was presented on the left (green area in left top of Figure 11). In that case, there was a delay of over 1 s. However, in the case of the HUDs, the AR interface was gazed at before 0.0 s, also when the circle was presented on the left (green area in left bottom of Figure 11). This results confirms the advantage of the HUDs in the presence of distraction from the approaching vehicle.
Table 3 presents the outputs of the prompts from the ChatGPT-4o analysis, where the model was asked to output the strengths and weaknesses of each interface based on 30 transcripts.
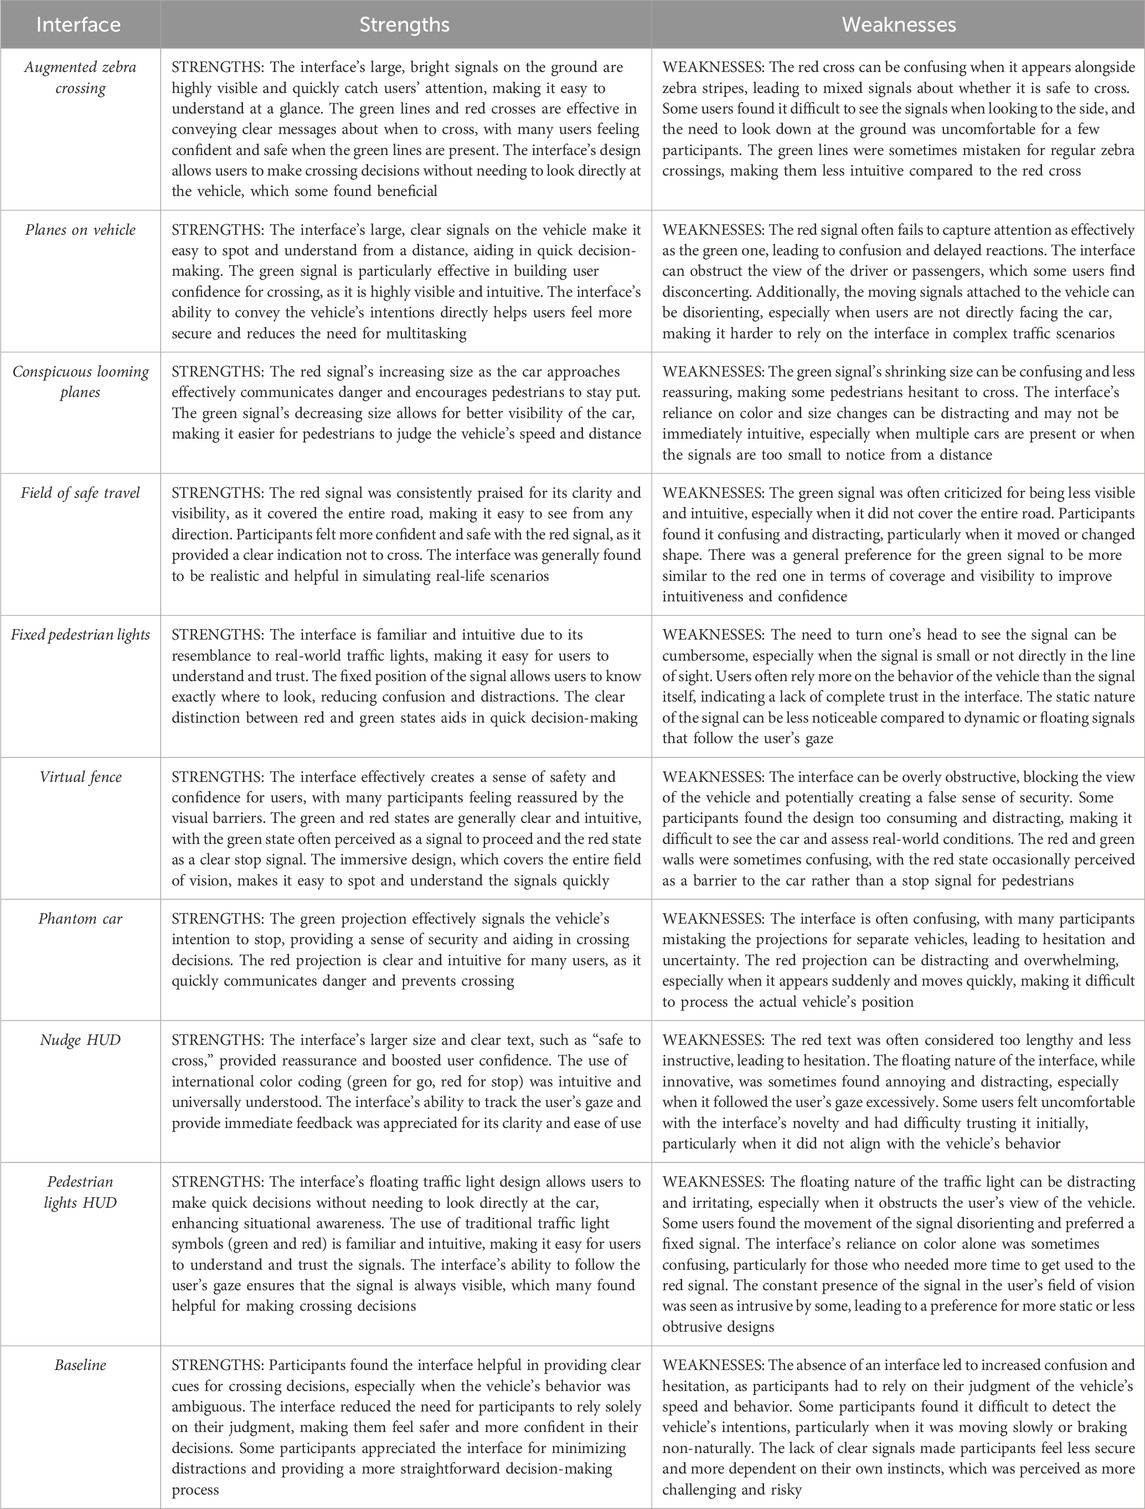
Table 3. Interview summaries provided by ChatGPT-4o. In the summaries for the Baseline condition, an ‘interface’ is still alluded to. The reason is that the ChatGPT prompt only mentioned ‘interfaces’.
The overall summaries offered a fingerprint of what the participants said after each block. In general, interfaces locked to the infrastructure (Augmented zebra crossing, Fixed pedestrian lights, and Virtual fence) were found to elicit confidence due to the participants’ familiarity with common traffic designs. Moreover, the Virtual fence’s walls elicited a sense of safety. On the other hand, the participants pointed out that such interfaces may cause users to focus too much on the design rather than the surroundings, as the view behind the tunnel walls somewhat obscures the environment, despite being semi-translucent. Such familiar designs may also make the user overly reliant on the interface, or cause a false sense of security.
Interfaces locked to the vehicle (Planes on vehicle, Conspicuous looming planes, Field of safe travel, and Phantom car) were generally described as clear. Specifically, the looming effect in Conspicuous looming planes was noted for effectively communicating danger and encouraging pedestrians to stay put. However, vehicle-locked interfaces were also described as confusing and distracting, particularly when moving and changing shape (such as the scaling in Conspicuous looming planes), as well as disorienting if the user is not directly facing the approaching vehicle. In general, participants felt that this group of interfaces had a steep learning curve.
The HUD interfaces (Nudge HUD, Pedestrian lights HUD) were described as providing immediate feedback since the interface follows the user’s head orientation. Moreover, the large size and clear text boosted user confidence. On the other hand, the HUDs were sometimes considered confusing, uncomfortable, and distracting, requiring a period of adjustment. Moreover, participants commented on the lack of customisation options for the HUD interfaces.
In the Baseline condition, participants stated that the AV without an interface was appreciated by some participants for providing a more straight forward decision-making process. However, the participants also pointed out that the absence of an interface led to increased confusion and hesitation, as participants had to rely on their judgment of the vehicle’s speed and behaviour, or that the interface may not provide enough information or guidance in particular situations, which could ultimately cause confusion or hesitation.
Thirty participants completed 120 trials each in a CAVE pedestrian simulator experiment that assessed nine AR interfaces for pedestrian-vehicle interaction and a baseline condition without any interface. The participants were asked to cross the road if they felt it was safe to do so, and to rate how intuitive the interfaces were in communicating their message of intent. In addition to the standard head-tracker used in the CAVE, participants were equipped with an eye-tracker, which recorded their point of gaze during the experiment. Furthermore, participants were asked about each interface in an audio-recorded interview following exposure. The data were analysed to assess the intuitiveness of each interface, the road crossing initiation times, the gaze direction of participants, and the information provided during the interviews.
The first objective of the experiment was to evaluate the effect of nine AR interfaces on pedestrian crossing behaviour and perceived intuitiveness, with the expectation of replicating the intuitiveness ratings observed in a previous online questionnaire (Tabone et al., 2023). The second objective was to examine the effect of the position of the attention attractor on pedestrian crossing initiation times across the different AR interfaces. An AR interface/attention-position interaction was hypothesised, where head-locked, infrastructure-locked, and vehicle-locked interfaces would cause different crossing initiation times depending on the position of the attention-attractor circle.
The present study was conducted in a highly immersive CAVE simulator, in which the participant (pedestrian) was surrounded by images displayed on the floor and walls (Cruz-Neira et al., 1992), which were dependent on the head position of the user. The CAVE allowed participants to see their own body (in contrast to online studies, or when using a HMD), allowing for a more natural interaction with the environment (Blissing and Bruzelius, 2018). In our experiment, none of the 30 participants suffered any discomfort related to motion sickness despite having gone through 120 trials each. Hence, when compared to HMDs or video-based study, a CAVE offers a more natural setting (Schneider et al., 2022).
The AR interfaces achieved similar relative differences in mean intuitiveness scores as in the online questionnaire study. A correlation of 0.91 was observed between the two measures for yielding AVs, and 0.90 for non-yielding AVs, indicating that the intuitiveness scores highly replicated the online study. As in the online study, the interfaces that used traditional traffic elements (Augmented zebra crossing and Fixed pedestrian lights), other interfaces locked to the infrastructure (Virtual fence), and the HUDs (Nudge HUD and Pedestrian lights HUD) were rated highly, while interfaces locked to the vehicle were deemed less intuitive (Field of safe travel, Planes on vehicle, Conspicuous looming planes, and Phantom car). The behavioural measure, i.e., crossing initiation time, also exhibited a substantial correlation with the online intuitiveness ratings (r = −0.90).
The Field of safe travel and the Phantom car were designed to adhere to the principle of ecological interface design (Tabone et al., 2021a) and the principle of predictive aiding, respectively. However, similar to the online study, in the simulator study, the Phantom car may have failed to comply with the proximity compatibility principle, as participants found it difficult to separate the Phantom car from the ‘real’ car (see Table 3). Moreover, both interfaces only displayed a coloured element without icon or text, and may have therefore failed to comply with the principle of redundancy gain. Given that both interfaces lacked the incorporation of traditional elements from traffic, the application of the top-down processing principle, which relies on the recognition of familiar symbols, may have posed another challenge for participants. Conversely, the interfaces that achieved the highest intuitiveness scores demonstrated adherence to these principles (Tabone et al., 2021b).
The strong correlation between the outcomes of the online study and those of the CAVE simulator raises questions about the need of conducting experiments in a resource-intensive CAVE. We contend that if the objective is solely to gather subjective evaluations, such as average intuitiveness ratings or preference rankings, an online questionnaire could not only be sufficient but even preferable, considering the potential for larger sample sizes (Schneider et al., 2022). However, an immersive simulator environment, such as the one currently used, is necessary when one wants to study eye movements and (crossing) behaviour.
It is acknowledged that certain discrepancies emerged between the online study and the current CAVE-based study. The HUD interfaces, which tracked participants’ head motion, were experienced in real-time, whereas these motions were preprogrammed in the online study. The current study allowed participants to offer feedback on the functioning of the HUDs, which they occasionally described as jittery, annoying, or confusing. Moreover, the Virtual fence might create a false sense of security and obstruct the view of oncoming vehicles, which are features that could not be observed in the prior online study. Similarly, in the preference rankings, the Virtual fence received a high number of first-place rankings, which could be attributed to its visually appealing animation of opening doors and its large size.
A main reason the study was conducted in the HIKER was due to its high FOV compared to an online experiment, allowing for the guidance of the participant’s initial attention allocation. An attention-attractor circle was used to guide the participant’s attention towards a specific region of the road environment before the arrival of the vehicle, similar to real-world situations where pedestrians may initially neglect to observe the approaching vehicle due to finite attentional resources (Wickens et al., 2004; Ralph and Girardeau, 2020).
The position of the attention-attractor circle was found to have an effect on the crossing initiation time of the participants. As shown in Figure 9, there was a substantial delay in crossing initiation when participants were presented with an interface locked to the vehicle, which always approached from the right, when the circle was presented to the left.
Interfaces locked to the infrastructure, in particular the Fixed pedestrian lights, resulted in a relatively fast crossing initiation time when the attention-attractor circle was presented in the centre position. On the other hand, the Augmented zebra crossing was found to be less effective when users were not looking straight ahead. The HUDs yielded crossing initiation times that were similar for each of the three attention-attractor positions. This could be explained by the fact that it remained in the central FOV of the participant, regardless of the participant’s head orientation. However, the HUDs received some criticism for being annoying.
The Virtual fence was also unaffected by the attention-attractor position. Two possible explanations can account for this observed phenomenon. Firstly, the Virtual fence was large and visually conspicuous, thereby increasing the likelihood that participants covertly perceive its presence and colour through peripheral vision, even if they do not directly glance at it. The size of the Virtual fence was also mentioned by participants in the interviews. Secondly, the substantial size of the virtual fence made it more probable that participants could rapidly direct their foveal vision towards it. This assertion is supported by the findings illustrated in Figure 10 (time of first glance) and Figure 9 (crossing initiation times), which demonstrated that the Virtual fence performed well in these regards. In contrast, other AR interfaces were smaller, such as the Fixed pedestrian lights, or moving within the scene, such as the vehicle-locked interfaces, rendering them more challenging to detect with peripheral vision (i.e., before turning the eyes) and foveal vision (i.e., by moving the eyes).
The inferior performance of the interfaces locked to the vehicle may have implications for eHMI design, taking into account that proposed eHMIs have mostly been placed on the vehicle itself. On the other hand, the performance of the HUDs, being less affected by user distraction, makes them ideal candidates for use in such traffic interactions, because in everyday situations, the pedestrian cannot be expected to look at an approaching vehicle right away. More so, they are also the easiest to implement in terms of sensor requirements, since the HUDs would need minimal context from the environment (i.e., only AV intent), unlike some other interfaces, such as the Planes on vehicle, which in reality would need to make use of computer vision methods to detect the vehicle (Tabone et al., 2021b). At the same time, it may be important to consider the potential risk of overreliance. A more detailed exploration of the eye-tracking data revealed that in the Baseline condition, participants neglected to glance at the AV in merely 10 out of 360 trials. In contrast, for the Augmented zebra crossing, Fixed pedestrian lights, Nudge HUD, and Pedestrian lights HUD, the respective numbers were 76, 71, 71, and 72 out of 360. This observation indicates that the AR interfaces could potentially cause crossing without proper looking (for a similar concern in eHMI research, see Kaleefathullah et al., 2022).
An intriguing observation emerged regarding the crossing initiation times for the Baseline condition, which appeared to be only slightly affected by the position of the attention attractor. A plausible explanation for this phenomenon is that, although the attention attractor positioned on the left and centre caused a delayed response in glancing at the approaching AV (just as it did for the nine AR interface conditions), this temporal delay is not detrimental. In the Baseline condition, no valuable information would be missed, as it is challenging to discern whether a car has initiated braking from implicit communication (i.e., vehicle speed) alone. The AR interfaces, on the other hand, were activated 0.8 s before the AV started to slow down. Therefore, a pedestrian would miss valuable explicit communication if they do not glance promptly at the AR interface (and see De Winter and Dodou, 2022, for a discussion on eHMIs that provide anticipatory information).
Despite the improved ecological validity when compared to the online questionnaire study in Tabone et al. (2023), there are still some limitations to the study presented in this paper. Firstly, the CAVE and the equipment itself were sources of distraction as there were points during the interviews where the participant was commenting about the VR environment rather than the interfaces themselves.
Other limitations arose from equipment issues. The eye-tracker had a limited battery life, and there were instances when the battery needed to be replaced between blocks. Moreover, on average, 4 or 5 participants were accommodated in a single experiment day, resulting in a cumulative running time of over 9–10 h. This extended duration occasionally led to equipment overheating. Also, the Field of Safe Travel and Phantom Car interfaces experienced some rubberbanding issues, which occasionally manifested as jittery imagery. This phenomenon may have impacted the reported intuitiveness ratings to a certain degree. In fact, some post-block interviews for the Phantom Car reported instances of abnormal behaviour, including “one of the green cars reversed” and “on a couple of occasions with the green, the car went past the hologram”. These issues were due to occasional synchronisation problems across screens and computers, as well as limitations of the Unity networking system. Regardless of these issues, a high correlation between the simulator and online questionnaire results was observed.
Additionally, the limited screen area of the CAVE meant that some of the interfaces had to be scaled down to fit. The sizes of both HUD interfaces were reduced from their original dimension during piloting as they became too large to fit on the CAVE screens as the participant approached the wall across (end of the virtual road). In the post-experiment subjective ranking results, there were some comments about the HUD interfaces being “too small”. Such an unintended effect was therefore caused by technical limitations of a CAVE simulator.
The AR interfaces were still projected on a virtual environment, which ultimately rendered them as part of the VR simulation. Implementing AR in the real world presents certain challenges, such as anchoring objects in the world or onto moving cars (e.g., Tabone et al., 2021b; Aleva et al., 2024) and the risk of inattentional blindness (Kim and Gabbard, 2022; Wang et al., 2022; Chen et al., 2023). Because AR provides salient information, or information that, although part of the real world, does not always seamlessly blend with the actual world, AR cues might attract attention while other safety-relevant elements of the environment are missed. Furthermore, despite the CAVE simulation being immersive, it still did not offer real risk, and participants were asked to cross repeatedly, and deliberately distract themselves by looking into circles, without any real purpose other than to complete the experiment. Hence, to better understand the trust and behaviour of participants with these AR interfaces, the ecological validity must once again be increased and the AR interfaces be tested overlaid over the real world.
A pedestrian simulator experiment was conducted to investigate the interaction between pedestrians and automated vehicles using nine different augmented reality interfaces presented within a virtual reality CAVE. The aim of the experiment was twofold: (1) to investigate whether results from an online questionnaire video-based study could be replicated in a CAVE simulator, and (2) to investigate whether the effectiveness of different AR designs is contingent upon the pedestrian’s attention allocation. The statistical and qualitative findings indicate that the mean intuitiveness ratings correlated substantially with results from a prior online study (r ≈ 0.90). Interfaces using traditional traffic design elements, as well as head-locked HUDs, were rated as more intuitive, in contrast to vehicle-locked interfaces.
The position of the attention-attractor circle affected crossing initiation time, with participants initiating crossing earlier for infrastructure-locked and HUD interfaces in general, in contrast to interfaces that were locked to the vehicle. For the Virtual fence and the HUDs, crossing initiation times were relatively unaffected by the attention-attractor position. These findings are likely due to the size of the Virtual fence and the omnipresence of the HUD interfaces in the participant’s FOV.
The poor performance of vehicle-locked AR interfaces may have implications for eHMIs, which are typically mounted on the vehicle. Lastly, the experiment outcomes also highlight the fact that a CAVE simulator might not be necessary if the goal is to investigate intuitiveness ratings, given the high correlation with the online study. However, the immersive nature of the CAVE proved essential for studying the distributed attention of the participants.
The original contributions presented in the study are publicly available. This data can be found here: https://doi.org/10.4121/36b088db-cc3d-45c8-9b9e-8cbc614b74aa.
The studies involving humans were approved by the University of Leeds Research Ethics Committee. The studies were conducted in accordance with the local legislation and institutional requirements. The participants provided their written informed consent to participate in this study.
WT: Writing–original draft, Conceptualization, Data curation, Formal Analysis, Investigation, Methodology, Project administration, Software, Visualization, Writing–review and editing. RH: Writing–review and editing, Conceptualization, Methodology, Supervision. YY: Writing–review and editing, Investigation. ES: Writing–review and editing, Software. JG: Writing–review and editing, Resources, Software. YL: Writing–review and editing, Conceptualization, Methodology. NM: Writing–review and editing, Conceptualization, Methodology, Project administration. JW: Writing–original draft, Writing–review and editing, Conceptualization, Formal Analysis, Investigation, Methodology, Supervision, Validation.
The author(s) declare that financial support was received for the research, authorship, and/or publication of this article. This project has received funding from the European Union’s Horizon 2020 research and innovation programme under the Marie Skłodowska-Curie grant agreement No. 860410.
The authors declare that the research was conducted in the absence of any commercial or financial relationships that could be construed as a potential conflict of interest.
All claims expressed in this article are solely those of the authors and do not necessarily represent those of their affiliated organizations, or those of the publisher, the editors and the reviewers. Any product that may be evaluated in this article, or claim that may be made by its manufacturer, is not guaranteed or endorsed by the publisher.
The Supplementary Material for this article can be found online at: https://www.frontiersin.org/articles/10.3389/frvir.2024.1353941/full#supplementary-material
Alam, F., Mehmood, R., Katib, I., Albogami, N. N., and Albeshri, A. (2017). Data fusion and IoT for smart ubiquitous environments: a survey. IEEE Access 5, 9533–9554. doi:10.1109/ACCESS.2017.2697839
Aleva, T., Tabone, W., Dodou, D., and De Winter, J. C. F. (2024). Augmented reality for supporting the interaction between pedestrians and automated vehicles: an experimental outdoor study. Front. Robotics AI 11, 1324060. doi:10.3389/frobt.2024.1324060
Arena, F., Collotta, M., Pau, G., and Termine, F. (2022). An overview of augmented reality. Computers 11, 28. doi:10.3390/computers11020028
Banks, V. A., Stanton, N. A., Burnett, G., and Hermawati, S. (2018). Distributed cognition on the road: using EAST to explore future road transportation systems. Appl. Ergon. 68, 258–266. doi:10.1016/j.apergo.2017.11.013
Bazilinskyy, P., Dodou, D., and De Winter, J. C. F. (2019). Survey on eHMI concepts: the effect of text, color, and perspective. Transp. Res. Part F Traffic Psychol. Behav. 67, 175–194. doi:10.1016/j.trf.2019.10.013
Bazilinskyy, P., Dodou, D., and De Winter, J. C. F. (2020). “External Human-Machine Interfaces: which of 729 colors is best for signaling ‘Please (do not) cross’,” in Proceedings of the IEEE International Conference on Systems, Man and Cybernetics, Toronto, Canada (IEEE), 3721–3728.
Blissing, B., and Bruzelius, F. (2018). “Exploring the suitability of virtual reality for driving simulation,” in Proceedings of the Driving Simulation Conference 2018, Antibes, France, 163–166.
Calvi, A., D’Amico, F., Ferrante, C., and Bianchini Ciampoli, L. (2020). Effectiveness of augmented reality warnings on driving behaviour whilst approaching pedestrian crossings: a driving simulator study. Accid. Analysis Prev. 147, 105760. doi:10.1016/j.aap.2020.105760
Cao, D., Wang, X., Li, L., Lv, C., Na, X., Xing, Y., et al. (2022). Future directions of intelligent vehicles: potentials, possibilities, and perspectives. IEEE Trans. Intelligent Veh. 7, 7–10. doi:10.1109/TIV.2022.3157049
Carmigniani, J., Furht, B., Anisetti, M., Ceravolo, P., Damiani, E., and Ivkovic, M. (2011). Augmented reality technologies, systems and applications. Multimedia Tools Appl. 51, 341–377. doi:10.1007/s11042-010-0660-6
Chen, W., Song, J., Wang, Y., Wu, C., Ma, S., Wang, D., et al. (2023). Inattentional blindness to unexpected hazard in augmented reality head-up display assisted driving: the impact of the relative position between stimulus and augmented graph. Traffic Inj. Prev. 24, 344–351. doi:10.1080/15389588.2023.2186735
Colley, M., Eder, B., Rixen, J. O., and Rukzio, E. (2021). “Effects of semantic segmentation visualization on trust, situation awareness, and cognitive load in highly automated vehicles,” in Proceedings of the 2021 CHI Conference on Human Factors in Computing Systems, Yokohama, Japan.
Cordeil, M., Cunningham, A., Dwyer, T., Thomas, B. H., and Marriott, K. (2017). “ImAxes: Immersive Axes as embodied affordances for interactive multivariate data visualisation,” in Proceedings of the 30th Annual ACM Symposium on User Interface Software and Technology, Québec City, Canada, 71–83.
Cruz-Neira, C., Sandin, D. J., DeFanti, T. A., Kenyon, R. V., and Hart, J. C. (1992). The CAVE: audio visual experience automatic virtual environment. Commun. ACM 35, 64–72. doi:10.1145/129888.129892
Currano, R., Park, S. Y., Moore, D. J., Lyons, K., and Sirkin, D. (2021). “Little road driving hud: heads-up display complexity influences drivers’ perceptions of automated vehicles,” in Proceedings of the 2021 CHI Conference on Human Factors in Computing Systems, Yokohama, Japan.
Dancu, A., Vechev, V., Ünlüer, A. A., Nilson, S., Nygren, O., Eliasson, S., et al. (2015). “Gesture bike: examining projection surfaces and turn signal systems for urban cycling,” in Proceedings of the 2015 International Conference on Interactive Tabletops and Surfaces, Madeira, Portugal, 151–159.
De Clercq, K., Dietrich, A., Núñez Velasco, J. P., De Winter, J., and Happee, R. (2019). External human-machine interfaces on automated vehicles: effects on pedestrian crossing decisions. Hum. Factors 61, 1353–1370. doi:10.1177/0018720819836343
De Winter, J., and Dodou, D. (2022). External human-machine interfaces: gimmick or necessity. Transp. Res. Interdiscip. Perspect. 15, 100643. doi:10.1016/j.trip.2022.100643
Dey, D., Habibovic, A., Löcken, A., Wintersberger, P., Pfleging, B., Riener, A., et al. (2020). Taming the eHMI jungle: a classification taxonomy to guide, compare, and assess the design principles of automated vehicles’ external human-machine interfaces. Transp. Res. Interdiscip. Perspect. 7, 100174. doi:10.1016/j.trip.2020.100174
Dong, W., Wu, Y., Qin, T., Bian, X., Zhao, Y., He, Y., et al. (2021). What is the difference between augmented reality and 2D navigation electronic maps in pedestrian wayfinding? Cartogr. Geogr. Inf. Sci. 48, 225–240. doi:10.1080/15230406.2021.1871646
Ginters, E. (2019). Augmented reality use for cycling quality improvement. Procedia Comput. Sci. 149, 167–176. doi:10.1016/j.procs.2019.01.120
Hesenius, M., Börsting, I., Meyer, O., and Gruhn, V. (2018). “Don’t panic! Guiding pedestrians in autonomous traffic with augmented reality,” in Proceedings of the 20th International Conference on Human-Computer Interaction with Mobile Devices and Services Adjunct, Barcelona, Spain, 261–268.
Hutto, C., and Gilbert, E. (2014). VADER: a parsimonious rule-based model for sentiment analysis of social media text. Proc. Int. AAAI Conf. web Soc. media 8 (1), 216–225. doi:10.1609/icwsm.v8i1.14550
Kadar, E. E., and Shaw, R. E. (2000). Toward an ecological field theory of perceptual control of locomotion. Ecol. Psychol. 12, 141–180. doi:10.1207/S15326969ECO1202_02
Kalantari, A. H., Yang, Y., Lee, Y. M., Merat, N., and Markkula, G. (2023). Driver-pedestrian interactions at unsignalized crossings are not in line with the Nash equilibrium. IEEE Access 11, 110707–110723. doi:10.1109/ACCESS.2023.3322959
Kaleefathullah, A. A., Merat, N., Lee, Y. M., Eisma, Y. B., Madigan, R., Garcia, J., et al. (2022). External human–machine interfaces can be misleading: an examination of trust development and misuse in a CAVE-based pedestrian simulation environment. Hum. Factors 64, 1070–1085. doi:10.1177/0018720820970751
Kim, H., and Gabbard, J. L. (2022). Assessing distraction potential of augmented reality head-up displays for vehicle drivers. Hum. Factors 64, 852–865. doi:10.1177/0018720819844845
Kim, H., Gabbard, J. L., Anon, A. M., and Misu, T. (2018). Driver behavior and performance with augmented reality pedestrian collision warning: an outdoor user study. IEEE Trans. Vis. Comput. Graph. 24, 1515–1524. doi:10.1109/TVCG.2018.2793680
Lanzer, M., Koniakowsky, I., Colley, M., and Baumann, M. (2023). “Interaction effects of pedestrian behavior, smartphone distraction and external communication of automated vehicles on crossing and gaze behavior,” in Proceedings of the 2023 CHI Conference on Human Factors in Computing Systems, Hamburg, Germany.
Lee, J. D. (2008). Fifty years of driving safety research. Hum. Factors 50, 521–528. doi:10.1518/001872008x288376
Li, T., Guo, F., Krishnan, R., Sivakumar, A., and Polak, J. (2020). Right-of-way reallocation for mixed flow of autonomous vehicles and human driven vehicles. Transp. Res. Part C Emerg. Technol. 115, 102630. doi:10.1016/j.trc.2020.102630
Li, Y., Kamalasanan, V., Batista, M., and Sester, M. (2022). Improving pedestrian priority via grouping and virtual lanes. doi:10.48550/arXiv.2205.08783
Mallaro, S., Rahimian, P., O'Neal, E. E., Plumert, J. M., and Kearney, J. K. (2017). “A comparison of head-mounted displays vs. large-screen displays for an interactive pedestrian simulator,” in Proceedings of the 23rd ACM Symposium on Virtual Reality Software and Technology, Gothenburg, Sweden.
Matviienko, A., Müller, F., Schön, D., Seesemann, P., Günther, S., and Mühlhäuser, M. (2022). “BikeAR: understanding cyclists’ crossing decision-making at uncontrolled intersections using Augmented Reality,” in Proceedings of the CHI Conference on Human Factors in Computing Systems, New Orleans, LA.
Morey, R. D. (2008). Confidence intervals from normalized data: a correction to Cousineau (2005). Tutorials Quantitative Methods Psychol. 4, 61–64. doi:10.20982/tqmp.04.2.p061
Mukhopadhyay, A., Sharma, V. K., Tatyarao, P. G., Shah, A. K., Rao, A. M. C., Subin, P. R., et al. (2023). A comparison study between XR interfaces for driver assistance in take over request. Transp. Eng. 11, 100159. doi:10.1016/j.treng.2022.100159
Pichen, J., Yan, F., and Baumann, M. (2020). “Towards a cooperative driver-vehicle interface: enhancing drivers’ perception of cyclists through Augmented Reality,” in Proceedings of the 2020 IEEE Intelligent Vehicles Symposium, Las Vegas, NV, 1827–1832.
Pratticò, F. G., Lamberti, F., Cannavò, A., Morra, L., and Montuschi, P. (2021). Comparing state-of-the-art and emerging Augmented Reality interfaces for autonomous vehicle-to-pedestrian communication. IEEE Trans. Veh. Technol. 70, 1157–1168. doi:10.1109/TVT.2021.3054312
Qualtrics (2022). Qualtrics XM//the leading experience management software. Available at: https://www.qualtrics.com.
Radford, A., Kim, J. W., Xu, T., Brockman, G., McLeavey, C., and Sutskever, I. (2023). “Robust speech recognition via large-scale weak supervision,” in International Conference on Machine Learning (Honolulu, HI: PMLR), 28492–28518.
Ralph, K., and Girardeau, I. (2020). Distracted by “distracted pedestrians”. Transp. Res. Interdiscip. Perspect. 5, 100118. doi:10.1016/j.trip.2020.100118
Rasouli, A., and Tsotsos, J. K. (2020). Autonomous vehicles that interact with pedestrians: a survey of theory and practice. IEEE Trans. Intelligent Transp. Syst. 21, 900–918. doi:10.1109/TITS.2019.2901817
Rouchitsas, A., and Alm, H. (2019). External human–machine interfaces for autonomous vehicle-to-pedestrian communication: a review of empirical work. Front. Psychol. 10, 2757. doi:10.3389/fpsyg.2019.02757
Saffer, D. (2010). Designing for interaction: creating innovative applications and devices. Berkeley, CA: New Riders.
Schneider, S., Maruhn, P., Dang, N.-T., Pala, P., Cavallo, V., and Bengler, K. (2022). Pedestrian crossing decisions in virtual environments: behavioral validity in CAVEs and head-mounted displays. Hum. Factors 64, 1210–1226. doi:10.1177/0018720820987446
Sewalkar, P., and Seitz, J. (2019). Vehicle-to-pedestrian communication for vulnerable road users: survey, design considerations, and challenges. Sensors 19, 358. doi:10.3390/s19020358
Tabone, W., and De Winter, J. C. F. (2023). Using ChatGPT for human–computer interaction research: a primer. R. Soc. Open Sci. 10, 231053. doi:10.1098/rsos.231053
Tabone, W., De Winter, J. C. F., Ackermann, C., Bärgman, J., Baumann, M., Deb, S., et al. (2021a). Vulnerable road users and the coming wave of automated vehicles: expert perspectives. Transp. Res. Interdiscip. Perspect. 9, 100293. doi:10.1016/j.trip.2020.100293
Tabone, W., Happee, R., García, J., Lee, Y. M., Lupetti, L., Merat, N., et al. (2023). Augmented reality interfaces for pedestrian-vehicle interactions: an online study. Transp. Res. Part F Traffic Psychol. Behav. 94, 170–189. doi:10.1016/j.trf.2023.02.005
Tabone, W., Lee, Y. M., Merat, N., Happee, R., and De Winter, J. C. F. (2021b). “Towards future pedestrian-vehicle interactions: introducing theoretically-supported AR prototypes,” in Proceedings of the 13th International Conference on Automotive User Interfaces and Interactive Vehicular Applications, Leeds, UK, 209–218.
Toh, C. K., Sanguesa, J. A., Cano, J. C., and Martinez, F. J. (2020). Advances in smart roads for future smart cities. Proc. R. Soc. A Math. Phys. Eng. Sci. 476, 20190439. doi:10.1098/rspa.2019.0439
Tong, Y., and Jia, B. (2019). An Augmented-Reality-based warning interface for pedestrians: user interface design and evaluation. Proc. Hum. Factors Ergonomics Soc. Annu. Meet. 63, 1834–1838. doi:10.1177/1071181319631413
Tran, T. T. M., Parker, C., Hoggenmüller, M., Hespanhol, L., and Tomitsch, M. (2023). Simulating wearable urban augmented reality experiences in VR: lessons learnt from designing two future urban interfaces. Multimodal Technol. Interact. 7, 21. doi:10.3390/mti7020021
Tran, T. T. M., Parker, C., Wang, Y., and Tomitsch, M. (2022). Designing wearable augmented reality concepts to support scalability in autonomous vehicle–pedestrian interaction. Front. Comput. Sci. 4, 866516. doi:10.3389/fcomp.2022.866516
Unity (2022). Unity real-time development platform | 3D, 2D VR and AR engine. Available at: https://www.unity.com.
University of Leeds (2022). Highly immersive kinematic experimental research (HIKER) pedestrian lab. Available at: https://uolds.leeds.ac.uk/facility/hiker-lab.
Von Sawitzky, T., Wintersberger, P., Löcken, A., Frison, A.-K., and Riener, A. (2020). “Augmentation concepts with HUDs for cyclists to improve road safety in shared spaces,” in Extended Abstracts of the 2020 CHI Conference on Human Factors in Computing Systems, Honolulu, HI.
Wang, Y., Wu, Y., Chen, C., Wu, B., Ma, S., Wang, D., et al. (2022). Inattentional blindness in augmented reality head-up display-assisted driving. Int. J. Human–Computer Interact. 38, 837–850. doi:10.1080/10447318.2021.1970434
Weber, F., Chadowitz, R., Schmidt, K., Messerschmidt, J., and Fuest, T. (2019). “Crossing the street across the globe: a study on the effects of eHMI on pedestrians in the US, Germany and China,” in HCI in mobility, transport, and automotive systems. HCII 2019. Editor H. Krömker (Cham: Springer), 515–530. doi:10.1007/978-3-030-22666-4_37
Wickens, C. D., Gordon, S. E., and Liu, Y. (2004). An introduction to human factors engineering. Upper Saddle River, NJ: Pearson Prentice Hall.
World Health Organisation (2020). The top 10 causes of death. Available at: https://www.who.int/news-room/fact-sheets/detail/the-top-10-causes-of-death.
Keywords: augmented reality, pedestrian-vehicle interaction, automated vehicles, CAVE-based simulator, eye-tracking
Citation: Tabone W, Happee R, Yang Y, Sadraei E, García de Pedro J, Lee YM, Merat N and de Winter J (2024) Immersive insights: evaluating augmented reality interfaces for pedestrians in a CAVE-based experiment. Front. Virtual Real. 5:1353941. doi: 10.3389/frvir.2024.1353941
Received: 11 December 2023; Accepted: 24 June 2024;
Published: 26 July 2024.
Edited by:
Woodrow Barfield, University of Turin, ItalyReviewed by:
Bochen Jia, University of Michigan–Dearborn, United StatesCopyright © 2024 Tabone, Happee, Yang, Sadraei, García de Pedro, Lee, Merat and de Winter. This is an open-access article distributed under the terms of the Creative Commons Attribution License (CC BY). The use, distribution or reproduction in other forums is permitted, provided the original author(s) and the copyright owner(s) are credited and that the original publication in this journal is cited, in accordance with accepted academic practice. No use, distribution or reproduction is permitted which does not comply with these terms.
*Correspondence: Joost de Winter, ai5jLmYuZGV3aW50ZXJAdHVkZWxmdC5ubA==
Disclaimer: All claims expressed in this article are solely those of the authors and do not necessarily represent those of their affiliated organizations, or those of the publisher, the editors and the reviewers. Any product that may be evaluated in this article or claim that may be made by its manufacturer is not guaranteed or endorsed by the publisher.
Research integrity at Frontiers
Learn more about the work of our research integrity team to safeguard the quality of each article we publish.