 Alma F. Hertwig
 André Brandewiede
 Markus A. Feufel
- 1AUDI AG, Ingolstadt, Germany
- 2Volkswagen Group, Wolfsburg, Germany
- 3Division of Ergonomics, Department of Psychology and Ergonomics (IPA), Technical University of Berlin, Berlin, Germany
In a context of increased competition due to growing customer centricity and product diversity, the automotive industry is challenged to improve the efficiency of its production processes. The design of the work system plays a decisive role in this. Virtual technologies are seen as having great potential to support this process. In this field study, the use of a user-centered Virtual Reality (VR) application for planning workshops was investigated. Over several weeks, the technology was used in the productive 3P workshop. The focus was on the acceptance of the professional groups, which is crucial for the successful integration of VR technology. To evaluate this, a questionnaire study based on the Unified Theory of Acceptance and Use of Technology (UTAUT), task-technology fit, and User Experience Questionnaire (UEQ) was conducted with 83 participants. Results show that VR technology can be used to conduct 3P workshops and enable acceleration. Determinants of user acceptance are task-technology fit, user experience of the software and how well occupational groups are supported by the technology. Age and prior VR experience did not have a significant impact on user acceptance. The results are discussed with respect to their theoretical and practical implications and limitations are identified.
1 Introduction
The manufacturing sector, and the automotive industry as an important part of this sector, is facing major challenges due to, for example, a shift towards more customer orientation and greater sustainability on the one hand and shortened product life cycles on the other (Feldhusen and Grote, 2013; Westkämper, 2013; Pokorni et al., 2017; Dillerup et al., 2019; Kunz, 2020). The pressure of international competition requires companies to develop and maintain efficiency and innovation capabilities (Bracht et al., 2018) that help to accelerate the product development process (PDP) (Bullinger, 1997; Feldhusen and Grote, 2013). However, to realize the potential of increased effectiveness and efficiency of internal processes, comprehensive structural changes and the proper use of new technologies are required (Dillerup et al., 2019).
Ample consideration has long been given to the planning processes in the factory, which deal with layout, material flow and manual workstations (Kunz, 2020). Different approaches to computer-aided planning, realization and optimization of such production processes are summarized under the term digital factory (VDI, 2008). One of the systems mentioned in this guideline is virtual reality (VR) technology, which has been used in factory planning since the 1990s (Runde, 2020), mainly focusing on concept planning, detailed planning and realization monitoring according to VDI, 2011 5200:2011 Part 1.
This paper focuses on assembly processes, which are traditionally characterized by a significant proportion of manual activities (Runde, 2020). The design of assembly workstations in the overall manufacturing process plays a decisive role in the efficient production of products, as they are highly dependent on employees, their health and influencing factors such as an aging workforce (Pokorni et al., 2017). Especially in the field of assembly planning, resource-intensive analog methods for assembly and work system design, such as cardboard engineering, are still widely used. However, they are reaching their limits against the background of increasing functional, ergonomic, and economic requirements, since, for example, human-robot cooperation and assistance systems cannot be mapped (Pokorni et al., 2017). For this reason, attempts are being made to optimize the planning of these processes with VR.
For this study, we accompanied the introduction and use of VR technologies in 3P workshops for assembly planning. Over several weeks processes were validated and optimized with support of VR technology. Based on the Unified Theory of Acceptance and Use of Technology (UTAUT; Venkatesh et al., 2003), we investigated the employee’s acceptance of VR technology in these workshops by conducting an explanatory sequential design (Toyon, 2021) using a questionnaire study and a focus group in a mixed methods approach. This study makes a relevant contribution to the literature and scientific practice because, firstly, it examines a real-world use case in an industrial setting in which VR technology was used by employees as a virtual planning tool in 3P workshops in real vehicle projects. And secondly, the study incorporates the influence of work task-related factors, such as task-technology fit, as well as the perceived user experience of the VR software application, into the assessment of technology acceptance. To complement the results from the questionnaire study, we also conducted a focus group with representatives of the affected employees to help explain the quantitative results.
The paper is organized as follows: the next section discusses the theoretical basis of the study and presents the research goals of this paper. Section 2 describes in detail the methodological approach, the VR technology that was used in the corporate setting, and the data collection. The results of the data analysis are then presented in Section 3 and subsequently discussed in Chapter 4. Implications for practice and limitations are identified, and further research needs for the use of VR technology in industrial settings are pointed out.
1.1 3P workshops in the product development process
Although the concept of the PDP was initially established in the automotive and aerospace industries, it is now also used in other industries (Sendler, 2009; Kerber, 2016). Increasing efficiency and shortening the PDP is a decisive factor in ensuring a manufacturer’s competitiveness (Pokorni et al., 2017; Bracht et al., 2018). However, the planning task is becoming more complex due to the increasing number of technologies and processes used. Moreover, requirements for high product quality, short manufacturing times and low production costs are also increasing. Therefore, production planning is one of the main factors which influences performance indicators such as time-to-market. For this reason, the economic relevance of production planning is continuously increasing (Bade, 2012; Eversheim, 2013).
During production preparation, all steps from planning to the actual manufacturing of the products must come together (Westkämper, 2006). One of these steps is work preparation. The aim of this step, which is summarized under the term work system design (WSD) (Landau, 2007), is to achieve the maximum productivity with minimal use of resources, e.g., materials, personnel, and operating equipment (Westkämper, 2006). Considering human needs and performance, WSD aims to create an optimal interaction of people, work equipment, and work objects by organizing a work system according to tasks and processes (Landau, 2007).
One of the methods applied to enable process optimization are 3P workshops. The term 3P stands for production preparation process and incorporates several workshop cascades. The aim is to create and optimize a holistic process design based on the collaboration of all actors involved in production preparation (Abdu et al., 2016). In this context, collaborative production preparation facilitates the shortening of product- and process-related development times, the reduction of costs, and the increase of innovation capability (Coletta, 2012; Fleischmann, 2016). In addition, the iterative approach attempts to uncover problems in a timely manner, as changes after implementation are very expensive (Winkes and Aurich, 2015).
The majority of the 3P is conducted in the form of workshops, where teams jointly revise standardized work processes to build new production lines and enhance existing ones (Fleischmann, 2016). The roles present at the workshops vary from company to company. Typically, representatives from production planning, industrial engineers, ergonomists, operational management, executive staff, quality assurance, maintenance, logistics, development, and healthcare as well as representatives of production employees (e.g., team spokesmen, foremen) are present in the workshop (Coletta, 2012; Otto et al., 2016). These occupational groups can be divided into two broad categories, white-collar and blue-collar workers. White-collar workers are engaged in non-manual tasks, while blue-collar workers perform physical or manual work in factories (Anjum and Parvez, 2013). The challenge is to ensure a balanced and consistent consideration of all aspects and different interests of those affected by the results of the workshop (Coletta, 2012).
Just as the group of people participating depends on the company, the focus of tasks in the workshop also varies. Considering the various publications on this topic (Jonas, 2000; Bade, 2012; Lotter et al., 2012; Weidner, 2014; Otto et al., 2016; Michniewicz, 2019) the primary objectives are: the validation and optimization of the assembly sequence, the assembly capability based on assembly tests, the material supply (e.g., containers, racks), the layout of technical equipment (e.g., machines, equipment, devices or handling equipment), a material flow oriented layout, walkways, the arrangement of assembly stations, the ergonomic design of workstations and identification of product change requirements.
The entire process is very resource-intensive, making time and costs critical success factors. The individually planned work steps of the entire production line are discussed and optimized over several months (Gaitzsch and Ziegler, 2010; Brunner, 2017). The process thrives on the interaction between the participants and with the physical prototype. Due to the continuous development and improvement of products, prototypes are often outdated at the time of the workshop, and they are very cost intensive. Moreover, although different variants of a vehicle are produced and the processes therefore vary, only one physical prototype variant is available in these workshops. Thus, complete testing of all variants is not possible (Westkämper, 2013).
1.2 Virtual reality in collaborative process planning
Due to the low availability of prototypes and the proven disadvantages, as detailed above, companies are looking for alternative ways to support 3P workshops (Rudolf, 2007). One such alternative is provided by the digital factory, which is defined by the Association of German Engineers (VDI) as a “generic term for a network of digital models, methods and tools - including simulation and 3D visualization - which are integrated by means of consistent data management” (Kühn, 2006, p.1). In addition to cost savings, it is hoped that these digital tools will improve the management of complexity and uncertainty in the PDP (Landherr et al., 2013; Bracht et al., 2018).
According to Bade (2012) and Schack (2008), various digital factory techniques are represented in the different planning tools. These include Computer Aided Planning systems, Computer Aided Design systems, sequence simulation and 3D simulations. While these support planning, a factor that is crucial to the 3P workshop is lost. The ability to experience the processes individually and as a team. To enable this experience, Augmented Reality (AR) and VR are used as user interface. While AR adds virtual objects to the real world, VR creates a completely synthetically generated virtual environment (Milgram and Kishino, 1994). VR systems are particularly suited for use in planning and consideration of workplace design because they can be used to visualize planned work environments that have not yet been implemented (Freyer, 2020). VR technology additionally enables an immersive and collaborative workshop environment in which users can engage intuitively with problem-solving processes (Otto et al., 2016). That is, users can not only view the displayed objects but also have the possibility to interact with the objects and thus actively influence the displayed scene in real time (Bullinger, 1997; Wiendahl et al., 2002; Heinig, 2015; Schenk, 2015; Dörner et al., 2019). Thus, it is more experiential than desktop applications. Dörner et al. (2013) also point out that VR has the potential to circumvent weaknesses of the analogue planning process, related to cost and time savings.
Over the last decades, a wide variety of publications has been published on the use of VR technologies in planning processes and validation workshops. Various studies conclude that VR has great potential for assembly planning scenarios, which are described in more detail subsequently (Reinhart et al., 2002; Dangelmaier et al., 2005; Kampker et al., 2020). The focus is often on the consideration of individual workstations, in which users have the possibility to adapt the station to their needs (Pokorni et al., 2017). Moreover, Pokorni and colleagues emphasize that virtual 3D data may be reused for qualification purposes after the workplace has been optimized. In the publication by Otto et al. (2016), the use of VR is further complemented by a mixed reality scenario to lower the threshold for users and to enable easier user adoption. They also point out that previous use cases did not yet explore VR use in real-world contexts (Otto et al., 2016). Seth et al. (2010) come to a similar conclusion. Their literature review reports VR use cases on different sub-areas which, however, are more conceptual in nature. Furthermore, Winkes and Aurich (2015) suggest that the use of VR in planning workshops, such as the 3P workshops, requires an adaptation of the approach or perhaps even a redefinition of preparation and implementation processes.
Whereas most of the previously described studies have a technology-focused approach, Kaiser and. (2020) and Bernhagen et al. (2022) choose a user-centered approach. In addition to eliciting user requirements for the developed applications based on DIN EN ISO 9241-210 (2019), they conducted a series of user tests with a focus on usability and technology acceptance to make an informed statement about the use of the technology in the context of workplace design for small and medium-sized enterprises. Their results showed that VR technologies have advantages over pure desktop applications, especially in detailed planning and mainly due to the possibility of testing and simulation by assembly workers (Bernhagen et al., 2022). However, the authors state that due to the relatively small sample it is difficult to draw general conclusions about the validity of the results in terms of acceptance and UX regarding the application under study. Thus, it is evident that an inquiry in a real-world context and a large sample complements the findings of previous studies.
1.3 Technology acceptance
Technological progress is often associated with new opportunities but also with new risks. One construct that is therefore often seen as crucial for technological progress is technology acceptance (Neyer et al., 2012), because the full potential of a technology can only be realized when it is accepted by its potential users (Davis, 1993; Talukder et al., 2008; Högg, 2010). The branch of research in information systems that focuses on acceptance of information technologies is well advanced (Vekatesh et al., 2003), suggesting that if acceptance is high from product development to implementation, the likelihood of successful product use can be increased (Brunkow and Hub, 2018).
Over the years, a wide variety of theoretical models have been developed to explain the factors influencing technology acceptance. One of the best-known models is the Unified Theory of Acceptance and Use of Technology (UTAUT), which combines eight different models and thus explains more variance than the individual models, such as the Technology Acceptance Model or Motivation Model (Venkatesh et al., 2003). An illustration of the model can be retrieved from the Supplementary Material. Apart from the fact that the model is frequently used in industrial contexts, it is superior to the individual models in predicting behavioral intention, as mentioned earlier (Venkatesh et al., 2003; Dwidevi et al., 2011).
The UTAUT model assumes that the use of technology is extrinsically motivated and driven by the expectation that using the technology will result in a positive outcome. The expectations that may influence Behavioral Intention (BI) are threefold: Namely, Performance Expectancy (PE), Effort Expectancy (EE), and Social Influence (SI) (Venkatesh et al., 2003), where PE describes the extent to which the user believes that the system under study will have a positive impact on his or her work. EE refers to how easy the user assumes using the system will be, and SI summarizes the impact important people in the environment of the user have on technology acceptance. According to the model, usage behavior (UB) is positively influenced by BI as well as facilitating conditions (FC), which refer to the extent that the user believes that the organizational and technical infrastructures necessary for usage are in place (Venkatesh et al., 2003). Moreover, Venkatesh et al. (2003) showed that user parameters, such as gender, age and experience have a moderating impact on the relationship between independent factors of the model and behavioral intention. The relationships between the components of the model have been confirmed in various publications since 2003 (Dwidevi et al., 2011; Al-Seadi et al., 2020).
What the models presented so far do not focus on is whether the technology under study is generally appropriate for the task or activity being performed (Goodhue, 2007). However, this can have a major impact on employee adoption, particularly in the context of assembly planning, where both efficiency and effectiveness of the planning tools are key to adoption and success (Bade, 2012). For instance, Zhou et al. (2010) found that both task-related and technology-related characteristics have a strong effect on Task-Technology Fit (TTF) and thus on user acceptance. It therefore makes sense to include the factor of TTF, which describes the extent to which the technology supports the user in the task he or she is performing (Goodhue and Thompson, 1995). Wang et al. (2020) showed that the TTF positively influences BI, whereas Park et al. (2015) argued that it does not have a direct effect on the BI but that is mediated by its effect on PE, EE, and SI.
2 Materials and methods
2.1 Study settings
As mentioned before, the aim of this study was to examine the use and potential of the VR application in 3P workshops to optimize and validate an assembly work system design. Two workshops, which used VR instead of a physical prototype, could be identified for this purpose. The workshops took place at two different locations, namely, Ingolstadt and Wolfsburg. Over a total period of 12 weeks, the technology was used to simulate the planned work processes. Within each week, all stations and workplaces of a team were worked through, and the results of the workshop were presented to the management at the end of the week. During the workshop, VR was used whenever the teams would normally have gone to the prototype to review processes, test the feasibility of workflows, and optimize the planning. In the 3P workshops, teams rotated weekly according to their responsibilities. Different user groups participated, including assembly workers, industrial engineers, virtual assembly planning engineers, and facilitators. The facilitators and planning engineers remained constant, while the assembly workers changed weekly or bi-weekly, depending on their cycle-specific responsibilities.
Use of the VR application was optional, so people who did not want to use it could observe others from a third-person perspective. Typically, assembly workers and virtual assembly planners performed the simulations while the other participants observed the simulations via monitors. Work steps were usually demonstrated first before participants performed them themselves.
2.2 VR-hardware and room setting
For the 3P workshops at both locations we used a VR system consisting of head-mounted displays (HMD), namely, HTC Vive Pro with controllers and lighthouse tracking (HTC, Taoyuan, Taiwan). All statistical analyses were calculated using either Jamovi (version 2.3.21) (Jamovi, 2022). Four lighthouses 2.0 were used in each setup to enable tracking spaces of up to 10 × 10 m. At the first location (Ingolstadt, Germany) two VR tracking spaces were setup. Each tracking space contained two HTC Vive Pro HMDs using Vive wireless adapters to enable cable-free interaction within the tracking space. At the second location (Wolfsburg, Germany), one VR tracking space with one wired HTC Vice HMD was available. All rooms were located close to the assembly lines to allow for on-site visits as deemed necessary. The setup was the same for both locations (see Figure 1). The tracking space was directly situated next to a seating area where the workshop was held. Either monitors or beamers were used to allow non-VR users to observe the virtual simulation from different perspectives. To give the observers a complete picture of the situation, two perspectives were presented: A first-person view and a third-person view. Because the workshops were facilitated in different rooms, the room tracking spaces varied approximately between 56 m2 and 80 m2. Nevertheless, the objective was to have the largest tracking space possible. Ideally, a full assembly cycle should fit into the tracking space to reduce the amount of virtual navigation needed. This was a pre-requisite to ensure that the VR simulation represents walking distances realistically.
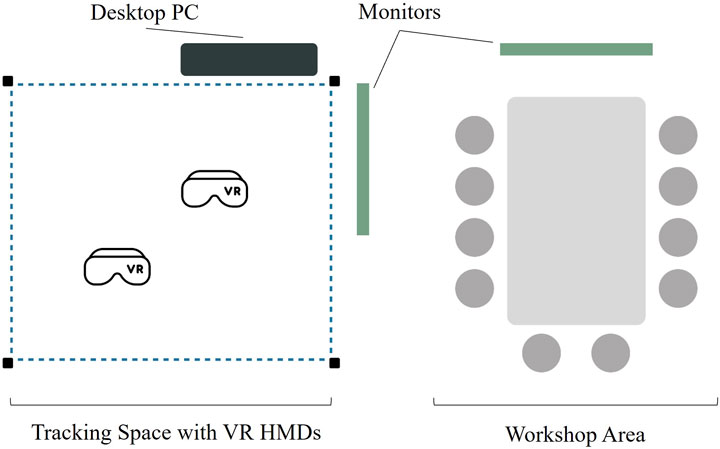
Figure 1. Schematic representation of the general room layout with the tracking space and the workshop area respectively.
2.3 Software application
The software application, which was employed to conduct the 3P workshops in the present study, was developed using agile software development principles and the DIN EN ISO 9241-210 user-centered design process to enable a fast and user-centered development (International Organization for Standardization, 2019). The application supports virtual, multi-user collaboration across different locations. Allowing both co-located users within the same tracking space to interact with each other as well as multiple single users or co-located user groups from other locations to join and interact. It was build using Unity game engine (Unity Technologies, San Francisco, United States). Moreover, 3D data models had to be created to display the assembly cycle as a 3D scene in VR. For the data preparation, an automated data preparation pipeline using PIXYZ software (Metaverse Technologies France, Suresnes, France) was implemented to enable fast reduction of data models that can be displayed in VR. The software application frame rate averaged 92 fps over the workshop weeks. VR setups are recommended to run at a minimum of 90 fps to ensure smooth real-time visualization of the data and to reduce the risk of VR-induced nausea and disorientation (Jerdan et al., 2018; Kersten et al., 2021).
At the core, the application depicts one or more assembly cycles, containing all the materials, equipment, and racks necessary to perform the assembly task. Thus, the VR application is displaying a virtual prototype of the vehicle’s assembly status within the cycle. Moreover, the planning status of the assembly order, operating equipment, manipulator devices and conveyor technology are shown within the assembly cycle (Figure 2).
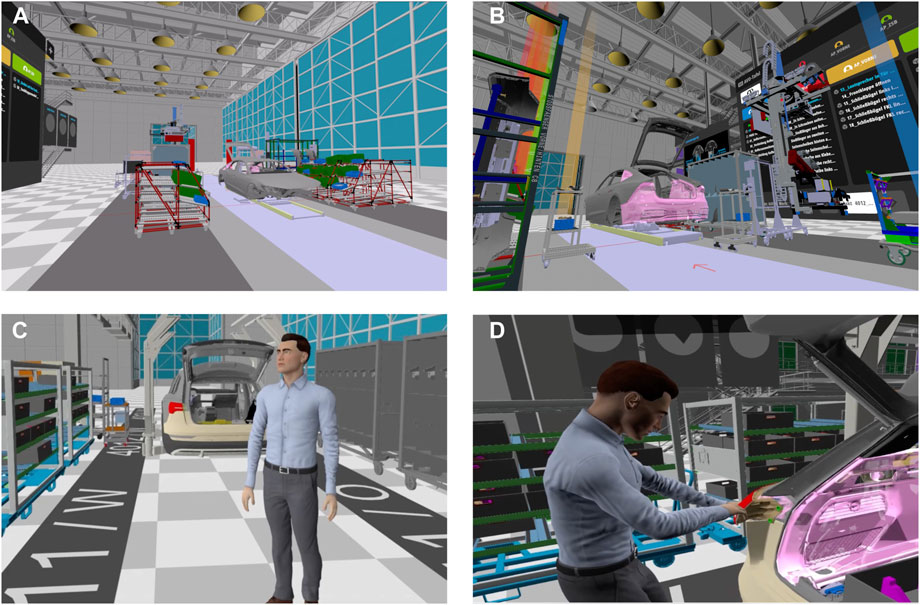
Figure 2. (A) First person view of the virtual scene with an HMD; (B) third person view of the virtual scene using the desktop version; (C) avatar with representation of the real size VR user (third person view); (D) VR user during the assembling process (third person view).
There are two ways to operate the application. Firstly, by actively using the VR system with the HMDs and controllers and secondly, by observing the scene on a desktop screen. Although some settings and functions are available for the desktop version, only the immersive VR version supports the full range of functionality to assemble and manipulate the virtual scene. The desktop version mainly supports viewing the scene and navigating through it. Since the application offers a wide range of functions and settings, the most important tasks and the implemented functions are summarized in Table 1.
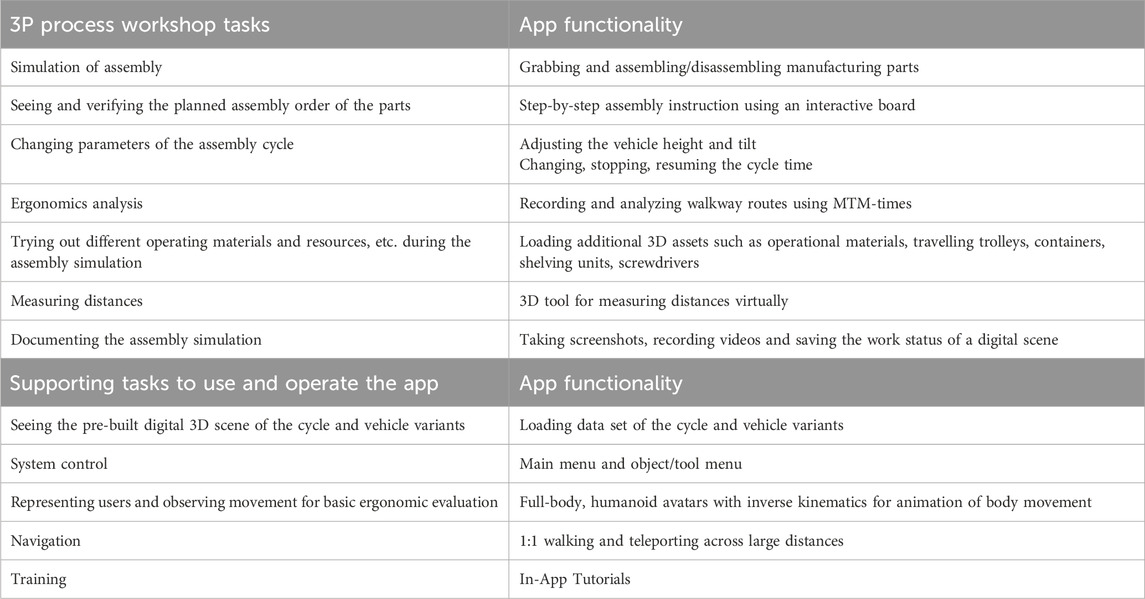
Table 1. Overview of the main functionalities and their dedicated tasks.
For a more realistic representation of humans, the avatars are calibrated to the person’s height and arm length using the tracked points of the VR HMD and controllers. Additionally, to advance the tracking, HTC Vive trackers can be added to the ankles and hip using Rebuff Reality TrackStraps and TrackBelt (Rebuff Reality, Miami, Florida, United States) for full-body tracking. The animation of the avatar is enabled using a procedural animation for walking and inverse kinematics for the body movement between the tracked points. Both the calibration as well as the animation of movement are important to be able to view the proportion and movement of the person performing the VR simulation. To recognize the person behind the avatar, a name plate was displayed above the person’s head.
2.4 The present study
The aim of the present study was to assess user acceptance of the VR technology for 3P workshops in assembly planning, as well as the TTF and the UX of the VR software application. The focus was to gain a better understanding of the adoption of VR technology by users within an industrial planning setting. While TTF and UX were not initially included in Venkatesh et al.'s (2003) UTAUT model, other researchers have subsequently extended and evaluated the model. Given that behavioral intention is the primary dimension of the UTAUT for predicting technology adoption, the research objectives pertaining to user acceptance will be formulated based on the construct of behavioral intention.
As previously highlighted, most studies examining VR technologies in the context of planning processes have focused on the technical implementation of specific use cases (Mujber et al., 2004; Menck et al., 2012; Choi et al., 2015). In contrast, we explore factors influencing VR use in a manufacturing setting with an emphasis on technology acceptance. Gaining a deeper understanding of factors impacting VR usage allows the determination of pre-requisites for introducing the technology into a manufacturing setting and how user adoption can be facilitated. Thus, the study aims to investigate the following research objectives:
(1) To investigate the descriptive measures of the UTAUT, TTF and UX measures for the VR software application. Benchmark scores for what constitutes a ‘good’ UX exist (Schrepp et al., 2017), thus we aimed to determine the measures of the VR application and whether action is required to improve UX. In contrast, no benchmarks for UTAUT measures exist to our knowledge. Since the UTAUT scores are on a scale from
(2) To assess the influence of user characteristics, namely, age, prior VR experience and occupation, on BI, TTF and UX. Previous studies in acceptance literature propose that user characteristics, such as age and prior experience with digital technologies, may moderate the relationship between acceptance factors (Venkatesh et al., 2003).
Regarding the user parameter age, Porter and Donthu (2006) found that older and less educated individuals have lower Internet usage rates than younger and highly educated individuals. Moreover, since age is a crucial demographic factor influencing technology adoption (Venkatesh et al., 2003), we expect that younger age groups will exhibit a higher BI towards using VR technology compared to older age groups. As there is no existing model for UX and TTF predictions, we will explore the impact of user parameters on these aspects to gain valuable insights.
Concerning occupation, Toshav-Eichner and Baraket-Bojmel (2021) found that blue-collar workers were more likely to perceive technological advancements at work as a “replacer” rather than an “enabler” compared to white-collar workers. Indicating that occupation has an influence on the perception of new technologies. In addition, recent research by Löher et al. (2022) suggests that digitization is considered less important in manufacturing than in accounting and sales departments, suggesting potentially lower levels of digitization in manufacturing. Furthermore, Sochor et al. (2019) highlighted acceptance problems with assistance systems in manual assembly among assembly workers. With this in mind, we hypothesize that white-collar workers will show higher BI of VR technologies than blue-collar counterparts.
Concerning prior VR experience, Pletz and Zinn (2018) found users who have previous experience with VR technology have significantly higher BI towards the technology than users who have no previous experience. Thus, we expect users with prior VR experience to have a greater BI than users with no or little prior VR experience.
(3) To evaluate if UX and TTF affect BI. Mlekus et al. (2020) argued that UX is missing from the technology acceptance model (TAM) as one determinant for technology acceptance and found that user experience explained approximately 25 percent of the variance in BI. Moreover, UX has been identified to have an indirect effect on BI, through PE, EE and SI within an extended UTAUT model (Alotaibi and Wald, 2013). Thus, we expect UX to have a positive impact on BI. Additionally, Wang et al. (2020) extended the UTAUT to include TTF and demonstrated that TTF significantly impacts PE and BI. Therefore, we expect the TTF to have a positive impact on BI.
(4) To examine whether actively using the VR system has an impact on UX, TTF and BI. Specifically, we compared active use of the VR system with passive observation on a screen. This comparison is important because the degree of immersiveness and the ability to actively test and optimize work processes may vary between the two types of use. Previous studies have shown that VR HMDs provide a higher sense of presence compared to monitors (Kober et al., 2012; Shu et al., 2018), and presence has been significantly associated with UX (Brade et al., 2017) and adoption of VR systems (Plotzky et al., 2021). Based on these findings, we hypothesize that users who actively engage with the VR system will report higher levels of UX and BI than those who merely observe the system on a monitor. Regarding the impact of actively wearing an HMD on TTF an exploratory approach is taken since no prior research to our knowledge has been conducted.
2.5 Participants
Overall, 83 subjects participated in the questionnaire study, with 56 and 27 subjects taking part in Ingolstadt and Wolfsburg, respectively. The data are summarized for both locations since the study conditions were the same. The distribution of participants in age groups, prior VR experience, and occupational group are shown in Table 2, respectively. Categories with fewer than five subjects are not reported due to data protection regulations. In addition, 34 individuals (43%) voluntarily chose to wear the VR HMD during the workshops, while 45 participants (54.2%) chose to watch the proceedings solely via monitors. The remaining four participants (4.8%) did not indicate their choice of VR use. Although all subjects had the opportunity to wear a VR HMD, assembly workers and virtual assembly planning engineers were the main ones actively using VR due to their roles.
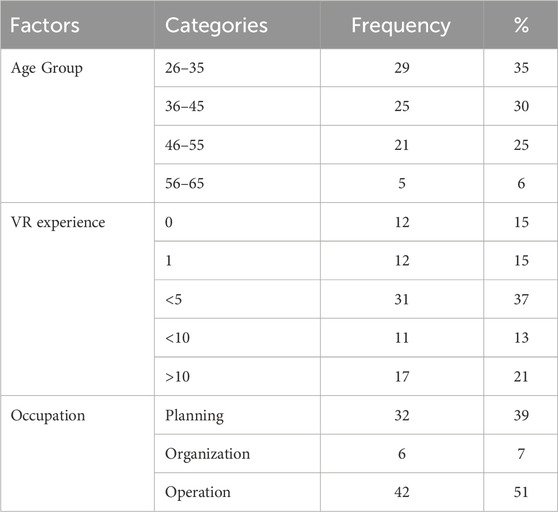
Table 2. Distribution in frequency (and percentages) of age, VR experience and occupation.
Furthermore, 11 participants (4 in Ingolstadt, 7 in Wolfsburg) voluntarily attended the focus group. All subjects had participated in the field study prior to the focus group and had been an active part in the virtual 3P workshops using VR technology. Further information on the procedure is provided in more detail in the following chapter.
We conducted the survey in compliance with the regulations and with the consent of the Data Protection Commission, the Employee Surveys Department and the Works Council.
2.6 Procedure
We assessed acceptance towards the technology and UX using questionnaires. An explanatory sequential mixed methods design in the field was devised where different professional groups used the VR software over several weeks in their regular 3P workshop routine. After having gained experience with the system, participants were asked to fill out questionnaires providing their assessment of the technology. Each participant could only take part in the questionnaire study once. The workshops took place between February 2023 and May 2023. Participants were informed about their rights and data protection measures and could participate in the survey voluntarily and anonymously. To ensure anonymity, the questionnaires were collected in an urn, so that it was not possible to assign them to any individual persons. Due to the limited time available in the workshops, it was agreed in consultation with the Data Protection Commission, the Works Council and the Employee Survey Department that the questionnaires should not take more than 10 min to complete.
For evaluating the user acceptance towards the usage of VR technologies in 3P workshops, the UTAUT (Venkatesh et al., 2003; Harborth and Pape, 2018) with the constructs PE, EE, SI, FC, and BI was used. We integrated the construct of TTF (Isaac et al., 2019) into the model to assess the suitability of the technology to accomplish the workshop tasks. The items of the individual questionnaires were arranged randomly to ensure that multiple items from one construct did not follow one another (Mayer, 2012).
Questionnaires that are designed to evaluate a VR system in terms of their UX are often very long as they assess significantly more factors (Kalawasky, 1999; Tcha-Tokey et al., 2016). However, due to the time criticality, it was necessary to use a questionnaire that was as efficient as possible. The UEQ in its various versions has already been used in studies to evaluate simulations and VR applications in a wide variety of contexts (Gao et al., 2021; Somrak et al., 2021; Chen et al., 2023; Pangestu et al., 2023). Furthermore, Alboerola and Brau (2017) showed that a shortened version, the UEQ-S, is a reliable instrument to assess various aspects of UX. Therefore, this 11-item long questionnaire was used.
Aside from user acceptance and UX, the participants were also asked to indicate how often they would like to use the VR system in 3P workshops. The assessment was made in four levels: not at all, rarely, when needed and permanently. Furthermore, participants were asked to state their preferred type of 3P workshops (i.e., workshops with physical prototype, workshops using only 2D planning software, workshops using VR technology or no preference). We included a second version of this question, which omitted the workshop with a physical prototype, to indicate what digital tool the participants prefer when no physical prototype is available.
At the end of the questionnaire, the demographic data (age, previous experience with VR, and occupational group) of the participants were presented. To ensure compliance with the Data Protection Commission’s internal regulations, which require a minimum size of five people per demographic characteristic, age was divided into six groups (<26, 26–35, 36–45, 46 - 55, 56 - 65, >65) and occupational group into four (planning, facilitating, performing, and other) categories. The planning group consisted of disciplines such as industrial engineering, resource planning, assembly planning as well as logistics planning; the moderating professional group included trainers, moderators, and methodologists; and the executing professional group, included employees who are responsible for or operate the agreed process, as well as works councils. Lastly, data on prior VR experience (0 times, 1 time, <5 times, <10 times, >10 times) was also collected to gain an understanding into the level of competence regarding the usage of VR technology.
After the workshops were completed, representatives from the professional groups who had taken part in the workshops were invited to participate in a focus group. We were only able to include white-collar professionals, as the blue-collar professionals were not available due to tightly schedule shift work on the assembly line. At both locations, a focus group with a length of 1.5 h each was conducted digitally via video conferencing. Participation in the focus group was voluntary and subjects who had taken part in the field study were included only.
The goal of the focus group was to gain a deeper understanding of people’s attitudes toward using VR technology for 3P workshops and to gain further insight into the questionnaire results (explanatory mixed method design). Five guiding questions looking at the general perception of the workshop, as well as the successes and challenges were used to direct the discussion. The group discussions were guided by a moderator and a second person who documented the discussion.
2.7 Statistical analyses
All statistical analyses were calculated using either Jamovi (version 2.3.21) or IBM SPSS Statistics Professional License (version 25). For data preparation, negatively poled items (e.g., “behavioral intention”) were inverted. Descriptive statistics were then computed to identify missing values and to determine the total sample size and the subsample size of each independent group. Because only a few values were missing, the analysis was conducted without excluding any data points. Categories with fewer than five participants (e.g., the “Other Occupations” category or “Age <25” variable) were excluded from analyses due to the company’s privacy policy, which states that data sets with fewer than five participants may not be analyzed further.
Both the UTAUT and TTF questionnaires, have a 7-point scale, with 1 being negative and 7 being positive (Venkatesh et al., 2003; Isaac et al., 2019). Similarly, the UEQ has a 7-point scale, which is formulated as a semantic differential (Laugwitz et al., 2008). The UEQ is evaluated on a scale from −3 to +3 (Laugwitz et al., 2008). The benchmark scores of Schrepp et al. (2017), which were used in this study, also use this scale. Thus, for descriptive analysis, the data were analyzed on a scale of −3 to +3 to ensure comparability of the three constructs.
To investigate how BI, TTF and UX are influenced by demographic parameters (i.e., age group, prior VR experience and occupation) three separate three-way variance analysis (ANOVA), post hoc comparisons as well as means and standard deviations for the three factors were calculated. Separate ANOVAs were calculated since there is no underlying, unified model that has been evaluated for all these constructs. To test the statistical assumptions of the ANOVA, a Levene Test and Shapiro-Wilk-Test were performed to assess any assumption violations for homogeneity of variance and normally distributed response variables, respectively.
To assess the impact of UX measures and TTF on BI a multiple regression analysis was performed and correlations between UX, TTF, and the BI were examined to determine their respective effects. Before performing the regression analysis, the assumptions were examined, especially testing for collinearity by investigating the variance inflation factor. A Shapiro-Wilk test was calculated to assess the normality assumption.
To evaluate if using a VR HMD or being an observer had an impact on the UX, TTF and BI a one-way multivariate variance analysis (MANOVA) was computed. To assess assumptions of MANOVA, the Box’s M-Test was calculated to check for homogeneity of covariance matrices. The Shapiro-Wilk-Test was performed to test for multivariate normal distribution.
Regarding the location of the study, the procedures and technical facilities were identical at both sites. However, differences were evident in the distribution of occupational groups, as shown in Figure 3. In particular, the planning group was unequally represented in Wolfsburg and Ingolstadt, with the planning group in Wolfsburg responding to only a few questionnaires. In addition, there were few records from the organizational group at either site, likely since fewer members of these groups attended the workshops and participation in the study was voluntary. To examine if the location has an impact on UX, TTF and BI a one-way multivariate variance analysis (MANOVA) was computed. Initially, the pre-requisites were not met. Inspection of the histogram revealed a left skewed distribution for all dependent variables. To correct this problem, the data were transformed by mirroring and logarithmic conversion. Following this transformation, Box’s M-test is not violated, (χ2 (6) = 1.20, p = .303). The Shapiro-Wilk-Test is violated for BI and TTF, however not for UX, p > .05. Despite this violation, a parametric test was performed since MANOVAs are robust to violations of the normality assumption (Finch, 2005). Results showed no statistically significant difference regarding the location on UX, TTF, and BI (F (3,79) = 2.04, p = .115; Wilk’s Λ = .928). Therefore, the location does not appear to have an impact on the dependent measures and both data sets were analyzed together.
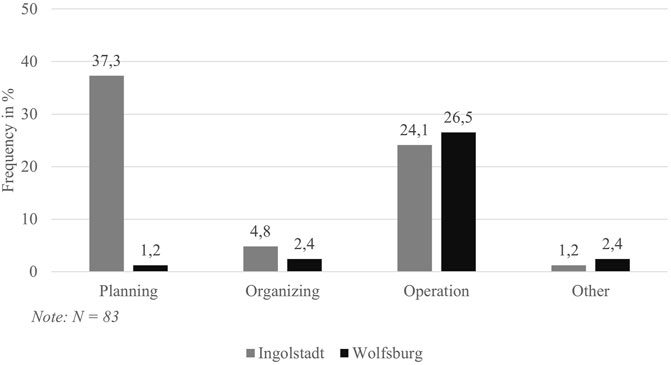
Figure 3. Showing the distribution of occupations across both locations.
2.8 Qualitative analysis
Because we could not take audio recordings due to data protection requirements, the analysis of the focus groups is based on handwritten protocols of the conversations. The material was initially reviewed by the authors, and the text passages pertaining to the guiding questions were marked. The method of central statements according to Schulz et al. (2012) was chosen for this. Central aspects are statements that occur repeatedly in the conversation and are discussed in depth. These discussion aspects were structured and summarized in categories. The study was exploratory in nature. For this reason, the guiding questions for the overall situation in the workshop, the comparison of the ways in which the workshop was conducted, and the requirements for future workshops were derived inductively. Schulz et al. (2012) propose this approach when gaining a deep understanding of the reasoning is intended. A different approach was taken to analyze the text sections on successful and challenging aspects of VR use. Because questions relating to these aspects were used to classify the results of the questionnaires, the main categories were derived deductively based on the constructs of the questionnaire. Additional subcategories of successful and challenging aspects of VR use were coded inductively.
3 Results
In the following, statistical results for the four research objectives will be reported.
3.1 Descriptive measures of the UTAUT, TTF and UX
Descriptive measures of the extended UTAUT were calculated to assess acceptance. The results are shown in Figure 4. The mean for EE was .92 (SD = 1.02), while PE had a mean of .26 (SD = 1.27). For the SI construct, the mean was .22 (SD = 1.06). In addition, FC had a mean of 1.03 (SD = 1.07), TTF had a mean of .39 (SD = 1.47), and UX had a mean of .83 (SD = 1.09). Finally, the mean for BI was .43 (SD = 1.25). All mean scores were in the low positive range on a scale of −3 to +3, with scores ranging from .22 to 1.03. These results indicate that all constructs of the extended UTAUT model were positively perceived by participants.
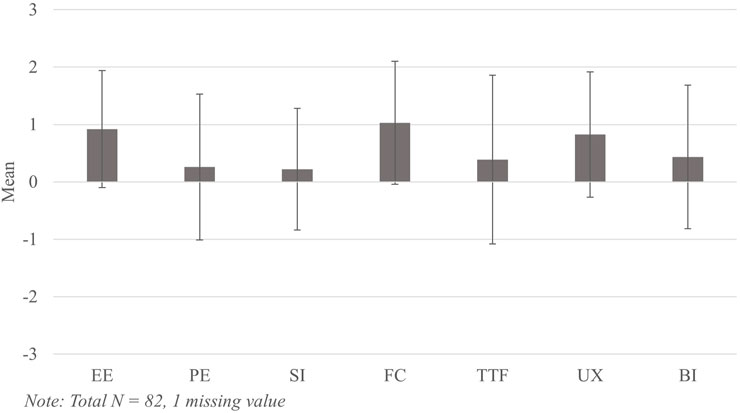
Figure 4. Subjects self-rated UTAUT measures regarding VR technology.
Additionally, the evaluation of the overall UX measures were carried out using descriptive measures. The study focused on three dimensions: Attractiveness, Pragmatic Quality, and Hedonic Quality, with reported mean scores of .89 (SD = 1.22), .74 (SD = 1.16), and .86 (SD = 1.22), respectively. For the UEQ-S, the assessment of the product’s UX quality relies on several benchmark scores. As indicated in the UEQ manual, values between −0.8 and 0.8 signify a neutral rating of the corresponding scale, values
3.2 Impact of demographic parameters
For the analysis of demographic factors on BI, the Levene-Test was not violated, F (20,42) = 1.82, p = .052, indicating that variance homogeneity can be assumed. However, the normality assumption was violated, as shown by the Shapiro-Wilk-Test. Despite the non-normal distribution, a parametric test, specifically analysis of variance (ANOVA), was performed because it was found to be robust even when this assumption is violated (Schmider et al., 2010). The results of the three-way ANOVA are shown in Table 3.
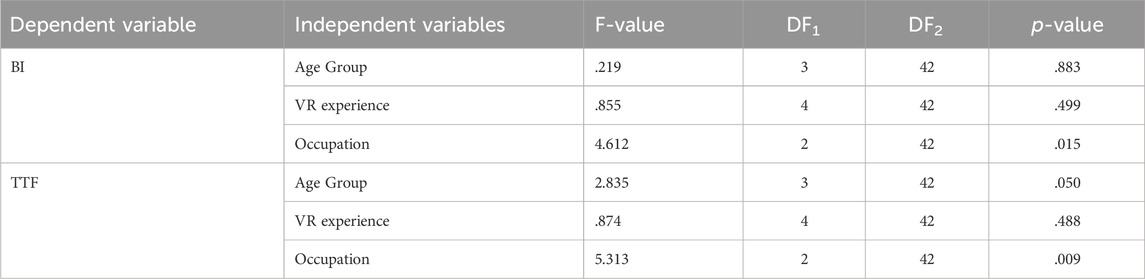
Table 3. ANOVAs for BI and TTF on demographic measures.
For the demographic factor of occupation on BI, a significant main effect was found, F (2, 80) = 4.61, p = .015, partial η2 = .18. The effect size for “occupation” can be interpreted as large (Cohen, 1988). The post hoc comparisons, Tukey’s HSD Test found that the mean value of BI was significantly different between the occupational groups “planning” and “operation” (p = .001, 95% C.I. = −1.80, −.50). The occupational group “planning” scored on average 1.15 points less on BI than the group “operation”. This indicates that, contrary to our expectation, acceptance was higher in the “operation” group than in the “planning” group. The means and standard deviations of age group, occupation, and prior VR experience regarding BI are summed up in Table 4.
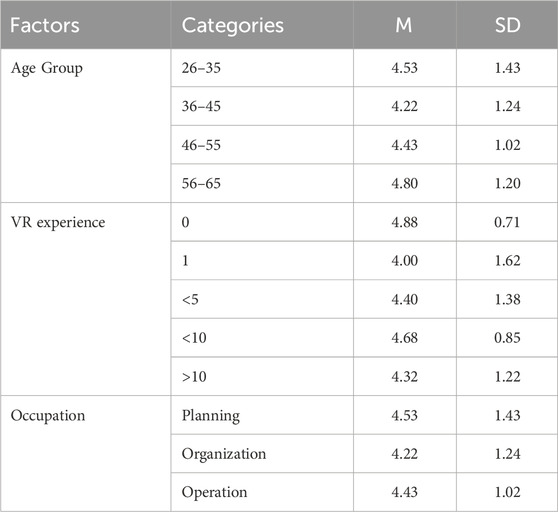
Table 4. Means and standard deviations of BI for factor age group, VR experience, and occupation.
In the analysis of the TTF, the initial Levene Test indicated a violation. Inspection of the histogram revealed a left skewed distribution. To correct this problem, the data were transformed by mirroring and logarithmic conversion. After these transformations, the Levene Test was no longer violated F (20, 42) = 1.77, p = .059), indicating that variance homogeneity can be assumed. However, the results of the Shapiro-Wilk-Test indicate that the normality assumption is still violated. Despite this violation, the robustness of the three-way ANOVA (Schmider et al., 2010) allowed its use, and the results are presented in Table 3.
For the demographic factors of occupation and age on TTF, two significant main effects were found, respectively. For occupation, the main effect was F (2, 80) = 5.31, p = .009, partial η2 = .20. The effect size for “occupation” can be interpreted as large (Cohen, 1988). For age, the main effect was F (2, 80) = 2.84, p = .050, partial η2 = .17. The effect size for “age” can also be interpreted as large (Cohen, 1988). Regarding the post hoc comparisons for occupation, Tukey’s HSD Test found that the mean value of TTF was significantly different between the occupational groups “planning” and “operation” (p = .001, 95% C.I. = .08, .27). The occupational group “planning” scored on average 0.18 points less on TTF than the group “operation”. Further, there was another significant difference between the occupational groups of “organizing” and “operation” (p = .004, 95% C.I. = .08, .47). The occupational group “organizing” scored on average 0.27 points less on TTF than the group “operation”. Therefore, we can conclude that TTF was higher for blue-collar workers (operation) than for white-collar workers (planning and organizing).
Concerning the post hoc comparisons for age, no significant results were found. For the means and standard deviations of age group, occupation and prior VR experience regarding TTF, see Table 5.

Table 5. Means and standard deviations of TTF for factor age group, VR experience, and occupation.
Examining the impact of demographic characteristics on UX, no results can be reported due to the violation of the Levene Test and unsuccessful attempts to resolve this issue through data transformation. Therefore, the test results were excluded from the analysis. The means and standard deviations for UX in relation to age group, occupation, and prior VR experience are shown in Table 6.
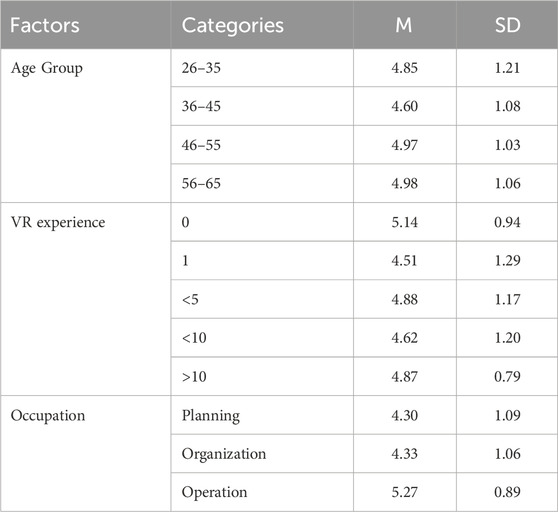
Table 6. Means and standard deviations of UX for factor age group, VR experience, and occupation.
3.3 Influence of UX and TTF on BI
A one-tailed Pearson correlation coefficient was calculated to assess the linear relationship between TTF, UX and BI (see Table 7). A positive correlation between TTF and BI was found, r (81 = .70,p = .001, d = .029. Cohen’s d can be interpreted as a trivial effect size (Cohen, 1988). The analysis revealed a positive correlation between UX and BI (r (81 = .68, p = .001, d = .34) and a positive correlation between UX and TTF (r (81) = .74, p = .001, d = .340). Given that Cohen’s d is smaller than .20 in both cases, the effect sizes can be interpreted as small (Cohen, 1988).
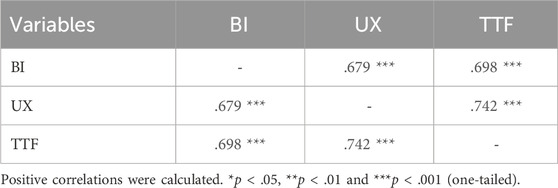
Table 7. Correlations of dependent variables.
As for the multiple regression assumptions, a variance inflation factor of VIF = 2.22 indicates a moderate correlation, making the regression results interpretable (Daoud, 2017). Although the normality assumption was violated, Schmidt and Finan (2018) suggest that the regression model can be considered robust for large samples with more than ten observations, allowing for interpretation of the results.
To examine the significant predictors of behavioral intention (BI), multiple linear regression was performed with TTF and UX as independent variables. The overall regression was statistically significant (R2 = .545, F (2,80) = 47.9, p < .001), indicating that 55% of the variance in BI was explained by UX and TTF. Both UX (β = .414, t (81) = 3.20, p < .002) and TTF (β = .367, t (81) = 3.20, p < .002) significantly predicted BI, confirming their importance as predictors in the model.
3.4 Impact of actively using the VR system
Box’s M test revealed no violation (χ2 (6) = 6.70, p = .349). However, the Shapiro-Wilk test revealed a violation of the normality assumption. Despite this, a parametric test was performed because MANOVAs are robust to violations of the normality assumption (Finch, 2005). Results showed no statistically significant difference regarding using a VR HMD or being an observer on UX, TTF, and BI (F (3,75) = 13.74, p = .788; Wilk’s Λ = .986). Thus, the expected positive influence of wearing an HMD was not confirmed.
3.5 Descriptive analysis of categorical dependent measures
Percentage frequencies were calculated for the analysis of the variables “intention to use” and “workshop preference with and without physical prototype”, the detailed results of which are presented below. Figure 5 shows the responses to the question, “How often would you like to use VR technology in 3P workshops?”
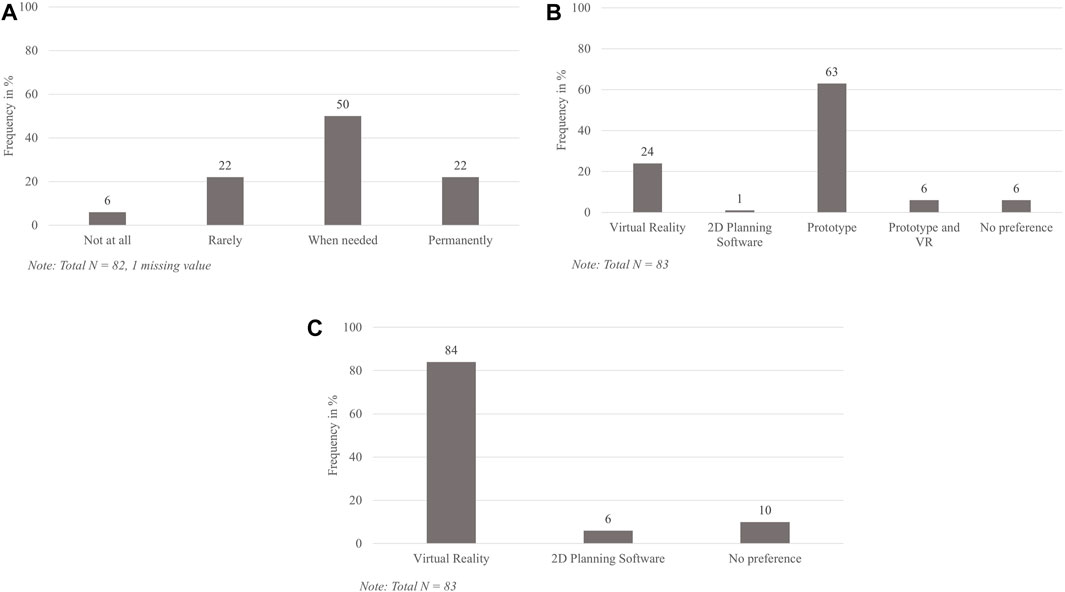
Figure 5. (A) Subjects self-rated usage intention regarding VR technology. (B) Subjects self-rated workshop preference with a physical prototype. (C) Subjects self-rated workshop preference without a physical prototype.
Figure 5 illustrates the results to the question, “What type of workshop do you prefer?” It is worth noting that the category “Prototype and VR” was not originally included in the questionnaire; however, we later added results in this category for participants who selected both categories, “VR” and “Prototype”. Finally, Figure 5 shows responses to the question, “If a prototype is not available, what type of workshop would you prefer?”
3.6 Focus group
Assessing the general situation in the workshops, the participants of the focus group mentioned both positive and negative aspects that characterized the execution. The speed of the workshop, the pragmatic attitude of the participants, the use of VR technology, and the similarity of the vehicles to the predecessor, which simplified the general purpose of the workshop, were emphasized as positive aspects. Negative factors included the quality of input data, inconsistent working methods, a strong dependence on team dynamics, and the need for essential product changes, making additional planning indispensable. This was reinforced by the early conduct of the workshop and accompanying uncertain data status. However, participants also pointed out that a 3P workshop does not have to deliver a perfect result and that the overall quality will only become apparent in the subsequent ramp-up workshop. This minimizes the pressure and opens the space to test different scenarios, which can then be reviewed at the following workshop.
Table 8 presents the summarized results of the focus group. The category system on successes and challenges of using the VR system in the 3P workshop is based on the constructs of the acceptance questionnaire and includes the main categories of (1) Behavioral Intention, (2) Performance Expectancy, (3) Effort Expectancy, (4) Facilitating Conditions, and (5) Task-Technology Fit. The Social Influence category was removed due to a missing set of mentions. The six main categories contain 13 subcategories for successes and 13 for challenges.
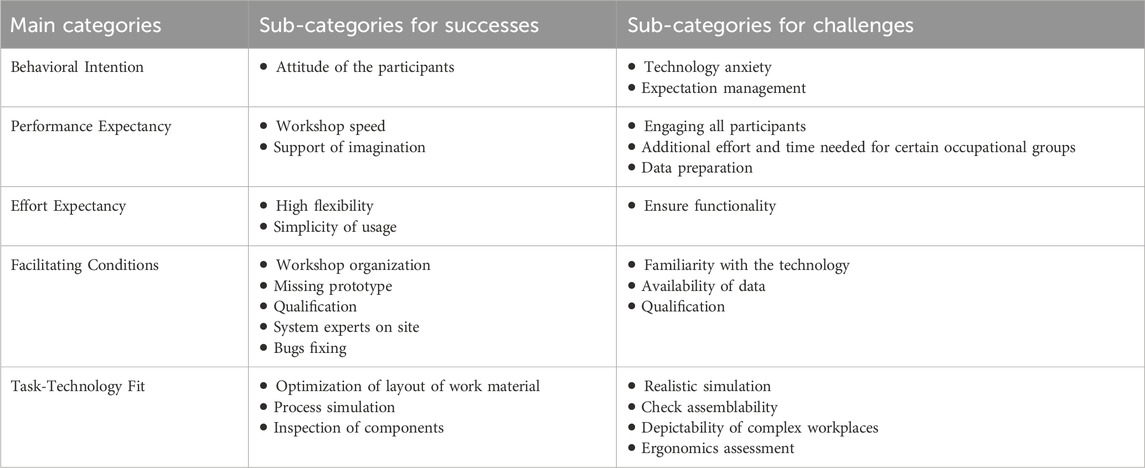
Table 8. Category system for successes and challenges regarding the use of VR in the 3P Workshop.
In the main category of behavioral intention, focus group participants mentioned both successes and challenges. On the one hand, it was emphasized that the attitude of the participants has changed compared to previous attempts to conduct prototype-free 3P workshops towards a higher acceptance. One participant mentioned: “In the last virtual workshop, people were still saying that you cannot work without prototypes.” On the other hand, it was also stressed that people’s attitudes toward the technology are highly dependent on the person and that work should be done in the future to introduce people to the technology: “People on the teams had varying levels of acceptance of VR technology. Some have been very reluctant. It is important to work on taking away people’s fear, shyness.”
Factors that were highlighted as positive by participants are the speed of the workshop and the support of imagination provided by the technology. One participant said: “We were able to look at cable harnesses as a whole. We were able to look at the clips and clamps for mounting individually. Rotating [components] in VR is easier than clicking through a PDM (Product Data Management) sheet.” In contrast, challenges were the increased effort required to change the cycle; the extra work of certain professional groups, such as the virtual assembly planners, ensuring that the technology works properly; and the effort that has to be put into data preparation. “The whole preparation apparatus required very detailed planning. As a result, many had to do more than usual. Above all, the process planners had to work in parallel. They had to make sure that the cycles were all up to date.”
Regarding effort expectancy, success factors were a high flexibility of adding assets as well as the simplicity of using the system. “What was really good, there is a lot to praise. The operation of the whole tool was great. There was a lot of concern, because many people are not familiar with the technology, but the application could really compensate for that.” On the challenges side, participants highlighted the difficulty of ensuring working hardware without support from those knowledgeable. One participant commented, “It was a challenge to get everything [VR equipment] to work. The virtual assembly planners helped oversee the technology. Without them, it would not have been possible [to run 3P workshops with VR].”
If the main category of facilitating conditions is considered, it becomes apparent that the participants emphasized above all the constant availability of knowledgeable people in the workshop as well as the fast elimination of bugs in the software. One person commented, “And we always had someone there who was really well prepared and was an expert in working with the system.” However, another person countered this with, “We did not have the opportunity to qualify them [the team spokespeople] beforehand. They have their tasks and their team. They rotate shifts when they have to fill in for their people.” This statement alludes to the challenges of some stakeholders’ lack of qualifications prior to the workshop.
In the last main category, ‘Task-Technology Fit’, participants highlighted that the technology is well suited for process simulation, component observation, as well as material setup. This is underlined by the statement of one participant: “What does the component look like? How can it be assembled? That can be done in VR.” Other tasks, however, are listed as challenging. Among them, for example, tasks such as the realistic simulation of the assembly process due to missing haptics or flexible components that cannot be illustrated, as well as the evaluation of ergonomics. One participant’s statement on this was, “VR has its limits: Support, forces, deforming and bending parts. I do not know if the component deforms by itself or if I have to apply a lot of force.”
Beyond the successes and challenges of a VR-assisted 3P workshop, participants discussed the differences between 3P workshops using physical prototypes and VR systems. The results are shown in Table 9. The table shows opposite statements within one category. If arguments are mentioned for one workshop type only, the opposite row was left empty.
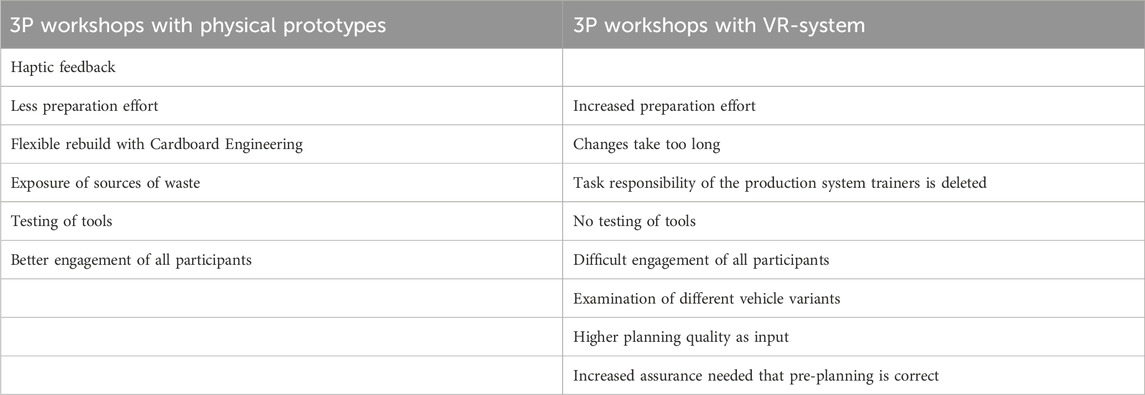
Table 9. Comparison of the execution types of 3P workshops (VR vs physical prototypes).
The following primarily highlights the categories that have not already been pointed out or explained in the successes and challenges. In the group discussion, the characteristics of physical prototype workshops compared to VR workshops were discussed. This included emphasizing the differences in rapid testing of changes, detailed assessment of the assembly sequence, and increased group engagement. In the group discussion, it was highlighted that workshops with physical prototypes allowed for rapid testing of changes through replication with cardboard. This ease of testing was compared to VR workshops where the process can take more time. One participant noted, “In the physical 3P, I can also just replicate something. Then I take a piece of cardboard and rebuild it. Then we just recreated what we need. That just takes too long in VR.” In addition, workshops with physical prototypes had the advantage of facilitating actual testing of tools and allowing more detailed evaluation of assembly processes. In addition, the presence of prototypes encouraged active engagement and participation from all workshop attendees, regardless of their occupational group. One participant summarized, “There was a very different group dynamic in the prototype workshop. The team spokesmen are more active in the prototype workshop, more engaged, and share more of their concerns.” In contrast, the VR workshop presented a challenge in achieving a similar level of engagement: “With the VR glasses, the person is removed from the group. The dynamic brainstorming does not happen. It would be different if we had more glasses.”
In contrast, the incorporation of lean management concepts became evident in the VR discussion and led to changes in the role and responsibilities of the “organization” professional group, which experienced reduced demand for lean management practices during the physical workshops due to the improved planning quality provided by the VR simulation. During the 3P workshops with VR, there was an important focus on integrating lean management concepts into the discussions. Representatives from the organizational professional group emphasized that the introduction of VR simulation not only made it more difficult to identify sources of waste, but also had an impact on tasks traditionally associated with their role. Specifically, the physical workshops that previously aimed to promote lean management and educate participants lost these aspects due to the improved planning quality enabled by VR simulation. This shift in dynamic was illustrated by one participant’s statement, “The planners in my workshops brought so much knowledge that I felt my role as an expert on the production system was no longer required.”
In addition to the comparison, the discussants emphasized that both types of 3P workshops involve uncertainties and leave points open but focus on different information. “The result fits to some extent, even if there are still some open points. However, there are also open points afterwards, when using a prototype. They are just different ones.” Because even if haptic feedback is missing as information in VR, pre-production parts in prototype workshops also do not behave like production parts.
Finally, participants expressed how the workshops can be modified for future deployments of the technology. Three main categories were named: Familiarity with the technology, timing of use of the technology, and complexity of the assembly scope. Regarding the familiarity with the technology, one participant commented, “You have peace before [the workshops start], people are not watching yet. It is more comfortable to set up [in silence, without an audience]." In addition to being familiar with the application, this is to ensure that the full functionality of the app is employed in the workshop. Behind the timing of the use stands the desire to use the technology before the workshop for tasks regarding process planning and to have a look at the processes in advance. And behind the complexity dependency is the desire to use the technology for planning scopes that are suitable for the technology. For complex planning scopes that cannot be fully covered with VR technology, the desire to use a prototype was expressed. Thus, a hybrid concept was proposed. The hybrid concept was also highlighted in the main category workshop concept. Furthermore, the subcategories of involving all participants as well as revision of the workshop concept are summarized in this main category. Regarding the inclusion of all participants, one person said, “The workshop just takes on a whole different dynamic. If everyone had glasses on, it would be another story.” The last main category that could be extracted from the discussion was concerning data. This includes the subcategories of data actuality and correctness, as well as system integration for continuous data availability. The need for actuality and correctness was supported by the following statement in the focus group: “We need better preparation. Cross-check the data status beforehand [before the workshop]. It was annoying during the ongoing workshop to have to check the data for the next week.” The subcategory of system integration entails the wish to easily integrate the results from the 3P workshops into existing data-carrying systems.
4 Discussion
Great expectations are placed on the use of VR applications in the participatory design of workplaces to make PDP more efficient (Bernhagen et al., 2022). To enable the successful introduction of this technology, acceptance plays a decisive role. This is dependent on various factors, including the suitability of the technology for the work task (Wang et al., 2020) and the perceived UX (Mlekus et al., 2020). This paper examined user acceptance of VR technology in 3P workshops and contributing factors such as UX and TTF. The findings are discussed in the following.
4.1 Descriptive measures of the UTAUT
The results of the acceptance questionnaire, including the TTF, showed that all scores fell in the low positive range on a Likert scale ranging from +3 to −3. Of particular note were the higher scores for EE (M = .92) and FC (M = 1.03). This was supported by focus group participants who emphasized that the use of VR significantly increased flexibility and ease of use, although they acknowledged the need for continued readiness of the technology. In contrast, SI (M = .22) and PE (M = .26) received the lowest scores. The low relevance of SI resulted from the voluntary nature of technology use, while several challenges were cited for PE, such as difficulty integrating all participants into the workshop event and the additional effort required to expedite the workshop and support imaginative activities. The slightly positive TTF rating (M = .39) was supported by the balanced arguments of the focus group participants.
The UX evaluation of the app resulted in a positive benchmark for the attractiveness and hedonic quality scales and a neutral benchmark for the pragmatic quality scale (User Experience Questionnaire (UEQ, 2022), n.d.). This contributed to an overall positive rating of the UX (M = .83) of the VR application, a perception that was confirmed by the highly positive comments of focus group participants, who particularly praised the presentation and usability of the application.
Taken together, these results revealed a satisfactory rating for BI (M = .49) in relation to the implementation of 3P workshops.
Furthermore, 72% of all subjects said they intended to use the VR technology in 3P workshops either “when needed” or “permanently”. Giving further reason to the assumption that the VR technology is well accepted for 3P workshops. This is underlined by the fact that in the focus group, subjects asked for both prototypes and VR technology to be used complementary.
4.2 Difference between occupational groups
In terms of occupational groups, a significant difference was observed between the adoption of VR technology for 3P workshops, with the “operation” group showing higher adoption compared to the “planning” group (Figure 6). TTF also showed an occupational effect, with both the “planning” and “organization” groups showing a lower TTF compared to the “operations” group, suggesting that TTF may be lower for “white collar” professionals than for “blue collar” professionals (Figure 6).
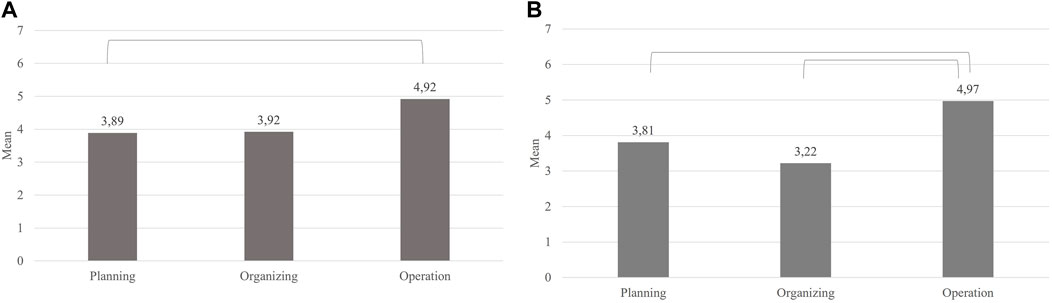
Figure 6. (A) Significant main effect between Planning and Operation for BI. (B) Significant main effects between Planning, Organizing and Operations for TTF.
The strong correlation between TTF and BI suggests that there is a relationship between the constructs of TTF and BI. A plausible explanation for the differences in the adoption and TTF between occupational groups could be due to differences in the suitability of VR technology for their respective tasks. The operational group primarily evaluated assembly tasks, which fit well with the capabilities of the application. However, the planning group had additional tasks, such as ergonomics analysis, for which VR technology proved not as suitable. For example, the evaluation of weight and force in assembling parts, an important ergonomic aspect, could not be effectively evaluated in VR. As expressed in the focus group, “I found it extremely difficult to do the ergonomics assessment [in VR]. I can also look at the shoring height in the line. Forces are interesting to me. How hard do I have to press something [component] in? I cannot evaluate that in VR.” This results in reservations regarding the feasibility and quality of the workstation optimizations and ergonomic assessment. If necessary, the planning professionals must make additional efforts to address any post-implementation concerns.
Another factor contributing to the lower TTF in the planning group could be the increased workload for virtual planning engineers when using VR technology compared to traditional 3P workshops. Extensive data preparation and ensuring high data quality took a lot of time, as reflected in the quote, “We need better [data] preparation. Cross-check the data status beforehand [before the workshop]. It was annoying during the ongoing workshop to have to check the data for the next week.” The need to check the data beforehand was recognized after: “A part was missing [in the workshop], which we wanted to review on Monday morning.” In addition, issues with low flexibility arose, as implementing changes in the 3D data to adjust the design within tight project deadlines was often a challenge.
The “organization” group felt somewhat obsolete in their role, as the virtual 3P workshops were preceded by necessary extensive planning that resulted in a higher level of overall planning compared to traditional workshops. Consequently, they identified fewer optimizations than in traditional workshops. As evidenced by the statement, “The planners in my workshops brought so much knowledge that my role as an expert of the production system was no longer much in demand.” Nevertheless, their role changed significantly to focus on facilitating the workshops, bridging the gap between participants actively using VR technology and those observing VR simulations to facilitate group discussions. This significant role change may require additional support to facilitate a smooth transition.
With respect to the age group factor, a main effect on TTF was found, although post-hoc tests did not reach significance. Thus, it remains unclear for which age groups differences were found and in which direction they point. To resolve this ambiguity, further research should be conducted to determine a possible relationship between age and TTF, considering possible confounding effects related to occupation.
4.3 Relation between BI, UX and TTF
It has been shown that UX, TTF and BI are significantly positively correlated with each other, indicating that these constructs are interrelated. Moreover, 55% of variance within BI is explained by TTF and UX measures. It shows that UX and TTF have an impact on BI and should be considered as important determinants for BI. Thus, our findings support previous research that both UX and TTF influence BI and thus the acceptance of individuals toward a technology (Mlekus et al., 2020; Wang et al., 2020). For future use cases, close attention should be paid to the fit between VR and the tasks being conducted. And to invest resources into good UX of the software application to facilitate user adoption.
4.4 Impact of actively using the VR system
No impact on BI was found for active use of the VR system compared to observing the virtual scene from the outside. This might indicate that the software supports both groups to a similar degree regarding UX and task-technology fit, leading to similar BI measures.
4.5 Implications
The results of this study indicate a strong inclination (84%) towards virtual 3P workshops using VR technology, while only 6% prefer virtual 3P workshops using 2D planning software. These findings demonstrate the successful achievement of providing a viable alternative to conducting 3P workshops without a physical prototype through the use of a VR software application and technology. However, the preference for conducting 3P workshops with a physical prototype remains, as 63% of participants favored its use. Despite positive measures for UX, TTF, and BI, they were in the low positives, suggesting room for improvement. The findings from the focus group shed light on potential reasons and prerequisites for adopting VR technology in 3P workshops, aligning with the socio-technical systems approach, emphasizing the significance of considering social and technical components together for effective system functioning (Trist and Bamforth, 1951).
Extracting important determinants for the use of VR technology in 3P workshops from the questionnaire results and focus group findings, critical factors for successful adoption were identified. These include an adequate qualification concept, availability and quality of data, suitability for workshop activities, and support for the change process triggered by the technology. Proper qualification is crucial to ensure that all participants are well-prepared and familiar with the application’s usage and functionality, optimizing the potential of VR technology within 3P workshops. Thus, underlining the findings of Benešová and Tupa (2017), that qualification of the workforce plays a decisive role in Industry 4.0. Only with a suitable qualification concept can the success of the cyber-physical systems in the digital factory be achieved.
The availability, accuracy, and accessibility of 3D data are pivotal, as they impact the perception of VR technology and the cost-effectiveness of data preparation. Building a robust data infrastructure and implementing effective data maintenance procedures are essential for the successful integration of virtual technologies. This has already been highlighted by Oztemel and Gursev (2018). They stated that the efficient exchange and availability of data are central elements of Industry 4.0 and are therefore crucial to success. In building on this, facilitating the automated transfer of results from 3P workshops into data management systems would further promote the adoption of VR by streamlining documentation and data maintenance processes downstream.
Moderators, facing significant role changes, require support and resources to navigate these transitions and ensure the technology’s acceptance. This could potentially also help to mediate anxieties regarding the new technology. Dealing with significant changes in work roles, not only for moderators, makes a user-centered approach to change processes useful, based on the recommendations of Zettl et al. (2022). Complementing the user-centered design process, the implementation of measures to increase acceptance is crucial not only for the technology but also for the required transformation process.
While the analysis of quantitative data showed no differences between VR users and desktop observers, the insights from the focus group emphasized the challenges of engaging all workshop participants as well as facilitating cooperation among them. Thus, ensuring sufficient hardware equipment to allow all participants to take part in VR simulations is another recommendation to enhance group dynamics and bridge the gap between virtuality and reality. For this it is important to either make VR HMDs available for all users or adapt the workshop concept to make it more suitable for cross-reality collaboration.
The limited TTF for certain occupational groups is a barrier to the widespread adoption of VR technology in 3P workshops, especially in workplaces with complex assembly tasks. Challenges arise, for example, in the limited ergonomic analysis, as accurate assessment of weight and pressure force is difficult, which affects the reliability of workshop results and leads to uncertainty. For this reason, it is advisable to classify the workstations under consideration in advance in terms of whether it makes sense to use VR.
4.6 Limitations and future work
The present study was conducted as a field study in the context of a productive 3P workshop, which ensures external validity; however, this approach presents challenges for internal validity. A major limitation stems from the over- and under-representation of certain professional groups. In particular, the organizer group was severely underrepresented, with only 7% of participants in this category, compared to 51% in the operational group and 39% in the planning group. While this distribution is consistent with the actual composition of the workshop, it poses a problem in terms of achieving statistical significance and ensuring equal representation of all groups. In addition, the focus groups could only be conducted with individuals from the professional groups of planners and organizers, which meant that the operational group was not represented in the qualitative data set. These limitations stem in part from the nature of conducting field studies and internal organizational barriers to conducting user research. Specifically, the clock-bound nature of the representatives makes it difficult if not impossible to pull them out of their jobs to avoid production bottlenecks and economic consequences. Therefore, further research is needed to investigate why the “operations” group has higher technology adoption in 3P workshops than the “planning” group and what influence the “organization” group has in this context. Furthermore, the exclusion of two age groups due to the small sample size could influence the observed relationship between age group and BI. Consequently, further research with a larger sample is needed to thoroughly investigate the influence of age on BI.
In addition to the limitations associated with field studies, there are issues with the interpretability of various aspects of VR technology. The VR system consists of VR software, hardware, and interactive 3D data scenes, and any perceived deficiency in one component may negatively affect the overall perception of the VR system. Since users are not familiar with the individual components, it must be assumed that the VR system was evaluated as a whole. For example, data preparation issues could cause parts to not interact, leading users to attribute the problem to the software rather than the data preparation process. Further support for this was evident in the focus group where the participants evaluated the different aspects of the VR system differently. For instance, a part which the participants planned on reviewing in the workshop was missing due to data preparation issues. This led to dissatisfaction with the new technology among the workshop participants. Moreover, the participants emphasized the simple and good usability of the software but pointed out that a simulation with the current hardware is only realistic to a limited extent, as it does not allow for the representation of pressure forces, for example,. In addition, the UEQ questionnaire does not specifically address the UX of the technical hardware, leading to ambiguity about the perceived UX of individual components and key areas for improvement. Consequently, further research, such as the use of the VRUSE questionnaire (Kalawsky, 1999) and qualitative methods, is needed to gain deeper insights into the usability of hardware and software. However, the decision not to use the VRUSE questionnaire was due to the length of the questionnaire and the limited time resources available.
As described in the focus groups, a final assessment of the quality of planned processes with VR support can only be made after implementation. Therefore, in future research projects, continuous monitoring of acceptance over several survey periods should be undertaken to better assess and understand acceptance dynamics over time.
4.7 Conclusion
In conclusion, with the growing influx of advanced technologies in the manufacturing industry, companies need to ensure employee adoption of these innovations. This empirical study provides initial insights into the acceptance of VR technologies in 3P workshops, highlighting the influence of TTF and UX as well as different perceptions among specific occupational groups after productive use of the technology in a real-world context. In addition to prioritizing a user-centered design of the application, a user-centered approach to the change process in particular proves critical, as it allows the concerns of different professional groups to be addressed at the start. The results also suggest that beyond its basic applicability, VR technology holds promise for realizing the efficiency gains that organizations seek.
Overall, the successful delivery of 3P workshops using VR technology is possible. Nevertheless, challenges related to TTF, data preparation, and changing work roles must be considered. Overcoming these challenges requires far-reaching measures that include making tasks suitable for VR use, providing sufficient VR equipment, comprehensive training, ensuring high data quality, and supporting organizational groups. By implementing these measures, organizations can create the necessary infrastructure for successful integration of VR technology.
Data availability statement
The datasets presented in this article are not readily available because Company approval to publish raw data must be obtained. Requests to access the datasets should be directed to AH, alma.hertwig@audi.de.
Author contributions
AH: Conceptualization, Formal Analysis, Investigation, Methodology, Writing–original draft, Writing–review and editing. AB: Conceptualization, Formal Analysis, Investigation, Methodology, Writing–original draft, Writing–review and editing. MF: Writing–review and editing.
Funding
The author(s) declare that no financial support was received for the research, authorship, and/or publication of this article.
Conflict of interest
Author AH was employed by AUDI AG. Author AB was employed by Volkswagen AG.
The remaining author declares that the research was conducted in the absence of any commercial or financial relationships that could be construed as a potential conflict of interest.
Publisher’s note
All claims expressed in this article are solely those of the authors and do not necessarily represent those of their affiliated organizations, or those of the publisher, the editors and the reviewers. Any product that may be evaluated in this article, or claim that may be made by its manufacturer, is not guaranteed or endorsed by the publisher.
Supplementary material
The Supplementary Material for this article can be found online at: https://www.frontiersin.org/articles/10.3389/frvir.2024.1268780/full#supplementary-material
References
Abdu, Y. A., Peter, O., and Gupta, U. K. (2016) Lean concepts and methods: 3P, international Journal of scientific Research in computer science, Engineering and information technology, 1(2), pp. 20–24.
Alberola, C., and Brau, H. (2017). Messung der User Experience von Services mithilfe des UEQ: Validierung des User Experience Questionnaire zur Anwendung auf Dienstleistungen. Usability Prof. Available at:. doi:10.18420/muc2017-up-0179
Alotaibi, S. J., and Wald, M. (2013). Evaluation of the UTAUT model for acceptable user experiences in e-Government physical and virtual identity access management systems, in Onference: 8th IEEE International Conference for Internet Technology and Secured Transactions (ICITST-2013), London, Dec 12, 2013. Available at: https://eprints.soton.ac.uk/358843/.
Al-Saedi, K., Al-Emran, M., Ramayah, R., and Abusham, E. (2020). Developing a general extended UTAUT model for M-payment adoption. Technol. Soc. 62, 101293. Available at:. doi:10.1016/j.techsoc.2020.101293
Anjum, M. A., and Parvez, A. (2013). Counterproductive behavior at work: a comparison of blue collar and white collar workers. Pak. J. Commer. Soc. Sci. (PJCSS) 7 (3), 417–434. Available at: https://www.econstor.eu/bitstream/10419/188101/1/pjcss134.pdf.
Bade, C. (2012). Untersuchungen Zum Einsatz der Augmented Reality Technologie Für Soll/Ist-Vergleiche Von Betriebsmitteln in der Fertigungsplanung.
Benešová, A., and Tupa, J. (2017). Requirements for education and qualification of people in industry 4.0. Procedia Manuf. 11, 2195–2202. Available at:. doi:10.1016/j.promfg.2017.07.366
Bernhagen, M., Kaiser, A., Bullinger, A. C., Jünemann, M., Rzepus, J., Melzer, A., et al. (2022). “Mitarbeiterzentriertes Gestalten und Unterstützen menschlicher Arbeit in der Montage mittels virtueller Technologien,” in Springer eBooks (China: Springer), 279–314. Available at:. doi:10.1007/978-3-662-64803-2_9
Bracht, U., Geckler, D., and Wenzel, S. (2018). Digitale Fabrik: Methoden und Praxisbeispiele. Germany: Springer-Verlag.
Brade, J., Lorenz, M., Busch, M., Hammer, N., Tscheligi, M., and Klimant, P. (2017). Being there again – presence in real and virtual environments and its relation to usability and user experience using a mobile navigation task. Int. J. Human-Computer Stud. 101, 76–87. doi:10.1016/j.ijhcs.2017.01.004
Brunkow, P., and Hub, M. (2018). Zur Relevanz der Akzeptanz virtueller Techniken/Relevance of user acceptance of virtual technology. Werkstattstech. 1997. Internet 108 (03), 162–168. Available at. doi:10.37544/1436-4980-2018-03-58
Brunner, B. (2017). “Japanische erfolgskonzepte: KAIZEN, KVP, lean production management, total productive maintenance, shopfloor management, toyota production system,” in GD3 - lean development. 4th edn. (München: Carl Hanser Verlag).
Bullinger, H.-J. (1997). Dienstleistungen für das 21. Jahrhundert. Gestaltung des Wandels und Aufbruch in die Zukunft. Available at: https://publica.fraunhofer.de/entities/publication/f375c6f1-ea7d-4f6a-847e-dfa760ff076c/details.
Chen, Y., Tan, Y., and Wang, Y. (2023). Micro World – exploring the Microbial Kingdom’: design and testing of a microbial VR science product. Interact. Learn. Environ., 1–21. Available at:. doi:10.1080/10494820.2023.2211640
Choi, S.-H., Jung, K., and Noh, S. D. (2015). Virtual reality applications in manufacturing industries: past research, present findings, and future directions. Concurr. Eng. 23 (1), 40–63. Available at:. doi:10.1177/1063293x14568814
Cohen, J. (1988). Statistical power analysis for the behavioral Sciences. 2nd edn. USA: Lawrence Erlbaum Associates.
Coletta, A. R. (2012). The lean 3P advantage: a practitioner’s guide to the production preparation process.
Dangelmaier, W., Fischer, M., Gausemeier, J., Grafe, M., Matsczok, C., and Mueack, B. (2005). Virtual and augmented reality support for discrete manufacturing system simulation. Comput. Industry 56 (4), S. 371–383. doi:10.1016/j.compind.2005.01.007
Daoud, J. I. (2017). Multicollinearity and regression analysis. J. Phys. 949, 012009. Available at:. doi:10.1088/1742-6596/949/1/012009
Davis, F. D. (1993). User acceptance of information technology: system characteristics, user perceptions and behavioral impacts. Int. J. Man-machine Stud. 38 (3), 475–487. Available at:. doi:10.1006/imms.1993.1022
Dillerup, R., Witzemann, T., Schacht, S., and Schaller, L. (2019). Planung im digitalen Zeitalter. Control. Manag. Rev. 63 (3), 46–53. Available at:. doi:10.1007/s12176-019-0011-z
Dörner, R., Broll, W., Grimm, P., and Jung, B. (2013) “Virtual und Augmented Reality (VR/AR),”. Germany: eXamen.press. Springer Nature. Available at:. doi:10.1007/978-3-642-28903-3
Dörner, R., Broll, W., Jung, B., Grimm, P., and Göbel, M. (2019). Einführung in Virtual und Augmented Reality. Germany: Springer eBooks, 1–42. Available at:. doi:10.1007/978-3-662-58861-1_1
Dwivedi, Y. K., Rana, N. P., Chen, H., and Williams, M. D. (2011). “A meta-analysis of the unified theory of acceptance and use of technology (UTAUT),” in Governance and sustainability in information systems. Managing the transfer and diffusion of IT. Editors M. Nüttgens, A. Gadatsch, K. Kautz, I. Schirmer, and N. Blinn (Berlin: Springer).
Eversheim, W. (2013). Organisation in der Produktionstechnik 3: Arbeitsvorbereitung. Germany: Springer-Verlag.
Feldhusen, J., and Grote, K.-H. (2013). Pahl/Beitz Konstruktionslehre: Methoden und Anwendung erfolgreicher Produktentwicklung. Germany: Springer-Verlag.
Finch, H. (2005). Comparison of the performance of nonparametric and parametric MANOVA test statistics when assumptions are violated. Methodol. Eur. J. Res. Methods Behav. Soc. Sci. 1 (1), 27–38. Available at:. doi:10.1027/1614-1881.1.1.27
Fleischmann, A.-C. (2016) Gestensteuerung zur Optimierung der Informationsprozesse. Available at:. doi:10.1007/978-3-658-15670-1
Freyer, B. (2020). “Simulation der Produktion,” in Virtual Reality und Augmented Reality in der Digitalen Produktion (Wiesbaden: Springer Fachmedien Wiesbaden), 399–417.
Gaitzsch, T., and Ziegler, V. (2010). “Shop floor empowerment – KVP-implementierung in schichtteams,” in Gabler eBooks (USA: Gabler), 169–190. Available at:. doi:10.1007/978-3-8349-8572-9_9
Gao, B. Y., Mai, Z., Tu, H., and Duh, H. B. L. (2021) Evaluation of body-centric locomotion with different transfer functions in virtual reality. , Available at:. doi:10.1109/vr50410.2021.00073
Goodhue, D. L. (2007). Task-Technology Fit: a critical (but often missing!) Construct in models of information systems. Human-computer Interact. Manag. Inf. Syst. Found. 5, 184–204.
Goodhue, D. L., and Thompson, R. W. (1995). Task-technology fit and individual performance. Manag. Inf. Syst. Q. 19 (2), 213. Available at:. doi:10.2307/249689
Harborth, D., and Pape, S. (2018) “German translation of the unified theory of acceptance and use of technology 2 (UTAUT2) questionnaire,” Soc. Sci. Res. Netw. Available at:. doi:10.2139/ssrn.3147708
Heinig, M. (2015) Nutzung von Virtuellen Technologien für die Montageplanung von Unikaten. Available at:. doi:10.15480/882.1234
Högg, R. (2010). Erweiterung und Evaluation des Technologieakzeptanzmodells zur Anwendung bei mobilen Datendiensten.
International Organization for Standardization (2019). Ergonomics of human system interaction-Part 210: human-centred design for interactive systems. ISO 9241-210:2019.
Isaac, O., Aldholay, A., Abdullah, Z., and Ramayah, T. (2019). Online learning usage within Yemeni higher education: the role of compatibility and task-technology fit as mediating variables in the IS success model. Comput. Educ. 136, 113–129. Available at:. doi:10.1016/j.compedu.2019.02.012
Jerdan, S., Grindle, M., van Woerden, H. C., and Kamel Boulos, M. N. (2018). Head-mounted virtual reality and mental health: critical review of current research. JMIR Serious Games 6 (3), e14. Available at:. doi:10.2196/games.9226
Jonas, C. (2000). Konzept einer durchgängigen, rechnergestützten Planung von Montageanlagen. Herbert Utz Verl.
Kaiser, A., Melzer, H., and Bullinger, A. C. (2020) “Arbeitsplanung in der Virtuellen Realität (VR) – relevante Funktionen und deren Entwicklungsaufwand,”.GfA, Dortm. (Hrsg.) Frühjahrskongress 2020.
Kalawsky, R. S. (1999). VRUSE—a computerised diagnostic tool: for usability evaluation of virtual/synthetic environment systems. Appl. Ergon. 30 (1), 11–25. Available at:. doi:10.1016/s0003-6870(98)00047-7
Kampker, A., Wessel, S., Lutz, N., Bildhauer, M., and Hehl, M. (2020). Holistic integration of a VR solution into the planning process of scalable production systems. Procedia CIRP 88, 133–138. doi:10.1016/j.procir.2020.05.024
Kerber, S. (2016). Prozessgestaltung zum einsatz digitaler fabrikgesamtmodelle. Germany: Springer eBooks. Available at:. doi:10.1007/978-3-658-14110-3
Kersten, T. P., Drenkhan, D., and Deggim, S. (2021). Virtual reality application of the fortress Al zubarah in Qatar including performance analysis of real-time visualisation. KN - J. Cartogr. Geogr. Inf. 71 (4), 241–251. Available at:. doi:10.1007/s42489-021-00092-1
Kober, S. E., Kurzmann, J., and Neuper, C. (2012). Cortical correlate of spatial presence in 2D and 3D interactive virtual reality: an EEG study. Int. J. Psychophysiol. 83 (3), 365–374. Available at:. doi:10.1016/j.ijpsycho.2011.12.003
Kühn, W. (2006). Digitale fabrik. Carl Hanser Verlag GmbH Co. KG Eb. Available at:. doi:10.3139/9783446408661
Kunz, A. (2020). Der Einsatz der virtuellen Realität zur digitalen Planung von Produktionsprozessen. Virtual Real. und Augmented Real. der Digitalen Produktion, 217–236. doi:10.1007/978-3-658-29009-2_11
Landherr, M., Neumann, M., Volkmann, J., and Constantinescu, C. (2013). “Digitale fabrik,” in Digitale produktion (Germany: Springer Verlag), 107–131.
Laugwitz, B., Held, T., and Schrepp, M. (2008). Construction and evaluation of a user experience questionnaire. Lect. Notes Comput. Sci. S, 63–76. doi:10.1007/978-3-540-89350-9_6
Löher, J., Brink, S., Becker, F., Icks, A., Schneck, S., and Schröder, C. (2022). Digitalisierungsprozesse von KMU im verarbeitenden Gewerbe - Folgebefragung. Available at: https://www.econstor.eu/handle/10419/249920.
Lotter, B., Hartung, J., and Wiendahl, H.-P. (2012). Altersneutrale montagegestaltung. Germany: Springer eBooks, 419–441. Available at:. doi:10.1007/978-3-642-29061-9_16
Mayer, H. O. (2012). Interview und schriftliche Befragung: Grundlagen und Methoden empirischer Sozialforschung. USA: Walter de Gruyter.
Menck, N., Yang, X., Weidig, C., Winkes, P., Lauer, C., Hagen, H., et al. (2012). Collaborative factory planning in virtual reality. Procedia CIRP 3, 317–322. Available at:. doi:10.1016/j.procir.2012.07.055
Michniewicz, J. (2019). Automatische simulationsgestützte Arbeitsplanung in der Montage [dissertation]. China: Technische Universität München. [München].
Milgram, P., and Kishino, F. (1994). A taxonomy of mixed reality visual displays. IEICE Trans. Inf. Syst. 77 (12), 1321–1329. Available at: https://cs.gmu.edu/∼zduric/cs499/Readings/r76JBo-Milgram_IEICE_1994.pdf.
Mlekus, L., Bentler, D., Paruzel, A., Katp-Beiderwieden, A.-L., and Maier, G. W. (2020). How to raise technology acceptance: user experience characteristics as technology-inherent determinants. Gruppe. Interakt. Organ. Z. Für Angew. Organ. (Gio) 51 (3), 273–283. Available at:. doi:10.1007/s11612-020-00529-7
Mujber, T. S., Szecsi, T., and Hashmi, M. S. J. (2004). Virtual reality applications in manufacturing process simulation. J. Mater. Process. Technol. 155–156, 1834–1838. Available at:. doi:10.1016/j.jmatprotec.2004.04.401
Neyer, F. J., Felber, J., and Gebhardt, C. (2012). Entwicklung und Validierung einer Kurzskala zur Erfassung von Technikbereitschaft. Diagnostica 58 (2), 87–99. Available at:. doi:10.1026/0012-1924/a000067
Otto, M., Prieur, M., Agethen, P., and Rukzio, E. (2016). Dual reality for production verification workshops: a comprehensive set of virtual methods. Procedia CIRP 44, 38–43. Available at:. doi:10.1016/j.procir.2016.02.140
Oztemel, E., and Gürsev, S. (2018). Literature review of Industry 4.0 and related technologies. J. Intelligent Manuf. 31 (1), 127–182. Available at:. doi:10.1007/s10845-018-1433-8
Pangestu, K. K., Suryanto, T. L. M., and Wibowo, N. C. (2023). An evaluation of user experience for 360° UPN virtual tour. 7st Int. Seminar Res. Mon. 2022. NST Proc., 345–352. doi:10.11594/nstp.2023.335
Park, J., Gunn, F., Lee, Y., and Shim, S. (2015). Consumer acceptance of a revolutionary technology-driven product: the role of adoption in the industrial design development. J. Retail. Consumer Serv. 26, 115–124. Available at:. doi:10.1016/j.jretconser.2015.05.003
Pletz, C., and Zinn, B. (2018). Technologieakzeptanz von virtuellen Lern-und Arbeitsumgebungen in technischen Domänen. J. Tech. Educ. 6 (4). doi:10.48513/joted.v6i4.143
Plotzky, C., Lindwedel, U., Bejan, A., König, P., and Kunze, C. (2021). Virtual Reality in Healthcare Skills Training: the effects of presence on acceptance and increase of knowledge. I-com 20 (1), 73–83. Available at:. doi:10.1515/icom-2021-0008
Pokorni, B., Schlund, S., Findeisen, S., Tomm, A., Euper, D., MehlBrehm, D. N., et al. (2017). Produktionsassessment 4.0. ZWF 112 (1–2), 20–24. Available at:. doi:10.3139/104.111662
Porter, C. E., and Donthu, N. (2006). Using the technology acceptance model to explain how attitudes determine Internet usage: the role of perceived access barriers and demographics. J. Bus. Res. 59, 999–1007. Available at:. doi:10.1016/j.jbusres.2006.06.003
Reinhart, G., Patron, C., and Meier, P. (2002) “Virtual Reality und Augmented Reality in der Montage,” Wt Werkstattstechnik Online, China, (JG, 92).
Rudolf, H. (2007). Wissensbasierte Montageplanung in der digitalen Fabrik am Beispiel der Automobilindustrie.
Runde, C. (2020). VR-/AR-Anwendungsfelder im Produktionskontext. Germany: Springer eBooks, 51–73. Available at:. doi:10.1007/978-3-658-29009-2_4
Schack, R. (2008). Methodik zur bewertungsorientierten Skalierung der Digitalen Fabrik. Herbert Utz Verl.
Schenk, M. (2015). Produktion und Logistik mit Zukunft: Digital Engineering and Operation. Germany: Springer-Verlag.
Schmider, E., Ziegler, M., Danay, E., Beyer, L., and Bühner, M. (2010). Is it really robust? Methodol. Eur. J. Res. Methods Behav. Soc. Sci. 6 (4), 147–151. Available at:. doi:10.1027/1614-2241/a000016
Schmidt, A. F., and Finan, C. (2018). Linear regression and the normality assumption. J. Clin. Epidemiol. 98, 146–151. Available at:. doi:10.1016/j.jclinepi.2017.12.006
Schrepp, M., Hinderks, A., and Thomaschewski, J. (2017). Construction of a benchmark for the user experience questionnaire (UEQ). Int. J. Interact. Multimedia Artif. Intell. 4 (4), 40. Available at:. doi:10.9781/ijimai.2017.445
Schulz, M., Mack, B., and Renn, O. (2012). Fokusgruppen in der empirischen Sozialwissenschaft: Von der Konzeption bis zur Auswertung. Germany: Springer-Verlag.
Sendler, U. (2009). Das PLM-Kompendium: Referenzbuch des Produkt-Lebenszyklus-Managements. Germany: Springer Science and Business Media.
Seth, A., Vance, J. M., and Oliver, J. D. (2010). Virtual reality for assembly methods prototyping: a review. Virtual Real. 15 (1), 5–20. Available at:. doi:10.1007/s10055-009-0153-y
Shu, Y., Huang, Y. Z., Chang, S. H., and Chen, M. Y. (2018). Do virtual reality head-mounted displays make a difference? A comparison of presence and self-efficacy between head-mounted displays and desktop computer-facilitated virtual environments. Virtual Real. 23 (4), 437–446. Available at:. doi:10.1007/s10055-018-0376-x
Sochor, R., Kraus, L., Merkel, L., Braunreuther, S., and Reinhart, G. (2019). Approach to increase worker acceptance of cognitive assistance systems in manual assembly. Procedia CIRP 81, 926–931. Available at:. doi:10.1016/j.procir.2019.03.229
Somrak, A., Pogačnik, M., and Guna, J. (2021). Suitability and comparison of questionnaires assessing virtual reality-induced symptoms and effects and user experience in virtual environments. Sensors 21 (4), 1185. Available at:. doi:10.3390/s21041185
Talukder, M., Harris, H., and Mapunda, G. (2008). Adoption of innovations by individuals within organizations: an Australian study. Asia-Pacific Manag. Rev. 13 (2), 463–480. Available at:. doi:10.6126/apmr.2008.13.2.02
Tcha-Tokey, K., Christmann, O., Loup-Escande, E., and Richir, S. (2016). Proposition and validation of a questionnaire to measure the user experience in immersive virtual environments. Int. J. Virtual Real. 16 (1), 33–48. Available at:. doi:10.20870/ijvr.2016.16.1.2880
The jamovi project (2022). jamovi. Available at: https://www.jamovi.org.
Toshav-Eichner, N., and Bareket-Bojmel, L. (2021). Yesterday’s workers in Tomorrow’s world. Pers. Rev. 51 (5), 1553–1569. doi:10.1108/pr-02-2020-0088
Toyon, M. A. S. (2021). Explanatory sequential design of mixed methods research: phases and challenges. Int. J. Res. Bus. Soc. Sci. 10 (5), 253–260. doi:10.20525/ijrbs.v10i5.1262
Trist, E., and Bamforth, K. (1951). Some social and psychological consequences of the Longwall method of Coal-Getting. Hum. Relat. 4 (1), 3–38. Available at:. doi:10.1177/001872675100400101
UEQ (2022). User experience questionnaire (UEQ). Available at: https://www.ueqonline.org/.
Venkatesh, V., Morris, M. G., Davis, G. B., and Davis, F. D. (2003). User acceptance of information technology: toward a unified view. MIS Q. 27, 425. Available at:. doi:10.2307/30036540
Verein Deutscher Ingenieure (2008). VDI 4499 Part 1 digital factory – fundamentals. Available at: https://www.vdi.de/richtlinien/details/vdi-4499-blatt-1-digitale-fabrik-grundlagen.
Verein Deutscher Ingenieure (2011). VDI 5200 Part 1 factory plannung – planning procedures. Available at: https://www.vdi.de/richtlinien/details/vdi-5200-blatt-1-fabrikplanung-planungsvorgehen.
Wang, H., Tao, D., Yu, N., and Qu, X. (2020). Understanding consumer acceptance of healthcare wearable devices: an integrated model of UTAUT and TTF. Int. J. Med. Inf. 139, 104156. Available at:. doi:10.1016/j.ijmedinf.2020.104156
Weidner, R. S. (2014). Wissensbasierte Planung und Bearbeitung von Montagesystemen in der Luftfahrtindustrie. USA, Universität der Bundeswehr Hamburg.
Westkämper, E. (2006). Einführung in die Organisation der Produktion. Germany: Springer eBooks. Available at:. doi:10.1007/3-540-30764-8
Westkämper, E. (2013). Zukunftsperspektiven der digitalen Produktion. Germany: Springer eBooks, 309–327. Available at:. doi:10.1007/978-3-642-20259-9_24
Wiendahl, H.-P., Hernández, R. H., and Grienitz, V. (2002). Planung wandlungsfähiger fabriken. ZWF 97 (1–2), 12–17. Available at:. doi:10.3139/104.100499
Winkes, P. A., and Aurich, J. C. (2015). Method for an enhanced assembly planning process with systematic virtual reality inclusion. Procedia CIRP 37, 152–157. Available at:. doi:10.1016/j.procir.2015.08.007
Zettl, A., Trübswetter, A., Meißner, A., Jenny, M., and Glende, S. (2022). “User-centred change: new perspectives on technology development and implementation,” in Handbook of usability and user experience (USA: CRC Press), 107–116.
Keywords: virtual reality, UTAUT, technology acceptance, user experience (UX), task-technology fit (TTF), production preparation process (3P), 3P workshops, workplace design
Citation: Hertwig AF, Brandewiede A and Feufel MA (2024) Using virtual reality to support the design of work systems in 3P workshops: a use case from the automotive industry. Front. Virtual Real. 5:1268780. doi: 10.3389/frvir.2024.1268780
Received: 28 July 2023; Accepted: 19 June 2024;
Published: 11 July 2024.
Edited by:
Oliver Christ, University of Applied Sciences and Arts Northwestern Switzerland, SwitzerlandReviewed by:
Kai Wang, China United Network Communications Group, ChinaVerena Blumberg, Technical University of Braunschweig, Germany
Prajaks Jitngernmadan, Burapha University, Thailand
Copyright © 2024 Hertwig, Brandewiede and Feufel. This is an open-access article distributed under the terms of the Creative Commons Attribution License (CC BY). The use, distribution or reproduction in other forums is permitted, provided the original author(s) and the copyright owner(s) are credited and that the original publication in this journal is cited, in accordance with accepted academic practice. No use, distribution or reproduction is permitted which does not comply with these terms.
*Correspondence: Alma F. Hertwig, alma.hertwig@audi.de
†These authors have contributed equally to this work