 Jacob Stuart
 Anita Stephen
 Karen Aul
 Michael D. Bumbach
 Shari Huffman
 Brooke Russo
 Benjamin Lok
 - 1Department of Computer and Information Science and Engineering, Virtual Experiences Research Group, University of Florida, Gainesville, FL, Untited States
- 2College of Nursing, University of Florida, Gainesville, FL, Untited States
- 3College of Nursing, University of South Florida, Tampa, FL, Untited States
Introduction: Healthcare education commonly uses practices like moulage to represent visual cues (e.g., symptoms). Unfortunately, current practices have limitations in accurately representing visual symptoms that develop over time. To address this challenge, we applied augmented reality (AR) filters to images displayed on computer screens to enable real-time interactive visualizations of symptom development. Additionally, this study explores the impact of object and filter fidelity on users’ perceptions of visual cues during training, providing evidence-based recommendations on the effective use of filters in healthcare education.
Methods: We conducted a 2 × 2 within-subjects study that involved second-year nursing students (N = 55) from the University of Florida. The study manipulated two factors: filter fidelity and object fidelity. Filter fidelity was manipulated by applying either a filter based on a medical illustration image or a filter based on a real symptom image. Object fidelity was manipulated by overlaying the filter on either a medical manikin image or a real person image. To ensure that potential confounding variables such as lighting or 3D tracking did not affect the results, 101 images were pre-generated for each of the four conditions. These images mapped to the transparency levels of the filters, which ranged from 0 to 100. Participants interacted with the images on a computer screen using visual analog scales, manipulating the transparency of the symptoms until they identified changes occurring on the image and distinct symptom patterns. Participants also rated the severity and realism of each condition and provided feedback on how the filter and object fidelities impacted their perceptions.
Results: We found evidence that object and filter fidelity impacted user perceptions of symptom realism and severity and even affected users’ abilities to identify the symptoms. This includes symptoms being seen as more realistic when overlaid on the real person, symptoms being identified at earlier stages of development when overlaid on the manikin, and symptoms being seen as most severe when the real-image filter was overlayed on the manikin.
Conclusion: This work implemented a novel approach that uses AR filters to display visual cues that develop over time. Additionally, this work’s investigation into fidelity allows us to provide evidence-based recommendations on how and when AR filters can be effectively used in healthcare education.
1 Introduction
Learning to identify visual cues, such as patient symptoms, is an essential part of healthcare education (Huber and Epp, 2021). Visual cues are an important part of healthcare education because they lead to learners applying heuristics that affect decision-making (Sundar, 2008). A visual cue is an artifact that utilizes visual design elements to deliver information to observers (Xu and Liao, 2020). However, if visual cues contain inaccuracies or are unclear during training, learners may develop incorrect mental models that negatively affect future decision-making (Watts et al., 2021).
Healthcare education typically uses medical moulage on manikins and standardized patients to depict visual cues of symptoms (Wanat et al., 2013; Lammers et al., 2014; Hernández et al., 2016; Herron et al., 2017; Zorn et al., 2018). Moulage is the use of special effects makeup techniques to simulate visual and tactile cues such as illnesses, bruises, bleeding wounds, or other symptoms on manikins or standardized patients (Stokes-Parish et al., 2020). Unfortunately, moulage is often expensive, can require large amounts of time and expertise to apply, and is fixed and unchanging once applied (Stokes-Parish et al., 2019; 2020). The fixed nature of moulage prevents this standard practice from accurately displaying visual cues that develop over time, such as symptoms that develop continuously in real-time (e.g., hives, flushing, and pale skin) (Lee et al., 2003).
Projection-based manikins, virtual humans, and animations, such as those created by Daher et al. (Daher et al., 2018), Lok et al. (Lok, 2006), and BioDigital, 2023 can help to address this issue as stimuli appearance can be altered programmatically. However, projection-based manikins can be expensive and require complex, specialized setups, and virtual humans and animations do not provide the same physical interactivity as manikins or standardized patients Knapp et al. (2022).
Using AR filters, visual cues can be instantly overlaid on objects such as manikins, standardized patients, or medical illustrations (Noll et al., 2017; Liang et al., 2021; Stuart et al., 2022). Once overlaid, the visual cues can be altered programmatically to depict symptoms that develop over time or even adapt to the surface they are overlaid on. By using widely available AR filter technology, we can increase the accessibility and possibilities of visual cue training in healthcare education while limiting the drawbacks of projection-based manikins or virtual humans.
Before implementing AR filters to depict visual cues in healthcare education, it is important to understand how AR filters should be depicted and what type of healthcare education training they may be best suited for. To determine the answers to these questions, one area that must be investigated is the level of fidelity that should be used in AR healthcare simulations. Prior work provides evidence that fidelity can lead to various contributing factors toward users misperceiving visual cues. For example, fidelity can affect users’ spatial perceptions (Diaz et al., 2017; Ogawa et al., 2019; Do et al., 2020), perceptions of whether a visual cue is intentional (Stuart et al., 2022), perceptions of visual cue severity (Stuart et al., 2022), and fidelity can affect users’ cognitive load when trying to identify visual cues (Barbara et al., 2002; Plass et al., 2009). Further, simulation guidelines state that visual cues should use fidelity levels that create appropriate perceptions of realism (Watts et al., 2021). Prior work also indicates that both the fidelity of an AR overlay and the environment the overlay is placed on can affect user perceptions and behavior (Diaz et al., 2017; Merenda et al., 2019a; Merenda et al., 2019b; Ogawa et al., 2019; Do et al., 2020).
Therefore, unlike other forms of simulation, AR filters must consider two distinct aspects: the filter’s fidelity and the fidelity of the object the filter is placed on. Thus, to help determine how and when AR filters should be used in healthcare education, this work explores the effect that object fidelity and filter fidelity have on user perceptions of visual cues depicted during AR-based healthcare simulation.
2 Materials and methods
2.1 Study procedure
This work presents a novel approach that uses AR filters to display visual cues that develop over time (Figure 1). To evaluate this approach, we used Qualtrics, a platform used to design surveys for online research, to develop this study Qualtrics (2020). During class, participants were provided a link to the Qualtrics study in their course management software. Participants began by reading and signing the informed consent. Then participants completed a pre-survey that included demographics, screen brightness, and color blindness questions. Following the pre-survey, a pre-brief section informed participants about Malar rash symptoms and explained the questions they would answer regarding the Malar rash visual cues. After the pre-brief, participants completed four visual analog scale (VAS) questions for each of the four conditions. Finally, participants completed a post-survey and ended the study (Figure 2).
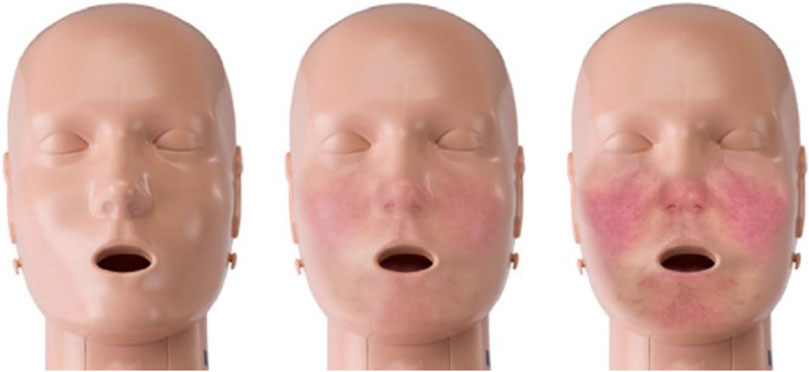
FIGURE 1. This is an example of the manikin with a real-image based filters at different stages of development. Malar rash symptoms were chosen for this study because the butterfly pattern of the facial rash is distinctive, the rash develops over time, and malar rashes can occur as a result of numerous different medical issues (Naji Rad and Vashisht, 2022).
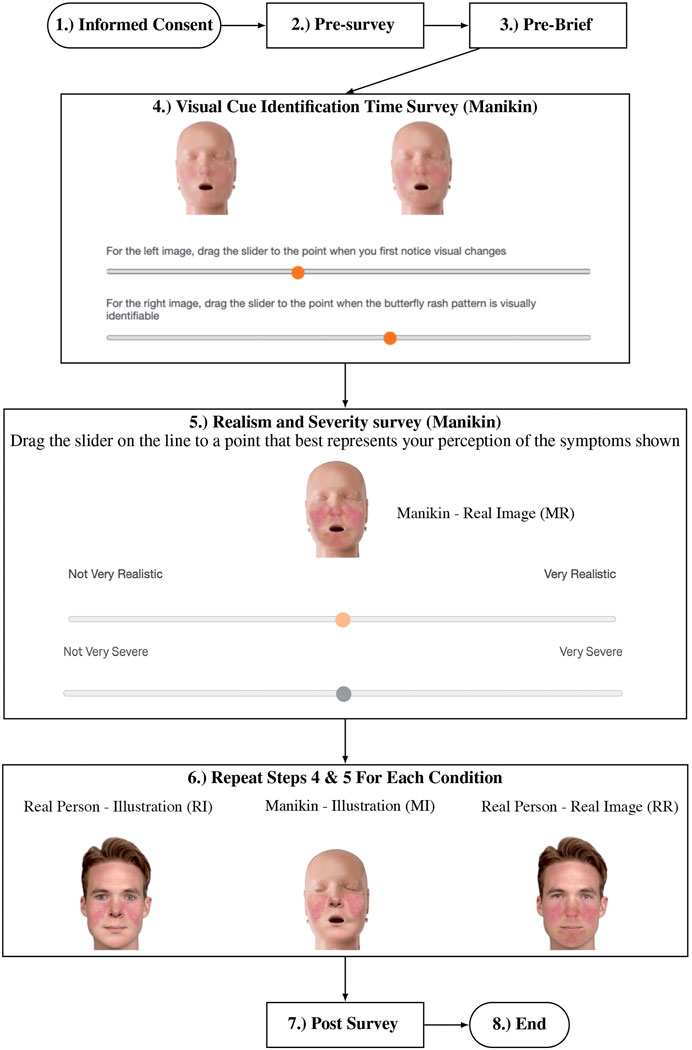
FIGURE 2. Procedure followed by participants in the study. The conditions are labeled above: Real Person-Illustration Filter (RI), Real Person-Real Image Filter (RR), Manikin-Illustration Filter (MI), and Manikin-Real Image Filter (MR).
2.2 Visual cue design
Malar rash symptoms were chosen for this study because the butterfly pattern of the facial rash is distinctive, the rash develops over time, and malar rashes can occur as a result of numerous different medical issues, including cellulitis, dermatomyositis, lupus, and rosacea (Naji Rad and Vashisht, 2022).
The AR filters in this study are designed with two fidelity levels. These fidelity levels were created based on two images: A medical illustration depicting Malar rash symptoms and an image of a real person of similar skin tone displaying the Malar rash symptoms (Figure 3). The source images were manipulated to aid in controlling for color, brightness, contrast, and lighting differences. The real symptom image has been manipulated by mirroring half the image so that both sides are symmetrical. This is done to better match the symmetry and lighting of the medical illustration image. To make sure one color did not make one filter appear more salient than the other, the illustration image was manipulated to provide visual cue contrast and color more alike to the real symptom image (Kahneman et al., 1982). This was done by creating color and contrast masks for each image and then using Photoshop’s replace color tool to match the visual cue and skin tone colors in the illustration image to the colors in the real symptom image.
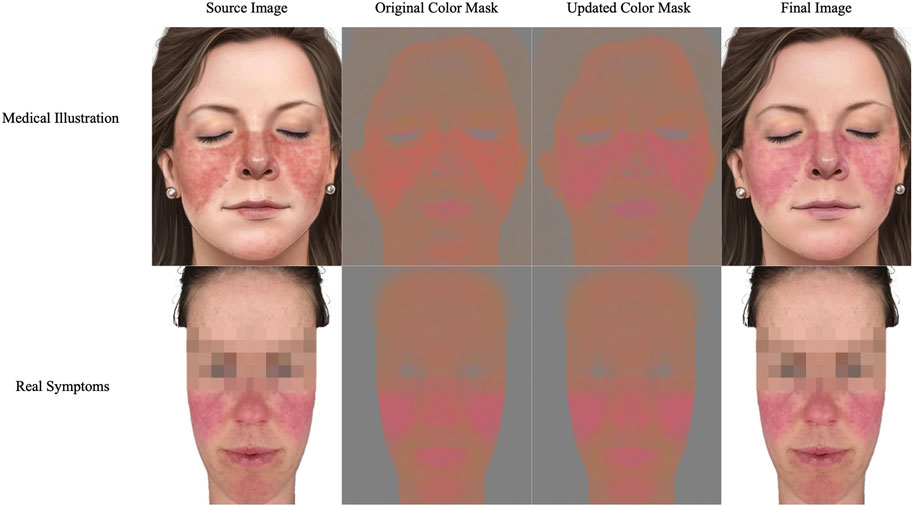
FIGURE 3. Source image for the medical illustration filter (top left) was manipulated using color masks to better match the real symptom image (bottom left) (Lupus Trust, 2021; Mayo Clinic Staff, 2021). The third column shows the medical illustration after replacing colors. The final row depicts the images used to generate the AR filters.
Once the source stimuli had been generated, these images were used to develop AR filters in Lens Studio, an AR development platform, that could be overlaid on images of real objects (Snap Inc, 2021). These AR filters could then be programmatically manipulated by altering the transparency level of the AR filters. Using this method, we developed 101 images for each of the four conditions, with the transparency levels of the filters ranging from 0 to 100. The images were then uploaded to VAS questions in Qualtrics to allow students to control the development of the Malar rash symptoms in real-time on their computers (Flynn et al., 2004). This approach allowed us to utilize the AR filters while controlling for variables that can be introduced in AR, such as poor tracking or differing perceptions that occur because of different viewing angles. Nursing collaborators reviewed all images generated for the VAS questions for face validity and accuracy.
2.3 Metrics
The pre-survey questionnaire asked for participants’ age, race, gender, whether they had normal or corrected-to-normal vision, and their familiarity with Malar rash symptoms. After the pre-survey, two questions were asked regarding screen brightness and color blindness to help control outside perception variables. Participants are asked to increase their screen brightness to the highest level that is still comfortable to their eyes and then complete a brightness calibration question (Glenn Messersmith, 2012). Following the screen brightness question, a question from the Ishihara test (Bonewit-West et al., 2014) was used to screen participants for red-green color blindness (See Figure 4). This is done because red-green color blindness can meaningfully affect the perception of the redness displayed in the visual cues in this study.
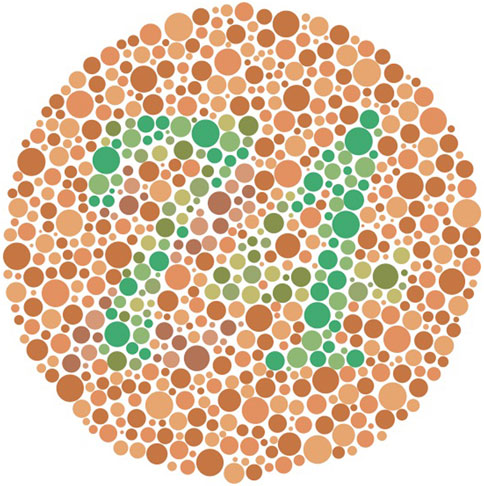
FIGURE 4. For participants with normal color vision, “74” should be clearly visible, “21” should be clearly visible for participants with red-green color blindness, and participants with monochromacy may see no numbers in the image Bonewit-West et al. (2014).
Then, participants were asked to complete VAS questions for the following conditions: Real Person-Illustration Filter (RI), Real Person-Real Image Filter (RR), Manikin-Illustration Filter (MI), and Manikin-Real Image Filter (MR). The VAS questions are used to measure variables related to the visual cue: realism, severity, and at what point users identified different stages of patient deterioration (initial changes in appearance and the butterfly pattern appearance). The study concluded with a post-survey gathering open-ended qualitative responses from participants regarding their perceptions of the visual cues and how they believe their perceptions were affected by the differences in filter and object fidelity.
To measure differences in how participants perceived the deterioration depicted by the visual cues, participants were asked to identify at what point on a VAS they first noticed changes to the image and at which point they first noticed the Malar rash’s butterfly pattern appeared. The sliding scales used in the symptom identification VAS questions depict patient deterioration over time by manipulating the alpha level of the AR visual cue. Each question utilized 101 images with alpha levels ranging from 0% (full transparency) to 100% (full visibility). This allowed for the use of a 0–100 scale. This method was chosen instead of showing students a video of the symptom developing over time and getting an actual time amount for several reasons. Most importantly, rash symptoms vary in the severity they can reach, and the time it takes to develop (Brown, 2003). Therefore, it is more important to identify stages of symptom development, such as initial changes and pattern identification, by the variable being manipulated (alpha level) rather than the time the variables are changed over. Time as a variable can be manipulated in future works to investigate different symptom development speeds. Other benefits of this method include allowing students to provide precise points at which they noticed symptom developments, allowing students to easily control the state of the symptom that was being displayed, and go back to a previous state if they accidentally passed where they believe they noticed changes, and it helped to reduce the total time needed to complete the survey (which is vital with the limited class time allowed to complete the study).
To measure differences in severity and realism of visual cues, users were asked to rate each condition’s visual realism and severity when the images were displayed with the AR visual cues at full visibility (alpha = 100%). For clarity, visual realism refers to a visual cue’s likeness to real-world symptoms, and severity refers to the degree of abnormality of the physiological symptoms Kiekkas et al. (2007). The sliders used are 0–100 scales ranging from “Not very severe” to “Very severe” and “Not very realistic” to “Very realistic.” These questions are adapted from Stuart et al. Stuart et al. (2022).
2.4 Data analysis
Descriptive and inferential statistics are reported for participants first noticing changes, noticing the malar rash pattern, malar rash realism, and the perceived severity of the malar rash. For Section 3.2 and Section 3.3, the units of measurement refer to the alpha level of the filter when students first noticed changes and noticed the malar rash pattern, respectively. A lower score for these sections is interpreted as students identifying changes and patterns sooner. For Section 3.4 and Section 3.5, the units of measurement refer to the students’ self-reported perceptions on 0–100 VAS. Lower scores for these sections are interpreted as students perceiving the visual cue as less realistic or severe, respectively.
For each VAS question, a repeated measures ANOVA was performed. A Mauchly test of sphericity was performed to check for sphericity assumptions. For tests that violated sphericity, the Greenhouse-Geisser and the Huynh-Feldt epsilon (ϵ) values are greater than 0.75. Therefore the repeated measures ANOVA results for these measures are reported based on the Huynh-Feldt corrections. The conditions are as follows Real Person-Illustration Filter (RI), Real Person-Real Image Filter (RR), Manikin-Illustration Filter (MI), and Manikin-Real Image Filter (MR).
For the qualitative sections, the coding scheme for the qualitative sections emerged based on the research questions and themes from the data after a first pass over the data. Responses were only counted towards categories if answers were clear and unambiguous, so no discussion between coders was necessary.
3 Results
3.1 Participants
Second-year nursing students (N = 62) were recruited from a nursing course (Principals of Personalized Nursing Care 2) taught at the University of Florida in the fall of 2022. Three students exhibited red-green color blindness, and four reported not having normal or corrected-to-normal vision. These participants are excluded from analysis in this paper due to potential differences in visual perception of the conditions. This led to a remaining population of 55 nursing students.
Of the 55 remaining students, 39 were 18–24 years old, 15 were 25–34, and 1 was 45–54. Students self-reported genders were: 7 Males and 48 Females. Options to input gender identity or not identify were provided, but no students chose these options. Students completed the interaction in a classroom setting using their own laptops.
3.2 First noticing changes
A Mauchly’s test of sphericity was significant for this measure, therefore the Huynh-Feldt correction was used. A repeated measures ANOVA showed that “Pattern Changes” levels differed significantly between F (2.68, 155.93) = 28.12, p
Post hoc testing using the Holm correction revealed that ratings on the initial changes slider were significantly higher for the RI condition when compared to all other conditions: RR condition (mean difference = 8.29, p
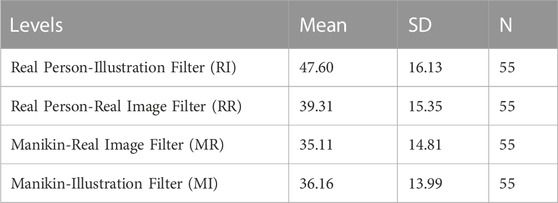
TABLE 1. Descriptive Statistics for initial changes. Lower mean indicates noticing initial changes sooner.
3.3 Noticing pattern
A Mauchly’s test of sphericity was significant for this measure, therefore the Huynh-Feldt correction was used. A repeated measures ANOVA showed that pattern changes levels differed significantly between F (2.73, 147.24) = 21.30, p
Post hoc testing using the Holm correction revealed that ratings on the pattern changes slider were significantly higher for the RI condition when compared to all other conditions: RR condition (mean difference = 4.13, p = .048), MR condition (mean difference = 10.80, p
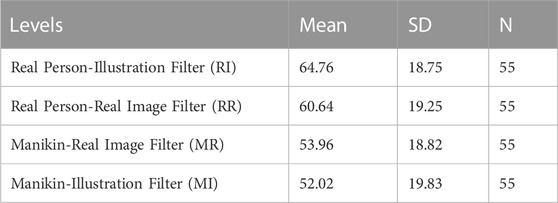
TABLE 2. Descriptive Statistics for noticing pattern ratings. Lower mean indicates noticing pattern changes sooner.
3.4 Realism
A Mauchly’s test of sphericity was significant for this measure, therefore the Huynh-Feldt correction was used. A repeated measures ANOVA showed that realism ratings differed significantly between levels with F (2.52, 136.03) = 7.93, p
Post hoc testing using the Holm correction revealed that the realism rating for the RI condition was significantly higher than the MR condition (mean difference = 10.46, p = 0.005) and the MI condition (mean difference = 8.031, p = .036). Further, the RR condition was significantly higher than the MR condition (mean difference = 13.19, p
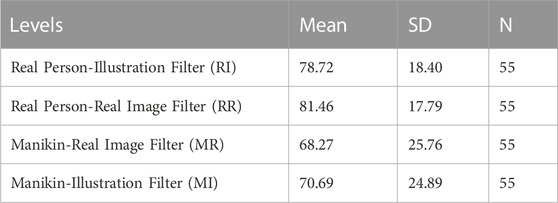
TABLE 3. Descriptive Statistics for realism ratings.
3.5 Severity
A repeated measures ANOVA showed that severity ratings differed significantly between levels with F (3, 172) = 12.592, p
Post hoc testing using the Holm correction revealed that severity ratings were significantly higher for the MR condition compared to all other conditions: RR condition (mean difference = 5.99, p = .024), RI condition (mean difference = 13.58, p
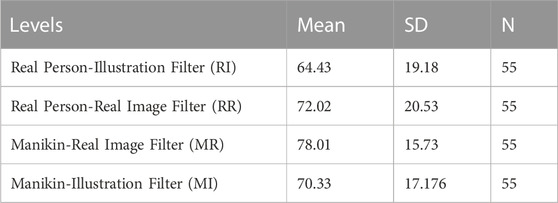
TABLE 4. Descriptive Statistics for severity ratings.
3.6 Qualitative responses
3.6.1 Object fidelity
Fifty-four students provided a follow-up response for the question “Please describe how the object the symptoms appeared on (manikin vs. real person) affected your perception of symptom realism and severity?” (See Table 5 for summary).
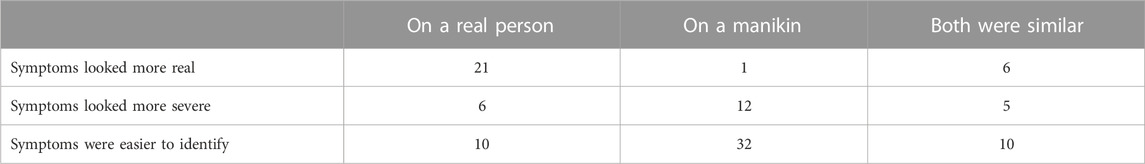
TABLE 5. Summary of object fidelity qualitative results. The numbers in the table represent the count of participants who indicated a particular perception. Not all responses were relevant to the questions so the counts do not add up to the total number of responses.
In the context of realism, 21 students stated that overlaying the symptoms on a real person made the symptoms appear more realistic, 1 student stated that overlaying the symptoms on a manikin made the symptoms appear more realistic, 6 students stated that the symptoms had similar realism regardless of the object the symptoms were overlayed on.
In the context of severity, 6 students stated that overlaying the symptoms on a real person made the symptoms appear more severe, 12 students stated that overlaying the symptoms on a manikin made the symptoms appear more severe, and 5 students stated that the symptoms had similar severity regardless of the object the symptoms were overlayed on.
Fifty-two students provided a follow-up response for the question “Please describe how the object the symptoms appeared on (manikin vs. real person) affected your ability to identify the symptoms?”. 10 students stated that the symptoms were easier to identify on the real person, 32 students stated that the symptoms were easier to identify on the manikin, and 10 said that both objects led to similar difficulty in identifying the symptoms.
A theme that arose across both questions was that students specifically stated their perceptual differences were due to the skin texture and skin tone differences of the manikin and real person. In the first question, 2 students said the more detailed skin texture of the real person made the symptoms appear more realistic, 4 students said the smooth skin texture of the manikin made the symptoms easier to identify, 2 students said the more detailed skin texture of the real person made the symptoms easier to identify on the real person (Table 6 for example, responses on skin texture).
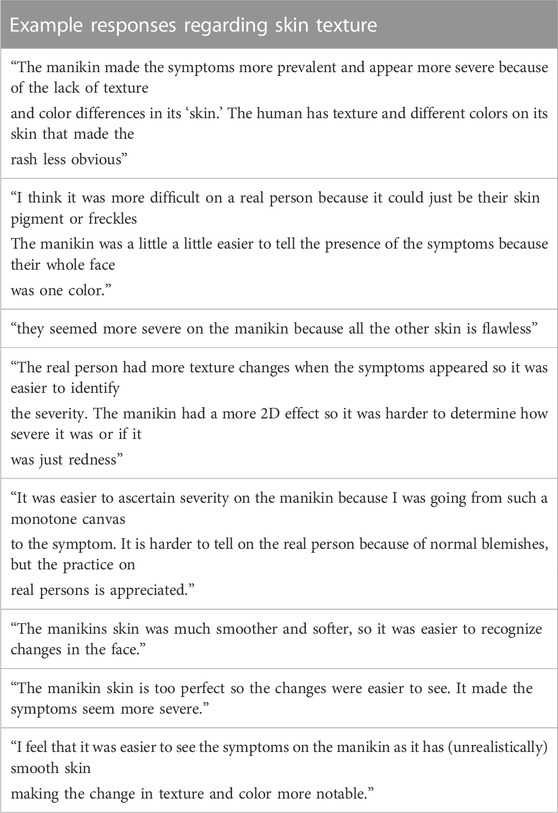
TABLE 6. Example responses regarding skin texture.
3.6.2 Filter fidelity
Fifty-four students provided a follow-up response for the question “Please describe how the symptom style (medical illustration vs. real symptom image) affected your perception of symptom realism and severity?” (See Table 7 for summary).
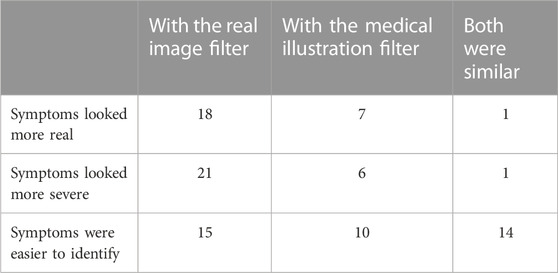
TABLE 7. Summary of filter fidelity qualitative results. The numbers in the table represent the count of participants who indicated a particular perception. Not all responses were relevant to the questions so the counts do not add up to the total number of responses.
In the context of realism, 18 students stated that the AR filter based on a real image made the symptoms appear more realistic, 7 students stated that the AR filter based on a medical illustration image made the symptoms appear more realistic, and 1 student stated that the symptoms had similar realism regardless of the AR filter style.
In the context of severity, 21 students stated that the AR filter based on a real image made the symptoms appear more severe, 6 students stated that the AR filter based on a medical illustration image filter made the symptoms appear more severe, and 1 student stated that the symptoms had similar severity regardless of the AR filter style.
Fifty-two students provided a follow-up response for the question “Please describe how the symptom style (medical illustration vs. real symptom image) affected your ability to identify the symptoms?” After thematic analysis, we found that 15 students stated that the symptoms were easier to identify when the real filter was used, 10 students stated that the symptoms were easier to identify when the medical illustration filter was used, and 14 said that both filters led to similar difficulty in identifying the symptoms.
One theme that developed was that students specifically stated their perceptual differences were due to the rash pattern in the filters. In the first question, 2 students said the more detailed skin texture of the real person made the symptoms appear more realistic, 4 students said the smooth skin texture of the manikin made the symptoms easier to identify, 2 students said the more detailed skin texture of the real person made the symptoms easier to identify on the real person (Table 8 for example, responses on rash pattern).
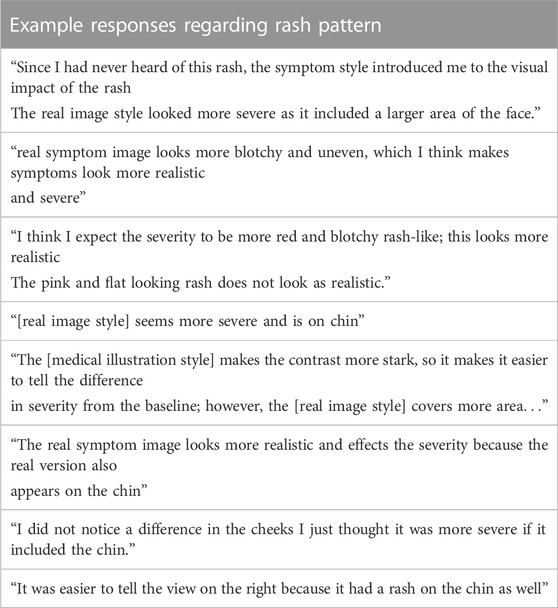
TABLE 8. Example responses regarding rash pattern.
4 Discussion
Our goal for this work was to improve healthcare education training by developing and evaluating an interaction that utilized AR filters to display symptoms that develop over time. Our results indicate that when used to display visual cues, AR filters provide a novel way for students to gain insight into how symptoms manifest over time in a simulated environment. This claim is supported by student responses indicating they were able to identify the symptoms in all conditions (Section 3.6). The realism ratings reported by students also support this claim. Students perceived all of the conditions as realistic with ratings of 68 or higher on a 0–100 scale (0 Not very realistic, 100 Very realistic).
We also found evidence that object and filter fidelity impacted user perceptions of the Malar rash symptoms of realism and severity and even affected users’ abilities to identify the symptoms. For example, symptoms were seen as more realistic when overlaid on the real person, symptoms were identified at an earlier stage of development when overlaid on the manikin, and symptoms were seen as most severe when the real-image filter was overlayed on the manikin.
Using our findings, we discuss the utility of AR filters in healthcare education and provide evidence-based recommendations on how healthcare education can best take advantage of this novel AR filter approach to training students to identify symptoms that develop over time.
4.1 Medical illustration filter recommendations
Students identified Malar rash symptoms at a later stage of symptom development when the medical illustration filter was overlaid on a real person. This claim is supported by students identifying initial changes and the butterfly pattern of the Malar rash symptoms at a significantly higher point on the scale when the medical illustration was overlaid on the real person. This result can be explained by examining the purpose of medical illustrations.
Medical illustrations are used to help reduce cognitive load while learning by limiting extraneous detail and highlighting the relevant details of a condition (Plass et al., 2009; Krasnoryadtseva et al., 2020). Thus, medical illustration symptoms are designed to be displayed on a stylized person/background with low detail. However, student responses indicate that when using an AR filter to apply the relevant details from a medical illustration to a real person, the real person’s skin reintroduces extraneous detail, such as skin texture and pigment variations (see student responses Table 6). By not using a low detail background for the medical illustration symptoms, students no longer gain the benefits provided by the increased simplicity of the medical illustration. This conclusion is further supported by our findings that indicate students noticed initial changes and the Malar rash butterfly pattern earliest when the AR filters were overlaid on the manikin. These findings are likely due to the smooth skin texture of the manikin not introducing extraneous detail. This allows for the retention of the traditional benefits of medical illustration.
Based on our findings and prior work, we suggest that medical illustration filters only be used during manikin-based simulation training. Particularly, simulations that are focused on training responses to symptom developments rather than learning about the symptom developments themselves may benefit from using medical illustration filters on medical manikins. Using medical illustration filters with manikins, simulation designers can take advantage of the benefits of both AR filters showcasing symptom developments in real-time along with the quick identification associated with the medical illustration filters. These advantages may be most beneficial in early stages of healthcare education when first introducing novices to training simulations (Coffman et al., 2022).
An exception to this recommendation is when real-image-based filters cannot be created to display symptoms during standardized patient training. Medical illustration filters can provide an alternative to creating filters when circumstances lead to real images of symptoms being challenging to attain. These circumstances may be due to parts of images being obfuscated to help protect patient privacy or the ongoing racial bias in medical imagery leading to a limited sample size of images to pull from for specific populations (Massie et al., 2021).
Overall, simulation designers should be aware that using medical illustration filters, particularly on real standardized patients, may increase the time it takes students to identify symptoms. This is particularly important due to the inherent time limitations that exist for standardized patient simulations as a result of requiring paid actors. During standardized patient training, instructors should consider alternative methods of presenting symptoms, such as using real symptom images to create the AR filters or using easily applicable moulage when appropriate. These options may be more effective for utilizing the limited training time available.
4.2 Real image filter recommendations
Students perceived the real-image-based AR filter as more severe than the medical illustration filter. This claim is supported by students rating the MR and RR conditions as significantly more severe than the MI and RI conditions, respectively. Additionally, students perceived the MR condition as the most severe and the RI as the least severe. A potential explanation for these findings is that AR filters used to depict symptoms are susceptible to salience biases.
Salience biases are when distinctive stimuli disproportionately engage attention and then disproportionately affect judgments (Kahneman et al., 1982). Students seem to view the real-image filter as more salient than the medical illustration filter. Students stated that they believed the real-image based filter included a larger area of the face and appeared more blotchy (see student responses Table 8). Despite the measures taken to reduce symptom differences, it seems that the slight differences in symptoms led students to rate the real-image based filter as significantly more severe than the medical illustration filter.
These findings highlight that slight differences in symptom appearance can drastically affect student perceptions. This is particularly important when identifying symptoms because small changes may lead to a different diagnosis. For example, if a patient has a slightly raised and red rash, they may be diagnosed with a skin infection or allergic reaction. However, if the patient’s rash is flat or purple, they may be diagnosed with a blood clotting disorder or a different type of infection (patient.info, 2019; Mayo Clinic, 2021). The differences in the hue and texture of the rash can lead to a completely different diagnosis and treatment plan.
Based on these findings, we suggest that real-image based filters be used during cases where symptom accuracy is important. Particularly, simulations that are focused on learning about the symptom developments themselves rather than training responses to symptom developments may benefit from using medical illustration filters on medical manikins. By using real images, AR filters can better retain the frequency of details present in the real conditions. This can help ensure the accuracy of symptoms depicted during healthcare simulation training.
4.3 Object recommendations
When investigating the effect of object fidelity, we found that students rated the symptoms on the real person as significantly more realistic than the symptoms displayed on the manikin, regardless of the filter style used. This finding is in line with prior work in the virtual human domain which found that nursing students perceived AR allergic reaction symptoms as less realistic when they were overlaid on a 3D virtual human (low fidelity) compared to when they were overlaid on a photorealistic virtual human (high fidelity) (Stuart et al., 2022).
Together, these findings highlight that the fidelity of the object that filters are overlaid on can impact user perceptions of the symptoms being overlayed. This would suggest that if trying to present highly realistic representations of symptoms, not only do the symptom visual cues need to be high fidelity but so does the object the symptoms are overlaid on. This is further supported by the RR condition being seen as the most realistic condition while the RM condition was seen as the least realistic. It is important to note that despite the higher perception of realism, students identified initial appearance changes and the butterfly pattern at a later stage of development with the real person as the object. As mentioned previously, this can be further explained by qualitative user responses, which state that the additional skin texture and detail of the real person made it more challenging to identify the symptoms (see student responses 6).
Based on our findings and prior work, we suggest that AR filters be overlaid on manikins when training objectives focus on processes, procedures, and protocols. Overlaying symptoms using AR filters on manikins allows students to identify changes occurring quickly. This is supported by the MR condition being the quickest to notice initial changes and the MI condition being the quickest to notice pattern development. The increased speed of symptom identification will leave more time for students to practice and reflect on following processes and protocols or performing procedures while still providing the opportunity to apply heuristics based on symptom developments.
Additionally, we also recommend that AR filters be overlaid on real people or standardized patients when training students to identify visual symptoms and their development. By overlaying symptoms on real people, simulation designers can provide students with more realistic depictions of the symptoms they will need to identify in the real world. To provide students with the most realistic depictions, we recommend overlaying the real-image based filters on real people or images of real people.
5 Limitations and future directions
This work has a number of limitations, including the lack of use of an AR device, potential differences in users’ screen brightness and color calibrations, the use of transparency as a proxy for symptom development, limited examples of the Malar rash symptoms, and questions regarding the optimization of the stimuli used. We will briefly discuss these:
1) We do not use an AR device to display the filters shown in this study. This was done to help control for differences such as tracking, user viewing angle, device calibration, and color depiction. While some of these differences (brightness and color differences) still exist on different screens, this approach, in combination with the measures implemented to control for screen brightness and color of the filters, allows for a more controlled study design. Future work can utilize the findings of this work in a simulation setting to answer research questions regarding how the variables introduced by AR displays and tracking affect user perceptions of symptoms and their development.
2) Using an alpha level slider to depict symptom development approximates how a symptom would develop. The alpha level scales linearly from 0 to 100. However, it is not guaranteed that symptoms will develop at a linear pace. For example, initial changes may occur very rapidly but may take a long time to reach peak severity. Additionally, symptoms may develop differently for each patient, even for the same symptom (Brown, 2003). Future works can improve healthcare education by exploring more methods to approximate symptom developments.
3) Only one type of symptom (the Malar rash) is explored in this study. This is done because it is distinctive and can occur in numerous conditions. However, one thing of note is that it is an additive condition in the sense that redness is added to an object’s face. The results of this study may not be directly comparable for subtractive symptoms. An example is paleness, where color is removed from an object. Further research would be needed to explore the intricacies that different symptoms present.
4) The most prominent limitation may be the lack of diversity of gender and skin tones used for the manikin and standardized patient representations. The current state of healthcare training typically uses manikins similar to the one used in this work. Therefore, this was used to best align with industry standards. However, manikins of different skin tones and gender are becoming more prevalent. A promising future direction of AR research is to identify methods to adapt AR filters to best align with the skin tones they are placed on. Many symptoms can present differently for persons of different races (Brown, 2003; Robinson, 2007). Therefore, not only would this help to improve simulation immersion, but future adaptive AR filters can also be used to make visual cue depictions more accurate for healthcare training.
5) The last limitation to be addressed is the lack of clarity regarding whether the generated stimuli is optimal for training purposes. This study used one medical illustration image and one real image of the malar rash symptom to generate the stimuli. While these images came from reputable sources and were verified for face validity by collaborators, it is unclear how potential improvements to the artistic methods used for the medical illustration or the quality of the camera capture equipment used may have impacted the study results. However, based on the results, we believe that though the stimuli may not be optimal, we were able to provide educational value to students by providing them with malar rash visuals that they could not have experienced otherwise.
6 Conclusion
This work implemented a novel approach that uses AR filters to display visual cues that develop over time. Additionally, this work investigates fidelity allowing us to provide evidence-based recommendations on how and when AR filters can be effectively used in healthcare education.
However, there are still some unanswered questions surrounding the use of AR filters in healthcare education, such as how to best integrate them into existing curricula, what types of visualizations are most effective for different types of symptoms, and what effect differences such as skin tone may have on the perception of AR visual cues. Future research should explore these issues in more detail in order to understand how best to utilize AR filters in healthcare education. Additionally, further research should examine the use of AR filters in other aspects of healthcare education to better understand the potential benefits they can provide.
Data availability statement
The raw data supporting the conclusion of this article will be made available by the authors, without undue reservation.
Ethics statement
The studies involving human participants were reviewed and approved by the University of Florida Internal Review Board. The patients/participants provided their written informed consent to participate in this study. Written informed consent was not obtained from the individual(s) for the publication of any potentially identifiable images or data included in this article.
Author contributions
JS conducted the user study, carried out the data analysis, and wrote the manuscript in consultation with all others. AS, SH, and BR were the instructors for the courses in which the study was integrated. All authors contributed to the study design, virtual human design, visual cue design, and conceptualization of the paper.
Funding
This work was funded by the National Science Foundation award numbers 1800961 and 1800947.
Acknowledgments
We would like to thank the members of the virtual experiences research group for their assistance throughout the paper writing process.
Conflict of interest
The authors declare that the research was conducted in the absence of any commercial or financial relationships that could be construed as a potential conflict of interest.
Publisher’s note
All claims expressed in this article are solely those of the authors and do not necessarily represent those of their affiliated organizations, or those of the publisher, the editors and the reviewers. Any product that may be evaluated in this article, or claim that may be made by its manufacturer, is not guaranteed or endorsed by the publisher.
References
Barbara, T., Morrison, J. B., and Betrancourt, M. (2002). Animation: Can it facilitate? Int. J. Human-Computer Stud. 57, 247–262. doi:10.1006/ijhc.2002.1017
Bonewit-West, K., Hunt, S., and Applegate, E. (2014). Today’s medical assistant - E-book: Clinical and administrative procedures. Elsevier Health Sciences.
Brown, A. F. (2003). The emergency department epidemiology of acute allergic events: Can we ever compare apples with apples? Emerg. Med. Australasia 15, 315–317. doi:10.1046/j.1442-2026.2003.00468.x
Coffman, S., Iommi, M., and Morrow, K. (2022). Scaffolding as active learning in nursing education. Teach. Learn. Nurs. 18, 232–237. doi:10.1016/j.teln.2022.09.012
Daher, S., Hochreiter, J., Norouzi, N., Gonzalez, L., Bruder, G., and Welch, G. (2018). Physical-virtual agents for healthcare simulation. doi:10.1145/3267851.3267876
Diaz, C., Walker, M., Szafir, D. A., and Szafir, D. (2017). “Designing for depth perceptions in augmented reality,” in 2017 IEEE international symposium on mixed and augmented reality (ISMAR) (IEEE), 111–122. doi:10.1109/ISMAR.2017.28
Do, T. D., LaViola, J. J., and McMahan, R. P. (2020). “The effects of object shape, fidelity, color, and luminance on depth perception in handheld mobile augmented reality,” in 2020 IEEE international symposium on mixed and augmented reality (ISMAR) (IEEE), 64–72. doi:10.1109/ISMAR50242.2020.00026
Flynn, D., van Schaik, P., and van Wersch, A. (2004). A comparison of multi-item likert and visual analogue scales for the assessment of transactionally defined coping Function1. Eur. J. Psychol. Assess. 20, 49–58. doi:10.1027/1015-5759.20.1.49
Hernández, Y., Pérez-Ramírez, M., Zatarain-Cabada, R., Barrón-Estrada, L., and Alor-Hernández, G. (2016). Designing empathetic animated agents for a B-learning training environment within the electrical domain. Educational Technology and Society.
Herron, E. K., Nemeth, J., and Powers, K. A. (2017). Community health simulation with a standardized patient: Exploring the experience. Clin. Simul. Nurs. 13, 331–337. doi:10.1016/j.ecns.2017.05.011
Huber, B. J., and Epp, S. M. (2021). Teaching and learning focused physical assessments: An innovative clinical support tool. Nurse Educ. Pract. 59, 103131. doi:10.1016/j.nepr.2021.103131
Kahneman, D., Slovic, P., and Tversky, A. (1982). Judgment under uncertainty. Cambridge University Press. doi:10.1017/CBO9780511809477
Kiekkas, P., Brokalaki, H., Manolis, E., Samios, A., Skartsani, C., and Baltopoulos, G. (2007). Patient severity as an indicator of nursing workload in the intensive care unit. Nurs. Crit. Care 12, 34–41. doi:10.1111/j.1478-5153.2006.00193.x
Knapp, P., Benhebil, N., Evans, E., and Moe-Byrne, T. (2022). The effectiveness of video animations in the education of healthcare practitioners and student practitioners: A systematic review of trials. Perspect. Med. Educ. 11, 309–315. doi:10.1007/s40037-022-00736-6
Krasnoryadtseva, A., Dalbeth, N., and Petrie, K. J. (2020). The effect of different styles of medical illustration on information comprehension, the perception of educational material and illness beliefs. Patient Educ. Couns. 103, 556–562. doi:10.1016/j.pec.2019.09.026
Lammers, R., Willoughby-Byrwa, M., and Fales, W. (2014). Medication errors in prehospital management of simulated pediatric anaphylaxis. Prehospital Emerg. Care 18, 295–304. doi:10.3109/10903127.2013.856501
Lee, S. K., Pardo, M., Gaba, D., Sowb, Y., Dicker, R., Straus, E. M., et al. (2003). Trauma assessment training with a patient simulator: A prospective, randomized study. J. Trauma Inj. Infect. Crit. Care 55, 651–657. doi:10.1097/01.TA.0000035092.83759.29
Liang, C.-J., Start, C., Boley, H., Kamat, V. R., Menassa, C. C., and Aebersold, M. (2021). Enhancing stroke assessment simulation experience in clinical training using augmented reality. Virtual Real. 25, 575–584. doi:10.1007/s10055-020-00475-1
Lok, B. (2006). Teaching communication skills with virtual humans. IEEE Comput. Graph. Appl. 26, 10–13. doi:10.1109/MCG.2006.68
Massie, J. P., Cho, D. Y., Kneib, C. J., Sousa, J. D., Morrison, S. D., and Friedrich, J. B. (2021). A picture of modern medicine: Race and visual representation in medical literature. J. Natl. Med. Assoc. 113, 88–94. doi:10.1016/j.jnma.2020.07.013
Merenda, C., Suga, C., Gabbard, J. L., and Misu, T. (2019b). “Effects of ”real-world” visual fidelity on AR interface assessment: A case study using AR head-up display graphics in driving,” in 2019 IEEE international symposium on mixed and augmented reality (ISMAR) (IEEE), 145–156. doi:10.1109/ISMAR.2019.00-10
Merenda, C., Suga, C., Gabbard, J., and Misu, T. (2019a). “Effects of vehicle simulation visual fidelity on assessing driver performance and behavior,” in 2019 IEEE intelligent vehicles symposium (IV) (IEEE), 1679–1686. doi:10.1109/IVS.2019.8813863
Noll, C., von Jan, U., Raap, U., and Albrecht, U.-V. (2017). Mobile augmented reality as a feature for self-oriented, blended learning in medicine: Randomized controlled trial. JMIR mHealth uHealth 5, e139. doi:10.2196/mhealth.7943
Ogawa, N., Narumi, T., and Hirose, M. (2019). “Virtual hand realism affects object size perception in body-based scaling,” in 2019 IEEE conference on virtual reality and 3D user interfaces (VR) (IEEE), 519–528. doi:10.1109/VR.2019.8798040
Plass, J. L., Homer, B. D., and Hayward, E. O. (2009). Design factors for educationally effective animations and simulations. J. Comput. High. Educ. 21, 31–61. doi:10.1007/s12528-009-9011-x
Robinson, M. K. (2007). Population differences in skin structure and physiology and the susceptibility to irritant and allergic contact dermatitis: Implications for skin safety testing and risk assessment. Contact Dermat. 41, 65–79. doi:10.1111/j.1600-0536.1999.tb06229.x
Stokes-Parish, J. B., Duvivier, R., and Jolly, B. (2020). How does moulage contribute to medical students’ perceived engagement in simulation? A mixed-methods pilot study. Adv. Simul. 5, 23. doi:10.1186/s41077-020-00142-0
Stokes-Parish, J., Duvivier, R., and Jolly, B. (2019). Expert opinions on the authenticity of moulage in simulation: A delphi study. Adv. Simul. 4, 16. doi:10.1186/s41077-019-0103-z
Stuart, J., Aul, K., Stephen, A., Bumbach, M. D., and Lok, B. (2022). The effect of virtual human rendering style on user perceptions of visual cues. Front. Virtual Real. 3. doi:10.3389/frvir.2022.864676
Sundar, S. (2008). “The main model: A heuristic approach to understanding technology effects on credibility,” in Digital media, youth, and credibility. Editors M. Metzger, and A. Flanagin (Cambridge, MA: Massachusetts Institute of Technology). doi:10.1162/dmal.9780262562324.073
Wanat, K. A., Kist, J., Jambusaria-Pahlajani, A., LaMarra, D., Mackey, A., Treat, J. R., et al. (2013). Improving students’ ability to perform skin examinations and detect cutaneous malignancies using standardized patients and moulage. J. Am. Acad. Dermatology 69, 816–817. doi:10.1016/j.jaad.2013.03.045
Watts, P. I., McDermott, D. S., Alinier, G., Charnetski, M., Ludlow, J., Horsley, E., et al. (2021). Healthcare simulation standards of best PracticeTM simulation design. Clin. Simul. Nurs. 58, 14–21. doi:10.1016/j.ecns.2021.08.009
Xu, K., and Liao, T. (2020). Explicating cues: A typology for understanding emerging media technologies. J. Computer-Mediated Commun. 25, 32–43. doi:10.1093/jcmc/zmz023
Keywords: augmented reality, visual cue training, healthcare, simulation, symptoms, fidelity, realism
Citation: Stuart J, Stephen A, Aul K, Bumbach MD, Huffman S, Russo B and Lok B (2023) Using augmented reality filters to display time-based visual cues. Front. Virtual Real. 4:1127000. doi: 10.3389/frvir.2023.1127000
Received: 19 December 2022; Accepted: 03 April 2023;
Published: 14 April 2023.
Edited by:
Ekaterina Prasolova-Førland, Norwegian University of Science and Technology, NorwayReviewed by:
Valeria Caponnetto, University of L’Aquila, ItalyHeinrich Söbke, Bauhaus-Universität Weimar, Germany
Copyright © 2023 Stuart, Stephen, Aul, Bumbach, Huffman, Russo and Lok . This is an open-access article distributed under the terms of the Creative Commons Attribution License (CC BY). The use, distribution or reproduction in other forums is permitted, provided the original author(s) and the copyright owner(s) are credited and that the original publication in this journal is cited, in accordance with accepted academic practice. No use, distribution or reproduction is permitted which does not comply with these terms.
*Correspondence: Jacob Stuart, SmFjb2JTdHVhcnRAdWZsLmVkdQ==