 Marios Fanourakis
 Guillaume Chanel
- SIMS Group, CVML Laboratory, Computer Science, University of Geneva, Geneva, Switzerland
Studies on the psychosensory pupil response often carefully control the lighting conditions in the experiment or require a calibration procedure for each subject under different light conditions for a baseline which is later used to attenuate the pupil light response (PLR) effects from the pupil using steady state models, disregarding the dynamic nature of the pupil. Such approaches are not feasible “in the wild” since they require carefully controlled experimental conditions. We address these shortcomings in the context of screen viewing in a dataset containing 140 subjects playing a first person shooter video game and use an existing dynamic PLR model to attenuate the effects of luminance. We compute the perceived luminance using the pixel values of the screen and show that using the dynamic PLR model is more effective in attenuating the effects of luminance compared to steady state models. Subsequently, we show that attenuating the PLR from the pupil size data improves the performance of machine learning models trained to predict arousing game events compared to using the pupil size without attenuating the PLR. The implications are that our approach for estimating the perceived luminance and attenuating its effects from the pupil data can be applied to screen viewing (including VR) to unobtrusively and continuously monitor users’ emotional arousal via the pupil size.
1 Introduction
The gaming industry has been rapidly evolving along with computers for decades. It quickly makes use of the advances in processing power for improving the graphics and complexity of the games. It also makes continuous advances in the peripherals that players can use to interact with the game, from the humble gamepad to driving wheels and flight sims. As new technologies improve and become available to consumers the gaming industry is not far behind to find ways to integrate them in the gaming experience. One such technology is eye-tracking. Eye-tracking has been used in games as an input method (ex. to navigate menus) (Smith and Graham, 2006), to optimize the game rendering by prioritizing the regions where the player is looking at (Matthews et al., 2020), as well as to study emotional responses (Juvrud et al., 2021; Mitre-Hernandez et al., 2021).
Games have been shown to be quite effective in eliciting emotions on players (Karpouzis and Yannakakis, 2016), so it is no surprise that emotion recognition in games has been used for a wide range of tasks: for dynamic difficulty adjustment (Chanel and Lopes, 2020), improving player satisfaction (Yannakakis, 2008), or generally studying the affective aspects of games (Mark Gilleade et al., 2005; Ravaja et al., 2006; Kivikangas et al., 2011; Kotsia et al., 2012; Christy and Kuncheva, 2014). We are particularly interested in emotions in the context of e-sport and streaming where the detected emotions can be used as feedback to the players or followers to better engage with the content.
Controlled studies have shown that the pupil responds to changes in cognitive effort, emotional arousal and sympathetic nervous system activity (Võ et al., 2007; Bradley et al., 2008; Henderson et al., 2018; Wang et al., 2018; Rahal and Fiedler, 2019; Krejtz et al., 2020). However, the pupil’s main function (via the iris) is to regulate the amount of light entering the retina and optimize the image contrast (Mathôt, 2018). This pupil light reflex/response (PLR) takes precedence over and is orders of magnitude greater than other mechanisms which influence the pupil diameter, rendering it challenging to distinguish other types of pupil responses. Despite this, there is great interest to use the pupil diameter as an insight to the nervous system since eye-tracking hardware can be used unobtrusively in many scenarios. Traditional sensors used to measure physiological activity such as electroencephalogram (EEG) and electrocardiogram (ECG) require hardware to be attached on specific sensing points which can be cumbersome. Furthermore, these types of sensors restrict movement and can become uncomfortable over a long period of use. In contrast, eye-tracking hardware can be seamlessly attached or integrated in many devices or surfaces such as screens and VR headsets (Clay et al., 2019). This is unobtrusive and does not introduce any unnecessary discomfort for the subject.
Although several studies have shown that eye-tracking can be used to study cognitive processes mentioned earlier, it is not an equivalent replacement for sensors such as EEG which have a much broader capacity to study cognitive processes. For example, EEG has been used to study sleep states, full spectrum of emotions, motor activity, cognitive impairments, etc. (Soufineyestani et al., 2020).
To mitigate the effects of PLR, studies often carefully control the lighting conditions in the experiment or require a calibration procedure for each subject under different light conditions to attenuate the PLR effects from the pupil naively using steady state models. Several studies may also focus on changes of the mean pupil diameter during a task or event from some baseline with similar luminance to the task or event. In this way the pupil light response is rendered somewhat irrelevant but such an approach strictly limits the analysis to the mean response to a stimulus. We address these shortcomings in the context of screen viewing (ex. monitor screen or VR headset) and use a dynamic PLR model developed by Pamplona et al. (Pamplona et al., 2009) to process the pupil data and attenuate the effects of luminance. We use the pixel values of the screen to compute the perceived luminance and compare the effectiveness of attenuating the PLR of the dynamic model to a steady state model. Subsequently, we show that processing the pupil data using the dynamic PLR model improves the performance of machine learning models trained to predict arousing events in a video game experiment.
2 Related work
Pupillometry has been a subject of study since at least 1926 with Holladay’s work (Holladay, 1926) on the effects of glare on visibility. Since then, there have been numerous studies surrounding the pupil and its response to light, pupil light response (PLR) (Crawford, 1936; Ellis, 1981; Stanley, 1995; Peysakhovich et al., 2017), and more recently cognitive processes, psychosensory pupil response or task evoked pupil response (PPR or TEPR respectively) (Võ et al., 2007; Wang et al., 2018; Rahal and Fiedler, 2019; Krejtz et al., 2020). A summary of pupillometric research can be found in (Mathôt, 2018).
2.1 PLR models
2.1.1 Steady state models
Through the study of PLR and collection of data in controlled experiments, several models have been developed to predict the steady-state diameter of the pupil under different luminance. Watson et al. have neatly summarized the various light adapted pupil size models and related studies of pupil light adaptation of the time (Watson and Yellott, 2012). Each of those studies built upon their predecessors and used a different sample of data, different formulas accounting for several parameters. Initial formulas only depended on the luminance of the target and mainly differed due to the different sample sizes, populations, and groups when developing the formulas. Later on, the field area of the target was introduced as a parameter by Stanley and Davies as shown in Eq. 1.
Where L is the luminance measured in candelas per meter square
Where y0 is the reference age, the mean of the population age in the Stanley and Davies dataset (Stanley, 1995) and the age is 20 < y < 83. Watson et al. propose an adjustment for ages below 20 years old in Appendix 1 of their publication. Combining Eqs 1, 2, Watson et al. get the unified formula for light-adapted pupil size:
2.1.2 Dynamic models
It is important to emphasize that the studies and formulas summarized above were concerned with the light adapted pupil size, i.e., the steady state response of the pupil to a constant luminance source. Under real-world conditions the luminance is dynamic and the pupil size has a much more complex behaviour under these dynamic conditions. Indeed several researchers have studied the transient and dynamic behaviour of the pupil and some have developed dynamic models (Semmlow and Chen, 1977; Longtin and Milton, 1988, 1989a,b) often based on neurological control systems research (Stark, 1984; Korenberg and Hunter, 1990). One such dynamic model is that of Pamplona et al. (2009) who realistically model the dynamics of the pupil to changes in light using a delay differential equation (DDE) model which combines the dynamic model of the iris of Longtin and Milton (1989b), and the steady state model of Moon and Spencer (1944) (Eqs 4, 5, respectively).
Where A describes the pupil area (
Where Lb is the luminance expressed in blondels. They first combine the above two models for steady state conditions (Eq. 7) and use Moon et al.‘s data (steady state data) to evaluate the unknown parameter γ (0.45) and add an additional constant for vertical adjustment (5.2). They are able to combine the two models by approximating
They compare their model to real pupil measurements and show that it realistically predicts the dynamic pupil size given the luminance. However, only a few of the model’s parameters can be adapted to subjects and there is no mechanism to optimally fit the parameters to pupil data recorded under dynamic luminance conditions.
Fan et al. have also developed a dynamic model using a second order differential equation and have applied a pattern search method for finding optimal parameters using experimental data (Fan and Yao, 2011). However, this model is optimized for short flashes at a specific wavelength (100 ms pulse of 530 nm wavelength light) under otherwise light-adapted conditions in order to isolate the transient responses of the pupil and may not be suitable for longer pulses or more dynamic luminance conditions.
2.2 PLR mitigation
Most studies regarding psychosensory pupil responses are carefully designed to control the luminance of the stimuli in order to isolate the psychological effects of stimuli. It is common for studies to focus on the mean difference of the pupil size between a stimulus and a baseline with identical or similar luminance (Juvrud et al., 2021; Mitre-Hernandez et al., 2021). To achieve this, the pupil size during a time window containing the stimulus is averaged and compared to a similarly averaged pupil size during a baseline. With this approach the PLR is no longer relevant since the relative change of the pupil size is less dependent on the PLR when the stimulus and baseline have similar luminance. The aforementioned methodologies have some significant limitations since the environment and visual stimuli must be kept at a known constant luminance throughout the experiment. These limitations make it difficult for researchers to study the pupil in more complex, realistic and in-the-wild scenarios.
More recently, there has been an effort to attenuate or remove the effects of PLR from continuous pupil measurements under dynamic luminance conditions thus enabling the study of psychosensory pupil responses in a wider range of scenarios. We will group the different approaches into two categories: pupil residual approach and adaptive filtering.
2.2.1 Pupil residual approach
This type of approach uses an estimate of the PLR from some measure of luminance and then subtracts this estimate from the measured pupil size. The residual from this operation will no longer contain the effects of luminance but at the same time will retain the responses evoked by other cognitive processes. These methods thus assume that the measured pupil size, Pm, can be decomposed in three components as shown in Eq. 9:
Where PLR is the pupil light response, PPR is the psychosensory pupil response (i.e. the effect of interest), and ϵ corresponds to other effects that are not accounted for.
The current research using this type of approach most often uses steady-state models like the unified formula of Watson et al. (Watson and Yellott, 2012), completely disregarding the dynamics of the PLR (Raiturkar et al., 2016; John et al., 2018; Wong et al., 2020). Steady-state models will not accurately represent the pupil diameter under changing light conditions, only at steady-state conditions (constant luminance for at least 4 s). Furthermore, they often require some baseline measurements under controlled luminance conditions before the experiment to be later used as a baseline for attenuating the PLR.
To our knowledge only one publication uses a dynamic model to mitigate the PLR. Napieralski and Rynkiewicz (2019) use a PupilLabs eye-tracker and an ambient light sensor to collect the data of three participants. They used the dynamic model of Pamplona et al. to estimate the pupil size from the light sensor measurements and compare it to the eye-tracker measurements. They subtracted the estimated pupil size from the measured pupil size and found a mean difference of −0.22 mm, 0.04 mm, and −0.28 mm for each of the three participants respectively. No further quantitative analysis was performed and they conclude that it is “ [not possible] to distinguish, analyze and classify the root cause of each change in size of the pupil”. However, in our opinion, the sample size of their experiment and methodologies do not adequately support this conclusion.
Data-driven approaches can be used to estimate the PLR. For example, one can estimate the parameters of known steady state model using optimization techniques such as least squares (John et al., 2018). Neural networks, which are entirely data-driven, have also been successfully used to model different biological processes including pupil responses. One such example is the work of Koorathota et al. (2021) who trained an LSTM model to predict the pupil size based on gaze data (fixations, saccades, etc.) and past pupil size. In their experiment, they recorded gaze and pupil data of participants watching 5 min long academic video lectures and then answering some questions assessing their comprehension. Zandi and Khanh (2021) have trained a neural network model to estimate the parameters of a PLR model. They use Watson and Yellott (2012) steady state model for initial conditions and then use Fan and Yao (2011) dynamic model for the phasic pupil response and a polynomial model for the tonic response. They show that their neural network is effective in estimating the parameters of this combined model. Some recent techniques for data-driven dynamic model parameter estimation may also prove to be effective in this context such as Sparse Identification of Nonlinear Dynamical systems (SINDy) (Brunton et al., 2016).
2.2.2 Adaptive filtering
Another promising approach is to use an adaptive interference canceler (AIC) utilizing adaptive filters as proposed by Gao (2009); Gao et al. (2009). The authors designed an experiment using the Tobii T60 eye-tracker and a photo-diode to sense the luminance. They used the collected data to qualitatively show that they are able to more easily distinguish the different pupil responses between the congruent and incongruent cases of a Stroop test when using their approach. The same research group more recently applied the same technique to eliminate the PLR (Tangnimitchok et al., 2019). They used an RGB camera pointed to the subject’s face to measure the incident luminance on the eye area of the subject. They showed that their method of measuring luminance produced measurements that were highly correlated with a LUX meter (Extech 401036 Datalogging Light Meter). They used the TM3 Eye-Gaze Tracker (EyeTech Digital Systems Inc.) to measure the pupil size of the subjects. Unfortunately there is no further analysis on whether the resulting corrected pupil size data retains any of the psychosensory responses in that publication. In the subsequent doctoral dissertation of Tangnimitchok (2019), the author was not able to detect arousal using this method. The main limitation with this approach is that the adaptive filter requires some parameter tuning, although there are typically only a few parameters.
None of the publications regarding PLR mitigation cited above provide any quantitive analysis as to how well their technique attenuates the PLR nor do they provide quantitative results showing that the obtained PPR is more predictive of psychological processes than using the pupil size as is. In our work, we will only focus on the pupil residual approach while noting that adaptive filtering approaches are an interesting alternative. Specifically, we will use the Pamplona et al. dynamic model and show that it can be effective in attenuating a significant part of the PLR from the pupil measurements even without fitting the parameters to each subject’s data. In doing so, we will address some aspects of pupil residual approaches (luminance measurement, PLR latency, steady state vs. dynamic model) and motivate future work on data-driven dynamic models of PLR that could significantly improve upon our own results.
3 Dataset
The dataset we used in this paper consists of recordings of 140 subjects playing video games in realistic conditions (7.63% female, 1.53% non-binary, 0.76% no answer). The subjects mean age was 21.88 years old (standard deviation of 3.54, ranging from 18 to 36 years old). The data was collected in 41 experimental sessions where groups of 2 or 4 participants played the Counter-Strike: Global Offensive (CS:GO) first person shooter (FPS) video game on a computer. Several modalities were recorded during the game using custom data acquisition software modules (Fanourakis et al., 2020):
• mouse/keyboard button presses - recorded at an irregular rate (as button presses occurred).
• game data (health, armor, position, damage taken, damage received, etc.)–recorded at 64Hz using a custom game plugin.
• gameplay video–recorded at 30Hz using Open Broadcasting Studio (OBS).
• color and depth video of the face–recorded at 30Hz using an Intel RealSense D435 camera.
• Seat pressure–recorded at 10Hz with a Sensing Tex seat pressure mat.
• Physiological data (electrocardiogram, electrodermal activity, respiration)–recorded at 100Hz using a Bitalino device
• Eye-tracker data (gaze, pupil diameter– - recorded at 60Hz using a Tobii pro nano.
All data was synchronized using the Lab Streaming Layer (LSL) software library1.
The data was collected at several video game LAN events in Switzerland over the course of 2 years: SwitzerLAN2 2020, SwitzerLAN 2021, and PolyLAN3 36. The experimental area was setup in an approximately 5 square meter area within the event and included 4 gaming PCs each equipped with the sensors mentioned earlier and 1 server PC where the game server and LSL Lab Recorder were running.
The study and data collection was approved by the ethical committee of the University of Geneva and conforms to all ethical guidelines set forth by the institution.
3.1 The counter-strike: Global offensive game
In our experiments we utilized Valve’s Counter-Strike: Global Offensive (CS:GO). It is a free and modable multiplayer first person shooter (FPS) developed in the Half-Life 2 game engine. It is also popular in the e-sport community. The game includes several games modes: demolition, hostage, deathmatch, and team deathmatch.
For this dataset, we used the team deathmatch game mode where two teams try to eliminate each other. Each player started with 100 health points and 100 armor points and were randomly placed on the game map. They were equipped with a random set of weapons from an assortment of assault rifles, long range rifles, pistols, light and heavy machine guns, and a knife. The goal of the game was to kill the players in the enemy team as many times as they can while avoiding to get killed. A player was killed once their health points reached 0, and they were subsequently revived (respawned) at a random location in the map after 2 s. If a player managed to get 2 kills in a row without dying they were rewarded with an item (healthshot) which restored 50 health points when used.
3.2 Experimental protocol
Groups of 2 or 4 subjects were spontaneously recruited at the LAN events to play a single round of one versus one (2 subjects per experimental session) or two versus two (4 subjects per experimental session) team deathmatch. The subjects first read and signed a consent form which describes the experiment and the data that will be recorded. Immediately after, they answered a questionnaire with demographic questions (age, sex) as well as questions about their experience playing various types of video games (Bavelier lab Video Game questionnaire4), their fatigue level (Greenberg et al., 2016), and their closeness of relationship with the other subjects in the experiment group (Gächter et al., 2015). Then, the sensors were attached and calibrated as necessary.
Players adjusted their game settings before joining the experiment’s game server where they started with a 2 min warmup round. After the warmup round, there was a 1 min period of time reserved for baselining where the game characters were frozen in place. After baselining, the main round started and had a duration of 10 min.
After the game was finished, the sensors were removed and the players used the PAGAN tool (Melhart et al., 2019) to self-annotate their own recorded gameplay video according to the arousal or valence emotional dimensions using RankTrace (Lopes et al., 2017), a relative and unbounded method for continuous annotations.
4 Methods
4.1 Data pre-processing
Recall that our data was collected on-sight at large gaming LAN events and was therefore far from laboratory conditions. The environment was often noisy, and the lighting was not controlled. Consequently, there were often instances where we could not ensure the quality of the data. For the modalities used in this paper (eye-tracking, game events, game video) we could use the data of 106 subjects in 34 experimental sessions (out of 140 subjects in 41 experimental sessions). The data of a subject was used if all previously mentioned modalities had at least 70% of the signal in good quality, that is to say that less than 30% of the signal was either missing or was of bad quality (missing, high SNR, corrupted data, etc.) according to visual inspection.
Since we used the LSL library we are confident that the clock is synchronized among the different modalities, however the frequency (sampling rate) and phase of each modality is different. To resolve this issue, we simply aligned the data by their nearest timestamps.
The eye-tracker measured the pupil size and gaze for each eye individually, hence we averaged the values between the two eyes to get a unique value. We acknowledge that there exist conditions such as anisocoria where the pupil size is not the same between the two eyes under the same luminance. Although this condition can be fairly common (13.7% of population), the difference between pupils is typically less than 0.7 mm (only 2.7% have differences greater than 0.7 mm) (George et al., 2019). Furthermore, the relative changes of the pupil size are more relevant in our case than the absolute measures and these changes are not significantly affected by averaging the two pupil sizes together. There are also conditions like strabismus where the gaze of each eye might be different, however, it is not very common among adults (Hashemi et al., 2019).
During blink events the eye-tracker is not able to detect the pupils and therefore can neither measure the pupil size nor the gaze on the screen. Furthermore, the eye-tracker’s pupil measurement is not accurate when the eyelid is obstructing part of the pupil during blinking, consequently, the pupil is measured to be smaller than it actually is. To mitigate these effects, at each blink event we removed 40 ms of data before and 100 ms of data after each blink. In total, for each blink we removed 140 ms of pupil data in addition to the missing data due to the pupil being covered by the eyelids. Then we linearly interpolated the pupil size and gaze (averaged between the two eyes) to fill in these gaps. We also used the same strategy when dealing with missing eye-tracking data in general (ex. packet loss, intermittent errors, etc.).
4.2 Luminance
To compute the perceived lightness (luminance) of each pixel on the screen we compute the Lstar from CIELAB (Robertson, 1977) using the RGB values. We first convert the RGB values from gamma encoding to linear encoding, then we apply the standard coefficients for sRGB (0.2126, 0.7152, 0.0722 for R, G, and B respectively) to compute the RGB luminance. Finally, we convert the RGB luminance to the perceived lightness, Lstar, which closely matches human light perception. It is important to note that Lstar does not take the Helmholtz–Kohlrausch effect (Donofrio, 2011) into account wherein the intense saturation of spectral hue is perceived as part of the color’s luminance.
Having the Lstar value for each pixel, we then averaged the Lstar pixel values within an 8° horizontal foveal area of the screen centered at the gaze target of the subject. We used a rectangular area instead of circular since it simplified our computations. Under our experimental conditions this foveal area was approximately a 16 cm by 9 cm rectangular region on the screen (same aspect ratio as the screen). We did this for each frame of the video recording, always centering on the gaze target at each frame using the eye-tracking data.
The Pamplona model expects the luminance to be expressed in lumens. We used the computed luminance as described above and considered two different methods for converting to lumens. The first naive method was to do a simple conversion to lumens using the maximum brightness that the screen was capable of producing. We realize that this is not an accurate conversion since the maximum brightness of the screen can be adjusted through its settings, however, it still gives useful information that is within a realistic range of expected luminosity in lumens. Another issue with this method is that a zero value of the Lstar luminance will be converted to zero lumens entering the pupil, completely disregarding the environmental light sources. The second method made use of the pupil measurements to estimate the range of the source luminance using the steady state Pamplona equation (Eq. 7. We then computed a linear transformation of the Lstar luminance such that it matched the range of the estimated source luminance. Ultimately, we used the second method to transform the Lstar luminance into lumens for use in Pamplona et al.‘s dynamic model due to the aforementioned issues of the naive first method.
4.3 PLR latency
One important parameter that we could compute from the collected data was the time delay (latency) between the luminance and the PLR. For each subject, we computed the cross-correlation between the derivatives of the luminance and the pupil measurements, we then found the time delay which gave the largest magnitude (absolute value) of the cross-correlation. This indicates the average time delay required for the pupil to respond to a change in luminance. We found that the mean pupil latency between the participants in our experiments was 474 ms with a standard deviation of 81 ms. This value is higher than what we have seen reported in other literature (Link and Stark, 1988; Bergamin and Kardon, 2003; Kasthurirangan and Glasser, 2006) (200 ms–350 ms average) and we suspect that the cross-correlation method overestimates the latency due to the smoothness of the pupil response compared to the sharper transitions of the luminance. Although we computed a single latency value for each participant, it is possible that the latency varies dynamically depending on factors such as the current pupil size and magnitude of the luminance change at each time step.
4.4 PLR models
For the dynamic model, we used Pamplona et al. model in Eq. 8 with the latency and luminance computed as described previously. We implemented a numerical solver in Python using gradient descent to compute the estimated pupil at each time step.
For comparison, we also applied a steady state model. We selected the exponential model since the steady state PLR is non-linear and the exponential model does not require additional parameters such as the age, or field area like Watson’s et al. unified formula. The exponential model was also found to be more accurate than linear and cubic models by John et al. (2018). We used the Lstar luminance values directly and used the Levenberg-Marquardt non-linear least squares algorithm (curve_fit function in the SciPy python library5) to find the optimal parameters for the model for each participant.
4.5 Arousal self-annotations and the arousal indicator
The subjects self-annotated their gameplay according to the level of arousal they felt using RankTrace (Lopes et al., 2017), a relative and unbounded annotation method. Subjects were instructed to annotate their level of arousal relative to previous moments in the game. This lead to very different annotation styles in the experiment and two such examples can be seen in Figures 1, 2 (blue curves).

FIGURE 1. Example of an annotation–subject A.
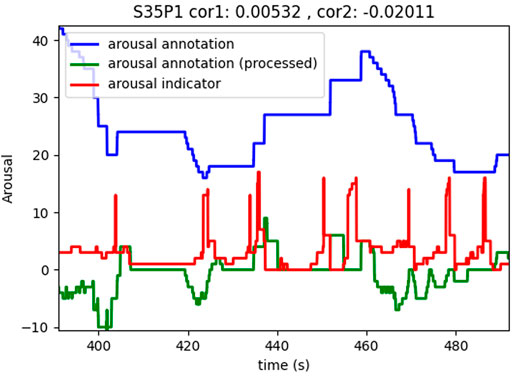
FIGURE 2. Example of an annotation–subject B.
In an effort to make the self-annotations more consistent across subjects we performed some post-processing to detrend them. When analyzing arousal traces, the relative changes in arousal in a small neighborhood are often more relevant than the differences on more distant parts of the signal. With this is mind, we developed our trend removal method as follows: We first computed the derivative of the arousal trace,
Both the raw self-annotations and detrended self-annotations were used as machine learning targets. Different normalization methods were applied and tested such as no normalization, normalization to a range of 0–1, or standardization to have a mean of 0 and standard deviation of 1.
Continuous real-time annotations of any video or audio stream tend to suffer from small delays (typically less than 3 s) between changes in that stream and the annotator response to these changes. To effectively mitigate this delay, it is necessary to understand what events each annotator is responding to in the stream and measure the delay from that. Furthermore, the delay may not be the same across the entire duration of the annotation since different events may require different cognitive effort to analyze and respond to. Therefore, mitigating annotation delays for all subjects in our experiment would require significant effort and we have not addressed it in this work.
4.5.1 Arousal indicator
Considering that the self-annotations are not consistent across participants, and it is generally not a good practice to over-process or manipulate the self-annotations, we also developed an indicator of arousal based on game events. This indicator depended on the amount of danger that a player was in at any given moment. The assumption is that specific game events should induce higher arousal than other events. The indicator was computed using Eq. 10:
Where the function
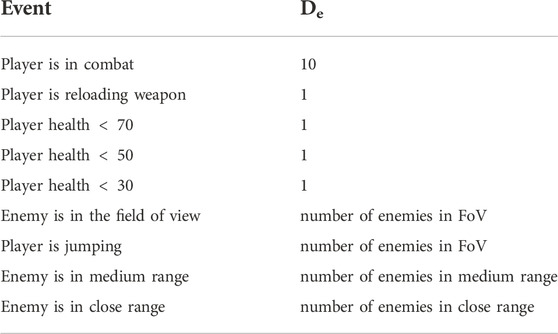
TABLE 1. Arousing game events and their arousal value Dϵ.
The game events in Table 1 were selected among other recorded game events based on their relevance towards the game’s two main goals: staying alive and killing the enemy. The first game event in that table, “combat”, is directly relevant to the two goals since the most common outcome of combat will either be a goal success (enemy killed) or a goal failure (player death). The game events “reloading weapon” and “jumping” prevent the player from making a fight or flight decision since in the former, the player is not able to fire their weapon for some time (cannot fight) and in the latter the player cannot move to take cover and save themselves from harm. The “player health” events give an indication as to the probability of achieving or failing the goals. All else being equal, a player with lower health will be killed more quickly during combat. The “enemies in field of view” event puts the player in the position to seek goal resolution by taking action to stay alive and/or kill the enemy. We acknowledge that these events may elicit different levels of arousal for different subjects and in different contexts. Despite this, we expect that all subjects will experience an increase in arousal during those events even if it is not at the same level.
The red curves in Figures 1, 2 illustrate the results of this computation. It is evident in the figures that the arousal indicator is more consistent across subjects (same amplitude, similar dynamics, etc.) and correlates with self-annotated arousing moments as can be seen by the peaks in the indicator which often precede peaks in the processed self-annotations.
4.6 Machine learning model
We implemented a simple convolutional neural network model in Python using PyTorch to recognize the arousal level of the players from the pupil size. Table 2 gives a summary of the architecture.
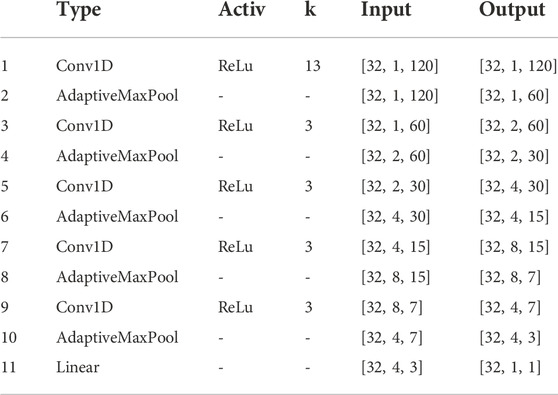
TABLE 2. Machine learning model architecture. For the convolution layers, the kernel size is indicated in column k, stride =1,
For the model training, we used a batch size of 32, the mean squared error (MSE) loss function and the Adam optimizer with a learning rate of 0.001. We used a leave-one-subject-out cross-validation strategy and split the training data into 80% training and 20% validation (for early stopping). In total we trained 106 models and used the data that was left out of each model as its test data. We used the concordance correlation coefficient (CCC) between the ground truth arousal indicator and the predicted arousal indicator to evaluate the performance of our models.
For each participant, we estimated the time delay between luminance and pupil size and then used the luminance measurements and time delay to compute an estimate of the pupil size using the Pamplona et al. model. We then normalized (z-score) both the measured pupil size and estimated pupil size. We used the normalized values to compute the pupil residual as follows:
Where Pm is the measured pupil size and PLR is the pupil size estimated from the luminance data.
The data was segmented for each participant using a 2 s rolling window with a step size of 2 s. Given that the sampling rate of the eye-tracking data was 60Hz, each segment had a length of 2*60 = 120 samples. The input tensors of the model consisted of the segmented pupil size data (pupil residual or normalized pupil measurement) and had a size of
5 Results
5.1 Attenuation of PLR
Firstly, we seek to show the effectiveness of the two PLR models (a steady state and a dynamic) at attenuating the luminace response from the pupil. To achieve this we must determine an appropriate metric for this attenuation. We will use Figure 3 as an illustrative aid. In this figure, we have simulated the pupil response to changes in luminance (yellow) using a dynamic model (black) and a steady state model (blue). We also show the residual between the simulated pupil with the steady state pupil estimate (orange). The sampling rate for this simulation is 60Hz. For illustrative purposes we have not applied any pupil response latency so that any change in luminance will have an immediate effect on the pupil as can be seen in the figure. We computed the Pearson correlation between the luminance and both the simulated pupil and the steady state pupil as − 0.9 and −0.99 respectively. This indicates, as expected, a strong correlation between luminance and pupil diameter. Also expected, is the near perfect correlation between the steady state model and luminance since any change in luminance is immediately and proportionally reflected in the steady state estimate, whereas the simulated dynamic response is smoother and hence has a slighly lower correlation with luminance. Next, we computed the Pearson correlation between the residual (steady state pupil subtracted from the simulated pupil) and the luminance as − 0.012. This seems to indicate that the steady state pupil has significantly attenuated the PLR, however, it is clear from this example that there are obvious artifacts of luminance in the residual. Since these artifacts in the residual are most prominent during changes in luminance (where the derivative of luminance is non-zero), we computed the derivative of the luminance before computing the Pearson correlation. The result was a Pearson correlation of 0.28. This seems like a better indicator, but recall that the signals in this example are perfectly aligned (artificially). Any small misalignment can dramatically reduce the magnitude of the correlation. For example, by shifting one of the signals by a single sample - a very likely scenario with real world data - the correlation becomes 0.03. To mitigate this issue, we may instead compute the cross correlation of these two signals, however this assumes that the latency is constant, an assumption that is not necessarily valid for real pupil data as was briefly mentioned previously when discussing the PLR latency. Therefore this is also not a good nor robust indicator of luminance attenuation.
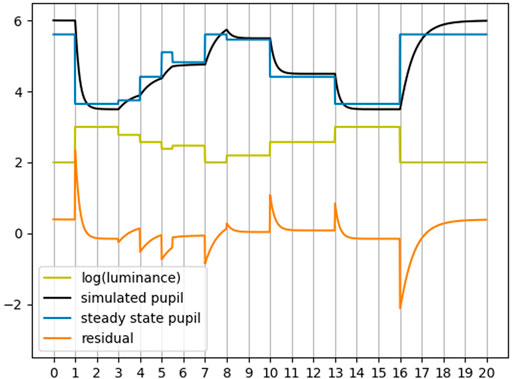
FIGURE 3. Simulated example of PLR given luminance. Horizontal axis units are in seconds. Correlation is not a good indicator of attenuation of luminance effects.
Although we can say with confidence that two signals are correlated when the Pearson correlation has a large magnitude, the opposite is not necessarily true. There may be other features between the two signals which relates them that are not represented by this simple statistic. An additional measure is necessary to confirm that the residual has less information about the luminance. To that effect, for the experimental data, we will evaluate the attenuation of PLR by analyzing the performance of machine learning models to predict the luminance from the residual. We argue that if the residual is unable to predict luminance then it is unlikely to contain information related to luminance and thus it will have successfully attenuated the effects of luminance.
In Figure 4 we report the Pearson correlations between luminance and several other signals. We see that the measured pupil is negatively correlated with luminance as we expect (higher luminance leads to a smaller pupil size). We also see that the steady state PLR model (exponential model) produces pupil estimates which are almost perfectly correlated with luminance. The dynamic model produces estimates which are also highly correlated with luminance but not quite as strongly as the steady state model. Both these observation are inline with our previous example from Figure 3. Finally, we see that the Pearson correlation for the arousal indicator is near 0. There is not a linear relationship between luminance and the arousal indicator. However a non-linear relationship might be present since various game events such as firing a weapon produces bright flashes on the screen. We will investigate if luminance contains this type of information in the next subsection.
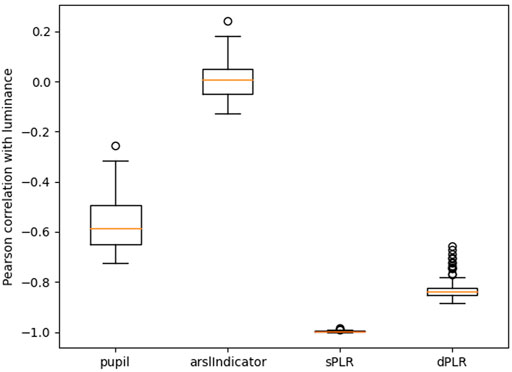
FIGURE 4. Pearson correlation coefficient of luminance with the: measured pupil, arousal indicator, PLR using exponential model (sPLR), PLR using dynamic model (dPLR). All the correlation distributions are statistically significantly different from each other (paired Wilcoxon test with p-value less than 0.001).
In Figure 5 we report the Pearson correlations between the pupil size and several other signals. We once again see that the pupil is negatively correlated with luminance. We also see that the pupil is correlated with both PLR estimates and this correlation is approximately equal in magnitude as the correlation with the luminance. This is consistent with the fact that both PLR estimates have a median correlation with luminance that is higher than 0.8 in magnitude. The arousal indicator also seems to be somewhat correlated with the pupil size which tells us that the pupil holds some direct information about the arousal indicator.

FIGURE 5. Pearson correlation coefficient of measured pupil with the: luminance, arousal indicator, PLR using exponential model (sPLR), PLR using dynamic model (dPLR). All the correlation distributions are statistically significantly different from each other (paired Wilcoxon test with p-value less than 0.001) except sPLR and dPLR.
In Figure 6 we give a representative example of the PLR estimates. The steady state model is indicated in blue and the dynamic model in green. The measured pupil is indicated in black. Our main observations are that both the steady state model and the dynamic model seem to follow the real pupil measurements quite closely, however, very notably, the steady state model seems to be more noisy and this is directly due to the noisiness of the luminance. Any change in luminance is directly reflected in the steady state estimate. Although the same luminance (after rescaling, but no filtering) was used for the dynamic model, we see that the dynamic model estimate is much smoother and more similar to the characteristics of the measured pupil size in terms of visual properties. Another important observation is that in both PLR estimate models, whenever there is a change in luminance (and subsequent PLR response) there are larger errors between the measured pupil and the estimates. This can result in significant artifacts in the residuals. Although both PLR model residuals will have these artifacts, the dynamic model seems have less prominent artifacts which are still not negligible.
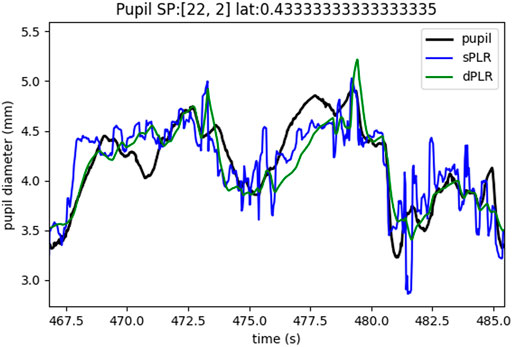
FIGURE 6. Example of pupil measurements (black), steady state model estimate (blue), dynamic model estimate (green).
In Figure 7 we report the Pearson correlation of luminance with the residuals. We see that both residuals correlation with luminance are significantly smaller in magnitude than the measured pupil and the PLR models (see Figure 4. Although this may seem to indicate that both PLR residuals are effective in attenuating PLR, recall that this correlation statistic is not conclusive as to the attenuation of luminance information from the pupil and further tests are required. The test that we have chosen to perform is an empirical test of training machine learning models to predict luminance from the residuals. The results of this test are shown in Figure 8.
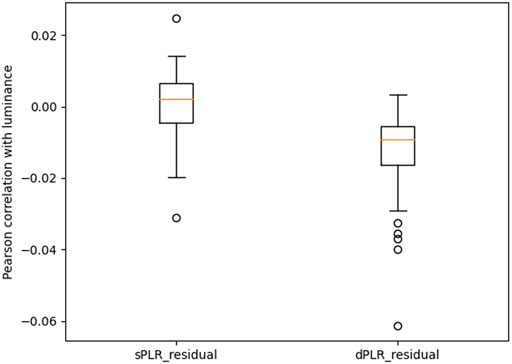
FIGURE 7. Pearson correlation coefficient of luminance with the: PLR residual using exponential model (sPLR_residual), PLR residual using dynamic model (dPLR_residual). The two correlation distributions are statistically significantly different (paired Wilcoxon test with p-value less than 0.001). Correlation is not a good indicator of attenuation of luminance effects.
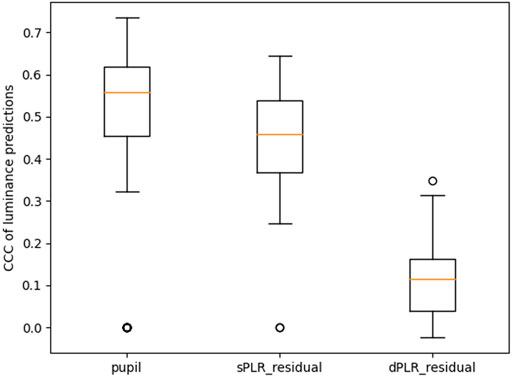
FIGURE 8. Performance summary of models predicting luminance. All the CCC distributions are statistically significantly different from each other (paired Wilcoxon test with p-value less than 0.001 for all except between pupil and sPLR_residual whose p-value is less than 0.05).
In Figure 8 we show the performance summary of machine learning models (convolutional neural network previously described in Section 4) trained to predict luminance from the measured pupil, the residual using the steady state model PLR (sPLR_residual), and the residual using the dynamic model PLR (dPLR_residual). The performance metric is the concordance correlation coefficient (CCC). For each case we used leave-one-out cross validation. We notice that the pupil measurements are highly predictive of luminance (median CCC of 0.56), and this is expected since the measured pupil has not been treated in any way to attenuate the PLR and therefore contains significant information about the luminance. The model trained to predict luminance from the dynamic model PLR residual (dPLR_residual) has a significantly reduced performance (median CCC of 0.11). This indicates that the machine learning model is less able to exploit any features of this residual to predict luminance. We conclude that this particular residual therefore contains less information about luminance i.e. the PLR has been significantly attenuated. This is not the case with the model trained using the steady state model PLR residual (sPLR_residual). This residual performs slightly worse than using the pupil measurements (median CCC of 0.46). Clearly, this residual still contains features about the luminance and has done poorly attenuated the PLR.
As we already discussed with the example in Figure 3, when the residual and luminance are perfectly aligned then the residual has a higher correlation with the derivative of the luminance compared to not taking the derivative. The main issue with this approach is that the signals must be perfectly aligned, and this is not the case with our data. CNNs are not likely to be significantly affected by this misalignment when evaluating the attenuation performance. In Figure 9 we show the performance of the CNN trained to predict the derivative of luminance from the measured pupil, the residual using the steady state model PLR (sPLR_residual), and the residual using the dynamic model PLR (dPLR_residual). It is evident that the steady state model PLR residual (sPLR_residual) contains artifacts that are highly predictive of changes in luminance (median CCC of 0.83). We also see that the dynamic model PLR residual (dPLR_residual) also contains artifacts that are predictive of changes in luminance but much less so (median CCC of 0.37). It is not surprising based on our previous discussion about the example of the PLR estimates in Figure 6.
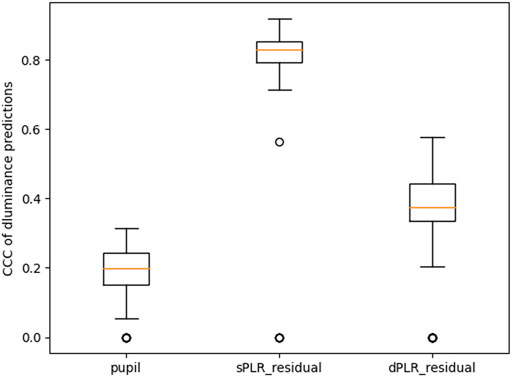
FIGURE 9. Performance summary of models predicting the derivative of luminance. All the CCC distributions are statistically significantly different from each other (paired Wilcoxon test with p-value less than 0.001).
To summarize, in this subsection we have shown that the pupil is highly correlated with luminance as it is expected since luminance can directly affect the size of the pupil (see PLR). We also see that both PLR models (steady state and dynamic) have similar characteristics to the measured pupil with the dynamic model appearing to be much more realistic. Lastly we showed that both PLR residuals have attenuated PLR from the pupil size data but, clearly, the PLR residual using the dynamic PLR model has done so much more effectively. There remain non-negligible artifacts in the residuals due to small errors in the latency computation and the discrepancy of pupil constriction and dilation velocity between the measured pupil and the PLR models (the steady state model having instantaneous dilation and constriction). These artifacts are most prominent when there are abrupt changes in the luminance.
5.2 Prediction of arousal
We trained neural network models using the normalized (per subject) pupil measurements, the steady state PLR model pupil residual (sPLR_residual), the dynamic PLR model pupil residual (dPLR_residual), and luminance to predict the self-annotated arousal and the arousal indicator with leave-one-out cross validation as described in Section 4.
5.2.1 Target: Self-annotated arousal
The models trained to predict both the self-annotations and the detrended self-annotations as described in Section 4 had negligible performance (median CCC below 0.05), hence we will not include detailed results for these targets. Further post-processing of the self-annotations including mitigation of the annotator delays (see Section 4) may yield improvements in model performance, however excessive post-processing of self-annotations, especially with non-standard methods, is generally not a good practice.
Given the lack of inter-subject consistency in the self-annotations (target inconsistency), leave-one-out cross validation will tend to yield poor results when used directly for regression tasks hence subject-specific models may be better suited in this context. Changing to a classification task or preference learning may also result in significant improvements since the former simplifies the learning task and the latter has been shown to work well when using this type of relative self-annotations. Further improvements could also be achieved through the use of hand-crafted features.
5.2.2 Target: Arousal indicator
The models trained to predict the arousal indicator performed well enough to allow us to compare the effects of attenuating the PLR. In Figure 10 we show boxplots of the concordance correlation coefficient (CCC) of the predictions on the test sets (subjects that were left out).

FIGURE 10. Performance summary of models predicting the arousal indicator. All the CCC distributions are statistically significantly different from each other (paired Wilcoxon test with p-value less than 0.001 for all except between pupil and luminance whose p-value is less than 0.01).
The model trained with the measured pupil resulted in a median performance of 0.19 CCC, meaning that the pupil data contains at least some information about the arousal indicator. The models trained with the dynamic model PLR residual (dPLR_residual) have a better median performance of 0.23 CCC. As we showed in Section 5.1 this residual has significantly attenuated the PLR. This could indicate that while the residual has reduced the effects of PLR it has also preserved the arousal effects on the pupil.
Unexpectedly, the models trained with the steady state model PLR residual (sPLR_residual) has an even better median performance of 0.26 CCC. It is possible that luminance artifacts are providing additional information about the arousal indicator. To verify this, we also trained models to predict the arousal indicator from luminance. The results show that even on its own, luminance has some non-negligible predictive power (median CCC of 0.14). This can be explained by the fact that some of the arousing events also produce bright flashes of light on the screen (ex. guns firing). It seems that the luminance artifacts that are still present in the sPLR_residual, especially during abrupt luminance changes (see Section 5.1), are helping with the prediction of the arousal indicator. To a lesser degree, this could also be true about the dPLR_residual.
We do not believe that the luminance artifacts are the main factor which improves the prediction performance since the models trained with the raw pupil size (which contains a lot of information about the luminance) and the models trained with luminance have a lower performance than both models that were trained with the PLR residuals. Instead, we believe that the residuals have accentuated arousal effects on the pupil in portions where the luminance is more stable and at the same time have accentuated portions where the luminance has abrupt changes (luminance artifacts that could be related to arousing game events). The combination of these two effects could explain why the residual-trained models perform better than both the pupil-trained and the luminance-trained models.
6 Discussion
Despite using a video game dataset with no specific considerations regarding eye-tracking and pupil recordings, we showed that we are able to attenuate the effects of PLR and improve the performance of arousal prediction. We used the screen’s pixel RGB values of the screen as a proxy for the luminance perceived by the pupil and showed a high correlation between this proxy luminance and the pupil size. We then used a dynamic and a steady state PLR model to estimate the PLR from the estimated luminance and subsequently subtracted it from the pupil size measurements to attenuate the PLR (pupil residual approach). We showed that the dynamic PLR model residual is significantly more effective in attenuating the PLR from the pupil measurements while at the same time achieving a significant improvement in the performance of machine learning models trained to recognize an indicator of arousal based on game events (CCC of 0.23) compared to using the pupil size directly (CCC of 0.19). The steady state PLR model residual while not as effective in attenuating the PLR also improved the performance of the arousal detection (CCC of 0.26), possibly due to remaining luminance artifacts that were related to arousing events such as the weapon firing. The work we have presented can be of direct interest to researchers seeking to study psychosensory pupil responses in environments that utilise a screen such as video games and virtual reality experiences.
In this work we have also identified some possible “traps” when evaluating the effectiveness of PLR attenuation. We propose to use machine learning to evaluate PLR attenuation since there may remain artifacts in the residuals which are non-linearly related to luminance. Machine learning models can make use of this non-linear relationship while commonly used metrics such as the Pearson correlation cannot. Furthermore, we have seen that the performance of models predicting arousal targets from pupil (or related) inputs can be augmented if the target has some dependency on luminance. It is important to report on this dependency for properly interpreting the results.
When using the pupil residual approach for PLR attenuation, we encourage researchers to use a dynamic PLR model since it is better at attenuating the PLR from pupil measurements and can better isolate arousal effects on the pupil when the arousing events do not affect luminance.
Future directions for this work include improving the latency detection between the luminance and PLR, optimizing the parameters of the PLR models or developing a more flexible PLR model from the ground up, training subject-specific models to detect the self-annotated arousal, and further validating our methods using other datasets.
Improving the latency detection between the luminance and pupil diameter could vastly improve the alignment of the estimated PLR with the pupil measurements. The current method of using the peak of the cross-correlation tends to overestimate the latency and the resulting pupil estimate is misaligned which introduces some artifacts in the residual (see Supplementary Figure S1). Furthermore, the latency was computed as a constant for each participant, however, this latency can change dynamically depending on the current state of the pupil, the luminance, and other factors such as fatigue. Computing this dynamic latency could improve the PLR model accuracy and subsequently reduce unwanted artifacts in the residual.
We used the default parameters of the dynamics of the dynamic PLR model (those for an average person) which likely resulted in some smaller luminance artifacts in the residual. Estimating the PLR dynamics for each individual subject could further reduce these unwanted artifacts. This task however, is challenging to accomplish with data recorded outside of highly controlled experiments.
We were not able to successfully train models to detect the self-annotated arousal and so we only reported results for the event-based arousal indicator. There are several potential causes for this failure and we will summarize some of them and their probable solutions. The self-annotations have a small (less than 3 s) delay between the stimulus events and the annotator response. This is the result of the non-negligible cognitive processing effort required by the annotator to annotate their gameplay video. Computing this delay requires careful analysis of the video and the annotations and is not a realistic solution given the number of videos in our dataset, however, increasing the window size for the input signals in the ML model may result in some improvement in the performance. The self-annotations are relative and unbounded and we have not treated them as such. Additional processing steps to “bind” them, improving the current model architecture, or using them in different types of machine learning tasks (ex. preference learning) may result in significant performance improvements. For the great majority of the annotators (experimental subjects) it was their first time performing such an annotation task. Due to time limitations during the experiment there was no opportunity to train them or verify their capacity to consistently annotate their gameplay video. This likely resulted in many unreliable annotations and we do not know that any solution to this issue exists.
To further advance the state of the art in PLR attenuation, a truly subject-specific dynamic model must be developed either by adapting and fitting subject-specific data to existing models such as Pamplona et al. or to newly developed dynamic models. Towards this end, we could use parameter optimization techniques, other recent techniques such as Sparse Identification of Nonlinear Dynamical systems (SINDy) (Brunton et al., 2016), or other machine learning methods. A data-driven and accurate dynamic PLR model will further facilitate the use of eye-tracking for gaining insights into cognitive processes in a much wider range of scenarios both in research and commercially.
Data availability statement
The raw data supporting the conclusions of this article will be made available by the authors, without undue reservation.
Ethics statement
The studies involving human participants were reviewed and approved by University of Geneva’s University Commission for Ethical Research in Geneva (CUREG). The patients/participants provided their written informed consent to participate in this study.
Author contributions
MF and GC contributed to the conception and design of the study. MF performed the initial data analysis and wrote the first draft of the manuscript. GC provided feedback and suggestions for further analysis. All authors contributed to manuscript revision, read, and approved the submitted version.
Funding
This work is co-financed by Innosuisse, project 34316.1 IP.ICT. Open access funding was provided by the University of Geneva.
Acknowledgments
We would like to thank the organizers of the SwitzerLAN and PolyLAN events for welcoming us to the LAN events, Logitech for providing materials and discussions regarding the experiment, and Professor Daphne Bavelier for the fruitful discussions regarding this study.
Conflict of interest
The authors declare that the research was conducted in the absence of any commercial or financial relationships that could be construed as a potential conflict of interest.
Publisher’s note
All claims expressed in this article are solely those of the authors and do not necessarily represent those of their affiliated organizations, or those of the publisher, the editors and the reviewers. Any product that may be evaluated in this article, or claim that may be made by its manufacturer, is not guaranteed or endorsed by the publisher.
Supplementary material
The Supplementary Material for this article can be found online at: https://www.frontiersin.org/articles/10.3389/frvir.2022.971613/full#supplementary-material
Footnotes
1https://labstreaminglayer.org
4https://www.unige.ch/fapse/brainlearning/vgq/
References
Bergamin, O., and Kardon, R. H. (2003). Latency of the pupil light reflex: Sample rate, stimulus intensity, and variation in normal subjects. Invest. Ophthalmol. Vis. Sci. 44, 1546. doi:10.1167/iovs.02-0468
Bradley, M. M., Miccoli, L., Escrig, M. A., and Lang, P. J. (2008). The pupil as a measure of emotional arousal and autonomic activation. Psychophysiology 45, 602–607. doi:10.1111/j.1469-8986.2008.00654.x
Brunton, S. L., Proctor, J. L., and Kutz, J. N. (2016). Discovering governing equations from data by sparse identification of nonlinear dynamical systems. Proc. Natl. Acad. Sci. U. S. A. 113, 3932–3937. doi:10.1073/pnas.1517384113
Chanel, G., and Lopes, P. (2020). “User evaluation of affective dynamic difficulty adjustment based on physiological deep learning,” in Lecture notes in computer science (including subseries lecture notes in artificial intelligence and lecture notes in bioinformatics. doi:10.1007/978-3-030-50353-6_1
Christy, T., and Kuncheva, L. I. (2014). Technological advancements in affective gaming: A historical survey. GSTF J. Comput. 3, 38. doi:10.7603/s40601-013-0038-5
Clay, V., König, P., and König, S. U. (2019). Eye tracking in virtual reality. J. Eye Mov. Res. 12, 27–31. doi:10.16910/jemr.12.1.3
Crawford, B. (1936). The dependence of pupil size upon external light stimulus under static and variable conditions. Proc. R. Soc. Lond. Ser. B - Biol. Sci. 121, 376–395. doi:10.1098/rspb.1936.0072
Donofrio, R. L. (2011). Review paper: The helmholtz-kohlrausch effect. J. Soc. Inf. Disp. 19, 658. doi:10.1889/JSID19.10.658
Ellis, C. J. (1981). The pupillary light reflex in normal subjects. Br. J. Ophthalmol. 65, 754–759. doi:10.1136/bjo.65.11.754
Fan, X., and Yao, G. (2011). Modeling transient pupillary light reflex induced by a short light flash. IEEE Trans. Biomed. Eng. 58, 36–42. doi:10.1109/TBME.2010.2080678
Fanourakis, M., Lopes, P., and Chanel, G. (2020). “Remote multi-player synchronization using the labstreaming layer system,” in Foundations of digital games demos (Malta).
Gächter, S., Starmer, C., and Tufano, F. (2015). Measuring the closeness of relationships: A comprehensive evaluation of the ’inclusion of the other in the self’ scale. PLOS ONE 10, e0129478. doi:10.1371/journal.pone.0129478
Gao, Y. (2009). A digital signal processing approach for affective sensing of a computer user through pupil diameter monitoring. Miami, FL: Ph.D. thesis, Florida International University. doi:10.25148/etd.FI09120828
Gao, Y., Barreto, A., and Adjouadi, M. (2009). “Comparison of pupillary light reflex sytem modeling with H and LMS adaptive algorithms,” in 2009 IEEE 13th Digital Signal Processing Workshop and 5th IEEE Signal Processing Education Workshop (IEEE), 167–171. doi:10.1109/DSP.2009.4785915
George, A., Abraham, A., Nair, S., and Joseph, M. (2019). The prevalence of physiological anisocoria and its clinical significance - a neurosurgical perspective. Neurol. India 67, 1500. doi:10.4103/0028-3886.273623
Greenberg, S., Aislinn, P., and Kirsten, D. (2016). Development and validation of the fatigue state questionnaire: Preliminary findings. Open Psychol. J. 9, 50–65. doi:10.2174/1874350101609010050
Hashemi, H., Pakzad, R., Heydarian, S., Yekta, A., Aghamirsalim, M., Shokrollahzadeh, F., et al. (2019). Global and regional prevalence of strabismus: A comprehensive systematic review and meta-analysis. Strabismus 27, 54–65. doi:10.1080/09273972.2019.1604773
Henderson, R. R., Bradley, M. M., and Lang, P. J. (2018). Emotional imagery and pupil diameter. Psychophysiology 55, e13050. doi:10.1111/psyp.13050
Holladay, L. L. (1926). The fundamentals of glare and visibility. J. Opt. Soc. Am. 12, 271. doi:10.1364/JOSA.12.000271
John, B., Raiturkar, P., Banerjee, A., and Jain, E. (2018). “An evaluation of pupillary light response models for 2D screens and VR HMDs,” in Proceedings of the 24th ACM Symposium on Virtual Reality Software and Technology, New York, NY, USA (New York, NY: ACM), 1–11. doi:10.1145/3281505.3281538
Juvrud, J., Ansgariusson, G., Selleby, P., and Johansson, M. (2021). Game or watch: The effect of interactivity on arousal and engagement in video game media. IEEE Trans. Games 1502, 308–317. doi:10.1109/TG.2021.3073084
Karpouzis, K., and Yannakakis, G. N. (2016). Emotion in games of socio-affective computing, 4. Cham: Springer International Publishing. doi:10.1007/978-3-319-41316-7
Kasthurirangan, S., and Glasser, A. (2006). Age related changes in the characteristics of the near pupil response. Vis. Res. 46, 1393–1403. doi:10.1016/j.visres.2005.07.004
Kivikangas, J. M., Chanel, G., Cowley, B., Ekman, I., Salminen, M., Järvelä, S., et al. (2011). A review of the use of psychophysiological methods in game research. J. Gaming & Virtual Worlds 3, 181–199. doi:10.1386/jgvw.3.3.181_1
Koorathota, S., Thakoor, K., Hong, L., Mao, Y., Adelman, P., and Sajda, P. (2021). A recurrent neural network for attenuating non-cognitive components of pupil dynamics. Front. Psychol. 12, 1–12. doi:10.3389/fpsyg.2021.604522
Korenberg, M. J., and Hunter, I. W. (1990). The identification of nonlinear biological systems: Wiener kernel approaches. Ann. Biomed. Eng. 18, 629–654. doi:10.1007/BF02368452
Kotsia, I., Patras, I., and Fotopoulos, S. (2012). “Affective gaming: Beyond using sensors,” in 2012 5th International Symposium on Communications, Control and Signal Processing (IEEE), 1–4. doi:10.1109/ISCCSP.2012.6217768
Krejtz, K., Żurawska, J., Duchowski, A., and Wichary, S. (2020). Pupillary and microsaccadic responses to cognitive effort and emotional arousal during complex decision making. J. Eye Mov. Res. 13. doi:10.16910/jemr.13.5.2
Link, N., and Stark, L. (1988). Latency of the pupillary response. IEEE Trans. Biomed. Eng. 35, 214–218. doi:10.1109/10.1365
Longtin, A., and Milton, J. G. (1988). Complex oscillations in the human pupil light reflex with “mixed” and delayed feedback. Math. Biosci. 90, 183–199. doi:10.1016/0025-5564(88)90064-8
Longtin, A., and Milton, J. G. (1989a). Insight into the transfer function, gain, and oscillation onset for the pupil light reflex using nonlinear delay-differential equations. Biol. Cybern. 61, 51–58. doi:10.1007/BF00204759
Longtin, A., and Milton, J. G. (1989b). Modelling autonomous oscillations in the human pupil light reflex using non-linear delay-differential equations. Bull. Math. Biol. 51, 605–624. doi:10.1007/BF02459969
Lopes, P., Yannakakis, G. N., and Liapis, A. (2017). “RankTrace: Relative and unbounded affect annotation,” in 2017 Seventh International Conference on Affective Computing and Intelligent Interaction (ACII) (IEEE), 158–163. doi:10.1109/ACII.2017.8273594
Mark Gilleade, K., Dix, A., and Allanson, J. (2005). “Affective videogames and modes of affective gaming: Assist me, challenge me, emote me,” in Proceedings of DiGRA 2005 Conference: Changing Views-Worlds in Play, 1–7.
Mathôt, S. (2018). Pupillometry: Psychology, physiology, and function. J. Cogn. 1, 16–23. doi:10.5334/joc.18
Matthews, S., Uribe-Quevedo, A., and Theodorou, A. (2020). “Rendering optimizations for virtual reality using eye-tracking,” in 2020 22nd Symposium on Virtual and Augmented Reality (SVR IEEE), 398–405. doi:10.1109/SVR51698.2020.00066
Melhart, D., Liapis, A., and Yannakakis, G. N. (2019). “Pagan: Video affect annotation made easy,” in 2019 8th International Conference on Affective Computing and Intelligent Interaction (ACII IEEE), 130–136. doi:10.1109/ACII.2019.8925434
Mitre-Hernandez, H., Covarrubias Carrillo, R., and Lara-Alvarez, C. (2021). Pupillary responses for cognitive load measurement to classify difficulty levels in an educational video game: Empirical study. JMIR Serious Games 9, e21620. doi:10.2196/21620
Moon, P., and Spencer, D. E. (1944). On the stiles-crawford effect. J. Opt. Soc. Am. 34, 319. doi:10.1364/JOSA.34.000319
Napieralski, P., and Rynkiewicz, F. (2019). Modeling human pupil dilation to decouple the pupillary light reflex. Open Phys. 17, 458–467. doi:10.1515/phys-2019-0047
Pamplona, V. F., Oliveira, M. M., and Baranoski, G. V. G. (2009). Photorealistic models for pupil light reflex and iridal pattern deformation. ACM Trans. Graph. 28, 1–12. doi:10.1145/1559755.1559763
Peysakhovich, V., Vachon, F., and Dehais, F. (2017). The impact of luminance on tonic and phasic pupillary responses to sustained cognitive load. Int. J. Psychophysiol. 112, 40–45. doi:10.1016/j.ijpsycho.2016.12.003
Rahal, R.-M., and Fiedler, S. (2019). Understanding cognitive and affective mechanisms in social psychology through eye-tracking. J. Exp. Soc. Psychol. 85, 103842. doi:10.1016/j.jesp.2019.103842
Raiturkar, P., Kleinsmith, A., Keil, A., Banerjee, A., and Jain, E. (2016). “Decoupling light reflex from pupillary dilation to measure emotional arousal in videos,” in Proceedings of the ACM Symposium on Applied Perception, New York, NY, USA (New York, NY: ACM), 89–96. doi:10.1145/2931002.2931009
Ravaja, N., Saari, T., Turpeinen, M., Laarni, J., Salminen, M., and Kivikangas, M. (2006). Spatial presence and emotions during video game playing: Does it matter with whom you play? Presence Teleoperators Virtual Environ. 15, 381–392. doi:10.1162/pres.15.4.381
Robertson, A. R. (1977). The CIE 1976 color-difference formulae. Color Res. Appl. 2, 7–11. doi:10.1002/j.1520-6378.1977.tb00104.x
Semmlow, J. L., and Chen, D. C. (1977). A simulation model of the human pupil light reflex. Math. Biosci. 33, 5–24. doi:10.1016/0025-5564(77)90060-8
Smith, J. D., and Graham, T. C. N. (2006). “Use of eye movements for video game control,” in Proceedings of the 2006 ACM SIGCHI international conference on Advances in computer entertainment technology - ACE ’06, New York, New York, USA (New York, NY: ACM Press), 20. doi:10.1145/1178823.1178847
Soufineyestani, M., Dowling, D., and Khan, A. (2020). Electroencephalography (EEG) technology applications and available devices. Appl. Sci. 10, 7453. doi:10.3390/app10217453
Stanley, P., and Davies, A. K. (1995). The effect of field of view size on steady-state pupil diameter. Ophthalmic Physiol. Opt. 15, 601–603. doi:10.1046/j.1475-1313.1995.9400019v.x
Stark, L. W. (1984). The pupil as a paradigm for neurological control systems. IEEE Trans. Biomed. Eng. 31, 919–924. doi:10.1109/TBME.1984.325259
Tangnimitchok, S. (2019). Non-intrusive affective assessment in the circumplex model from pupil diameter and facial expression monitoring. Miami, FL: Ph.D. thesis, Florida International University. doi:10.25148/etd.FIDC007810
Tangnimitchok, S., O-larnnithipong, N., Ratchatanantakit, N., and Barreto, A. (2019). “Eliminating the pupillary light response from pupil diameter measurements using an RGB camera,” in Lecture notes in computer science (including subseries lecture notes in artificial intelligence and lecture notes in bioinformatics (Springer International Publishing), 11567, 397–406. LNCS. doi:10.1007/978-3-030-22643-5_31
Võ, M. L., Jacobs, A. M., Kuchinke, L., Hofmann, M., Conrad, M., Schacht, A., et al. (2007). The coupling of emotion and cognition in the eye: Introducing the pupil old/new effect. Psychophysiology 45, 130–140. doi:10.1111/j.1469-8986.2007.00606.x
Wang, C.-A., Baird, T., Huang, J., Coutinho, J. D., Brien, D. C., and Munoz, D. P. (2018). Arousal effects on pupil size, heart rate, and skin conductance in an emotional face task. Front. Neurol. 9, 1–13. doi:10.3389/fneur.2018.01029
Watson, A. B., and Yellott, J. I. (2012). A unified formula for light-adapted pupil size. J. Vis. 12, 12. doi:10.1167/12.10.12
Wong, H. K., Epps, J., and Chen, S. (2020). A comparison of methods for mitigating within-task luminance change for eyewear-based cognitive load measurement. IEEE Trans. Cogn. Dev. Syst. 12, 681–694. doi:10.1109/TCDS.2018.2876348
Yannakakis, G. N. (2008). “How to model and augment player satisfaction : A review,” in First Workshop on Child, Computer and Interaction, 1–5.
Keywords: pupil diameter, luminance correction, pupil light response, dynamic model, arousal, affective computing
Citation: Fanourakis M and Chanel G (2022) Attenuation of the dynamic pupil light response during screen viewing for arousal assessment. Front. Virtual Real. 3:971613. doi: 10.3389/frvir.2022.971613
Received: 17 June 2022; Accepted: 05 August 2022;
Published: 07 September 2022.
Edited by:
David Melhart, University of Malta, MaltaReviewed by:
Konstantinos Makantasis, University of Malta, MaltaCristiana Pacheco, Queen Mary University of London, United Kingdom
Copyright © 2022 Fanourakis and Chanel. This is an open-access article distributed under the terms of the Creative Commons Attribution License (CC BY). The use, distribution or reproduction in other forums is permitted, provided the original author(s) and the copyright owner(s) are credited and that the original publication in this journal is cited, in accordance with accepted academic practice. No use, distribution or reproduction is permitted which does not comply with these terms.
*Correspondence: Marios Fanourakis, bWFyaW9zLmZhbm91cmFraXNAdW5pZ2UuY2g=