 Pierre Begout
 Sébastien Kubicki4,3
 Thierry Duval
- 1IMT-Atlantique, Brest, France
- 2Elm.leblanc, Drancy, France
- 3Lab-STICC, UMR CNRS, Lorient, France
- 4ENIB, Brest, France
This paper deals with Digital Twins (DTs) for Industry 4.0 factories, and their implementation in the context of a reconfigurable factory. This context implies a modification of the layout of the workstations during production, and thus requires a live update of the digital twins according to these modifications. We needed this update done by the operators directly on the workstations using an AR authoring tool. A literature review helped us to determine the criteria that a tool should fulfill in order to achieve this goal. The most important criteria are that the tool should be suitable for use by operators not trained in AR, that the learning curve should be short, and that it should be usable in a reconfigurable factory context. We created a DT containing all the necessary factory data and 3D models of the workstation interaction zones of a real assembly line. We then developed a tool enabling operators to match the DTs with their physical twin (PT) in AR, as well as to update their position in case of a reconfiguration. The experimentation we carried out confirms our analysis and shows us that it is possible to deploy a DT in a factory quite simply if the positioning of the DTs is done by direct manipulation (the 3D objects are co-located with the operator’s hand) with the help of an AR display device.
1 Introduction
In a context of industrial evolution (reorganization of production means, need for industrial agility to meet increasingly unpredictable customer demand) and the transition to Industry 4.0, it is important to be able to adapt production lines to demand as well as to train operators to new positions and new ways of working.
This problem is common to many companies, and in particular to elm.leblanc1, a boiler manufacturing factory belonging to the Bosch2 group, which sees a strong increase in demand in winter. This increase in the number of boilers to be produced leads to the recruitment of temporary operators who can represent up to 50% of the workforce.
The training of these new operators is an important process that requires time and human resources. Indeed, during training, an experienced operator is present on each workstation to train a temporary operator. During this time, the assembly line production is not optimal, because the progression and learning curve of each new operator is different. In addition, the experienced operators are focused on training the junior operators, diverting their attention from their main technical production tasks.
One of the solutions imagined by elm.leblanc to overcome this training problem is to use Augmented Reality (AR) to train new operators directly on the workstations in complete autonomy. This would allow experienced operators not to manage training in addition of their work.
The idea of using AR in an industrial context is not new, and many use cases have been studied. For example, AR can be used to perform remote expert guidance, develop new products by collaborating remotely, or perform an inspection of digital prototypes (Fraga-Lamas et al., 2018). AR is also being used to evaluate workstation ergonomics and equipment accessibility (Berg and Vance, 2017), or to detect manufacturing errors and defects (Barbosa et al., 2016). These uses of AR in industry have a lot of potentials, but the most interesting for our work and most widespread is assembly assistance, with the goal of training (Paelke, 2014; Barbosa et al., 2016; Bottani and Vignali, 2019). It is worth noting that doing assembly and maintenance assistance in AR is more interesting if the staff turnover is high and if the tasks are repetitive (Havard et al., 2021). But in order to properly train operators, it is necessary to have a suitable and well configured assistance tool.
This last point is very important given our context of reconfigurable factory, since the layout of the workstation can change during the day. It is necessary to know the functional elements of the workstations, as well as their locations to direct the attention of the user (Henderson and Feiner, 2011; Funk et al., 2016). The most important issue given our context is to keep this tool up to date in the case of a change of reference to be produced during the day (e.g., change of production from boiler A to boiler B), or an update of the workstations (e.g., a box of screw nuts replaced by a box of bolts). One possibility to address the above issues would be to have a complete Digital Twin (DT) of the factory workstations. This DT would contain all the data about the workstations (e.g., items present, quantity, position). The information from this DT would then be used to create, for example, instructions to be visualized in AR and to keep them up to date.
However, it is complicated for companies, which often do not have the necessary expertise, to set up DTs. It should be noted that the implementation constraints also depend on the application (e.g., simulations, predictions) that will be made of the DTs (Shao and Helu, 2020).
In our case, we are in a reconfigurable factory environment, which means that our workstations can be modified several times in 1 day, depending on the boiler model to be built. These modifications imply to often modify the DT to match the workstation. It is therefore necessary to make these modifications directly on the assembly line without having to involve other stakeholders (such as method engineers), and therefore gaining a lot of time. Therefore, it is important to involve production staff in the placement and updating of the DTs, as they are the ones who know the workstations best. In this work, we aim to enable operators in a factory to configure and update the DTs on their workstations so that they can ensure that the assembly aid instructions are in the right place. However, the creation of the instructions themselves is not the subject of this article.
In the following section, we present the work related to DTs and 3D authoring tools. We then propose, after collecting the needs of users and data from our partner factory, a DT of the factory containing all the important data of the factory, as well as 3D models of important elements, in order to locate them and update their location according to the evolution of the workstations. We then present a tool that we called WARD allowing the production staff to be involved in the process of constructing the DT. We finally detail an experiment of WARD used by the production staff in an industrial environment and its results. Finally, we conclude this article with a discussion of the results obtained, which allow us to conclude that WARD is more efficient than the most industrialized 3D authoring tool of our state of the art: Microsoft Guides.
2 State of the Art
2.1 The Concept of Digital Twin
The initial concept of the Digital Twin (DT) was defined in 2003 by Michael Grieves during one of his courses at the University of Michigan as “a virtual representation of a physical product containing information about said product”. Grieves later extended this definition in 2014 (Grieves, 2014) to define the DT through three components: 1) the physical product in real space, 2) the virtual product which is the representation in virtual space, and 3) the bi-directional data connections that link these two spaces (cf. Figure 1).
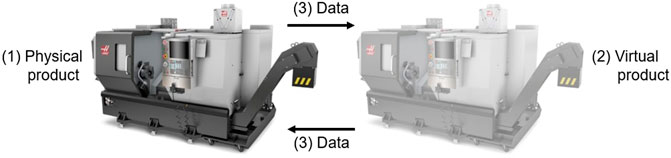
FIGURE 1. The Digital Twin concept, from Grieves (Grieves, 2014).
More precisely, the physical product can be a simple component to be manufactured (e.g., a screw nut) or a complex system comprising several elements working together (e.g. an automatic assembly line). The data from the physical space comes from internal or external sensors of the physical product, for example, data on the torque of the bolts screwed on a gasoline reserve, but also the reserve level. Note that the sensors and data collection systems are also part of the physical space.
The virtual product is the virtual representation of the physical product. It can be composed of several modules (i.e., 3D model, simulation, testing, optimization) that make it possible to use the data coming from the sensors of the physical space and to send back new data to adjust the production or the settings of a physical machine for example. The data coming from the virtual space are the results of simulations and analyses of the behavioral models of the physical products.
Using a DT enables to link a virtual representation to a physical product throughout its lifecycle (Grieves and Vickers, 2016). The physical and virtual environments can then be used together. The available information from the physical product is stored, evaluated, and used in the different modules of the virtual space. A simple analysis of the data enables the monitoring and detecting malfunctions of the physical product for example. The behavioral models produced during the design stages enable simulations to be carried out on the virtual product, which results are used to predict the behavior of the physical product. Overall, this enables to increase the modularity, autonomy and connectivity of the factories (Rosen et al., 2015).
2.2 Usage of the Digital Twin in Industry 4.0
With the rising of industry 4.0, interest in using the DT in the industrial domain is growing (Jones et al., 2020), with increasingly connected factories using IoT, sensors, big data, and a need for more agility.
In industry, there are mainly three fields of application for the DT: 1) predictive management of the state of products or systems, 2) design, 3) production. More secondary fields of application are maintenance support and training support (Tao et al., 2019).
The most widespread field of application is predictive management with the simulation and monitoring of the life cycle of a product (a single product or an entire system). The DT will allow to simulate the behavior of the product or a system during the whole duration of its use according to parameters coming from the real product, from the user, or from the technical specificities of the materials (Revetria et al., 2019). The results of these simulations can then be used to adjust or modify parameters on the real product.
Having access to these behavioral models and simulations, combined with 3D modeling also enables the virtual design of new products (Guitard et al., 2020). Furthermore, using a DT enables the virtual design and ergonomic assessment of workstations and production lines (Havard et al., 2019).
As far as production is concerned, the DT enables the monitoring and the anticipation of problems thanks to the simulation models of the production lines. This allows to optimize the changes of references to be produced and to modify the layout of the factories. This last point is very interesting in the case of reconfigurable factories. Using a DT allows to evaluate the different reconfigurations and their gains. For this purpose, simulation models of the production lines are used (Zhang et al., 2019; Yang et al., 2022). DTs are very useful in the case of smart factories, where the assembly lines are fully connected through IoT to a cyber-physical system. The DT will use data from the workstations and production orders to evaluate the best configuration, and send instructions to reconfigure the assembly line (manually or automatically) (Leng et al., 2019b; Leng et al., 2020a; Leng et al., 2020b), or commission new ones (Leng et al., 2021b). The DT can also be used in different parts of the factory, like the warehouse, where the DT can be used to optimize the layout and storage of spare parts and materials according to their date and frequency of use (Leng et al., 2019a).
Still on the subject of production, the DT makes it possible to detect malfunctions during production and to test different corrections virtually before sending possible corrections, or proposing optimizations (Liu et al., 2019; Leng et al., 2021a).
However, deploying a DT of this scale requires a lot of sensors and IoT on the factory equipment, which is why the term smart factory is used. It is difficult to implement the entire system described in the articles above in an existing plant where most actions are performed by a human operator. These factories are often old, there is very few sensors available and compatible with the current systems, and the documentation about the technical operations is hard to translate into a simulation model for the DT. It would be very expensive and long to equip a factory with enough sensors and activators to cover the whole production.
Many of the uses of DT in industry rely on these simulation and behavior models, as well as numerous sensors for monitoring and updating the DT in real time. However, the implementation and updating of the DT is often overlooked, especially the matching of the DT position with its Physical Twin.
In light of these problems, we aim to contribute to the use of the DT in production, and more precisely in its implementation and updates to match the production lines layout evolution. As a reminder, our work takes place in a elm.leblanc factory which is a reconfigurable factory, where changes in the production are planned for the day, which implies that the reconfiguration of workstations are also planned. The gains were evaluated beforehand during the creation of the workstations and the production planning. We mainly have to be able to easily create the DT of the workstations and match the DT with the Physical Twin (PT) in their different configurations. Although the factory is old and has almost no IoT, we still aim to offer a usable solution, which is not really explored in the articles quoted above. We need to be able to interact with the DTs to update their location in accordance with their PTs location.
In order to achieve our goal, we have to overcome some issues of DTs, such as the use and generation of a huge amount of data that is not always easy to visualize, sort and store, and difficulties to interact with the DTs (Guitard et al., 2020).
2.3 Combining Digital Twin and Mixed Reality
In order to tackle some of the issues we discussed in the section above, we propose to use Virtual Reality (VR) and Augmented Reality (AR) devices to visualize the DT and to interact with it.
Therefore, the use of immersive Virtual Environments (VEs) applied to DTs enables new uses, such as the monitoring of production optimization tasks, training and maintenance assistance (Ke et al., 2019). Thus, the optimization of production can be done with simulation models of activities of a chain. The visualization of this system with the help of a VE allows to check the correct operation of the simulation or even to modify certain parameters in real time (Lyonnet and Toscano, 2016). This then enables to adjust the production according to the results of these simulations.
DT also enable to simplify maintenance operations thanks to VEs. The latter enable to display the information coming from the PT (e.g., sensors) and DT (e.g., simulation results) directly on the PT to guide the operators (Schroeder et al., 2016; Rabah et al., 2018; Zhu et al., 2019).
Finally, the use of a DT associated with a 3D model of its PT makes it possible to simulate workstations in VEs, not only to train operators in their jobs but also to validate the ergonomics of the workstations (Havard et al., 2019). Moreover, having a 3D model of the workstations corresponding to the real ones allows to determine where technical instructions for novice operators should be positioned (Noël et al., 2020).
Our work is particularly focused on this last point related to the matching of 3D models and the real workstation. Indeed, elm.leblanc aims at proposing scenarios to train operators thanks to the display of technical instructions in AR. To do so, we need to identify the important elements of the workstations, then implement the DT of the workstations, and match the DTs with their PT, and thus allow instructions related to the workstation elements to be attached to the DT. However, the use of a DT within a production environment implies time constraints and constant updating of the DT. It would be more efficient to allow operators to directly perform updates to the DTs of the workstations without having to involve other stakeholders (such as methods engineers). Therefore, we propose to explore the various tools for creating and editing content for VR/AR in the following subsection.
2.4 3D Authoring Tools
As we saw in the previous section, we need to be able to place DTs on their PTs, and easily update their position. Therefore, we propose to study the different tools that allow to create 3D content for VR/AR.
3D models of workstations, components and machines are already used in the industrial field to design new products, test the layout of workstations, or evaluate their ergonomics (Berg and Vance, 2017). These models are generally realized thanks to CAD or 3D creation tools (such as SolidWorks3, Inventor4, 3dsMax5 or Maya6). These tools are very powerful because they allow you to create very precise 3D models, but they take a long time to learn and require advanced skills in 3D modeling (Kostic, 2012). Moreover they generally require to make all the modeling on computer. This implies alternating between the use of a visualization device in AR to check the conformity of the 3D model (and the DT) compared to its PT, and the return to the modeling tool on the computer to make the necessary modifications. Note that it is possible to use existing frameworks for content creation for AR such as APRIL (Ledermann and Schmalstieg, 2005) or Vuforia7, but they are generally complex to use and require knowledge in computer science, XML for APRIL and C# for Vuforia (Bégout et al., 2020). The need to have knowledge of 3D modelling or computer development does not allow operators to carry out the placement, which is our main criteria to evaluate the different tools.
To achieve this goal, we have studied tools based on a graphical interface, which does not require advanced technical knowledge of 3D modelling and computer development. In ACARS (Zhu et al., 2013), for example, AR content is created on the computer by an industry expert (e.g., a method engineer who creates assembly lines) using a 3D model of the equipment and placing 3D elements around that model. The operator can then make changes in AR using a tracked physical object as a cursor (cf. Figure 2A).
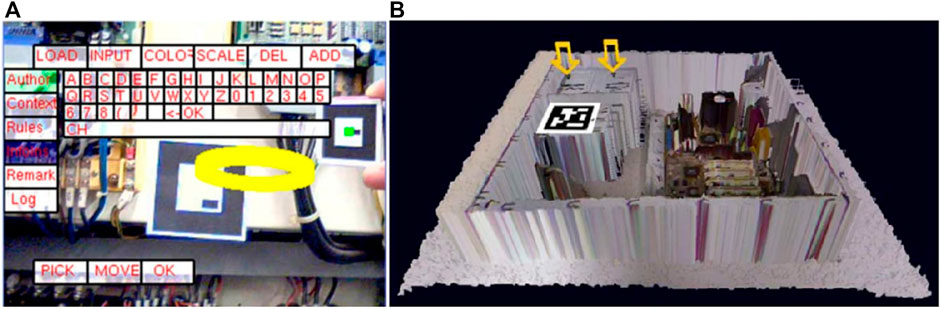
FIGURE 2. (A) Editing content in ACARS (Zhu et al., 2013), (B) Editing AR content in SUGAR (Gimeno et al., 2013).
AR content creation is also computer-based in SUGAR (Gimeno et al., 2013). Photos of workstations containing depth data are used to place 3D models and instructions by an expert (cf. Figure 2B).
It is also an expert who creates the content in ARAUM (Erkoyuncu et al., 2017). He enters information about the technical operations into the tool. This information will then be displayed in AR around the workstation thanks to the spatial, temporal and positioning context of the user.
In these tools, the placement of the 3D models is done by an expert on the computer, which is complicated to set up for use by assembly line operators. In addition, the placement of the models cannot be modified once deployed in AR except for ACARS. It is therefore more complicated to update the models. Unlike the previous tools, non-expert users create the content for AR in Meta-AR-App (Villanueva et al., 2020) by dragging simple 3D models into the work area. Again the authoring is done on the computer and is not editable once deployed. This is an issue because of the time constraints in our industrial context. We need to be able to perform the authoring directly on the assembly line, in AR, using a Head Mounted Display (HMD).
For example, a tool like INSITER (Riexinger et al., 2018), which is based on the BIM (Building Information Model) of the factory and uses the available 3D models. The overlay of the 3D model on the real one is done by environment and object recognition and modules that can track several AR markers. This method is interesting if we can have precise 3D models of the workstations so that the environment recognition works, as well as a very complete BIM. These requirements are difficult to meet for many factories, which are either old, partially modeled, or reconfigurable.
Finally, some commercially available tools exploiting AR exist, such as Microsoft Guides8. This tool allows the creation of AR learning scenarios through a computer-based module and an AR placement module. The computer-based module creates the instructional panels and adds the 3D models to be placed on the workstation. The AR module then allows to place the 3D models linked to the different instructions, through a distant manipulation of AR elements using the raycast starting from its palm. Here again, the authoring is done by an expert for the creation of scenarios, and the modeling of a workstation is very time consuming, which is not acceptable in our use case.
All these tools allow us to create 3D content for AR in different ways and with different possibilities. However, they do not all fulfil the criteria that we consider important for operators to achieve the placement of DTs. These criteria are the following (see Table 1):
• Digital Twin placement: we can place the workstation DTs with the tool.
• GUI-based: it should be possible to use the tool throughout a graphical interface without requiring any knowledge about programming.
• HMD compliant: it must be possible to use an AR HMD to visualize the DTs.
• AR authoring: the modification of the DTs placement should be doable directly in AR and not require additional material (such as a computer for example).
• Usable by operators: operators should be able to realize the placement of the DTs with the tool without the intervention of another stakeholder.
• Short learning time: users should be able to learn quickly how to use the tool to place DTs.
• Reconfigurable factory compliant: the tool must be suitable for a reconfigurable factory context, and should provide easy ways to update the DTs in case of a production change.
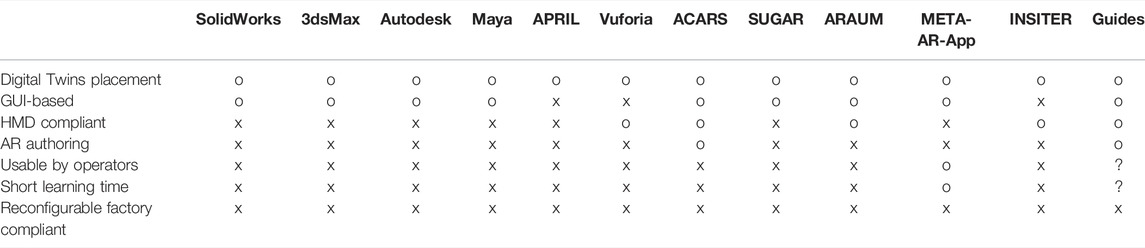
TABLE 1. Summary of the main features of 3D authoring tools suited for AR matching of Digital Twins.
A good tool should fulfill all these criteria, and many tools fulfill the first 4 ones, so we will focus on the last 3 which are particularly important in our opinion to enable operators to perform quick and easy placement and updating of DTs. Since none of the tools we discussed in the state of the art fulfills all these criteria, therefore, we need a new tool, focused on the ease of use by production staff, by simplifying the interactions as much as possible. We also need to focus on the presentation of the DTs, to be sure not clutter the user’s field of view. Data management and the creation/retrieval of 3D models should not be the responsibility of any such AR authoring tool, only leaving the placement to be managed by the users.
In the next section we will explore the collection of user needs which influenced our choices on the structure of the factory DT, and to the development of WARD, our authoring tool developed to fulfil all the criteria we discussed.
3 Collection of the Users Needs
In order to create a faithful DT and to match it with the PT, it is first necessary to determine and know the different information related to the workstations (e.g., the layout of the workstations, components and tools present on the workstation, the presence of test benches, assembly benches or machines). These are the elements we need to locate precisely and the ones we will match with a DT. As we are in the context of a reconfigurable factory, the layout of the workstations can change during the workday (e.g., some component boxes can change position or be replaced). It is therefore important to know these different layouts and adapt the DT accordingly. That is why the operators need to be able to perform the update of the DT directly on their workstation, without using a lot of equipment. They also need to be able to perform these updates quickly.
We therefore carried out observations in the factory to determine which elements of the workstations the operators interact with, as well as the elements that are modified during a reference change. We first observed operators during their work on an assembly line. We spent an entire shift observing them and taking notes and pictures, to see the way they interact with the workstations. We then assembled a boiler using the instruction sheets to see for ourselves the difficulties a new operator might encounter. Finally, we analyzes the BOM (Bill Of Materials) files to see what data was available about the workstations.
Using our observations and the available data, we determined the following interaction zones that needs to be located precisely (see Figure 3):
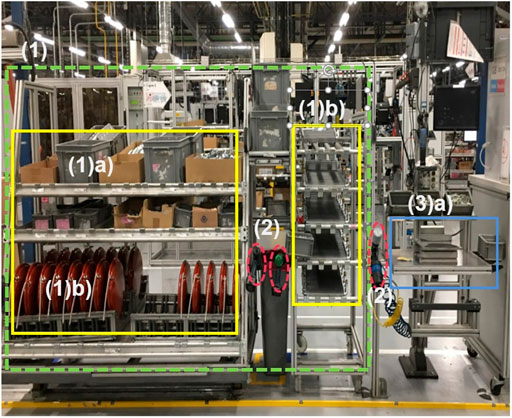
FIGURE 3. Visualization of the interaction zones of a boiler assembly workstation in an elm.leblanc factory.
1) The “supermarket” which is a shelf containing the following items:
a The component bins (e.g., a box containing nuts).
• The components themselves (e.g., nuts).
b The bulky components (e.g., heating elements).
2) The tools present on the station (e.g., screwdrivers, riveters)
3) The assembly area which is composed of several elements which can be present on a workstation:
a The assembly bench which is an area on which the operator assembles components before integrating them into the boiler (e.g., an assembly support for the boiler body).
b The test bench that allows the boilers to be tested for compliance (e.g., leak test, electrical component test) not visible on the Figure 3 because only a few stations have them.
We need to be able to locate these interaction zones very precisely. Therefore the DT of these interaction zones must perfectly match the PT. These DTs will then serve as spatial anchors to AR instructions. This will ensure that the attached AR instructions are well positioned, and to make sure the instructions follow in case of a layout modification, since the DT will match the new layout.
Using these observations, we worked on the development of the DT, which will be the base of our WARD tool. It will be the back-end of the tool and serve as the base for all AR operations.
4 Designing the Factory Workstations Digital Twins and the AR Placement Tool
Following this collection of requirements and the analysis of the state of the art, we have extracted the principles to be respected for the creation of factory DT. The structure of the factory DT and the workstations DT must mirror the real structure. The important elements of the workstations (i.e., the interaction areas) must be precisely located and correspond to the location of the real element. Finally, updating the position of the digital twins must be simple to achieve.
We have taken these principles into account when creating our DT, based on the observations made in the previous section and the available data. Our DT contains all the data regarding the factory, their workstations and their elements, including their 3D models when necessary.
We then present WARD (Workstation Augmented Reality Digital twin), an AR tool we developed to allow operators to match the DTs of the interaction zones with their PT, directly on the assembly line.
4.1 Implementing the Digital Twin of the Workstations
To achieve our goal of matching the DT of workstations with their PT, we have created a database that contains information about the composition of the factory: the relationships between the assembly lines, workstations, their composition (i.e., the interactions zones). We need to be able to locate those interaction zones precisely. To achieve this goal, we propose to use a 3D model of the interaction zone to visualize it in AR and place it at the right location on the workstation. The location of the DT and its 3D model will then be saved in the database. In this case, using AR allows us to realize the placement task directly on the workstation.
The database contains all the information regarding the different elements of the factory. Each element of the factory, its assembly lines and workstations are saved in the database. The composition of the workstations are also saved in the database following the model in Figure 4A. This model is based on the observations detailed in the previous section. In this model, a factory is composed of assembly lines, which are composed of workstations. The workstations are composed of a supermarket, tools and the assembly zone. The supermarket is composed of the component boxes wich contain the components, and the bulky components. The assembly zone can be composed of a workbench and a test bench. The factory data that fills this database comes from the BOM (Bill Of Materials) files provided by the production engineers, as well as from the workstation sheets. For example, the “Boiler Body Assembly” workstation is part of the second assembly line of the elm.leblanc factory. It is composed of a supermarket containing 20 component bins, each containing 50 components. It also consists of a boiler body assembly bench, a screwdriver and a riveter (see Figure 4B).
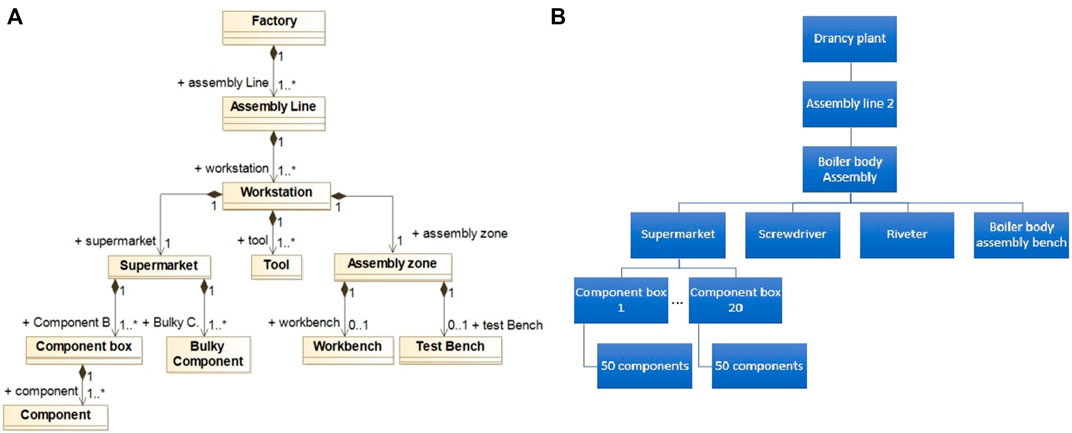
FIGURE 4. (A) UML diagram of the factory composition, (B) example of the instantiation of the “Boiler body assembly” workstation.
Once the plant data was created, we needed a way to accurately locate our interaction zones and easily update their position. Therefore, each interaction zone also has a 3D model representing it (cf. Figure 5), which is part of the DT. The location of the 3D model has to be the same as the real interaction zone, and it can be easily moved by an operator in case of an update of the station. The link between the 3D model and the interaction zone in the database is made by using the ID of the interaction zone in the database.
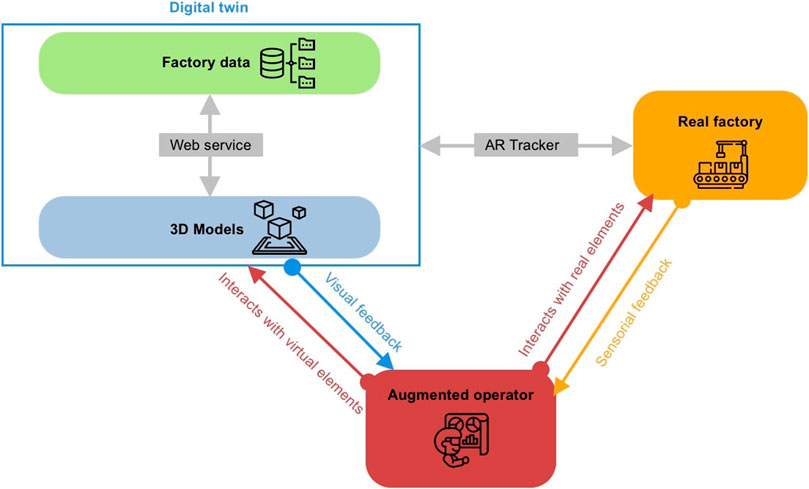
FIGURE 5. Architecture of our model: Integration of the augmented operator within the relationship between the Digital and Physical Twin and their bi-directional relationship.
In our architecture model (Figure 5), both parts of the DT (3D models and factory data) communicate through a WebService. We made this choice because we cannot store all the necessary data in the AR visualization device. Therefore, we need to access the data dynamically to load only the data needed for the task at hand. Only the DT of the interaction zones are displayed, and the information about their location are updated through the webservice. The link between each interaction zone and its DT is done with the help of an AR tracker (in our case, a QR code positioned on the workstation and referenced in a database). Interaction with the DT is done by an “augmented operator” (i.e., an operator with an AR visualization helmet). He will interact with the 3D models of the interaction zones to place them at the right location. In case of an update of the workstation, the position of the DT should follow the PT thanks to the AR tracking. It is important to note that until the end of this article, what we call DT refers to the data of the DT as well as its 3D model, which will be visualised and manipulated by the operators.
After the creation of the factory DT, we developed the AR application enabling the operators to become augmented operators who can perform the authoring task. The goal of this application is to enable the operators to visualize the interaction zones DTs and to manipulate them to match them with their PT. Since the future users of this application are not trained to use AR, and considering the concepts we discussed in the state of the art, we made sure to propose very simple and natural interactions with UI and the DTs, and we have been careful not to display too much information to avoid overloading the user’s field of view.
4.2 WARD (Workstation Augmented Reality Digital Twin)
As said previously, we aim to develop an AR authoring tool to enable operators to perform the matching of the workstation DT with its PT. With our industrial context of a reconfigurable factory, the operators need to be able to update the DT in accordance with the evolution of the workstation. Therefore, we focused on the ease of use of our application, since the operators (workers who assemble boilers in our case, with no knowledge in AR) are not yet trained to use AR. Furthermore, since the placement of the DTs doesn’t require the involvement of other stakeholders (e.g., methods engineers), it should reduce the needed time to set up the DT.
So we developed an application for Hololens 29 with Unity3D10 using MRTK11. We called this tool WARD (Workstation Augmented Reality Digital twin). Operators will use WARD when configuring a workstation for training. Before creating the instructions (let’s remember that the creation and the visualization of the instructions are done with another tool that is not the subject of this article), the DTs of the workstation interaction zones must be superimposed to their PTs. This application enables operators to 1) detect a workstation 2) to manipulate the DTs of the interaction zones of the workstation 3) to overlay them on their PTs.
The use of WARD is exclusively in AR. To start the placement process, the operator has to detect the workstation. He will use the depth camera from the HMD to scan the QR code of the workstation he is working on. Once the QR code is identified, the application will query the WebService to determine the workstation on which the operator is working, and retrieve the information from the DT. The application will get all information about the workstation, which assembly line it belongs to and which interaction zones are present. Note that all this is transparent for the operator.
Once the information is retrieved, the application will determine if the DTs have already been placed. The application will check in the database if there is a saved location for each interaction zone. If the DTs are already placed, it will display them at the saved location so that the operator can visualize them and interact with them (cf. Figure 6A). The operator can update their position by grabbing the 3D models directly with its hands and move them at the right location if needed (see Figures 6B,C).
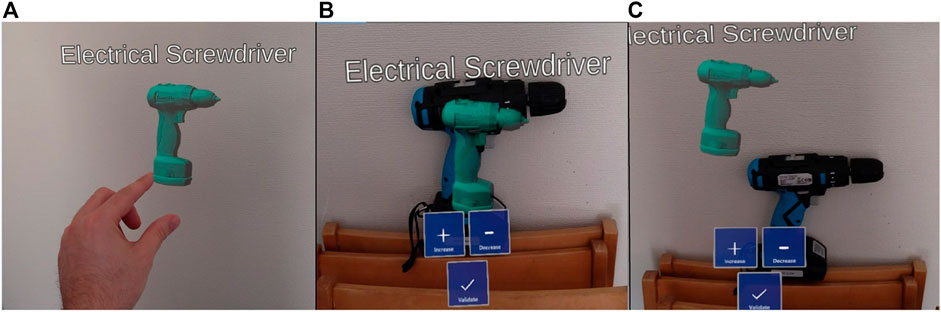
FIGURE 6. (A) Interaction with a DT in WARD, (B) DT placed at the right location in WARD, (C) Misplaced DT in WARD.
If the DTs have not been positioned, they will be presented one by one to the operator to be placed on their corresponding PTs. The operator will grab the first one and place it at the location of its PT. He will then validate the position by pressing the button located in the floating menu at the bottom (cf. Figures 6B,C). The first DT will disappear and the next one will appear to be placed. Once every DT is placed, their position relative to the QR code is saved in the database, and every DTs are displayed in order to check the positioning and correct potential placement mistakes. All these steps for using WARD are summarised in the BPMN diagram in Figure 7.
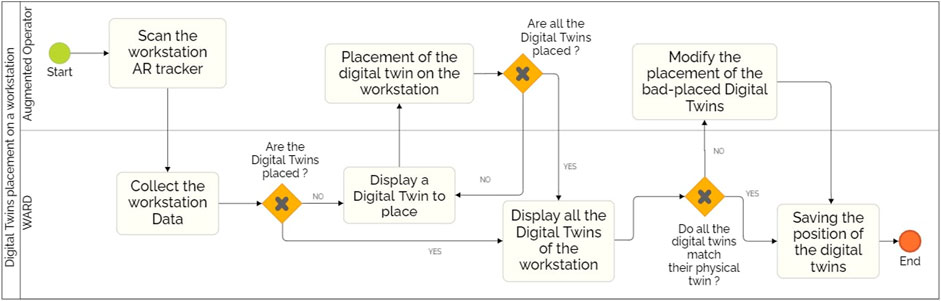
FIGURE 7. BPMN diagram of the use of WARD to place or update the digital twins of a workstation.
Regarding user interactions in WARD, we have chosen to propose simple interactions such as such as grabbing 3D elements and pressing AR buttons because the operators are not trained to use AR devices and they need to be able to perform the placement tasks as quick as possible. We also chose to hide the previously placed DTs to avoid the overloading of the operator field of view. It was indeed reported to us during pre-testing by operators that the previous DTs were getting in the way, and that they had trouble placing the DTs.
Since our goal was to enable operators to perform the placement of DTs on their PTs, we verified whether this was achieved by experimenting with factory operators. We describe this experiment in the next section.
5 In-situ WARD Evaluation
To verify that our tool is usable by production staff, we conducted an experiment in an ecological situation directly in the factory with operators and line managers, who are experienced in boiler assembly and know the workstations, but are not trained in the use of AR. We compared the task of placing DTs between WARD and a commercially available tool already implemented in the industrial domain: Microsoft Guides12.
We compared the usability of the tools by operators by asking them to perform the matching task between the DTs and their PT on a workstation.
For this experiment with matching task, we made the following assumptions:
• H1: Task completion is faster with our tool than with Guides.
• H2: Participants make fewer placement errors with our tool than with Guides.
• H3: The usability of our tool is better than Guides.
• H4: The estimated mental load is lower with WARD than with Guides.
5.1 Participants and Set-Up
We involved 14 production staff (12 men and 2 women). We conducted our experiment with participants having different roles in the factory, all of them could be required to match and update the DTs (method managers, production team leaders, method engineers, workstation preparer, health and safety managers, operators). With this panel of participants, we cover the whole lifecycle of workstations, from design with method engineers, to operation with line managers and operators.
The test sessions took place at a workstation in the factory where packages of spare parts are prepared. This workstation consists of 37 component boxes and a work surface.
The task the participants had to achieve was to match 37 DTs with their corresponding PT on the workstation. The DTs were presented in the same order for each tool. For each DT, participants had to locate the corresponding PT using the reference, then place the DT on it. Seven participants started with WARD and seven started with Microsoft Guides. We did not tell participants where the tools came from so as not to bias the results.
For each tool, we measured the number of DT placement errors. To control the DT placement, the examiner placed virtual bounding volumes over the PTs corresponding to an acceptable placement. We then compared the placement of the DT with the acceptance zone and counted an error when the DT exceeded the acceptance zone border. We also measured completion time, usability of the tool, and the estimated mental load of using it. For the usability we used the SUS questionnaire. To measure the mental load we used the raw NASA-TLX (Hart, 2016) questionnaire.
5.2 Experimental Procedure
Each participant began by filling out a consent form as well as a questionnaire that we produced allowing us to know their experience with AR and VR.
Then, they performed the interaction tutorial of the AR headset used (Hololens 2) to familiarize themselves with the possible interactions. This tutorial lasts 5 min and train the participant to manipulate a 3D model by grabbing it directly with the hand, then manipulating it remotely using a raycast from the palm of the hand.
After the tutorial, they performed the placement task with the first tool, and then completed a SUS and NASA-TLX questionnaire for this first tool. They then performed the task with the second tool and filled out the same questionnaires as well as one more questionnaire to tell us which tool they preferred and if they had any comments.
During each session, we filmed the execution of the experiments through the camera embedded in the AR headset used, to eventually check the number of errors as well as to determine the exact completion time of the task.
5.3 Results
We statistically analyzed the participants’ results for the values measured during the experiment. We first performed a normality test to verify the distribution of our data. We observed that only the data about the completion time was following a normal distribution. The data about the number of errors, the SUS score and NASA-TLX score were not following a normal distribution.
Figure 8A shows that the results of the completion time per tool are different, with Guides above WARD. We can immediately see that the median of the completion time with WARD is less than the lower quartile of the completion time with Guides. We can therefore assume that the completion time is lower with WARD than with Guides. To verify this hypothesis, we performed a one-way ANOVA to compare the mean completion time between the tools. The analysis shows us that there is a significant difference (p = 0.0004) between the completion time of the placement task between WARD and Guides, with 9.92 min for WARD and 13.84 min for Guides.
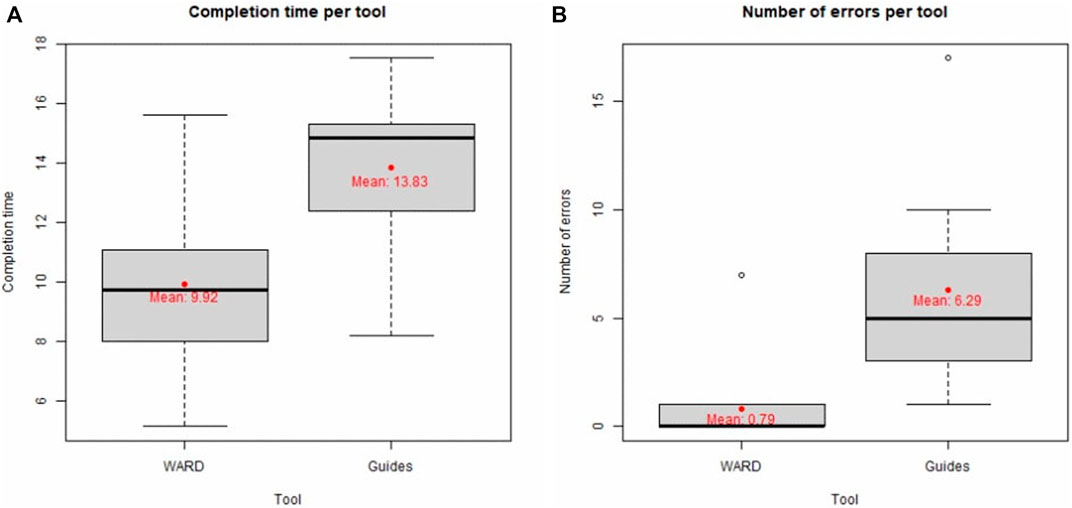
FIGURE 8. (A) Comparative boxplots of the time per tool with means in red showing that the completion time is longer with Guides, (B) Comparative boxplots of the number of errors per tool with means in red showing that operators make fewer errors with WARD.
For the number of errors, Figure 8B shows that the data are much less scattered for WARD than for Guides. Moreover the median of WARD is lower than the lowest value of Guides. We can therefore assume that the number of errors is much lower with WARD. We used a Wilcoxon signed rank test for paired samples to compare the number of errors between the tools. We obtained a significant difference in the number of errors between the tools (W = 12, p = 0.000059). We can see that on average, participants made much fewer errors (0.8) with our tool than with Microsoft Guides (6.2).
As for the results for the SUS score by tool, Figure 9A shows that the median for WARD is similar to the third quartile limit of the Guides results. Furthermore, the upward skewness for WARD indicates more concentrated values towards a high score, while for Guides they seem to be evenly distributed. We can therefore hypothesise that the SUS score is generally higher for WARD. We also used a Wilcoxon signed ranks test for paired samples to analyze these results. We obtained a significant difference between the SUS scores for each tool (W = 147.5, p = 0.0231). On average, users consider the usability of our tool (85.3/100) to be better than that of Microsoft Guides (73.5/100).
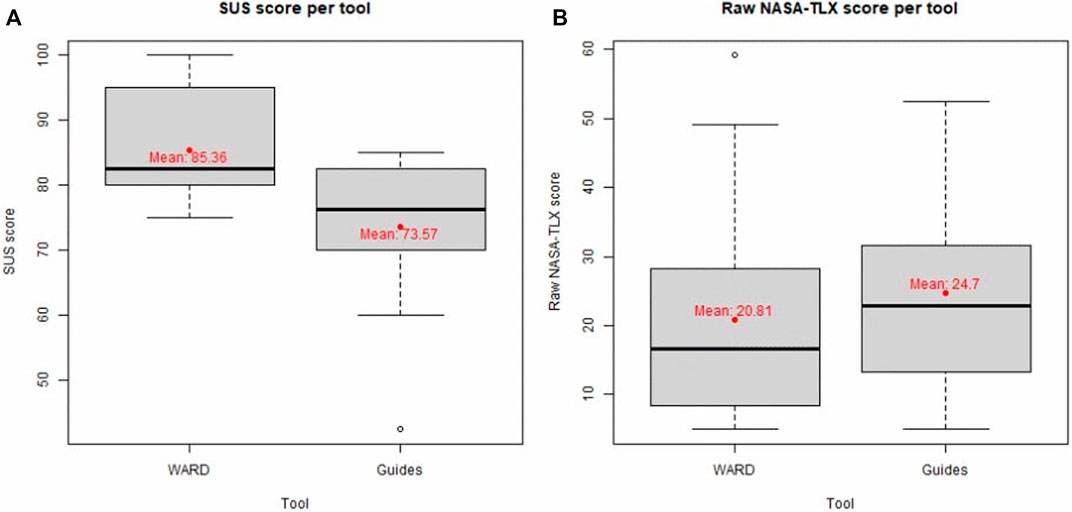
FIGURE 9. (A) Comparative boxplots of the SUS score per tool with means in red showing that the SUS score is higher for WARD, (B) Comparative boxplots of the NASA-TLX score per tool with means in red showing a similar result.
Finally, for the NASA-TLX results, Figure 9B shows that the interquartile range is similar for both tools, with a similar symmetry. We can just see that the WARD interquartile is a bit lower than the Guides, but it is difficult to make an assumption. We verified whether the difference between the results is significant. The results were also analyzed with a Wilcoxon signed ranks test for paired samples. This time, we didn’t find any significant difference between the estimation of mental load between the tools (W = 78.5, p = 0.382 > 0.05). On average, the mental load estimation for WARD is 20.80/100 and 24.8/100 for Microsoft Guides, which are very similar but low result, which are acceptable for a mental load estimation.
6 Discussion
We conducted an experiment to compare the usability by production staff of our tool (WARD) and the Microsoft tool (Guides). The difference between the tools is mainly in the handling and selection of the DTs to be placed. In WARD, the Digital Twins are presented one by one. The user has to validate the placement of the current DT before displaying the next one. In Microsoft Guides, the DTs are contained in an AR panel in which the user must select the one to be placed. Regarding interaction methods, in WARD, the user will grab the 3D model of the DTs to move and rotate them. In Microsoft Guides, the user will select and manipulate the DTs remotely using the raycast starting from its palm (cf. Figure 10).
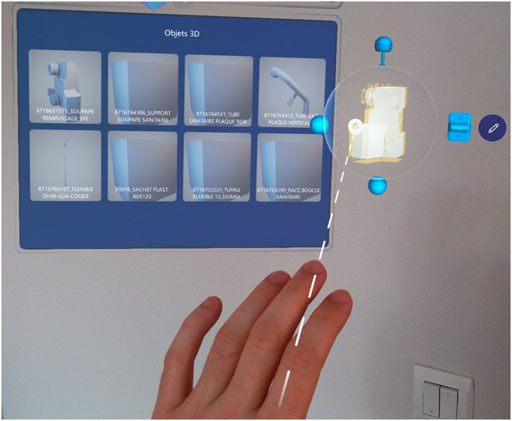
FIGURE 10. Interaction with a Digital Twin in Microsoft Guides using the raycast.
The results show that the completion time of the placement task is shorter with WARD, which validates our hypothesis H1 (completing the matching task is faster with WARD). This can be explained by the difference in the selection and placement of the 3D models.
It also contributes to explain the lower number of errors with WARD. For many users, distant manipulation in Guides leads to errors in judging the depth for placement of the DTs. Many participants were manipulating the DTs 3D models without moving around the workstation, because from their perception, and the fact that they are not accustomed to using AR, the placement was correct. Therefore, they did not change their viewpoint, and could not see their depth errors. This result allows us to validate H2 which was that the users would do fewer placement mistakes with WARD.
The results of the SUS show that WARD is more appreciated than Guides by the participants. This result in favor of WARD is also reflected in our questionnaire where one of the questions was about their preference between the two tools (13 out of 14 participants preferred WARD). They described WARD as: “easier to use”, “more intuitive,” and “way faster to learn”than Guides. Here again the fact that the models were presented one by one, and the fact that the users were manipulating the DTs 3D models naturally by grabbing them, may help explain this result which validates H3 (The usability of WARD is better than Guides). However, it is interesting to note that the only participant who preferred Guides was the only one who indicated using a VR headset regularly for video games.
As the NASA-TLX results are not significant, we can only deduce that the tools lead to a similar estimated mental load, which does not allow us to validate H4. The fact that there is no time constraint in the realization of the requested tasks as well as their low difficulty can explain these results. It should also be taken into account that the mental load is estimated by the participant, we could have set up a secondary task to have a more precise measure of the mental load, but the implementation of the experiments in the factory being already complicated, it was too constraining to add this measure for this experiment. However, we keep in perspective the implementation of a secondary task for future experiments.
We achieved these results by focusing on the criteria of operators usability and learning time. Presenting the DTs one by one and manipulating them directly with the hand in WARD reduces the number of interactions and therefore reduce the completion time. Furthermore, completing the authoring all in AR is also a time-saver, because there is no switching between devices to perfect the placement of DTs, unlike in SUGAR or Meta-AR-APP (Gimeno et al., 2013; Villanueva et al., 2020). In these tools the DTs would be placed in a work space using a computer software, then the positioning of the DTs would be checked in AR to ensure the matching with the PT. It would take a lot of extra time to repeat this process a few times to ensure everything is a the right location, which is not possible in a production environment. Having an automatic placement system like in INSITER (Riexinger et al., 2018) would be the best option, but the implementation of such a system is very complicated in a reconfigurable factory like ours, where the workstations change during the day and there are no 3D models of the stations. It is easier to implement a manual update by an operator who knows the workstation layout. This is why focusing on the natural manipulation and having an uncluttered workspace allow us to fulfil our most important criteria, of enabling operators to perform the placement task with a short learning time, in a reconfigurable factory context.
However, there are still limitations to our implementation. As the DT update is not automatic, unlike the systems implemented in smart factories (Leng et al., 2020b; 2019b; 2020a), if the update is not done properly, other users may encounter problems such as information being displayed at the wrong position. Moreover, manual updating can be time consuming if many workstations have to be updated, which seems unacceptable in a production context.
On the other hand, WARD allows us to implement a DT in an existing factory without having to modify the factory to integrate IoT. To achieve the automatic update of the DT, we could record continuously with the AR helmet to detect a modification, but it is not feasible (both in terms of operators privacy, and comfort because they can’t wear the HMD during a whole day). Moreover, the updates of the stations concern only some elements and not the whole layout, which is not very long to achieve with WARD.
To support this, we have seen that it was really easy to set up WARD in the factory. Operators were able to perform the matching task with only a 5 minutes tutorial. It would have been very different if we used a tool with a computer-based module like ACARS, SUGAR or ARAUM (Gimeno et al., 2013; Zhu et al., 2013; Erkoyuncu et al., 2017), or even with a CAD tool, with a more complicated interface and interactions, since the operators do not use computers regularly.
These results show that WARD is easily usable by production staff in a factory, and that having a dedicated tool for operators, developed following the concepts of natural interactions and uncluttered display, is better in term of performance and completion time. Limiting the interactions to manipulating 3D models directly with the hand, but also limiting the number of visible models, enables the operators to perform the authoring task quickly and easily with very few mistakes.
7 Conclusion and Perspectives
Industrial developments, and more specifically the transition to Industry 4.0, are leading us towards the digitization of industrial processes. The DT is an example of this and is particularly used in industrial fields.
In the case of our boiler manufacturing factory, and in order to train new operators on production tasks, we collected user needs in order to design a dedicated DT of the workstations, allowing an AR display of assembly instructions.
We first proposed an implementation of a DT containing data about all the functional elements of the factory as well as their 3D models. We then developed WARD, an AR authoring tool enabling operators to easily superimpose the DTs to their PTs directly in AR, thus avoiding the need to use several different platforms or software.
Our evaluation of WARD by production staff, comparing it to the Microsoft Guides tool, allows us to state that WARD performs better than Guides in terms of completion time and usability. WARD also generates fewer positioning errors than Guides. These results can be explained by the difference in interactions with the DTs in the two tools. Indeed, the direct manipulation of the 3D models with the hand with WARD makes our tool easier to use than Guides.
These results allow us to define the following guidelines for AR authoring tools designed for operators. Handling should be as natural as possible, like a simple grab, and not all DTs should be displayed to avoid overloading the field of view. More specifically, the development of new tools should be done by fulfilling the criteria we have outlined in the state of the art, focusing particularly on ease of use by operators, and learning time. The criterion on AR support, however, can be modulated according to user needs.
Our work shows that the implementation of a DT within a production environment, as well as its maintenance, can be done directly by the production staff considered as non-expert. This opens many perspectives for the use of the DT in the factory by the production staff.
Data Availability Statement
The original contributions presented in the study are included in the article/Supplementary Material, further inquiries can be directed to the corresponding author.
Ethics Statement
Ethical approval was not provided for this study on human participants because the ethical commitee was created after the experiments. The patients/participants provided their written informed consent to participate in this study.
Author Contributions
Digital Twin and authoring tool development, PB; Methodology, PB, SK, TD, and EB; Supervision, SK, TD, and EB; Experimentation, PB; Writing original draft, PB, SK, and TD.
Funding
This work is part of the IRON-MEN project of elm.leblanc.
Conflict of Interest
PB and EB were employed by the company Elm.leblanc.
The remaining authors declare that the research was conducted in the absence of any commercial or financial relationships that could be construed as a potential conflict of interest.
Publisher’s Note
All claims expressed in this article are solely those of the authors and do not necessarily represent those of their affiliated organizations, or those of the publisher, the editors and the reviewers. Any product that may be evaluated in this article, or claim that may be made by its manufacturer, is not guaranteed or endorsed by the publisher.
Acknowledgments
The authors would like to thanks the workers of the elm.leblanc Drancy factory for exchanging with us about their needs in term of Digital Twin and for participating in the experimentation.
Footnotes
1https://www.elmleblanc.fr/fr/fr/accueil/
4https://www.autodesk.com/products/inventor/overview
5https://www.autodesk.com/products/3ds-max/overview
6https://www.autodesk.com/products/maya/overview
7https://developer.vuforia.com/
8https://dynamics.microsoft.com/en-us/mixed-reality/guides/
9https://www.microsoft.com/fr-fr/hololens
11https://docs.microsoft.com/en-us/windows/mixed-reality/mrtk-unity/?view=mrtkunity-2021-05
12https://dynamics.microsoft.com/en-us/mixed-reality/guides/
References
Barbosa, G. F., Frigo, M. A., Da Silva, E. C. C., and Barbosa, G. F. (2016). Augmented Reality in Aerospace Manufacturing: A Review. J. Industrial Intelligent Inf. 4, 125–130.
Bégout, P., Duval, T., Kubicki, S., Charbonnier, B., and Bricard, E. (2020). “WAAT: A Workstation AR Authoring Tool for Industry 4.0,” in Lecture Notes in Computer Science (including subseries Lecture Notes in Artificial Intelligence and Lecture Notes in Bioinformatics) (Springer Science and Business Media Deutschland GmbH), 304–320. doi:10.1007/978-3-030-58468-9_22
Berg, L. P., and Vance, J. M. (2017). Industry Use of Virtual Reality in Product Design and Manufacturing: a Survey. Virtual Real. 21, 1–17. doi:10.1007/s10055-016-0293-9
Bottani, E., and Vignali, G. (2019). “Augmented Reality Technology in the Manufacturing Industry: A Review of the Last Decade,” in Wearable augmented reality for employee safety in manufacturing systems (W-Artemys). doi:10.1080/24725854.2018.1493244
Erkoyuncu, J. A., del Amo, I. F., Roy, R., and Dini, G. (2017). Improving Efficiency of Industrial Maintenance with Context Aware Adaptive Authoring in Augmented Reality. CIRP Ann. 66, 465–468. doi:10.1016/j.cirp.2017.04.006
Fraga-Lamas, P., Fernandez-Carames, T. M., Blanco-Novoa, O., and Vilar-Montesinos, M. A. (2018). A Review on Industrial Augmented Reality Systems for the Industry 4.0 Shipyard. IEEE Access 6, 13358–13375. doi:10.1109/access.2018.2808326
Funk, M., Kosch, T., and Schmidt, A. (2016). “Interactive Worker Assistance: Comparing the Effects of In-Situ Projection, Head-Mounted Displays, Tablet, And Paper Instructions,” in UbiComp 2016 - Proceedings of the 2016 ACM International Joint Conference on Pervasive and Ubiquitous Computing, 934–939. doi:10.1145/2971648.2971706
Gimeno, J., Morillo, P., Orduña, J. M., and Fernández, M. (2013). A New AR Authoring Tool Using Depth Maps for Industrial Procedures. Comput. Industry 64, 1263–1271. doi:10.1016/j.compind.2013.06.012
Grieves, M. (2014). Digital Twin: Manufacturing Excellence through Virtual Factory Replication. Florida Institute of Technology.
Grieves, M., and Vickers, J. (2016). “Digital Twin: Mitigating Unpredictable, Undesirable Emergent Behavior in Complex Systems,” in Transdisciplinary Perspectives on Complex Systems: New Findings and Approaches (Springer International Publishing), 85–113. doi:10.1007/978-3-319-38756-7_4
Guitard, L., Brissaud, D., and Noël, F. (2020). Implementation of a Digital Twin Starting with a Simulator. IFIP Adv. Inf. Commun. Technol. 594, 139–149. doi:10.1007/978-3-030-62807-9_12
Hart, S. G. (2016). “Nasa-Task Load Index (NASA-TLX); 20 Years Later,” in Proceedings of the Human Factors and Ergonomics Society Annual Meeting. doi:10.1177/154193120605000909
Havard, V., Baudry, D., Jeanne, B., Louis, A., and Savatier, X. (2021). A Use Case Study Comparing Augmented Reality (AR) and Electronic Document-Based Maintenance Instructions Considering Tasks Complexity and Operator Competency Level. Virtual Real. 25, 999–1014. doi:10.1007/S10055-020-00493-Z/TABLES/4
Havard, V., Jeanne, B., Lacomblez, M., and Baudry, D. (2019). Digital Twin and Virtual Reality: a Co-Simulation Environment for Design and Assessment of Industrial Workstations. Prod. Manuf. Res. 7, 472–489. doi:10.1080/21693277.2019.1660283
Henderson, S., and Feiner, S. (2011). Exploring the Benefits of Augmented Reality Documentation for Maintenance and Repair. IEEE Trans. Vis. Comput. Graph. 17, 1355–1368. doi:10.1109/TVCG.2010.245
Jones, D., Snider, C., Nassehi, A., Yon, J., and Hicks, B. (2020). Characterising the Digital Twin: A Systematic Literature Review. CIRP J. Manuf. Sci. Technol. 29, 36–52. doi:10.1016/j.cirpj.2020.02.002
Ke, S., Xiang, F., Zhang, Z., and Zuo, Y. (2019). A Enhanced Interaction Framework Based on VR, AR and MR in Digital Twin. Procedia CIRP 83, 753–758. doi:10.1016/j.procir.2019.04.103
Kostic, Z. (2012). Comparative Study of CAD Software, Web3D Technologies and Existing Solutions to Support Distance-Learning Students of Engineering Profile. Int. J. Comput. Sci. Issues 9, 181–187.
Ledermann, F., and Schmalstieg, D. (2005). “APRIL: a High-Level Framework for Creating Augmented Reality Presentations,” in IEEE Proceedings. VR 2005. Virtual Reality, 2005 (IEEE), 187–194.
Leng, J., Liu, Q., Ye, S., Jing, J., Wang, Y., Zhang, C., et al. (2020a). Digital Twin-Driven Rapid Reconfiguration of the Automated Manufacturing System via an Open Architecture Model. Robotics Computer-Integrated Manuf. 63, 101895. doi:10.1016/J.RCIM.2019.101895
Leng, J., Yan, D., Liu, Q., Xu, K., Zhao, J. L., Shi, R., et al. (2020b). ManuChain: Combining Permissioned Blockchain with a Holistic Optimization Model as Bi-level Intelligence for Smart Manufacturing. IEEE Trans. Syst. Man. Cybern. Syst. 50, 182–192. doi:10.1109/TSMC.2019.2930418
Leng, J., Wang, D., Shen, W., Li, X., Liu, Q., and Chen, X. (2021a). Digital Twins-Based Smart Manufacturing System Design in Industry 4.0: A Review. J. Manuf. Syst. 60, 119–137. doi:10.1016/J.JMSY.2021.05.011
Leng, J., Zhou, M., Xiao, Y., Zhang, H., Liu, Q., Shen, W., et al. (2021b). Digital Twins-Based Remote Semi-physical Commissioning of Flow-type Smart Manufacturing Systems. J. Clean. Prod. 306, 127278. doi:10.1016/J.JCLEPRO.2021.127278
Leng, J., Yan, D., Liu, Q., Zhang, H., Zhao, G., Wei, L., et al. (2019a). Digital Twin-Driven Joint Optimisation of Packing and Storage Assignment in Large-Scale Automated High-Rise Warehouse Product-Service System. Int. J. Comput. Integr. Manuf. 34, 783–800. doi:10.1080/0951192X.2019.1667032
Leng, J., Zhang, H., Yan, D., Liu, Q., Chen, X., and Zhang, D. (2019b). Digital Twin-Driven Manufacturing Cyber-Physical System for Parallel Controlling of Smart Workshop. J. Ambient. Intell. Hum. Comput. 10, 1155–1166. doi:10.1007/S12652-018-0881-5/FIGURES/11
Liu, Q., Zhang, H., Leng, J., and Chen, X. (2019). Digital Twin-Driven Rapid Individualised Designing of Automated Flow-Shop Manufacturing System. Sustain. Cybern. Manuf. 57, 3903. doi:10.1080/00207543.2018.1471243
Lyonnet, B., and Toscano, R. (2016). Contribution of Virtual Reality for Lines Production’s Simulation in a Lean Manufacturing Environment Emotion Measurements Thourgh the Touch of Matérials Surfaces View Project Quality Management View Project Mohamed-Amine Abidi Centrale Lyon & École Natio. Int. J. Comput. Theory Eng. 8. doi:10.13140/2.1.2911.2642
Noël, F., Alpan, G., and Mangione, F. (2020). A Complete Digital Chain to Enable the Digital Twin of a Shop Floor. IFIP Adv. Inf. Commun. Technol. 594, 128–138. doi:10.1007/978-3-030-62807-9_11
Paelke, V. (2014). “Augmented Reality in the Smart Factory: Supporting Workers in an Industry 4.0. Environment,” in Proceedings of the 2014 IEEE Emerging Technology and Factory Automation (ETFA) (IEEE). doi:10.1109/etfa.2014.7005252
Rabah, S., Assila, A., Khouri, E., Maier, F., Ababsa, F., Bourny, V., et al. (2018). Towards Improving the Future of Manufacturing through Digital Twin and Augmented Reality Technologies. Procedia Manuf. 17, 460–467. doi:10.1016/J.PROMFG.2018.10.070
Revetria, R., Tonelli, F., Damiani, L., Demartini, M., Bisio, F., and Peruzzo, N. (2019). A Real-Time Mechanical Structures Monitoring System Based on Digital Twin, IOT and Augmented Reality. Simul. Ser. 51, 1. doi:10.23919/SPRINGSIM.2019.8732917
Riexinger, G., Kluth, A., Olbrich, M., Braun, J.-D., and Bauernhansl, T. (2018). Mixed Reality for On-Site Self-Instruction and Self-Inspection with Building Information Models. Procedia CIRP 72, 1124–1129. doi:10.1016/J.PROCIR.2018.03.160
Rosen, R., von Wichert, G., Lo, G., and Bettenhausen, K. D. (2015). About the Importance of Autonomy and Digital Twins for the Future of Manufacturing. IFAC-PapersOnLine 48, 567–572. doi:10.1016/j.ifacol.2015.06.141
Schroeder, G., Steinmetz, C., Pereira, C. E., Muller, I., Garcia, N., Espindola, D., et al. (2016). “Visualising the Digital Twin Using Web Services and Augmented Reality,” in EEE International Conference on Industrial Informatics (INDIN), 522–527. doi:10.1109/INDIN.2016.7819217I
Shao, G., and Helu, M. (2020). Framework for a Digital Twin in Manufacturing: Scope and Requirements. Manuf. Lett. 24, 105–107. doi:10.1016/j.mfglet.2020.04.004
Tao, F., Zhang, H., Liu, A., and Nee, A. Y. C. (2019). Digital Twin in Industry: State-Of-The-Art. IEEE Trans. Ind. Inf. 15, 2405–2415. doi:10.1109/TII.2018.2873186
Villanueva, A., Zhu, Z., Liu, Z., Peppler, K., Redick, T., and Ramani, K. (2020). “Meta-AR-App: An Authoring Platform for Collaborative Augmented Reality in STEM Classrooms,” in Conference on Human Factors in Computing Systems - Proceedings (New York, NY, USA: Association for Computing Machinery), 1–14. doi:10.1145/3313831.3376146
Yang, J., Son, Y. H., Lee, D., and Noh, S. D. (2022). Digital Twin-Based Integrated Assessment of Flexible and Reconfigurable Automotive Part Production Lines. Machines 10, 75. doi:10.3390/MACHINES10020075
Zhang, C., Xu, W., Liu, J., Liu, Z., Zhou, Z., and Pham, D. T. (2019). A Reconfigurable Modeling Approach for Digital Twin-Based Manufacturing System. Procedia CIRP 83, 118–125. doi:10.1016/J.PROCIR.2019.03.141
Zhu, J., Ong, S. K., and Nee, A. Y. (2013). An Authorable Context-Aware Augmented Reality System to Assist the Maintenance Technicians. Int. J. Adv. Manuf. Technol. 66, 1699–1714. doi:10.1007/s00170-012-4451-2
Keywords: digital twin, augmented reality, gestural interaction, industry 4.0, AR authoring
Citation: Begout P, Kubicki S, Bricard E and Duval T (2022) Augmented Reality Authoring of Digital Twins: Design, Implementation and Evaluation in an Industry 4.0 Context. Front. Virtual Real. 3:918685. doi: 10.3389/frvir.2022.918685
Received: 12 April 2022; Accepted: 08 June 2022;
Published: 30 June 2022.
Edited by:
Alberto Raposo, Pontifical Catholic University of Rio de Janeiro, BrazilReviewed by:
Weiya Chen, Huazhong University of Science and Technology, ChinaJiewu Leng, Guangdong University of Technology, China
Copyright © 2022 Begout, Kubicki, Bricard and Duval. This is an open-access article distributed under the terms of the Creative Commons Attribution License (CC BY). The use, distribution or reproduction in other forums is permitted, provided the original author(s) and the copyright owner(s) are credited and that the original publication in this journal is cited, in accordance with accepted academic practice. No use, distribution or reproduction is permitted which does not comply with these terms.
*Correspondence: Pierre Begout , cGllcnJlLmJlZ291dEBpbXQtYXRsYW50aXF1ZS5mcg==