 Jérémy Lacoche
 Eric Villain
 Anthony Foulonneau
- Orange Innovation, Paris, France
Validating an augmented reality application in a virtual reality simulation can offer many advantages compared to testing in real conditions and can speed up development processes. With such a simulation, developers and designers do not need to have constant physical access to the real place. They can save physical navigation, experiment with different kinds of devices and isolate testing parameters. While the validity of functional testing in virtual reality simulations is not particularly challenged, the validity of such simulations to evaluate user experience and usability, similarly as in real conditions, still needs to be assessed. We then conducted a user study to explore the validity of evaluating these criteria with a virtual reality simulation tool and the importance of simulation fidelity for that purpose. Indeed, we also seek to determine whether it is necessary to simulate the limited field of view of augmented reality glasses and if the simulation can take place in a virtual world that is not a replica of the real targeted environment. To do so, we have developed an augmented reality application for smart-homes where a user can interact with different connected objects. One group of users performed the experiment in the real place with augmented reality glasses and three other groups performed the same experiment in virtual reality with various simulation conditions (field of view and environment). Users’ subjective feedback and quantitative results only highlight very few differences between real-world conditions and simulation in virtual reality, whatever the simulation parameters used. These results suggest the interest in using virtual reality simulation to evaluate an augmented reality application but should be confirmed on other use cases and interaction tasks.
Introduction
There is today a growing interest in Augmented Reality (AR) applications thanks to the democratization of smartphones with built-in tracking capacities (ARKit1, ARCore2). At the same time, Optical See-Through Head-Mounted Displays (OST-HMDs), now referred to as AR glasses, tend to be more lightweight, powerful and usable, and then could soon be available for the consumer market. While previous AR systems such as handheld devices and glasses without hand-tracking capabilities used to be difficult to interact with, recent AR glasses tend to provide similar interaction capabilities than Virtual Reality (VR) headsets. Their limited Field of View (FoV) is still a technological limit that needs to be addressed before mass adoption.
During the development process of AR Applications, testing functional aspects and evaluating usability and user experience remain challenging tasks. Indeed, first, we can cite technical challenges. They require the adaptation of the same application to various devices, Operating Systems (OS) and Software-Developments-Kits (SDK) and the integration of existing services such as Internet-of-Things (IoT) based services (Pfeiffer and Pfeiffer-Leßmann (2018)). Second, logistical issues can also be raised. AR deployment requires access to particular spaces. Some may sometimes be difficult to access because of the use case, such as military and nuclear facilities. Others may be hard-to-reach, such as a relay mast or underground cables, or because they are too dangerous to reproduce such a place on fire for firefighters training (Ragan et al. (2009)). Depending on the use case, the access to a testing environment can also be limited for financial reasons, especially for small teams. Performing a large testing campaign with end-users to evaluate the usability and user experience of a given application can then be even more difficult in such situations. Last, Lee et al. (2013) also raise the difficulty to control the conditions in which an AR experiment takes place. Factors such as lighting conditions, crowded places, and tracking issues can make experimental conditions difficult to control and repeat.
To deal with these issues, interesting approaches propose to simulate AR in VR (Ragan et al. (2009); Lee et al. (2009)). The simulation of an AR device and a real environment in VR can replicate the level of immersion of the target display system (Lee et al. (2013)) as well as interaction capabilities. VR can even be used to simulate a “perfect” AR device that does not exist yet, with a reliable tracking system and a large FoV (Grandi et al. (2021)). By using the same software components, VR simulation can be a powerful tool to perform functional tests before deploying an application in real conditions with an AR device. As demonstrated by some studies, VR simulation can also be used in some tasks to evaluate the performances of users with an AR application similarly as in real conditions (Lee et al. (2009); Lee et al. (2013)). However, to our knowledge, no study has focused on demonstrating the validity of VR simulation for evaluating the usability and the user experience of an AR application. Indeed, more subjective criteria could be evaluated as well, such as appreciation for interaction techniques, ease of use, or visual aspects. Validating this hypothesis could be valuable for developers and designers, especially those developing applications for the consumer market. This could help them speed up their testing campaigns and then their development processes.
That is why in this paper we propose a first user experiment to explore the validity of VR simulation for evaluating usability and user experience of AR applications. This study also aims to evaluate the importance of simulation fidelity for that purpose. Indeed, we wanted to evaluate the necessity to simulate the limited FoV of AR glasses, and the need to accurately replicate the real environment in VR. Indeed, simulating these parameters could be constraining for developers and designers. Then, groups of users tested the same AR application for smart-home control with AR glasses or with a VR headset with various simulation conditions: Simulated FoV or Not, using a virtual replica of the real space or a different one. We chose the smart-home use case as it is particularly interesting in our context as interactions with AR elements impact the real world. As in previous work, we collected users’ performances, but also more subjective feedback regarding usability and user experience. Comparable results were obtained for both objective and subjective criteria whatever the experimental conditions. Our work then provides a first evidence that VR simulation could be used to evaluate the usability and the user experience of AR applications.
Related Work
Controlling AR Conditions
In the literature we can find many solutions that propose exploiting VR simulation of AR applications to isolate the impact of AR limitations (display type, registration, FoV, etc.) on performances and user experience. Indeed, such parameters cannot be controlled in real conditions with an AR device. These parameters are classified by Tiefenbacher et al. (2014) into three categories: rendering, interaction, and tracking. Controlling these parameters in VR can also be used to simulate a “perfect” AR device that does not exist yet. As a first example, Arthur et al. (2007) simulated different types of head-worn display concepts for NASA. Then, Ragan et al. (2009) proposed to use VR simulation in order to evaluate the impact of registration errors, including jitter and latency, on task performances. The study demonstrated a relationship between accurate registration and task performance. To continue, Ventura et al. (2009) simulated multiple levels of tracking reliability and multiple FoVs to determine their impact on a target following task scenario. Similar performances were observed between an optimal setup and a setup with an intermediary FoV and short tracking dropouts. In the same way, Ren et al. (2016) also evaluated the impact of the FoV and tracking parameters on an information-seeking scenario. Using a CAVE, authors were able to simulate large FoVs that cannot be obtained with current AR devices. Results showed that a larger field of view can increase users’ performances in such tasks. Finally, Terrier et al. (2018) also used VR simulation to evaluate the impact of registration errors, including jitters and placement errors, and visualization modalities including transparency and occlusion. The study demonstrated that registration errors should be limited to optimize users’ performances and that visual inconsistencies between AR and real content should be avoided.
Speeding Up Development Processes
Simulation of AR in VR can also shorten development times. Indeed, it can allow developers to perform functional tests of an application without being constrained by technical and logistical aspects. Tiefenbacher et al. (2014) introduced an architecture for evaluating AR experiences in a VR simulation before deployment. They proposed an implementation of such a tool in a CAVE that is able to simulate a tablet or binocular AR glasses. Alce et al. (2015) also proposed a VR tool that can simulate the interaction between an AR application and wearable devices. They illustrated this tool with a smart-home application. The authors showed how it can be used to evaluate several interaction techniques thanks to quantitative (performances, mental workload) and qualitative (subjective questionnaires) data to improve their application before deployment. To continue, Pfeiffer and Pfeiffer-Leßmann (2018) proposed to use 360 panoramas to prototype AR applications and then test them in VR. The solution relies on ExProtoVAR (Pfeiffer-Leßmann and Pfeiffer (2018)), a tool that can simulate monocular and binocular AR glasses as well as handheld devices (smartphones and tablets). For instance, the limited FoV of binocular AR glasses can be simulated to match the limitations of real devices such as the Hololens3 or the Magic Leap One4. In the same way, Soedji et al. (2020) introduced a complete pipeline to create AR applications to control and monitor smart environments. It includes a prototyping step in VR in a 3D digital twin of the targeted environment. The created content can be immediately tested in VR and then deployed on an AR device. As in ExProtoVAR (Pfeiffer-Leßmann and Pfeiffer (2018)) this solution can simulate binocular AR glasses and handled devices. Last, Grandi et al. (2021) detailed a user-centered methodology, based on AR in VR simulation, to design and evaluate the benefits of user interfaces without being constrained by hardware limitations. They introduced their methodology through two scenarios: a law enforcement traffic stop and a firefighting search and rescue scenario. For now, none of these works have demonstrated that a given application would have obtained the same objective and subjective feedback in their VR simulation tool or on a real AR device.
Comparison Between AR and VR Simulations
Lee et al. (2009) were the first ones to try to validate the use of VR to simulate AR. To do so, they replicated an AR experiment introduced by Ellis et al. (1997) with a VR simulator. They simulated in VR the same conditions as in the AR experiment including FoV, latency, and task parameters. The authors demonstrated comparable evolutions of performances when adjusting these parameters as in the original experiment. However, absolute performances observed in VR were different from the original experiment. This could be explained by the difficulty of reproducing the same conditions of a user study that was performed more than 10 years earlier, including the method used to evaluate performances. That is why Lee et al. (2012) proposed a complementary study where they compared the same visual following task in AR and VR with different simulated latencies. They observed comparable results between AR and VR conditions. While these two studies mainly focused on display and interaction simulation, Lee et al. (2013) also proposed to evaluate the impact of simulation fidelity on performances on an information-seeking task. An AR application was then tested by users in real conditions or in VR with three different levels of visual realism of the targeted environment. As in previous studies, comparable performances results were obtained between AR and VR simulation and the visual realism of the simulated environment did not impact these performances in VR. These three different works then gave the first pieces of evidence to support the validity of VR simulation for experiments that focus on users’ performances.
Other studies have investigated differences on other criteria than performance. Gaffary et al. (2017) compared haptic perception between AR and VR simulation. They performed a similar experiment in AR and VR to detect perceptual deviations on the stiffness of a virtual piston which was associated with a haptic device. Results showed that the piston was perceived as more rigid in AR, demonstrating differences in haptic perception between AR and VR simulation. A recent work of Brauns and Tümler (2021) compared the impact of the AR FoV on an assembly guidance scenario with the help of AR and VR devices (simulation). In their study, users tested seven setups characterized by their FoV and their target device (Hololens or HTC Vive5). Their goal was to determine which HMD configuration would be optimal for their scenario and if similar results would be obtained on the real AR device or on the same simulated one in VR. Results showed that the impact of the same FoV was evaluated differently between AR and VR simulation. It then suggests, that regarding this FoV criteria, results obtained in a VR simulation cannot be directly compared into an AR-compatible result. This study was the first one to compare subjective feedback collected on a real AR device and in VR simulation. However, this study mainly focused on observing the impact of the FoV on a dedicated task and not on comparing the usability and user experience of an application tested on an AR device or in VR simulation. In this paper, we propose a user study to fill this gap.
Experimental Design
Objectives and Motivations
As detailed, most of the previous work focused on validating the use of VR simulation of AR from a performance perspective. Only a few work also analyzed more subjective criteria, but they focused on the impact of isolated parameters such as haptics and FoV. While VR systems tend to become easy to interact with for everyone, technical limitations of AR headsets (tracking, FoV) can make them difficult to use. From that perspective, our evaluation could help us identify potential usability differences between AR and VR. Our goal is to determine if VR simulation can also be used by AR developers to perform early testing of their applications in order to identify design flaws about usability, visual aspects, mental workload, used modalities, perceived usefulness, etc. More generally, we want to determine if VR simulation can be used to evaluate the user experience of an application similarly as in real conditions. Demonstrating this capacity of VR could then allow AR developers to shorten their testing campaigns. We also want to evaluate the importance of simulation fidelity for that purpose. While Lee et al. (2013) et al. tested different levels of realism of the environment, in this study we want to evaluate the necessity to simulate the AR FoV and to exactly replicate the targeted environment as in real conditions. Developing such as tool with FoV simulation and replicating all target real environments could be time consuming for AR developers. Indeed, if replicating exactly the same environment is not required, a designer or a developer could then use an existing generic environment, that still shares common characteristics, to evaluate an AR service in VR. Our work focuses on AR glasses as we believe that such devices are the most adapted to experience AR applications in terms of display and interaction features. Moreover, smartphones and tablets are also more difficult to simulate with a VR headset because of interaction, tracking and display resolution reasons. Future work could still focus on performing a similar experiment with handheld devices. As proposed by Tiefenbacher et al. (2014), the use of a CAVE could be more adapted in that situation.
Evaluated Application
For that purpose we developed and tested the same application for smart-home control with AR glasses and with a VR headset with different simulation conditions. We chose this use case as it is a classic use of AR for the consumer market and similar mechanisms can also be transposed for industrials in smart-building and smart-factories. It is also relevant in the case of simulation, as interaction with AR elements will impact the real environment through the connected objects. The behaviors of the simulated connected objects then need to be similar to the real ones.
In this application, users could interact with six connected objects in a living room:
• Two Light-Bulbs with three controllable features: Turn On/Off, color change, dimming change.
• One television with three controllable features: Turn On/Off, channel change, volume change.
• One thermostat with two controllable features: Turn On/Off, temperature change.
• One radio with three controllable features: Turn On/Off, channel change, volume change.
• One fan connected with a plug with one controllable feature: Turn On/Off.
Interactions with these objects were performed with 2D user interfaces that were positioned in 3D space and registered with the real world. These user interfaces were rotated in order to always face the user. These interfaces were inspired from what is done in the field of smartphone applications for smart-home control with the use of classic buttons and sliders. Examples of these interfaces can be seen in Figures 1, 2. We know that applying 2D concepts to the field of 3D user interfaces is not always optimal, but we also want to know if such design flaws would be identified similarly in AR and VR. The second reason for this choice is our desire not to confuse users with interaction modes that are too far from their habits, especially for users who are new to AR and VR. Our application is consistent with the AR definition provided by Azuma Azuma (1997), as it combines real and virtual data, is interactive in real time and the virtual contented in registered in 3D with the real world. A classic 3D ray-based selection and manipulation technique was used to interact with these user interfaces. This ray was used to click on virtual buttons and move horizontal or vertical sliders. Users tested two different interaction modes in two separate steps of the experiment. In a first mode, referred to as “Interaction Mode one″ in this paper, these interfaces were co-located with each object and then registered with the real world as seen in Figure 1. Users had then to look at an object in order to interact with it. In a second mode, referred to as “Interaction Mode two″ in this paper, a dashboard was positioned in the room by default in front of the user, as seen in Figure 2. This dashboard could be hidden and re-centered in front of the user at a distance of 1.5 m if needed. The menu was not fixed in relation to the user’s point of view, but was registered with the real world. For instance, with the centering process the user could place it in a corner of the room or on top of a real object, such as the table between the chairs and the television. We also thought about letting users move it with the 3D ray-based interaction technique, but we did not want to include such complex manipulation tasks. Through this dashboard the user could open a dedicated user interface for each object in the room and then interact with it as seen on the right of the figure. The same user interfaces were used to control each object as in the first mode. We developed and compared these two interaction modes because these are two common ways of interacting with AR applications. With these two modes we also aim to strengthen the possible conclusions of this study as their differences could have an impact on the different tested conditions. Indeed, the first one may involve more long distance interactions, more physical navigation, and a clearer field of view. On the other hand, interacting with a dashboard in the second mode may involve close range interactions, less physical navigation, and a slightly overloaded field of view when the dashboard is displayed. As our application was tested in a smaller physical space in VR than in AR, we provided users with a navigation technique to explore the environment in a similar way. We used a classic teleportation technique where the user could point to a desired future position on the floor. Another difference between AR and VR was the perception of the body of the users. While users could see themselves in AR, we chose to only represent users in VR with their two controllers, as seen in Figure 2. We did not want to include an avatar that would not exactly match the visual appearance and the movements of the user.
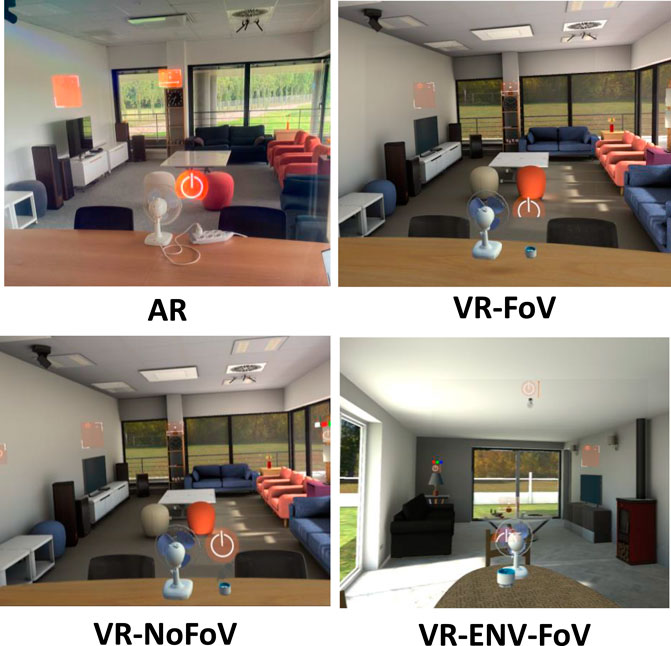
FIGURE 1. Our four experimental conditions. One group of users performed the experiment in AR. Three groups of users performed the experiment in VR with different simulations conditions: simulated AR FoV or not, same or different simulated environment. The combination with a different environment and without simulating the AR FoV was not tested.
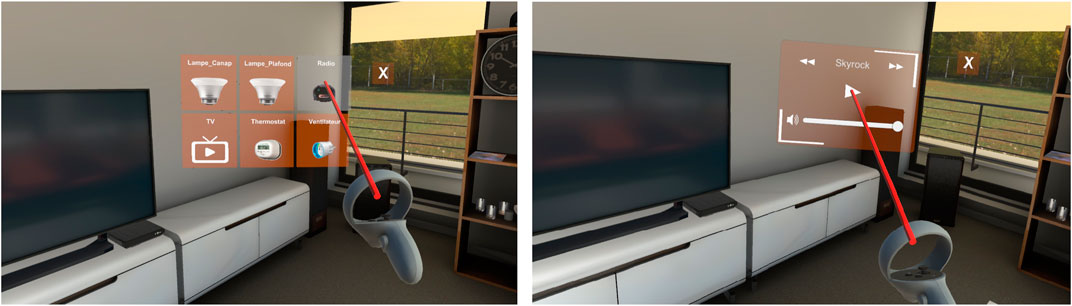
FIGURE 2. The dashboard interaction mode. On the left the dashboard displays the icons of the six connected objects of the room. On the right, when the icon of a connected object is clicked, its associated user interface is displayed on the dashboard. Here it corresponds to the interface to control the radio.
Conditions and Procedure
We used a between-subjects study design. Each user then tested only one condition between:
• AR: Users performed the experiment with an AR OST-HMD in a real living room.
• VR-FoV: Users performed the experiment with a VR HMD in a virtual replica of the real living room and with the simulation of the limited AR FoV.
• VR-NoFoV: Users performed the experiment with a VR HMD in a virtual replica of the real living room and without the simulation of the imited AR FoV.
• VR-ENV-FoV: Users performed the experiment with a VR HMD in a different virtual living room than the real one with the simulation of the limited AR FoV.
The four conditions can be seen in Figure 1. The environment for the VR-ENV-FoV group was visually different from the other one but had topological similarities and common characteristics. It was also a home environment composed of a living room and an open kitchen. Dimensions were almost the same, 12 m × 4 m for the real environment replicated in VR and 10 m × 4 m for the second one. Furniture and connected objects layouts were also comparable, as we can see in Figure 1. We have chosen to mainly adjust the visual aspects of this environment to still obtain comparable results on performances and navigation and not to stray from our use case. It can be seen as a generic house environment that could be used by designers and developers when creating AR applications for smart homes. Evaluating the impact of multiple environment parameters could be a perspective for future research. Moreover, we chose on purpose to not evaluate the last possible configuration (different environment and no simulation of the AR FoV) in order to limit the number of participants and as we believed that testing these four configurations was enough regarding our objectives. The virtual environment in VR conditions was rendered with a good level of realism thanks to textures and realistic lighting to be as close as possible to real experimental conditions.
After being explained the procedure, users started with a training step of around 5 min to get familiar with the interaction techniques of the application. In AR and VR, users could then try the 3D ray-based interaction technique to interact with neutral buttons and sliders that did not impact any connected object. In VR users could also try the navigation interaction technique.
In each condition, each user tested both interaction modes (co-located interfaces and dashboard) and we applied a counterbalancing design in order to make half the users of each group start with the first interaction mode, and half of them start with the second one. Users then started to use our smart-home application They began with one of the two interaction modes, fulfilled questionnaires, performed the same tasks with the other interaction mode, and ended with questionnaires again. For both interaction modes, the procedure was the same. First, all users started at the same position in the environment: facing the television close to the middle orange chair in the first environment and close to the couch in the second one. Second, the user was told by the experimenter the location of every connected object of the room to get familiar with the environment. Then, to be sure that users tested every feature of the application, users were guided with successive pre-recorded voice instructions that told them which action to perform. After a voice instruction, a countdown of 3 seconds was displayed to the user during which all interactions were disabled. This countdown was used to measure with precision the time to perform each action. Users were told that it was not a speed game and that their goal was to evaluate the user interfaces. However, we were still interested in completion times. A total of 17 instructions were given to each user. 10 s was waited after an instruction was completed by the user before giving another one. These instructions concerned the change of the state of the connected objects and for instance included “Turn on the fan”, “Change the color of the ceiling light to red”, “Change the volume of the radio to around 50%“, “Switch to channel five on television”. The same instructions in the same order were given to every user in both interaction modes. Users spent between 7 and 10 min in the application for each interaction mode.
Participants
Our panel consisted of 48 users, 36 males and 12 females, separated into four groups of 12 users, one per condition. All participants were volunteers and had various backgrounds including developers, designers, project managers, students, nurses. They were all naive to the experimental hypotheses. In order to balance these four groups and make them as equivalent as possible, we took into account three criteria. First, we did our best to have a comparable age distribution in each group: AR (M = 44.08, SD = 11.52), VR-FoV (M = 42, SD = 11.75), VR-NoFoV (M = 42.17, SD = 9.59), VR-ENV-FoV (M = 42.5, SD = 10.07). Then, every group was composed of exactly eight males and four females. Last, as detailed by Brauns and Tümler (2021), the expertise of users in AR and VR can impact the results. That is why, every group was also composed of four expert AR/VR users and eight users less familiar with these technologies. Here we considered as experts, users that use VR or AR at least one time per week.
Collected Data
We collected both quantitative and qualitative data. Regarding quantitative data, we collected the time to perform each action as well as the position, and rotation of users to analyze their navigation behaviours.
First, users were asked to fulfill a simulator sickness questionnaire (SSQ, Kennedy et al. (1993)) at the beginning and at the end of the experiment. Our goal was to be sure that cybersickness did not impact the results of the study and to evaluate potential differences between the four conditions. After each interaction mode users had to fulfill two questionnaires. First, a NASA Task Load Index (TLX) questionnaire (Hart and Staveland (1988)) was fulfilled to evaluate the cognitive workload of the application. Second, users were asked to rate 10 statements on a Likert scale from 1 (strongly disagree) to 7 (strongly agree) to evaluate the usability and the user experience of the application. These statements were inspired by the AR usability evaluation criteria given by Martins et al. (2015) and by the System Usability Scale (SUS)6. Evaluated criteria included, global appreciation, ease of use, reliability and efficiency of the system, usefulness, appreciation for the visual aspects. These statements are listed in Table 1. Choi et al. (2019) Last, at the end of experiment users had to fulfill another questionnaire to evaluate their global experience and to measure the proximity between the different conditions. Users were asked to rate 15 statements on multiple criteria including visual perception, comfort, credibility and interactivity. As we wanted to focus on these criteria and avoid too many questions for participants, we did not use a standard presence questionnaire. Moreover, measuring presence between could differ from VR Schwind et al. (2019) to AR Regenbrecht and Schubert (2021). We still did use some questions coming from previous work including Lee et al. (2013) and Choi et al. (2019). As detailed, the questionnaire includes a question about immersion. Regarding the terminology detailed by Slater (2003), immersion only depends on what the technology can deliver and can then be objectively assessed. From this technological point of view, our AR and VR setups do no provide the same level of immersion and this does not need to be confirmed by this questionnaire. Our goal was just to check if this objective affirmation was associated with a similar subjective feeling, even for users with less experience with immersive technologies. All statements are listed in Table 2. As well, we used a Likert scale from one to 7. This questionnaire also asked users to choose their favorite interaction mode.

TABLE 1. The ten statements we used to measure the usability and user experience of our smart-home application.
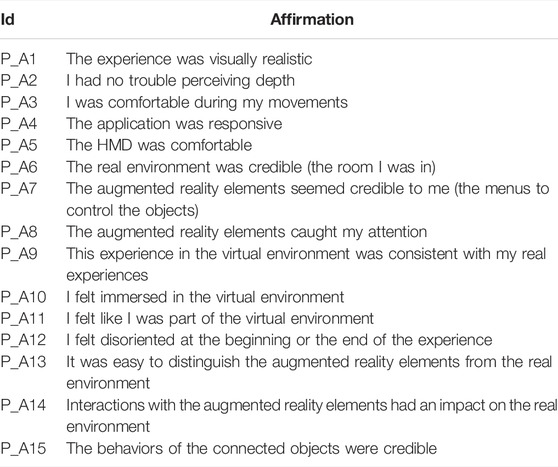
TABLE 2. The fifteen statements we used to measure the proximity between the different conditions.
Hypotheses
As detailed, previous work validated the use of VR simulation to evaluate an AR application from a performance perspective. With this study, we aim to confirm this statement and we also want to demonstrate that VR simulation can also be used to evaluate usability and user experience criteria. We also think that a more faithful simulation in terms of environment and FoV would result in more similar results on all these criteria.
• H1: Comparable results for qualitative and quantitative data will be obtained in the four groups validating the use of VR simulation for evaluating an AR application.
Some differences are still expected in VR-NoFoV and VR-ENV-FoV groups because of the different AR FoV or because of the different environment.
• H1.1: The greater FoV in the VR-NoFoV group will result in better performances and better appreciation feedback for the application.
Indeed, a greater FoV could provide an advantage in finding the user interface of an object in the first interaction mode, and could avoid situations where the dashboard is truncated in the second interaction mode.
• H1.2: The different environment in the VR-ENV-FoV group will impact the performances in the first interaction mode as the layout of the connected objects is not exactly the same. However, we do not expect any differences in usability or user experience.
More generally, thanks to the statement listed in Table 2, we also want to validate if VR simulation can provide an experience comparable to AR for visual perception and interactivity criteria. In that case, we do not think that the simulated FoV and the environment will impact the results.
• H2: Users in AR will feel less constrained during physical navigation (locomotion) compared to users in VR. Less physical distances will be traveled in VR. If we also take into account VR teleportations, we think that similar navigation behaviors will be observed between VR and AR.
• H3: For visual perception, interactivity, comfort, and connected objects behaviors criteria, we will not observe any difference between the four conditions.
Hardware and Technical Details
The four versions of our application were developed with Unity 2019.4 LTS7. In the AR group, each user was equipped with a Magic Leap One headset as seen on the left of Figure 3. It is composed of semi-transparent glasses linked through a wire to a computing unit that could be attached to a belt or a pocket. The device FoV is 40° horizontal x 30° vertical. Its resolution per eye is 1,280 × 960 and it has a refresh rate of 120 Hz. The device is also composed of a 6DoF controller that was used for interacting with the system with the dominant hand. The trigger of the controller was used to confirm selections with the ray-based selection technique, and a long press on the bumper was used to recenter the dashboard in this particular interaction mode. Interactions with real connected objects were implemented through Wi-Fi and through the Z-Wave protocol8.
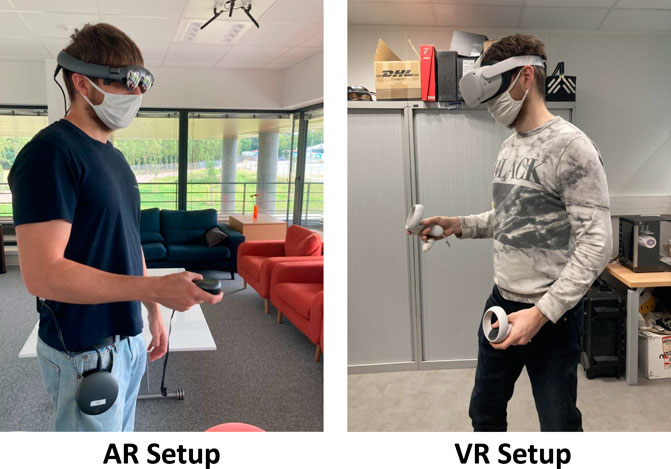
FIGURE 3. In the AR setup we used the Magic Leap one headset composed of a semi-transparent display, a 6DoF controller and computing unit attached to the pocket of the user. In the VR setup we used an Oculus Quest two connected to a PC with the experimental Air-Link mode. The headset comes with two 6DoF controllers.
In the three VR groups, each user was equipped with an Oculus Quest 29 as seen on the right of Figure 3. We used a different real space from the AR condition which gave users an area of 3 m × 3 m for physical navigation. We used the Air-Link experimental mode in order to go without the wire and benefit from the performances of a powerful PC (RTX 2080; Intel Core I9-9900K, 32Go RAM). The device FoV is 104° horizontal x 98° vertical. Its resolution per eye is 1832 × 1920 and it has a refresh rate of 72 Hz. Preliminary tests were performed with a Pimax headset10 with a larger FoV in order to be closer to the human FoV. However, visual distortions in the peripheral view caused visual discomfort to users. The headset is composed of two 6DoF controllers. The one in the dominant hand was used to control the ray-based interaction technique and selections were confirmed with the trigger. A long press on another button of that same controller was used to recenter the dashboard in that particular interaction mode. The second controller was used to control the teleportation interaction technique for navigating in the virtual environment. As performed in many VR applications, pushing forward the joystick of that controller allowed the user to point to a place on the ground, and the release of this joystick confirmed the teleportation intention. The simulation of the AR FoV was implemented with a clipping shader as in Brauns and Tümler (2021). Similarly as Lee et al. (2009), we also replicated the opacity of the optics of the magic leap through classic blending mechanisms in the same shader. As seen in Figure 1, the augmentations were not fully opaque and the boundaries of the simulated AR display could be slightly observed. We did not try to simulate the glasses frame as our preliminary tests caused visual discomfort to users. Both virtual environments were modeled by a professional 3D designer. We tried to reach photorealistic rendering thanks to the use of the lightmaps baking feature included in Unity. All connected objects behaviours were replicated in VR with visual and sound effects, to get as close as possible to reality. In AR, the thermostat was not connected to any heater. We did not simulate any temperature changes in the room for VR either. For these objects, the only difference between AR and VR was the lack of airflow for the fan in VR.
Results
Cybersickness
With the SSQ, following the method detailed by Kennedy et al. (1993), we computed a cybersickness evaluation score for each user at the beginning and at the end of the experiment. For each condition, we used a Wilcoxon Matched Pair Signed Rank Test to determine if the difference was significant as the results did not follow a normal distribution. SSQ scores were slightly greater at the end of the experiment for three groups: AR (start: M = 1.56, SD = 2.50; end: M = 11.22, SD = 18.46; p = 0.022), VR-FoV (start: M = 4.05, SD = 4.90; end: M = 4.36, SD = 10.67; p = 0.7463), VR-NoFoV (start: M = 5.92, SD = 6.85; end: M = 8.41, SD = 9.45; p = 0.61). It was slightly inferior at the end of the experiment for the remaining condition VR-ENV-FoV (start: M = 9.97, SD = 26.65; end: M = 5.29, SD = 6.27; p = 0.67). Globally, SSQ scores remained low at the end of the experiment and no user experienced severe symptoms. We can then say that cybersickness did not impact the results of this study. Only a significant difference was observed for the AR condition (p
Performances
Even if we told users that the experiment was not a speed game and that their main goal was to evaluate the application, we still analyzed the time they took to perform the 17 instructions. Our goal was to confirm the results obtained in previous work regarding the equivalence of performances between AR and VR simulation. For each user, we then made the sum of the time taken to perform each instruction. For each instruction, the timer started after the countdown and ended when the desired state of the corresponding connected object was reached. The results are detailed in Figure 4. As we can see, for the first interaction mode, the results are very close. Users took around 3 s to perform each instruction in all groups. As the results did not follow a normal distribution, we performed a Kruskal–Wallis test. The result (H (3) = 0.26, p = 0.97) confirmed that the tested condition did not significantly impact the performances for this interaction mode. We can observe more differences for the second interaction mode. For instance, users in group VR-NoFoV performed the task in a shorter time. The result of the Kruskal–Wallis test (H (3) = 2.49, p = 0.48) suggests that the tested condition did not impact significantly the performances for this interaction mode either.
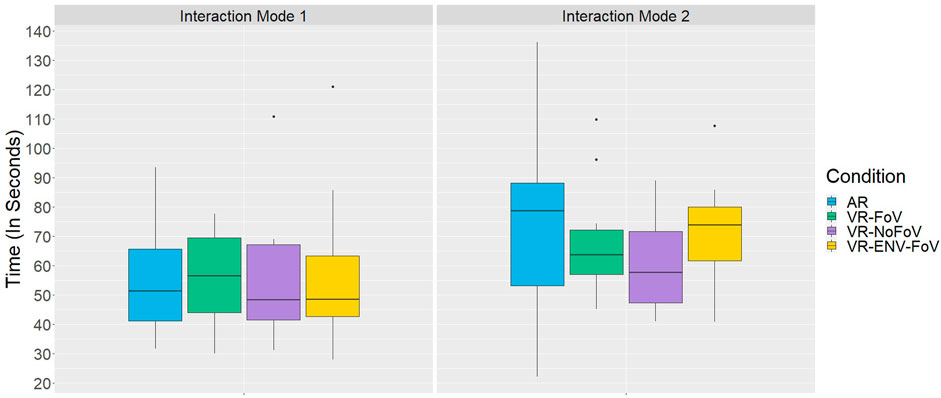
FIGURE 4. Performances comparison between conditions for both interaction modes.
Navigation
To evaluate the proximity between VR simulation and AR, we also compared the traveled distances of users between the different groups. To do so, the position of the user was recorded twice per second. First, we computed the distance traveled by each user by adding the distances between all successive recorded positions. Since the three VR conditions included a teleportation navigation technique, two types of comparison were performed. First, we compared only the physical distance traveled by users. In that case, we did not take into account teleportations for the three VR groups. Second, we compared, the total distance traveled by users. In that case, teleportations were also taken into account. Results are detailed in Figure 5.
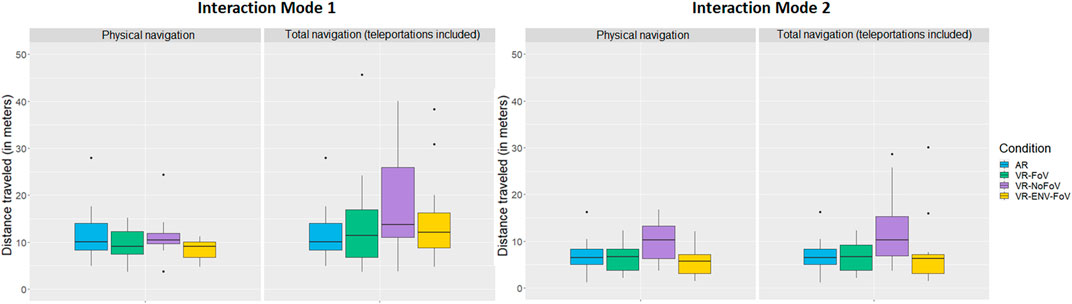
FIGURE 5. Traveled distances (physical and total) for both interaction modes.
As we can see, for physical navigation only, users in AR with the first interaction mode tended to travel a greater distance than users in VR. As the results followed a normal distribution, we performed an ANOVA. The result (F (3,44) = 1.601 p = 0.203) shows that this difference was not significant. If we take into account teleportations, for the first interaction mode, we can observe an opposite trend. Users tended to travel a greater distance in VR compared to AR. We can also observe that, when we include teleportations, users in the VR-NoFOV group seemed to have traveled a greater distance. As well, we performed an ANOVA and the result (F (3,44) = 1.601 p = 0.203) shows that this difference was not significant.
For the second interaction mode, we can first observe that users tended to travel less distance (physical and total) and we can see fewer differences between physical and total navigation. This result was expected as the dashboard could be moved closer whenever the user wanted. For physical navigation, we can observe similar results except for the VR-NoFoV condition. Indeed, users physically traveled a greater distance in that condition. An ANOVA (F (3,44) = 3.082 p = 0.037) confirmed the significativity (p
Regarding navigation, for the first interaction mode, for each interaction instruction, we also collected the distance between the user and the corresponding connected object at the time the state of this object was correctly modified. We then computed for each user the mean interaction distance. Globally, we observed similar distances for three groups: AR (M = 3.25, SD = 0.54), VR-FoV (M = 3.10, SD = 0.57) and VR-NoFoV (M = 3.09, SD = 0.51). Globally, lower interaction distances were observed for the VR-ENV-FoV group (M = 2.6, SD = 0.31). As the results did not follow a normal distribution, we performed a Kruskal–Wallis test. The result (H (3) = 10.43, p = 0.015) suggests that the tested condition did impact significantly (p
Workload
We evaluated the cognitive workload of our application for both interaction modes with the NASA TLX questionnaire. Results for the total workload are detailed in Figure 6. We can observe that the workload reported by users seems to be lower in the VR-ENV-FoV group which could suggest an impact of the environment. As the results did follow a normal distribution, we performed an ANOVA for each interaction mode. Results suggest that these differences were not significant (Interaction Mode 1: F (3,44) = 1.423 p = 0.249; Interaction Mode 2: F (3,44) = 1.034 p = 0.387). Figure 7 illustrates the comparison between the adjusted ratings of each NASA TLX factor as reported by the participants for both interaction modes. We reported the p-value of each independent ANOVA performed for each factor. We cannot observe any trend for the differences between the different groups. We observed no significant differences for these factors.
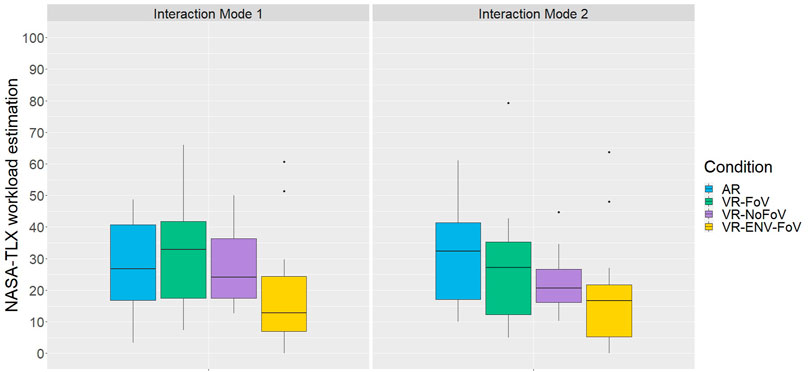
FIGURE 6. Workload estimation based on NASA TLX for both interaction modes.
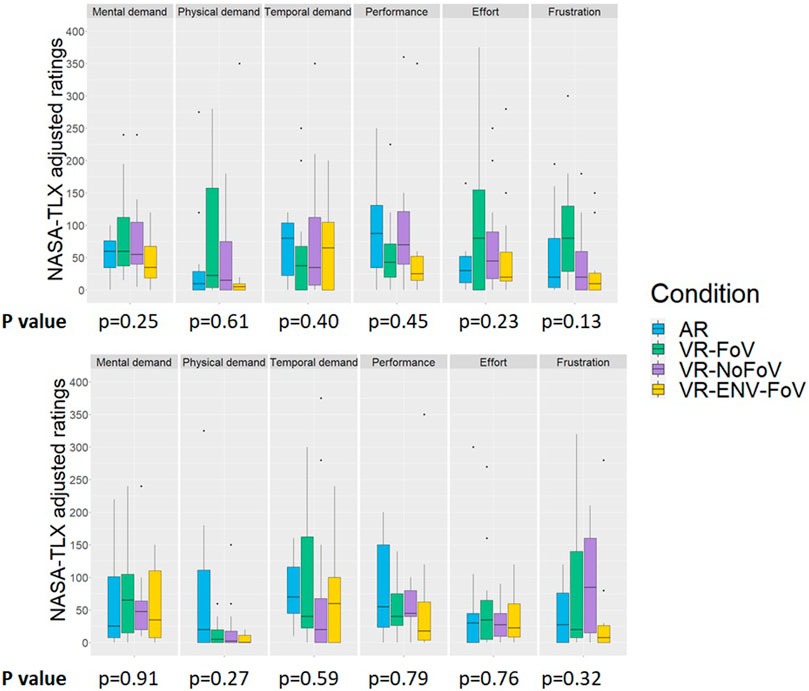
FIGURE 7. NASA TLX factors adjusted ratings (weight x rating) for both interaction modes. p-values for these factors are the result of independent ANOVAs.
Usability and User Experience
The usability and the user experience of each application (interaction modes 1 and 2) were evaluated thanks to the statements detailed in Table 1. Ratings for all these statements for both interaction modes are reported in Figure 8. We also reported the p-value of each independent ANOVA performed for each affirmation. We only observed significant differences for two statements with the first interaction mode. First, we observed a significant difference for U_A1 (F (3,44) = 3.439 p = 0.0247
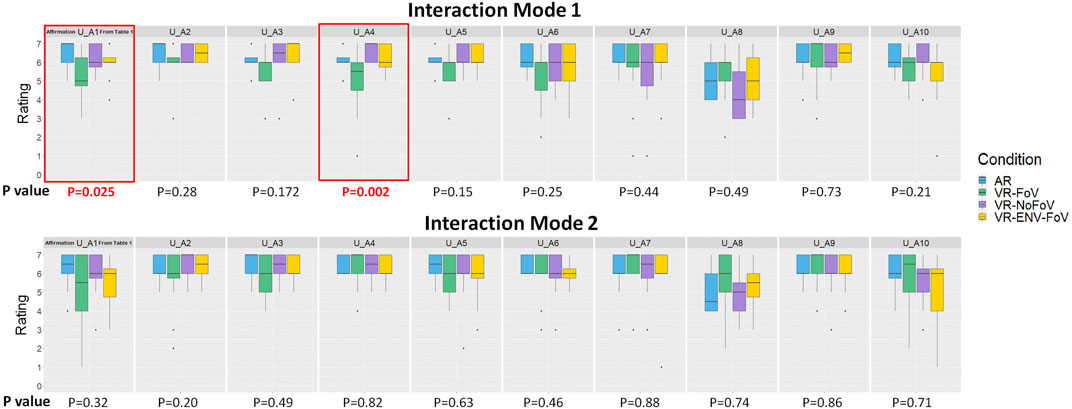
FIGURE 8. Ratings given to each statement of Table 1 collected for both interaction modes. p-values for these factors are the result of independent ANOVAs.
At the end of the experiment, we also asked users which interaction mode they preferred. For the AR group, nine users answered the first one and three the second one. For the VR-FoV group, four users answered the first one and eight the second one. For the VR-NoFoV group, seven users answered the first one and five the second one. For the VR-ENV-FoV group, seven users answered the first one and five the second one. The results seem consistent between the different groups except for group VR-FoV. We also performed pairwise comparisons between the two interaction modes for every statement of Table 1 in order to highlight possible opposite results directions between groups. Indeed, for a given statement, observing a significantly greater rating for a given interaction mode in one group and a significantly greater rating for the other interaction mode for the other mode could question the validity of using VR simulation. However, such a result was not observed for any statement.
Experience Proximity
Thanks to the statements listed in Table 2, we evaluated the proximity between the different conditions in terms of visual realism, comfort, credibility, interactions. Ratings for all these statements are reported in Figure 9. We also reported the p-value of each independent ANOVA performed for each affirmation. We can observe significant differences for two statements. First, we observed a significant difference for P_A11 (F (3,44) = 6.60 p = 0.0009
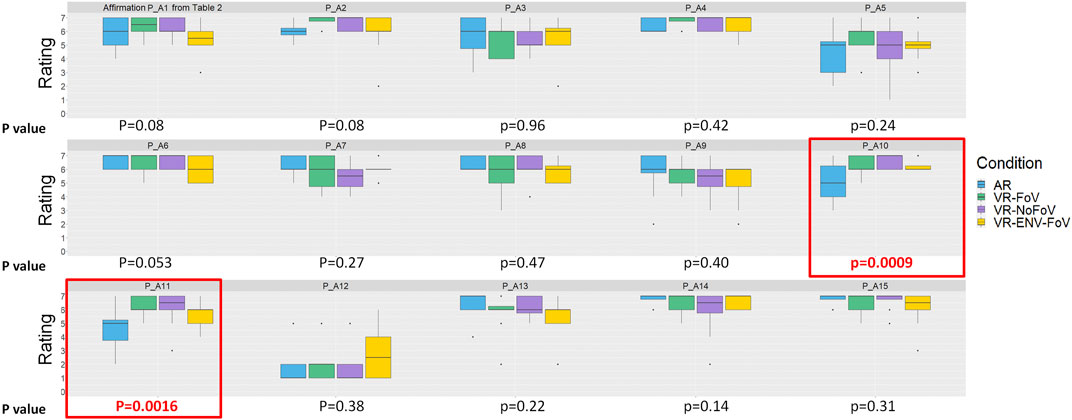
FIGURE 9. Ratings given to each affirmation of Table 2 collected at the end of the statement. p-values for these factors are the result of independent ANOVAs.
Comments and Observations
First, in the real environment, we observed that some users did sit in one of the orange armchairs that we can see in Figure 1. Of course, this behavior could not be observed for the three VR groups as the experiment was performed in a different real space, without any place to sit. However, a lot of users told us during the experiment in VR that they would have liked to have been able to sit in the virtual orange armchairs. Some comments concerning the fan reported by users in VR also are in line with this observation. Indeed, a few users reported the lack of airflow from the fan.
In the comments sections of the questionnaires, we also observed concordant remarks between groups. For the first interaction mode, interacting with the sliders of the different UIs was reported difficult by three users in group AR, one user in group VR-FoV, two users in group VR-NoFoV, and five users in group VR-ENV-FoV. These sliders were used, for instance, to change the volume of the speaker as we can see in Figure 2 or to change to intensity of a light. One user per group also reported that the first interaction mode required important physical efforts. When comparing both interaction modes, one user per group also mentioned that the first interaction was more playful while the second one was more efficient.
Discussion
As in previous work, our results suggest that comparable performances can be observed for the same application in AR or in VR simulation. Indeed, we did not observe significant differences in the time to perform all instructions, whatever the interaction mode, and whatever the group. Simulation fidelity, then, did not have an impact on these results. A wider FoV did not provide an advantage to users. This could join the conclusion made by Ventura et al. (2009) that says that optimal performances are obtained from a certain threshold of FoV. The Magic Leap One FoV was then maybe enough regarding our task. Moreover, the topology of the environment in the VR-ENV-FoV was surely not different enough from the other one to observe performances differences. Regarding our main objective that concerns more subjective criteria. We did not observe any difference regarding workload but regarding usability and user experience, we observed two significant differences for two statements that concern global appreciation and interaction reliability with the first interaction mode. On these two statements, the simulation of the AR FoV in the VR-FoV group did impact badly the users’ ratings when we compare to the AR group. However, the AR field of view was the same in both conditions, simulated in one case and the result of display technology in the other. We did not observe such an effect between the AR group and the VR-ENV-FoV group where the limited FoV was also simulated. Moreover, we did not observe any significant difference for the other statements of that interaction mode and for all statements of the second interaction mode. Regarding the preference for the interaction mode, we observed the same trend in favor of the first mode in all groups expect for the VR-FoV group where we observed an opposite trend. Last, we also observed coherent users comments between groups such as the difficulty to interact with sliders. These findings globally confirm hypothesis H1 and support the main purpose of this paper and let us say that they provide the first pieces of evidence that VR simulation can also be used to evaluate the usability and the user experience of an AR Application. However, we still observed differences mainly coming from the VR-FoV group. In our case, we cannot confirm that simulation fidelity in terms of FoV and environment plays an important role for that purpose. Indeed, hypothesis H1.1 was not confirmed and hypothesis H1.2 was only partially confirmed as similar performances were observed in the VR-ENV-FoV group. These conclusions could be interesting for developers and designers as they could be able to use VR simulation to perform testing campaigns of an AR application without the constraints of developing the FoV simulation feature and without replicating a 3D model of the targeted environment. Indeed, an already existing generic environment could then be used to perform the evaluation of a service. However, it is still hard to affirm that these results could be applied to other interaction tasks and other use cases. Indeed, we focused here on a specific use case in an indoor environment. Even if these results support some previous findings following evaluations in outdoor Lee et al. (2013) and industrial Brauns and Tümler (2021) environments usability equivalence between AR and VR simulation still needs to be confirmed in more various use-cases in multiple indoor and outdoor environments. We believe that in some cases technical aspects of VR headsets could be limiting to reproduce reality. For instance, in a data center use case where the user needs to identify small elements and read small texts on servers, the low resolution of most VR headsets could affect the equivalence between simulation and AR. We still believe that the simulation of the AR FoV is still an interesting feature for developers and designers. Indeed, it can allow them to anticipate the final rendering of their application, to detect potential truncated visual elements and visual overloads. That is why these findings need to be strengthened by additional studies. A possible negative impact of the simulation of the FoV, that we observed on some statements and in the results about the preferred interaction mode, could also still be investigated more deeply in future work. As discussed by Brauns and Tümler (2021), the fact the same FoV could be evaluated differently between AR and VR simulation could guide future research. A possible explanation could be the lack of simulation of the frame of the AR glasses and the limited FoV of VR headsets that make it difficult to replicate the exact same visual conditions of AR in VR.
To continue, whatever the interaction mode, we observed very few differences in the distances traveled between AR and VR groups for both physical and total navigation. This result is also confirmed by the fact that we did not observe any significant difference between groups for the statement about navigation comfort. This is not exactly what we expected regarding hypothesis H2. Indeed, we would have expected fewer physical traveled distances in VR and comparable ones when including teleportations. Moreover, even if the difference was not significant, we still observed greater traveled distances in VR with the teleportation interaction technique compared to AR. To continue, users with the largest AR FoV (group VR-NoFoV) also seemed to travel more than the users in the other groups. Only one significant difference was observed between this group and the VR-ENV-FoV group in the second interaction mode for total traveled distance. It is then difficult to make a straightforward conclusion, but this opens the question of the impact of the AR FoV on users navigation. To finish, we also observed that the environment did impact the mean interaction distance with the 3D user interfaces. These differences in navigation behaviors should be investigated in future work. First, as we mainly focused on varying the visual aspect of the second environment, we think that the impact of the dimensions of the environment and the layout of the interactive objects should be investigated more deeply. We think if we had used a larger environment such as a complete house instead of a living room, we would have obtained different results. For such large environments, especially in outdoor situations, current AR tracking algorithms can accumulate registration errors over time which then would question the equivalence between AR and VR simulation. The impact of interaction techniques and tasks should also be evaluated in future work. In our case, thanks to the 3D-ray-based interaction technique, connected objects could be remotely controlled and navigation could then be avoided. With a different use case and with a more direct interaction technique based on a virtual hand, we think that different physical and virtual navigation behaviors could be observed between AR and VR simulation.
Last, results tend to confirm hypothesis H3 as users in the different groups did not report any significant difference about their visual perception of the experience, their perception of the interactivity of the application, their perception of the headset comfort and their perception of the connected objects behaviors. As users reported a high feeling of being part of a virtual environment while finding the experience visually realistic in the three VR groups, we can say that in our case VR simulation was able to reproduce the AR conditions coherently. These results still explain but also support our results about the validity of using VR simulation to evaluate the usability and the user experience of an AR experience. The comments made by users about their willingness to sit in the virtual armchairs, or about the lack of airflow coming from the fan, also give a clue about the favorable impact of our VR experience on presence but they also highlight important differences between AR and VR simulation. In VR, physical interactions including haptic feedback are not possible without a complex hardware setup. For our smart-home use case, this difference is important as classic usage scenarios, such as controlling the TV from a couch or the oven while sitting at a table, cannot be easily reproduced in VR. As detailed some connected objects behaviors could also be difficult to replicate, such as a fan or a heater. Other use cases could also be concerned by this limitation, such as assisted maintenance of physical equipment or assisted driving. As detailed, we also chose to represent the user only with two controllers. The impact of the representation of the user and of the role of embodiment on the validity of using VR simulation to evaluate AR applications could also be investigated. Indeed, more complete avatars could be tested in similar situations. With the continuous improvement of photorealistic rendering techniques and AR and VR displays, the convergence of AR and VR devices interaction and tracking capacities, and the future evolution of haptic devices, we think that these differences will continue to diminish.
Conclusion and Future Work
In this paper, we presented a user study to assess the validity of using VR simulation for testing the usability and user experience of an AR application. The user study also aimed to evaluate the importance of simulation fidelity for that purpose. We then tested the same smart-home application with an AR or VR HMD with different simulation conditions (AR FoV simulated or not, same or different simulated environment). As in previous work, we observed similar user performances regardless of the simulation conditions. Our user study also suggests that more subjective criteria can also be evaluated with VR simulation including mental workload, usability, and user experience aspects. Indeed, we did not observe significant differences for these criteria between the four tested conditions. The results also show that VR simulation of AR can provide a similar experience on multiple criteria including visual perception and interactivity, but they also highlight some differences. Indeed, as already mentioned by Brauns and Tümler (2021), our study also highlighted that the lack of haptic feedback in VR simulation could result in different users behaviors compared to real-world conditions. Even if we did not observe significant differences regarding navigation behaviours, we think that the limited physical space and the addition of a navigation technique in VR could still induce differences according to the use case. This should be investigated in future work.
These results need to be confirmed by future work with other use cases, more complex interactions tasks, in larger environments, and with different types of augmentation elements including 3D objects. We think that AR and VR current technical limitations could question the equivalence between reality and simulation in specific cases but as these domains make continuous technological progress, we believe that such issues are only temporary. Differences in sound perception could also be evaluated. Indeed, our study mainly focused on selection and simple manipulation interactions with flat user interfaces in a relatively small space. Our study also focused on simulating AR glasses. Future work could then also evaluate the simulation of handheld AR devices. Simulating smartphones and tablets in a VR headset could raise challenges such as haptic feedback and display resolution. From a technical point of view, it could be interesting that software tools such as Unity and Unreal Engine11 integrate native AR simulation features to ease the work of applications developers and designers.
Data Availability Statement
The raw data supporting the conclusion of this article will be made available by the authors, without undue reservation. They can be requested to amVyZW15LmxhY29jaGVAb3JhbmdlLmNvbQ==.
Author Contributions
JL and EV conceptualized the AR in VR simulation tool. JL, EV, and AF designed the study protocol. JL implemented the tool, conducted the study and drafted the manuscript. JL and AF analyzed the data. All authors approved the final version of the manuscript for submission.
Funding
This study received funding from Orange SA. The funder was not involved in the study design, collection, analysis, interpretation of data, the writing of this article or the decision to submit it for publication.
Conflict of Interest
Authors JL, EV, and AF are employed by Orange SA.
Publisher’s Note
All claims expressed in this article are solely those of the authors and do not necessarily represent those of their affiliated organizations, or those of the publisher, the editors and the reviewers. Any product that may be evaluated in this article, or claim that may be made by its manufacturer, is not guaranteed or endorsed by the publisher.
Footnotes
1IoS ARKit. https://developer.apple.com/augmented-reality/(Accessed January 2022).
2Android ARCore. https://developers.google.com/ar (Accessed January 2022).
3Microsoft Hololens, https://www.microsoft.com/hololens (Accessed January 2022).
4Magic Leap One, https://www.magicleap.com/magic-leap-1 (Accessed January 2022).
5HTC Vive, https://www.vive.com/(accessed January 2022).
6System Usability Scale, https://www.usability.gov/how-to-and-tools/methods/system-usability-scale.html (Accessed January 2022).
7Unity Game Engine, https://unity.com/(Accessed January 2022).
8Z-Wave protocol, https://www.z-wave.com/(Accessed January 2022).
9Oculus Quest 2, https://www.oculus.com/quest-2 (Accessed January 2022).
10Pimax, https://pimax.com/(Accessed January 2022).
11Unreal Engine, https://www.unrealengine.com/(Accessed January 2022).
References
Alce, G., Hermodsson, K., Wallergård, M., Thern, L., and Hadzovic, T. (2015). A Prototyping Method to Simulate Wearable Augmented Reality Interaction in a Virtual Environment-A Pilot Study. Int. J. Virtual Worlds Hum. Comput. Interact. 3, 18–28. doi:10.11159/vwhci.2015.003
Arthur, J. J., Prinzel, L., Shelton, K., Kramer, L. J., Williams, S. P., Bailey, R. E., et al. (2007). “Design and Testing of an Unlimited Field-Of-Regard Synthetic Vision Head-Worn Display for Commercial Aircraft Surface Operations,” in Enhanced and Synthetic Vision 2007 (Bellingham, WA: SPIE), 6559, 65590E. doi:10.1117/12.719695
Azuma, R. T. (1997). A Survey of Augmented Reality. Presence teleoperators virtual Environ. 6, 355–385. doi:10.1162/pres.1997.6.4.355
Brauns, S., and Tümler, J. (2021). “Simulation of the Field of View in Ar and Vr Headsets,” in Virtual, Augmented and Mixed Reality (New York, NY: Springer), 288–300. doi:10.1007/978-3-030-77599-5_21
Choi, H., Kim, Y. R., and Kim, G. J. (2019). “Presence, Immersion and Usability of Mobile Augmented Reality,” in Virtual, Augmented and Mixed Reality. Multimodal Interaction (New York, NY: Springer International Publishing), 3–15. doi:10.1007/978-3-030-21607-8_1
Ellis, S. R., Breant, F., Manges, B., Jacoby, R., and Adelstein, B. D. (1997). “Factors Influencing Operator Interaction with Virtual Objects Viewed via Head-Mounted See-Through Displays: Viewing Conditions and Rendering Latency,” in Proceedings of IEEE 1997 Annual International Symposium on Virtual Reality (New York, NY: IEEE), 138–145.
Gaffary, Y., Le Gouis, B., Marchal, M., Argelaguet, F., Arnaldi, B., and Lecuyer, A. (2017). AR Feels “Softer” Than Vr: Haptic Perception of Stiffness in Augmented versus Virtual Reality. IEEE Trans. Vis. Comput. Graph. 23, 2372–2377. doi:10.1109/tvcg.2017.2735078
Grandi, J. G., Cao, Z., Ogren, M., and Kopper, R. (2021). “Design and Simulation of Next-Generation Augmented Reality User Interfaces in Virtual Reality,” in 2021 IEEE Conference on Virtual Reality and 3D User Interfaces Abstracts and Workshops (VRW) (New York, NY: IEEE), 23–29. doi:10.1109/vrw52623.2021.00011
Hart, S. G., and Staveland, L. E. (1988). “Development of Nasa-Tlx (Task Load Index): Results of Empirical and Theoretical Research,” in Human Mental Workload (Amsterdam, Netherlands: North-Holland), 52, 139–183. doi:10.1016/s0166-4115(08)62386-9
Kennedy, R. S., Lane, N. E., Berbaum, K. S., and Lilienthal, M. G. (1993). Simulator Sickness Questionnaire: An Enhanced Method for Quantifying Simulator Sickness. Int. J. Aviat. Psychol. 3, 203–220. doi:10.1207/s15327108ijap0303_3
Lee, C., Bonebrake, S., Hollerer, T., and Bowman, D. A. (2009). “A Replication Study Testing the Validity of Ar Simulation in Vr for Controlled Experiments,” in 2009 8th IEEE International Symposium on Mixed and Augmented Reality (New York, NY: IEEE), 203–204. doi:10.1109/ismar.2009.5336464
Lee, C., Gauglitz, S., Höllerer, T., and Bowman, D. A. (2012). “Examining the Equivalence of Simulated and Real Ar on a Visual Following and Identification Task,” in 2012 IEEE Virtual Reality Workshops (VRW) (New York, NY: IEEE), 77–78. doi:10.1109/vr.2012.6180890
Lee, C., Rincon, G. A., Meyer, G., Hollerer, T., and Bowman, D. A. (2013). The Effects of Visual Realism on Search Tasks in Mixed Reality Simulation. IEEE Trans. Vis. Comput. Graph. 19, 547–556. doi:10.1109/tvcg.2013.41
Martins, V. F., Kirner, T. G., and Kirner, C. (2015). “Subjective Usability Evaluation Criteria of Augmented Reality Applications,” in International Conference on Virtual, Augmented and Mixed Reality (New York, NY: Springer), 39–48. doi:10.1007/978-3-319-21067-4_5
Pfeiffer, T., and Pfeiffer-Leßmann, N. (2018). Virtual Prototyping of Mixed Reality Interfaces with Internet of Things (Iot) Connectivity. i-com (Oldenbourg, Germany: De Gruyter), 17, 179–186. doi:10.1515/icom-2018-0025
Pfeiffer-Leßmann, N., and Pfeiffer, T. (2018). “Exprotovar: a Lightweight Tool for Experience-Focused Prototyping of Augmented Reality Applications Using Virtual Reality,” in International Conference on Human-Computer Interaction (New York, NY: Springer), 311–318. doi:10.1007/978-3-319-92279-9_42
Ragan, E., Wilkes, C., Bowman, D. A., and Hollerer, T. (2009). “Simulation of Augmented Reality Systems in Purely Virtual Environments,” in 2009 IEEE Virtual Reality Conference (New York, NY: IEEE), 287–288. doi:10.1109/vr.2009.4811058
Regenbrecht, H., and Schubert, T. (2021). Measuring Presence in Augmented Reality Environments: Design and a First Test of a Questionnaire. arXiv preprint arXiv:2103.02831.
Ren, D., Goldschwendt, T., Chang, Y., and Höllerer, T. (2016). “Evaluating Wide-Field-Of-View Augmented Reality with Mixed Reality Simulation,” in 2016 IEEE Virtual Reality (VR) (New York, NY: IEEE), 93–102. doi:10.1109/vr.2016.7504692
Schwind, V., Knierim, P., Haas, N., and Henze, N. (2019). “Using Presence Questionnaires in Virtual Reality,” in Proceedings of the 2019 CHI Conference on Human Factors in Computing Systems (New York, NY: Association for Computing Machinery), 1–12. doi:10.1145/3290605.3300590
Soedji, B., Lacoche, J., and Villain, E. (2020). “Creating Ar Applications for the Iot: a New Pipeline,” in 26th ACM Symposium on Virtual Reality Software and Technology (New York, NY: Association for Computing Machinery), 1–2. doi:10.1145/3385956.3422088
Terrier, R., Argelaguet, F., Normand, J.-M., and Marchal, M. (2018). “Evaluation of Ar Inconsistencies on Ar Placement Tasks: A Vr Simulation Study,” in International Conference on Virtual Reality and Augmented Reality (New York, NY: Springer International Publishing), 190–210. doi:10.1007/978-3-030-01790-3_12
Tiefenbacher, P., Lehment, N. H., and Rigoll, G. (2014). “Augmented Reality Evaluation: A Concept Utilizing Virtual Reality,” in International Conference on Virtual, Augmented and Mixed Reality (New York, NY: Springer), 226–236. doi:10.1007/978-3-319-07458-0_22
Ventura, J., Jang, M., Crain, T., Höllerer, T., and Bowman, D. (2009). “Evaluating the Effects of Tracker Reliability and Field of View on a Target Following Task in Augmented Reality,” in Proceedings of the 16th ACM Symposium on Virtual Reality Software and Technology, Kyoto, Japan (New York, NY: Association for Computing Machinery, 151–154. doi:10.1145/1643928.1643963
Keywords: augmented reality, virtual reality, simulation, user experience, usability testing
Citation: Lacoche J, Villain E and Foulonneau A (2022) Evaluating Usability and User Experience of AR Applications in VR Simulation. Front. Virtual Real. 3:881318. doi: 10.3389/frvir.2022.881318
Received: 22 February 2022; Accepted: 13 June 2022;
Published: 18 July 2022.
Edited by:
Youngho Lee, Mokpo National University, South KoreaReviewed by:
Frederic Merienne, ParisTech École Nationale Supérieure d'Arts et Métiers, FranceStefanie Zollmann, University of Otago, New Zealand
Copyright © 2022 Lacoche, Villain and Foulonneau. This is an open-access article distributed under the terms of the Creative Commons Attribution License (CC BY). The use, distribution or reproduction in other forums is permitted, provided the original author(s) and the copyright owner(s) are credited and that the original publication in this journal is cited, in accordance with accepted academic practice. No use, distribution or reproduction is permitted which does not comply with these terms.
*Correspondence: Jérémy Lacoche, amVyZW15LmxhY29jaGVAb3JhbmdlLmNvbQ==