 Joel Teixeira
 Sebastien Miellet
 Stephen Palmisano
94% of researchers rate our articles as excellent or good
Learn more about the work of our research integrity team to safeguard the quality of each article we publish.
Find out more
ORIGINAL RESEARCH article
Front. Virtual Real., 13 April 2022
Sec. Virtual Reality and Human Behaviour
Volume 3 - 2022 | https://doi.org/10.3389/frvir.2022.860919
This article is part of the Research TopicCybersickness in VR applicationsView all 6 articles
Visually induced illusions of self-motion (vection) are thought to cause cybersickness during head-mounted display based virtual reality (HMD VR). However, the empirical support for this widespread belief is rather mixed. Our exploratory study examined the possibility that only unexpected experiences of vection provoke cybersickness. Fifteen males and 15 females played an HMD VR game (Mission: ISS) for up to 14 min with: 1) their experiences of vection and cybersickness assessed every 2 minutes; and 2) the game being terminated whenever they reported feeling sick. Of the 30 participants tested, 17 reported feeling sick and 13 remained well. Sick and well participants did not differ in terms of the strength of their vection experiences. However, the sick participants were significantly more likely to report unexpected/uncontrolled vection. When these data were subjected to machine learning analysis, unexpected vection was found to be the most important predictor of cybersickness. These preliminary findings suggest that vection can be used to safely enhance experiences in HMD VR–as long as developers ensure that any simulated self-motions are expected and perceived to be under the user’s control.
For decades, virtual reality (VR) technology has promised to transform the way in which we interact with software. Head-mounted displays (HMDs) are now both widespread and accessible, with a growing number of HMD VR apps developed for consumer entertainment, industry, military, and research applications (Bhagat et al., 2016; Liu et al., 2016; Burns et al., 2017; Lee et al., 2017; Pfandler et al., 2017). Despite these advancements, motion sickness remains a pervasive problem for HMD VR. This cybersickness (also known as simulator sickness, or VR sickness) continues to limit both the use and the appeal of these new HMD systems. Unfortunately, up to 67% of adult VR users experience mild to severe symptoms mirroring those of other types of motion sickness (Chang et al., 2012). These symptoms can appear quite soon after exposure (Clifton and Palmisano, 2019; Risi and Palmisano, 2019; Teixeira and Palmisano, 2021) and last up to 12 h afterwards (Kennedy et al., 1994; Kennedy et al., 1994; Merhi et al., 2007). Currently we lack a universally accepted theory of cybersickness (Lawson, 2014; Palmisano et al., 2020). Thus, in this paper we outline and explore a new hypothesis of cybersickness in HMD VR (developed in response to the criticisms of, and/or the mixed evidence found for, existing sensory conflict theories).
Reason and Brand’s (1975) sensory conflict theory remains the most commonly cited theory of all types of motion sickness (Keshavarz et al., 2014) – including cybersickness. According to this theory, a multisensory pattern of motion stimulation will be more likely to induce sickness if it results in a sensory conflict or an expectancy violation. Reason and Brand (1975) originally proposed that motion sickness was caused either by: 1) intrasensory conflicts between the inner ears’ otolith organs (the gravireceptors) and its semicircular canals (inertial rotation detectors), or 2) intersensory conflicts between visual and vestibular information about self-motion. Later Reason (1978) revised the theory, proposing that expectancy violations were the major trigger for motion sickness. According to this sensory rearrangement theory, during self-generated movements, people can become sick when there is a mismatch between their expected and sensed patterns of multisensory motion stimulation (referred to as a neural mismatch). If they are not responsible for generating their physical motion (e.g., they are being passively transported on a moving vehicle), the theory predicts that they should be even more likely to become sick (e.g., compared to driving the vehicle). This is because it will be much harder for passengers to select the appropriate expected pattern of motion stimulation under these circumstances (relative to the driver). This, in turn, should increase the likelihood of a neural mismatch and motion sickness.
According to Stoffregen and Riccio (1991), most sensory conflict theories do not generate readily testable hypotheses. However, a more recent variant of sensory conflict theory does allow for direct testing. According to Hettinger and others (Hettinger et al., 1990; Hettinger and Riccio, 1992), visually induced illusions of self-motion (vection)1 are a necessary prerequisite for certain types of motion sickness (such as visually induced motion sickness or VIMS). Put simply, they argue that the key factor which differentiates sick (from well) users during VR is whether they experience an illusory self-motion (or not). If (as they propose) this vection represents a potentially provocative sensory conflict, then sensory rearrangement theory suggests that the severity of their sickness should also increase with the strength of the vection experience. We will discuss the support for these vection based hypotheses of motion sickness below.
Consistent with this hypothesis, Hettinger et al. (1990) found that VIMS was much more likely to occur during visually induced illusions of self-motion. In their fixed-based flight simulation study, 10 of their 15 participants reported experiencing vection. While 8 of these 10 participants eventually became sick (i.e., 80%), only one of the “no vection” participants experienced any sickness (i.e., 20%). Based on these findings, they concluded that VIMS is unlikely to occur without vection. Ji et al. (2009) however disagree. In one of their experiments, they presented observers with centrally and peripherally viewed patterns moving in opposite directions, but at the same speed. Even though these ambiguous motion displays were reported to completely suppress vection, they were still found to reliably generate VIMS (and optokinetic nystagmus). However, some caution should be used when interpreting the findings of this study. Nooij et al. (2017) were unable to completely suppress vection using the same display manipulation as Ji et al. (2009). Thus, it is conceivable that the VIMS observed in the Ji et al. (2009) study could still have been produced by unreported vection.
While Hettinger et al. (1990) did not explicitly propose a linear scaling relationship between vection strength and sickness severity, most VIMS studies have examined this possibility. To date, the evidence for such a relationship is mixed. Consistent with expectations based on sensory rearrangement theory, many studies have reported positive linear relationships between vection strength and VIMS (e.g., Hettinger et al., 1990; Flanagan et al., 2002; Smart et al., 2002; Bonato et al., 2004, 2005, 2008; Diels et al., 2007; Palmisano et al., 2007; Nooij et al., 2017, 2018; Clifton and Palmisano, 2019; Risi and Palmisano, 2019; Pöhlmann et al., 2021). However, other studies have found either non-significant or negative linear relationships between vection strength and VIMS (Webb and Griffin, 2002, 2003; Lawson, 2005; Bonato et al., 2008; Ji et al., 2009; Chen et al., 2011; Golding et al., 2012; Keshavarz et al., 2014; Riecke and Jordan, 2015; Gavgani et al., 2017; Palmisano and Riecke, 2018; Kuiper et al., 2019 – please see Keshavarz et al., 2015 for a review of this literature).
Only a few studies have examined possible relationships between vection and cybersickness during HMD-based VR. In one of the earlier studies, Palmisano et al. (2017) had HMD users make continuous left-right head-movements with their virtual environment being updated in either an ecological or non-ecological direction based on these tracked movements. Under the latter (maximum sensory conflict) condition, the authors reported a negative relationship between vection strength and cybersickness (i.e., stronger vection in their study was associated with reduced cybersickness). By contrast, Risi and Palmisano (2019) reported that stronger vection in their study was associated with increased cybersickness, whereas Teixeira and Palmisano (2021) failed to find a significant association between vection strength and cybersickness severity. While the experimental conditions and activities were quite different in each of these studies, their conflicting findings clearly demonstrate that cybersickness severity does not always increase with the reported strength of vection. Instead, they suggest that if there is a relationship between vection and cybersickness, then it clearly must be a complex one.
Experiences of vection were likely to have been quite different in the VIMS/cybersickness studies described above. Not only would they have differed in terms of the types of self-motion being simulated (e.g., linear or rotary, accelerating or constant velocity, self-generated via controller motions or passively viewed, etc.), but also in terms of the strength of the vection that they induced (ranging from weak/intermittent to strong/fully saturated) (Palmisano et al., 2015). However, reviews of this research have not taken these likely differences in vection type and strength into account. That could potentially explain why such different (including null) relationships have been reported between vection and VIMS/cybersickness in past studies.
One aspect of vection that has thus far been neglected, is whether the experience of self-motion is expected (or not). Past research has shown that vection is more likely, and more compelling, when the illusory self-motion is expected, anticipated, or primed (e.g., Andersen and Braunstien, 1985; Palmisano and Chan, 2004; Palmisano and Riecke, 2018). Since discrepancies between expected and sensed self-motion are thought to be provocative for motion sickness (Reason, 1978), this suggests that unexpected experiences of vection should be particularly provocative for cybersickness. However, to date, the specific effects of unexpected vection on HMD-induced cybersickness have not been examined.
According to Reason’s (1978) sensory rearrangement theory, motion sickness is caused by neural mismatches between expected and currently sensed motion (see also Oman, 1982, 1990; Bles et al., 1998). However, only a few studies have directly examined the possible link between expectations and motion sickness (Griffin and Newman, 2004; Perrin et al., 2013; Wada et al., 2018). For example, Kuiper et al. (2020) found that auditory cues about future motion direction significantly reduced the sickness induced by a physically moving sled. They also found that this sickness was reduced during more (as opposed to less) predictable sled motion conditions. Another study by Feenstra et al. (2011) found that motion sickness could be reduced in a 6 degrees of freedom motion simulator, when participants were provided with anticipatory visual cues about the physical motion. These findings suggest that being able to anticipate upcoming motion does provide some benefits in terms of reducing the likelihood of motion sickness and/or its symptom severity.
A number of studies have indirectly assessed the role of expectations in motion sickness by studying the driver/passenger effect. Passengers are significantly more likely than drivers to become sick during actual vehicular motion (e.g., Turner and Griffin, 1999). Such effects are particularly apparent on public transport (e.g., bus travel). Passengers who cannot see the road ahead experience greater sickness, likely due to their reduced capacity for predicting the consequences of their self-motion in the absence of optic flow (Turner and Griffin, 1999). The driver/passenger effect has also been reported in driving simulation studies (Rolnick and Lubow, 1991; Dong et al., 2011). When both drivers and passengers only experience simulated movement, those who are in control of the visual simulation are less likely to become sick. Such differences in sickness cannot be explained based on visual motion alone (as this should be very similar–see Chang et al., 2021). To date, virtual driver/passenger effects have been reported both in large screen fixed-base driving simulator studies and (more recently) in HMD-VR studies (e.g., Rolnick and Lubow, 1991; Stanney and Hash, 1998; Seay et al., 2002; Sharples et al., 2008; Dong et al., 2011; Curry et al., 2020).
According to Reason’s (1978) sensory rearrangement theory, driver/passenger effects occur because it is harder for passengers to select the appropriate expected pattern of motion stimulation - since they are not responsible for generating the (real/simulated) vehicular motion (speeding it up, slowing it down and turning). The theory therefore predicts that they should be more likely to become sick compared to drivers (who are in active control of both the vehicle’s motion and their multisensory stimulation - Oman, 1982; Chang et al., 2021). However, it should be noted that driver/passenger effects could also be explained by the postural instability theory of motion sickness. As they control their vehicular motion, drivers are able to anticipate the forces that will act on their body and plan the postural adjustments needed to maintain stability (Dong et al., 2011; Stoffregen et al., 2017). Passengers will, however, have a reduced ability to anticipate such changes in motion, and as a result (in the real world) their postural adjustments will be less tuned to situational changes in the vehicle’s motion. This will place them at a greater risk of developing motion sickness (Dong et al., 2011).2
In this exploratory study, we will (repeatedly) assess the vection and cybersickness experienced by our participants as they actively control their self-motions during HMD VR. To our knowledge, no previous study has examined the effects of unexpected vection on cybersickness during HMD VR. Vection was not even checked in most simulation studies examining the effects of expectancy and control on motion sickness. However, as these studies presented first person driving games on large screens (Dong et al., 2011; Chang et al., 2021), or used HMD VR (Curry et al., 2020), they should have induced compelling experiences of vection (since global patterns of optical flow were used to simulate the vehicular movement). As such, we aim to provide the first exploratory study assessing the impact of the nature of the vection experience in active HMD-VR and its relation to cybersickness. Specifically, we aim to see whether experiences of unexpected vection and/or a perceived loss of control are more likely to precede cybersickness than expected/controlled motion in a naturalistic VR gameplay setting. Based on the findings of these past studies, and the widely held belief that vection contributes to motion sickness, we predict that unexpected vection might be particularly provocative for cybersickness. We hypothesise that the participants in our study who become sick will be more likely to report unexpected vection and a perceived loss of control of their self-motion (compared to those who remained well). For these sick participants, we also predict that there will be a significant positive relationship between the strength of their unexpected vection and the severity of their cybersickness.
The study examined 30 participants (15 males and 15 females; Age = 25.9 years ± 6.5 years), who were recruited from the University of Wollongong (UOW) and the general population. These participants all had normal or corrected-to-normal vision and no self-reported visual, vestibular, or neurological impairments. All reported feeling well at the start of the experiment. The study was approved in advance by the UOW Ethics Committee, and each participant provided informed written consent prior to participating in the study.
Exposure to the virtual environment was delivered via an Oculus Rift CV1 head-mounted display (HMD), two Oculus Touch (hand) controllers, and two infrared tracking cameras (for monitoring head and hand positions). The HMD had a resolution of 1,080 × 1,200 pixels for each eye and a refresh rate of 90 Hz using organic light-emitting diode (OLED) technology. The virtual environment was generated by a Microsoft Windows 10 Dell Precision 5820 computer, which contained an NVidia GeForce GTX1080 graphics card with the latest stable driver software installed and an Intel 7th generation CPU. The game software used in this study was “Mission: ISS” (https://www.oculus.com/experiences/rift/1178419975552187/?locale=en_US). Participants were exposed to the game’s tutorial section, which simulated first-person exposure to micro-gravity inside a virtual model of the International Space Station. Within the parameters of the tutorial participants learned to move through the space station via “thrusting” (pushing the left joystick in the direction of their desired body movement and then accelerating in that direction) and by pulling themselves along the space station’s interior (using the Oculus Touch hand controllers to first grab, and then release, handles and other protrusions). As the experience and control of micro-gravity locomotion was alien to participants, it was expected that this software might be more likely to induce unexpected vection and cause participants to perceive a loss of control in their self-motion.
Directly before and after HMD VR exposure, cybersickness symptomology was measured using a 16-item version of Kennedy et al.’s (1993) Simulator Sickness Questionnaire (SSQ). Verbal ratings of cybersickness severity were also measured every 2 minutes during HMD VR exposure using the Fast Motion Sickness (FMS) Scale (from 0 = “no sickness” to 20 = “frank sickness” ‒ see Keshavarz and Hecht, 2011).3
Vection strength was rated verbally on a scale (from 0 = “no vection” to 10 = “strong vection”) every 2 minutes during exposure: “How strong is your feeling of whole body movement relative to the virtual environment on a scale of 0–10?” We also obtained an overall vection strength rating at the end of the trial (“How strong was your feeling of whole body movement relative to the virtual environment?” on the same 0–10 scale). In addition, at the end of their exposure to HMD VR, participants were also quizzed about the nature of their experience of vection. If they had reported experiencing sickness, they were asked:
1. “Did your feelings of being in control of your perceived body movement change prior to sickness?”
2. “Was your perceived body movement more or less expected/anticipated prior to sickness?”
3. “Is there anything else you wanted to add? Do you have any insights about why you think you became sick?”
Alternatively, if they reported remaining well throughout the HMD VR session, they were instead asked:
1. “Did you feel in control of your perceived body movement during the simulation?”
2. “Was your perceived body movement expected/anticipated during the simulation?”
3. “Is there anything else you wanted to add?”
Participants’ responses about their perceived body movement were double-checked during debriefing at the end of the experiment. This was to see whether participants were referring to whole body self-motions relative to the virtual environment (rather than the motions of their various limbs or their postural sway while standing in place during HMD VR).
Participants first completed a demographics, VR and Gaming History sheet. They were next given an information sheet that described the experiment, which they were asked to sign to indicate their consent. Visually induced illusions of self-motion were verbally described to participants before the study by the experimenter with reference to both the “train illusion” and the “traffic light illusion”. Linear and circular vection in standing and seated observers were also described in the information sheet. In addition, both types of vection were also quickly demonstrated to participants at the beginning of the experiment (when they were instructed on how to use the controls).
Directly before their exposure to HMD VR, participants completed the pre-exposure sections of the SSQ to provide a baseline measure of their current sickness levels. They then donned the Oculus CV1 HMD and ran through the tutorial section of “Mission: ISS” either for 14 min, or until they responded “yes” to the question: “Do you feel sick?” During the tutorial, participants actively explored the space station via “thrusting” (pushing the joystick in the direction of the desired locomotion and then accelerating in space) and by pulling themselves via the hand controllers along the space station’s interior while instructed to physically stand in place (in relation to the laboratory floor). Cybersickness severity (FMS) and vection strength measures were taken every 2 minutes during each trial. Directly after leaving HMD VR, their post-exposure cybersickness symptomology was then assessed using the SSQ and participants also provided an overall rating of vection strength for the trial. Finally, they verbally responded to our three exploratory questions about the nature of their experiences of vection during HMD VR.
Data from all 30 participants (15 females, 15 males) are included in the analyses below. Assumption testing was performed as appropriate for all analyses4 and post-hoc power estimations are included throughout the results section.5
To check on the success of our classification of participants into sick and well groups, we conducted an independent samples t-test on the average FMS scores for these two groups (one of our two sickness severity measures). As the assumption of normality was violated for our other sickness severity measure (the SSQ Total scores), a Yuen’s trimmed means test was conducted (bootstrapped at 1,000 samples) to assess the difference between sick and well groups on these post-pre SSQ-T scores.
We explored the possible relationships between vection and sickness a number of different ways. We initially used a Pearson’s chi-square test of contingencies to assess whether experiences of perceived loss of control/unexpected vection were related to the likelihood of developing cybersickness [Analyses were conducted with IBM SPSS Statistics, with significance level set at alpha = 0.05]. We also performed an independent samples t-test to compare the average vection strength ratings for sick and well participants. Then a linear mixed model (jamovi 1.6.23, GAMLj package) was used to test our hypothesis that there would be a positive linear relationship between vection strength and cybersickness severity for sick participants. To investigate whether a non-linear model might provide more predictive power, we also used a Pascal distribution model (jamovi 1.6.23, GAMLj package) in our follow up analysis. Finally, we used random forest classification with JASP 0.14.1 (see the r package randomForest for more details: https://cran.r-project.org/web/packages/randomForest/randomForest.pdf) to determine whether machine learning methods would allow us to predict a participant’s Sick/Well group status based only on their vection type (expected/unexpected) and their maximum vection strength rating.6
Finally, we ran generalised mixed model analyses (jamovi 1.6.23, GAMLj package) to explore how vection strength and cybersickness severity ratings changed over time. We also used a Pearson correlation to look for possible relationships between vection strength and premature dropout times (due to sickness).
Participants were classified as either being “sick” or “well” based on their answers to the question: “Do you feel sick?” Seventeen of them responded “yes” to this question and the remaining 13 responded “no”. The SSQ’s three sub-scores were used to assess their nausea (SSQ-N), disorientation (SSQ-D) and oculomotor (SSQ-O) symptoms. To examine the changes in each of these symptoms over the course of the HMD VR exposure, we subtracted each participant’s pre-exposure sub-scores from their post-exposure sub-scores (Figure 1). As expected for HMD VR, we found that these post-pre scores were higher on average for the SSQ-D (M = 68.21, SD = 54.51) than for the SSQ-N (M = 48.65, SD = 33.27) and the SSQ-O (M = 37.142, SD = 29.14).
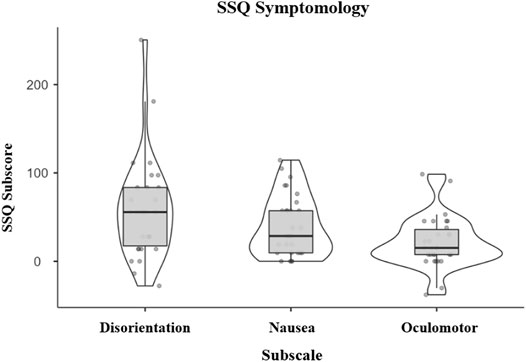
FIGURE 1. Post-pre changes in SSQ-D (Disorientation), SSQ-N (Nausea), and SSQ-O (Oculomotor) sub-scores (for all participants).
To check on the success of our classification of participants into “sick” and “well” groups, we conducted an independent samples t-test on the average FMS ratings for the two groups. As expected, average FMS ratings were significantly higher for the 17 “sick” participants (M = 6.42, SD = 3.78) compared to the 13 “well” participants (M = 2.12, SD = 1.71, t(29) = 3.81, p < 0.001, d = 1.40, 1-β = 0.96). As the assumption of normality in our sample was violated, Yuen’s trimmed means test was conducted bootstrapped at 1,000 samples to assess the difference between “sick” and “well” groups’ post-pre SSQ-T scores. The “sick” participants were found to have significantly higher post-pre SSQ-T scores (M = 76.12, SD = 39.73) compared to the “well” participants (M = 29.06, SD = 18.83, t(17.6) = 3.64, p = 0.001, ξ = 7.16, 1-β = 0.97).
Of our 17 “sick” participants, 15 indicated that they had also experienced unexpected vection during HMD VR. By contrast, of our 13 “well” participants, only 4 indicated that they had experienced unexpected vection. We used a Pearson’s chi-square test of contingencies (with α = 0.05) to assess whether experiences of unexpected vection were related to the likelihood of developing cybersickness. This test was found to be statistically significant (χ2 (1) = 30) = 10.48, p = 0.001, 1-β = 0.90) – with the association between unexpected vection and the incidence of cybersickness being large (ϕ = 0.59). As illustrated in Figure 2, participants who reported unexpected vection were significantly more likely to also report becoming sick (compared to participants who always reported that their vection was expected).
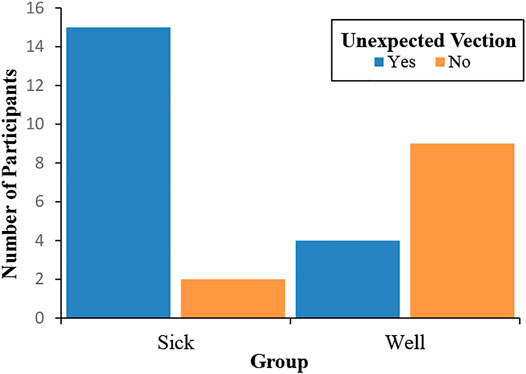
FIGURE 2. Numbers of “sick” and “well” participants who did (and did not) experience unexpected vection during HMD VR.
Of our 17 “sick” participants, 16 reported they had also experienced a perceived loss of control prior to sickness during HMD VR. By contrast, of our 13 “well” participants, only 5 reported that they had experienced a perceived loss of control. We used a Pearson’s chi-square test of contingencies (with α = 0.05) to assess whether such experiences were related to the likelihood of developing cybersickness. This test was found to be statistically significant (χ2 (1) = 10.87, p = 0.001, 1-β = 0.90) – with the association between perceived loss of control and cybersickness being large (ϕ = 0.6). As illustrated in Figure 3, participants who reported a perceived loss of control were significantly more likely to also report becoming sick (compared to participants who always felt that they were in control of their perceived movement).
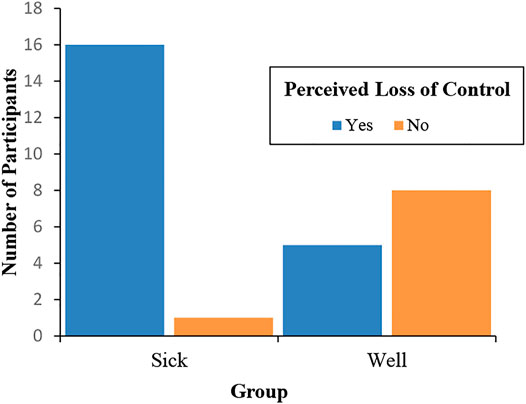
FIGURE 3. Numbers of “sick” and “well” participants who did (and did not) experience a perceived loss of control during HMD VR.
We used Pearson’s chi square test of contingencies (with α = 0.05) to assess whether experiences of unexpected vection were related to participant perceptions of control. This test was found to be statistically significant (χ2 (1) = 9.34, p = 0.002, 1-β = 0.87) – with the association between unexpected vection and perceived loss of control being large (ϕ = 0.56). As illustrated in Figure 4, participants who reported unexpected vection were significantly more likely to also report a perceived loss of control (compared to participants who always reported their vection was expected).
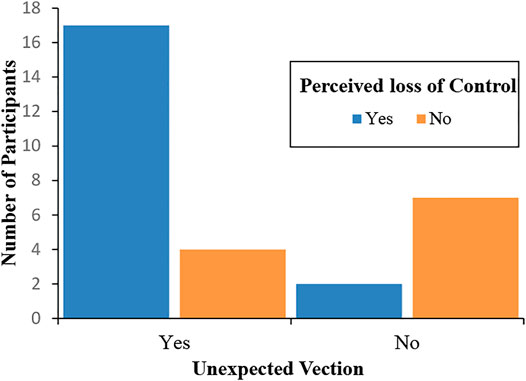
FIGURE 4. Shows the associations between vection type and perceived control. Most participants who experienced unexpected vection also experienced a perceived loss of control.
We initially performed an independent samples t-test to compare the average vection strength ratings of our “sick” and “well” participants. The 17 “sick” participants (M = 7.39, SD = 2.13) did not report significantly stronger experiences of vection compared to the 13 “well” participants (M = 6.79, SD = 1.73), t(29) = 0.83, p = 0.41, d = 0.31. Thus, these groups did not appear to differ in terms of the average strength of their vection. Rather, they differed primarily in terms of types of vection that they experienced (whether it was expected or unexpected - see Section 3.2.1).
We next used a linear mixed model to test our hypothesis that there would be a positive relationship between vection strength and cybersickness severity for the “sick” participants. Cybersickness severity (as measured by the FMS) was modelled in terms of the reported vection strength (VectionSTR), the participants’ sickness grouping (Sick/Well) and their interaction as fixed effects (with random intercepts across participants):
Compared to models with random slopes, the above model had lower Akaike’s Information Criteria (AIC) and Bayesian Information Criteria (BIC). This revealed a significant interaction between VectionSTR and Sick/Well, F(1,195) = 18.32, p < 0.001). Thus, the main effects of Sick/Well and VectionSTR on cybersickness severity were not investigated further. Simple effects confirmed that there was a stronger positive linear relationship between VectionSTR and cybersickness severity for those in the “sick” group (F(1,204) = 90.81, p < 0.001, coefficient = 1.368) compared to the “well” group (where the relationship only just reached significance - F(1,204) = 4.18, p = 0.042, coefficient = 0.383, note: this relationship would not have reached significance with Bonferroni correction) (Figure 5). Indeed, the coefficients indicate that the estimated influence of vection strength on cybersickness was 3.57 times larger in the “sick” group than in the “well” group.
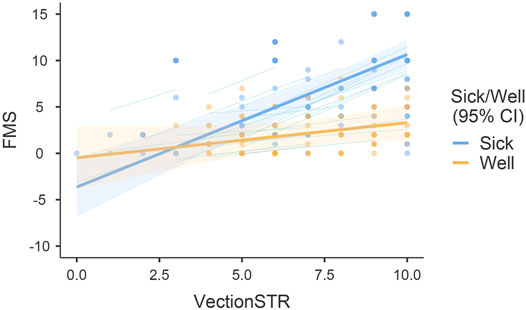
FIGURE 5. Modelled linear relationships between vection strength (VectionSTR) and cybersickness severity (FMS) for the “sick” and “well” groups.
To investigate whether a non-linear model might provide more predictive power, we used a Pascal distribution model in our follow up analysis. Cybersickness severity (as measured by the FMS) was again modelled in terms of the reported vection strength (VectionSTR), the participants’ sickness grouping (Sick/Well) and their interaction as fixed effects (with random intercepts across participants):
Based on the Bayesian information criterion, this non-linear model was superior to the linear model described in Section 3.3.1 (with a BIC of 907.092 as opposed to 1,027.058). As illustrated in Figure 6, this revealed a significant interaction between VectionSTR and Sick/Well grouping, χ2 (1) = 6.967, p = 0.008. Thus, the main effects of Sick/Well grouping and vectionSTR on FMS were not investigated further. The simple effects of vectionSTR, and their effect sizes, confirmed a stronger positive relationship between VectionSTR and cybersickness severity for those in the “sick” group (χ2 (1) = 89.2, p < 0.001, estimate = 0.427, very large effect size φ = 0.89) compared to the “well” group (χ2 (1) = 13.9, p < 0.001, estimate = 0.227, medium effect size φ = 0.39).
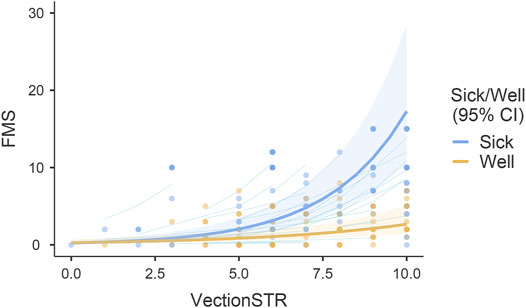
FIGURE 6. Modelled non-linear (exponential) relationships between vection strength (VectionSTR) and cybersickness severity (FMS) as a function of sick/well grouping.
Finally, we used random forest classification to assess whether machine learning methods would allow us to predict a participant’s Sick/Well group status based only on their vection type (expected/unexpected) and their maximum vection strength rating (training set 50%, test set 50%, 50 trees). The evaluation metrics revealed that our model performed strongly (Table 1). Its prediction accuracy was found to be very high at 80% (AUC = 0.857) – based solely on these two vection-based predictor variables. Accuracy and node purity indicated that unexpected vection was much more important than vection strength in predicting the Sick/Well group membership (Table 2). Please see additional details about the model’s performance in Table 3 and Figure 7.
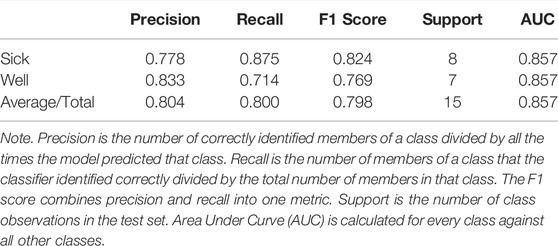
TABLE 1. Evaluation metrics.
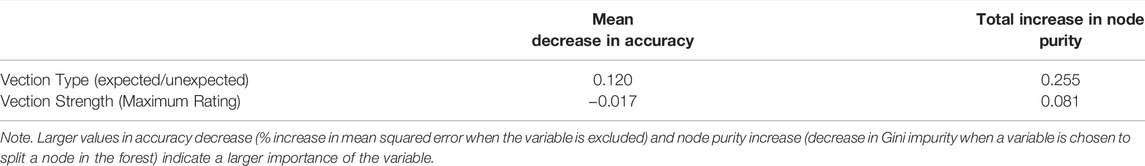
TABLE 2. Variable importance.
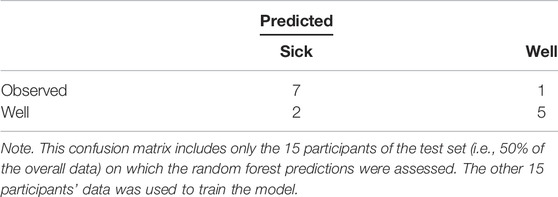
TABLE 3. Confusion matrix between predicted and observed group in the test set.
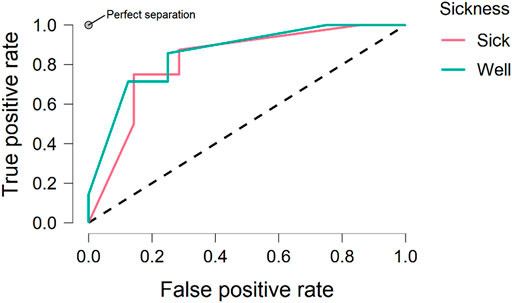
FIGURE 7. Receiver operating curve (ROC) plots showing the performance of our vection-based model at all classification thresholds in terms of predicting Sick/Well group membership.
After investigating the effects of vection type and strength on cybersickness for “sick” and “well” participants, we wanted to further understand how vection and cybersickness both developed/evolved over time. We were especially interested in understanding how changes in vection strength over the VR exposure were related to participant dropout times. To be consistent with the previous analysis, and to minimise the BIC and AIC, we used generalised mixed models with Pascal distributions and random intercepts.
We ran a generalised mixed model to investigate how vection strength (vectionSTR) changed over time. In this model, time in trial (Time), participants’ sickness grouping (Sick/Well) and their interaction were entered as fixed effects (with a random intercept per participant):
As can be seen in Figure 8 there was a significant effect of Time on vection strength, χ2 (1) = 17.2132, p < 0.001. Consistent with the statistical analyses reported above, the effect of Sick/Well grouping on (general) vection strength was again not significant.
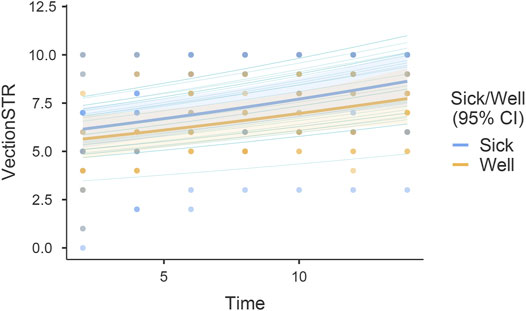
FIGURE 8. Shows vection strength ratings (VectionSTR) as a function of time in trial (Time) and participant Sick/Well grouping.
We also ran a generalised mixed model to investigate how cybersickness severity (FMS) changed over time. In this model, time in trial (Time), participants’ sickness grouping (Sick/Well) and their interaction were entered as fixed effects (with a random intercept per participant):
As illustrated in Figure 9, we observed a significant interaction between Time and Sick/Well grouping on cybersickness severity, χ2 (1) = 5.05, p < 0.025. Simple effects confirmed that there was a much stronger positive relationship between Time and cybersickness severity for the “sick” group (χ2 (1) = 154.5, p < 0.001, estimate = 0.1158) compared to the “well” group (χ2 (1) = 14.6, p < 0.001, estimate = 0.0698).
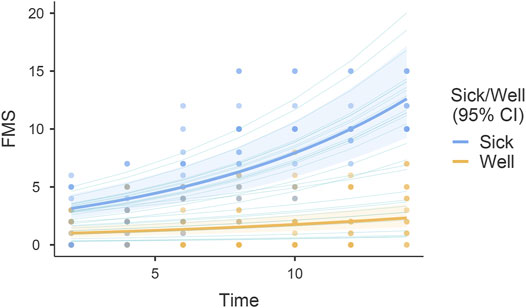
FIGURE 9. Shows cybersickness severity (FMS) as a function of time in trial (Time) and participant Sick/Well grouping.
As an additional exploratory analysis, we used a Pearson correlation to examine the possible relationship between vection strength and premature dropout times (due to sickness). We first calculated the change in vection strength across the entire HMD VR exposure (until premature dropout due to sickness). We found a significant positive correlation between our “sick” participants’ vection change scores and their premature dropout times (r(13) = 0.62, p = 0.009, 1-β = 0.62). Specifically, we found that “sick” participants who dropped out later in the session were more likely to experience larger changes in vection over the course of their HMD VR exposure. However, with the very stringent Bonferroni correction, the p-value would be 0.08 so this finding needs to be interpreted with caution.
This study examined the following hypotheses: 1) unexpected vection is a necessary prerequisite for cybersickness; and 2) cybersickness severity increases with the strength of this unexpected vection. Below we review the empirical support for each hypothesis. We also discuss additional exploratory analyses which examined how vection strength and cybersickness severity evolved together over time.
Consistent with the first hypothesis, we found that participants who became sick were significantly more likely to experience unexpected vection compared to those who remained well. Unexpected vection was reported by 88% of our “sick” participants, but only by 31% of our “well” participants. In addition, when our current data were subjected to machine learning analysis (random forest classification), we found that unexpected vection was the most important variable in predicting participant sickness status.
These results also appear to be highly compatible with the driver/passenger effects on motion sickness reported in past studies (with drivers–who have more knowledge about future self-motions, as they are in control of their self-motion–being less likely to report becoming sick). This led us to also check on whether our “sick” participants were more likely to report a perceived loss of control during HMD VR in the current study. A perceived loss of control was reported by 94% of our “sick” participants, but only by 38% of our “well” participants. These findings suggest that experiences of unexpected vection are highly likely to be accompanied by a perceived loss of control.
Consistent with our second hypothesis, we found evidence of significant positive relationships between vection strength and cybersickness severity. Many studies have searched for linear scaling relationships between vection and VIMS/cybersickness. Despite the mixed findings in the past literature, we found evidence of a significant positive linear relationships between vection strength and cybersickness severity in both our “sick” and “well” participants, with a much stronger effects seen for the “sick” participants. However, while there were monotonic relationships between vection strength and cybersickness severity, the best model fits for these relationships were found to be non-linear/exponential (as opposed to linear) in nature. Using non-linear (Pascal distribution) based fits in our models, we confirmed significant positive relationships between vection strength and cybersickness severity for both “sick” and “well” participants. Critically, the effect of vection strength was still substantially stronger for our “sick” (compared to our “well”) group participants.
As noted above (and shown in our chi squared analysis), participants who reported becoming sick almost exclusively experienced unexpected vection. This suggests a strong, but non-linear relationship between the strength of their (unexpected) vection and the severity of their cybersickness. While a significant relationship between vection strength and cybersickness severity was also found for our “well” participants–these effects appear to have been driven primarily by the 4 of these 13 participants who reported unexpected vection. As can be seen in Figure 6, cybersickness severity appeared to jump quite markedly after vection ratings exceed 5 out of 10. This suggests that the strength of the participant’s (unexpected) vection needed to reach a critical value before their sickness levels became problematic.
Interestingly, average vection strength did not differ significantly between the “sick” and “well” participant groups. This shows that it is not vection strength alone that determines the severity of the cybersickness experienced in HMD VR. The nature/type of vection experienced also appears to be important: that is, whether it is expected/unexpected and perceived to be under the user’s control or not. Crucially, this suggests that not all experiences of compelling vection should be provocative of cybersickness. However, increasing the strength of more provocative types of vection may increase the severity of cybersickness.
Machine learning classification using random forests showed that vection type and vection strength alone reliably predicted sick/well group status with a high level of accuracy. Moreover, this analysis revealed that vection type (expected/unexpected) was more important for correct predictions than reported vection strength. This finding opens exciting applications for predicting cybersickness during HMD VR. However, given the small size of our sample, we need to use caution and these findings would need to be corroborated with a larger dataset.
Proponents of the vection conflict theory often assume that: 1) vection is a necessary pre-requisite of cybersickness (Hettinger et al.’s, 1990 original hypothesis), or 2) there is a scaling relationship between vection strength and cybersickness severity (a modified variant of the vection conflict hypothesis, which has been tested by most studies examining VIMS and cybersickness). In the past, consistent support for these proposals has been difficult to find. The current findings provide potential explanations for how those mixed findings could have arisen. Past studies looked for positive linear relationships between vection strength and cybersickness severity. However, our results revealed positive monotonic relationships between vection strength and cybersickness severity that were best described by non-linear/exponential model fits. Furthermore, they showed evidence of a thresholding process–whereby the participants’ vection strength had to reach a certain critical level before significant increases in cybersickness severity were seen. Finally, our results showed that the type of vection (expected/unexpected) experienced also matters. That is, we found that unexpected vection appears to be particularly provocative for cybersickness. When taken together, these findings suggest that a certain critical amount of unexpected vection might be required to cause problematic levels of sickness (i.e., sufficient to cause them to leave/drop out of HMD VR). The existence of such a critical threshold appears to be somewhat compatible with Hettinger et al.’s (1990) original vection conflict theory.
While we have provided evidence of general relationships between vection strength and cybersickness severity, it is also important to understand how these user experiences change/develop over time. As expected (based on the findings of past studies - e.g., Seno et al., 2018), vection strength was found to increase with longer exposures to HMD VR. These increases in vection strength as a function of time were found to be similar in both “sick” and “well” participants (no interaction). Cybersickness severity was also found to increase in a similar fashion with time in trial–but more so for the “sick”, compared to the “well”, participants (note: these findings are compatible with those of several recent HMD VR studies - e.g., Risi and Palmisano, 2019; Clifton and Palmisano, 2019; Teixeira and Palmisano, 2021). The simplest interpretation of these findings is that the longer “sick” participants experienced (predominately) unexpected vection, the stronger this vection became and the more severe the cybersickness it caused. By contrast, our “well” group participants mostly experienced expected vection. Although the strength of this expected vection also increased over time, it had less effect on experiences of cybersickness.
An exploratory correlational analysis found that participants who dropped out later were more likely to experience larger changes in vection across their HMD VR exposure (compared to those who dropped out earlier). This finding may simply indicate that longer exposures to HMD VR allowed the participant’s vection strength to build up more. However, it may also reflect individual differences in their vection responding. Vection onset latencies can vary considerably across individuals, and in addition to this, the rate at which this vection builds can differ markedly (even when observers are presented with exactly the same vection stimulus - see Seno et al., 2017). “Sick” participants who dropped out later in our study could have had longer vection onsets and slower rates of vection increase (compared to “sick” participants who dropped out earlier in the session). These participants might have required much larger changes in (unexpected) vection strength to result in problematic levels of cybersickness. Even though some of our “well” participants also experienced large changes in vection, it appears that these changes were usually expected, and not linked to a perceived loss of control. As such, they appeared to have no significant bearing on the levels of cybersickness experienced–and therefore rarely led to participant dropouts.
Compelling vection is a common experience during HMD VR. While these illusions of self-motion have traditionally been seen as a problem to be avoided (in both theory and practice), they can often dramatically improve user experiences in HMD VR. For example, research suggests that vection can lead to greater feelings of presence and immersion within virtual environments (Riecke et al., 2006; Keshavarz et al., 2019). Indeed, compelling vection is often essential for effective first-person vehicle simulation during HMD VR. Thus, understanding the effects of vection on HMD user experiences is clearly of great importance for the further development of VR systems and applications.
The findings of the current study challenge the belief that compelling vection should be avoided in HMD VR. While they do provide evidence that certain types of vection are more strongly associated with incidence of cybersickness (namely unexpected vection and vection that results in a perceived loss of control), they also show that compelling vection can be induced in some individuals with no unpleasant consequences. As such, we propose that only unexpected vection should be avoided to minimise incidence of cybersickness. In practical terms, the findings of this study suggest that software designers should attempt to avoid inducing unexpected vection and aim to minimise perceived losses of control in self-motion situations.
The current findings also suggest that caution should be exercised when interpreting relationships between cybersickness and vection. Previously, support for a positive scaling relationship between vection strength and cybersickness severity has been inconsistent. However, these studies generally assumed that relationships between these two variables would be linear in nature. Instead, our findings suggest that non-linear models might be better at capturing the actual relationships between vection strength and cybersickness severity. This would also explain the mixed findings of previous studies. Future studies are therefore needed to rigorously examine the relationships between these two variables. If a clear link between specific vection types/experiences and cybersickness can be found, this will allow designers to freely explore the use of vection as a tool in future programming and design, opening further avenues to enhance presence, as well as the fidelity, realism and the quality of the sensory stimulation provided by HMD VR.
While the current findings appear promising, this was an exploratory study, and our findings were correlational in nature. We acknowledge that with our design there was a risk that expected/unexpected and perceived loss of control responses might have been influenced by demand characteristics. Vection type (expected or unexpected) was only assessed at the end of the VR exposure (either after 14 min or when they dropped out). Asking such questions then (as opposed to earlier) was aimed at reducing the influence of demand characteristics. However, this decision may have placed more demands on participant memory for this dependent measure.7 Studies are therefore still needed to test our hypotheses about the effects of unexpected and uncontrolled vection on cybersickness using deliberate experimental manipulations. For example, future studies could experimentally manipulate controller gain during simulated HMD VR driving, or verbally prime participants to expect a direction of self-motion either consistent/inconsistent with the visual simulation, or alter the velocity of the user’s vection at pre-determined and timestamped intervals [to examine the effects of unexpected (versus expected) vection on cybersickness directly]. It may also be the case that our findings (of relationships between vection strength and type and sickness) are restricted to HMD VR simulations of self-motion in microgravity. As such, their generalizability to other HMD VR simulations also needs to be demonstrated in future studies.
In the current study, participants who reported unexpected vection were significantly more likely to also report a perceived loss of control (compared to participants who always reported that their vection was expected). While there is likely a relationship between these two experiences/perceptions, future studies should try to tease apart their independent contributions to cybersickness. Previously, there have been reported differences in cybersickness during active and passive VR exposures to the same applications/optic flow (Rebenitsch and Owen, 2016). Importantly, such differences in sickness cannot be explained based on visual motion alone.
Finally, if cybersickness is exacerbated by unexpected vection and/or a perceived loss of control (as the current data points towards), we would also expect physiological reactions to these events. Thus, we recommend future studies also try to obtain independent objective evidence that the vection was indeed unexpected (e.g., using physiological indices such as skin conductance, eye movements, heart rate variability or even EEG) or indices of postural sway to indicate perceived loss of control. Ideally, some or all of these proposed objective vection indicators should be obtained in future studies (although traditional subjective vection measures will still be required for confirmation). While we only examined hypotheses related to vection conflict theory, our results could conceivably also be explained based on postural instability theory. It was possible that reports of vection/unexpected vection in our study were actually the conscious experiences associated with changes in postural activity. Thus, the sickness experienced might have actually been caused by increases in participant postural instability. However, since their postural responses were not recorded during these HMD VR exposures, this possibility will need to be assessed in a future study.
This study is the first to investigate the effects of unexpected vection on cybersickness when playing a commercially available HMD VR game. We found that: 1) “sick” participants were significantly more likely to experience both unexpected vection and a perceived loss of control (compared to participants who reported that they remained well); and 2) our vection strength and vection type predictors were able to explain cybersickness incidence with an accuracy of 83.3%. While average vection strength was not found to differ significantly for “sick” and “well” groups, cybersickness severity was found to scale with vection strength–especially for the “sick” group. These findings show that compelling vection alone is not sufficient as a prerequisite of cybersickness. We conclude that unexpected vection and a perceived loss of control increase the likelihood and severity of cybersickness. Since vection is a prevalent (and in many cases a desirable) aspect of HMD-VR, further research is needed to explore this unexpected vection hypothesis in greater depth.
The raw data supporting the conclusions of this article will be made available by the authors, without undue reservation.
The studies involving human participants were reviewed and approved by University of Wollongong Human Ethics Committee. The patients/participants provided their written informed consent to participate in this study.
JT, SM and SP formed the original conceptualization for the study. JT collected the data. JT, SM and SP analysed the data, interpreted the results and wrote the article.
This research was supported by an Australian Research Council (ARC) Discovery Project (DP210101475) to SP.
The authors declare that the research was conducted in the absence of any commercial or financial relationships that could be construed as a potential conflict of interest.
All claims expressed in this article are solely those of the authors and do not necessarily represent those of their affiliated organizations, or those of the publisher, the editors and the reviewers. Any product that may be evaluated in this article, or claim that may be made by its manufacturer, is not guaranteed or endorsed by the publisher.
1Note, Palmisano et al. (2015) identified four main definitions of vection in the literature: 1) Vection is a visual illusion of self-motion in a stationary observer; 2) Vection is an illusion of self-motion; 3) Vection is a visually mediated perception of self-motion (real or illusory); 4) Vection is a conscious subjective experience of self-motion (real or illusory). In this paper, we chose to define vection as an illusion because A) that is how Hettinger and colleagues defined vection (Hettinger et al., 1990; Hettinger and Riccio, 1992) and our study aimed to explore a novel version of their hypothesis; B) that is the most commonly referred to definition of vection in the literature. However, such a definition implies that vection is an unusual error or mistake. Definition #3 provides another way to describe our participants’ experiences of whole-body self-motion in the current study. By contrast to definitions #1 and #2, #3 (and #4) suggest that vection might be related to the critical processing involved in actually controlling self-motion (see Stoffregen and Bardy, 2001, as well as Palmisano et al., 2015 for further discussion).
2In a recent simulation study, Stoffregen et al. (2017) found that individuals with real-world driving experience became sick more rapidly than those without any experience when “driving” in Forza Motosport 3 (as expected based on sensory rearrangement theory). However, no group differences in sickness incidence or severity were found. Driving experience did affect head and torso movements just before sickness. Such movements also differed between “sick” and “well” participants. These findings appear to favor a postural instability explanation of motion sickness (at least for this study).
3It was possible that repeatedly asking these questions might have modestly reduced our participant’s sense of presence.
4The exploratory nature of this study warranted a large number of statistical analyses (9). While the p-values reported in this paper were not corrected for multiple comparisons, all that were interpreted as significant ranged from 0.001 to 0.002. Thus, they would have remained significant even if stringent Bonferroni correction had been applied. The only exceptions were: 1) the linear relationship between VectionSTR and cybersickness severity for the well group (linear-mixed model) with p = 0.42. However, we demonstrated that a non-linear model was more appropriate for our data; and 2) the Pearson correlation between vection change and drop out times with p = 0.009. For this test, we indicated that the finding needed to be interpreted with caution (note after stringent correction this test still indicated a tendency with p = 0.08).
5Power analysis is notoriously challenging for generalised mixed models and requires simulations that are beyond the scope of this study (which currently includes several sophisticated analysis methods). To increase the robustness of our mixed-model analyses, we used bootstrapping with 1,000 re-samples. Based on our sample size, a conventional t-test should be able to detect effect sizes of 0.94 or larger (with α = 0.05, 1-β = 0.8). However, mixed-effects analyses are more powerful than analyses based on conventional t and F tests (Judd et al., 2017; Brysbaert and Stevens, 2018) or chi-square analyses (Miller, Roe, Hu & Bell, 2020). Thus, our mixed models analyses should have been able to detect effect sizes less than 0.9.
6To be consistent with the previous analysis, and to minimise the BIC and AIC, we used generalised mixed models with Pascal distributions and random intercepts to investigate how vection and cybersickness both developed/evolved over time.
7Debriefing indicated that experiences of unexpected vection were often very salient (hard to forget). For example, it was common for participants reporting unexpected vection to say they had “stopped thrusting [or pulling] to avoid hitting a looming wall [ceiling or floor]”, but despite this, they were still on a collision course towards the surface (as they were simulated to be moving in a microgravity environment).
Andersen, G. J., and Braunstein, M. L. (1985). Induced Self-Motion in central Vision. J. Exp. Psychol. Hum. Perception Perform. 11 (2), 122–132. doi:10.1037/0096-1523.11.2.122
Bhagat, K. K., Liou, W.-K., and Chang, C.-Y. (2016). A Cost-Effective Interactive 3D Virtual Reality System Applied to Military Live Firing Training. Virtual Reality 20 (2), 127–140. doi:10.1007/s10055-016-0284-x
Bles, W., Bos, J. E., De Graaf, B., Groen, E., and Wertheim, A. H. (1998). Motion Sickness: Only One Provocative Conflict? Brain Res. Bull. 47 (5), 481–487. doi:10.1097/00019052-200002000-0000510.1016/s0361-9230(98)00115-4
Bonato, F., Bubka, A., and Alfieri, L. (2004). Display Color Affects Motion Sickness Symptoms in an Optokinetic Drum. Aviat Space Environ. Med. 75 (4), 306–311.
Bonato, F., Bubka, A., and Story, M. (2005). Rotation Direction Change Hastens Motion Sickness Onset in an Optokinetic Drum. Aviat Space Environ. Med. 76 (9), 823–827.
Bonato, F., Bubka, A., Palmisano, S., Phillip, D., and Moreno, G. (2008). Vection Change Exacerbates Simulator Sickness in Virtual Environments. Presence: Teleoperators and Virtual Environments 17 (3), 283–292. doi:10.1162/pres.17.3.283
Brysbaert, M., and Stevens, M. (2018). Power Analysis and Effect Size in Mixed Effects Models: A Tutorial. J. Cogn. 1 (1), 9. doi:10.5334/joc.10
Burns, J. A., Adkins, L. K., Dailey, S., and Klein, A. M. (2017). Simulators for Laryngeal and Airway Surgery. Otolaryngologic Clin. North America 50 (5), 903–922. doi:10.1016/j.otc.2017.05.003
Chang, C.-H., Pan, W.-W., Tseng, L.-Y., and Stoffregen, T. A. (2012). Postural Activity and Motion Sickness during Video Game Play in Children and Adults. Exp. Brain Res. 217 (2), 299–309. doi:10.1007/s00221-011-2993-4
Chang, C.-H., Stoffregen, T. A., Cheng, K. B., Lei, M. K., and Li, C.-C. (2020). Effects of Physical Driving Experience on Body Movement and Motion Sickness Among Passengers in a Virtual Vehicle. Exp. Brain Res. 239, 491–500. doi:10.1007/s00221-020-05940-6
Chang, C.-H., Stoffregen, T. A., Tseng, L.-Y., Lei, M. K., and Cheng, K. B. (2021). Control of a Virtual Vehicle Influences Postural Activity and Motion Sickness in Pre-adolescent Children. Hum. Move. Sci. 78, 102832. doi:10.1016/j.humov.2021.102832
Chen, D. J. Z., Chow, E. H. C., and So, R. H. Y. (2011). The Relationship between Spatial Velocity, Vection, and Visually Induced Motion Sickness: an Experimental Study. i-Perception 2 (4), 415. doi:10.1068/ic415
Clifton, J., and Palmisano, S. (2019). Effects of Steering Locomotion and Teleporting on Cybersickness and Presence in HMD-Based Virtual Reality. Virtual Reality 24, 453–468. doi:10.1007/s10055-019-00407-8
Curry, C., Li, R., Peterson, N., and Stoffregen, T. A. (2020). Cybersickness in Virtual Reality Head-Mounted Displays: Examining the Influence of Sex Differences and Vehicle Control. Int. J. Human-Computer Interaction 36 (12), 1161–1167. doi:10.1080/10447318.2020.1726108
Diels, C., Ukai, K., and Howarth, P. A. (2007). Visually Induced Motion Sickness with Radial Displays: Effects of Gaze Angle and Fixation. Aviat Space Environ. Med. 78 (7), 659–665.
Dong, X., Yoshida, K., and Stoffregen, T. A. (2011). Control of a Virtual Vehicle Influences Postural Activity and Motion Sickness. J. Exp. Psychol. Appl. 17 (2), 128–138. doi:10.1037/a0024097
Feenstra, P. J., Bos, J. E., and van Gent, R. N. H. W. (2011). A Visual Display Enhancing comfort by Counteracting Airsickness. Displays 32 (4), 194–200. doi:10.1016/j.displa.2010.11.002
Flanagan, M. B., May, J. G., and Dobie, T. G. (2002). Optokinetic Nystagmus, Vection, and Motion Sickness. Aviat Space Environ. Med. 73 (11), 1067–1073.
Golding, J. F., Doolan, K., Acharya, A., Tribak, M., and Gresty, M. A. (2012). Cognitive Cues and Visually Induced Motion Sickness. Aviat Space Environ. Med. 83 (5), 477–482. doi:10.3357/asem.3095.2012
Griffin, M. J., and Newman, M. M. (2004). Visual Field Effects on Motion Sickness in Cars. Aviat Space Environ. Med. 75 (9), 739–748.
Hettinger, L. J., Berbaum, K. S., Kennedy, R. S., Dunlap, W. P., and Nolan, M. D. (1990). Vection and Simulator Sickness. Mil. Psychol. 2 (3), 171–181. doi:10.1207/s15327876mp0203_4
Hettinger, L. J., and Riccio, G. E. (1992). Visually Induced Motion Sickness in Virtual Environments. Presence: Teleoperators & Virtual Environments 1 (3), 306–310. doi:10.1162/pres.1992.1.3.306
Ji, J. T. T., So, R. H. Y., and Cheung, R. T. F. (2009). Isolating the Effects of Vection and Optokinetic Nystagmus on Optokinetic Rotation-Induced Motion Sickness. Hum. Factors 51 (5), 739–751. doi:10.1177/0018720809349708
Judd, C. M., Westfall, J., and Kenny, D. A. (2017). Experiments with More Than One Random Factor: Designs, Analytic Models, and Statistical Power. Annu. Rev. Psychol. 68, 601–625. doi:10.1146/annurev-psych-122414-033702
Kennedy, R. S., Jones, M. B., Lilienthal, M. G., and Harm, D. L. (1994). Profile Analysis of After-Effects Experienced during Exposure to Several Virtual Reality Environments. AGARD-CP-Virtual Inter. Res. Appl. 5412, 1–9.
Kennedy, R. S., Lane, N. E., Berbaum, K. S., and Lilienthal, M. G. (1993). Simulator Sickness Questionnaire: An Enhanced Method for Quantifying Simulator Sickness. Int. J. Aviation Psychol. 3 (3), 203–220. doi:10.1207/s15327108ijap0303_3
Keshavarz, B., and Hecht, H. (2011). Validating an Efficient Method to Quantify Motion Sickness. Hum. Factors 53, 415–426. doi:10.1177/0018720811403736
Keshavarz, B., Hettinger, L. J., Vena, D., and Campos, J. L. (2014). Combined Effects of Auditory and Visual Cues on the Perception of Vection. Exp. Brain Res. 232 (3), 827–836. doi:10.1007/s00221-013-3793-9
Keshavarz, B., Philipp-Muller, A. E., Hemmerich, W., Riecke, B. E., and Campos, J. L. (2019). The Effect of Visual Motion Stimulus Characteristics on Vection and Visually Induced Motion Sickness. Displays 58, 71–81. doi:10.1016/j.displa.2018.07.005
Keshavarz, B., Riecke, B. E., Hettinger, L. J., and Campos, J. L. (2015). Vection and Visually Induced Motion Sickness: How Are They Related? Front. Psychol. 6 (APR). doi:10.3389/fpsyg.2015.00472
Kuiper, O. X., Bos, J. E., and Diels, C. (2019). Vection Does Not Necessitate Visually Induced Motion Sickness. Displays 58, 82–87. doi:10.1016/j.displa.2018.10.001
Kuiper, O. X., Bos, J. E., Schmidt, E. A., Diels, C., and Wolter, S. (2020). Knowing What's Coming: Unpredictable Motion Causes More Motion Sickness. Hum. Factors 62 (8), 1339–1348. doi:10.1177/0018720819876139
Lawson, B. D. (2005). “Exploiting the Illusion of Self-Motion (Vection) to Achieve a Feeling of ‘virtual Acceleration’ in an Immersive Display,” in Proceedings of the 11th International Conference on Human–Computer Interaction (Las Vegas, NV: HCI).1–10
Lawson, B. (2014). “Motion Sickness Symptomatology and Origins,” in Handbook of Virtual Environments: Design, Implementation, and Applications. Editors K. S. Hale, and K. M. Stanney (Boca Raton, FL: CRC Press, 532–587.
Lee, A. Y., Fried, M. P., and Gibber, M. (2017). Improving Rhinology Skills with Simulation. Otolaryngologic Clin. North America 50 (5), 893–901. doi:10.1016/j.otc.2017.05.002
Liu, X., Liu, Y., Zhu, X., An, M., and Hu, F. (2016). Virtual Reality Based Navigation Training for Astronaut Moving in a Simulated Space Station. Lecture Notes Comput. Sci., 416–423. doi:10.1007/978-3-319-39907-2_40
Mazloumi Gavgani, A., Hodgson, D. M., and Nalivaiko, E. (2017). Effects of Visual Flow Direction on Signs and Symptoms of Cybersickness. PloS one 12 (8), e0182790. doi:10.1371/journal.pone.0182790
Merhi, O., Faugloire, E., Flanagan, M., and Stoffregen, T. A. (2007). Motion Sickness, Console Video Games, and Head-Mounted Displays. Hum. Factors 49, 920–934. doi:10.1518/001872007X230262
Miller, M. L., Roe, D. J., Hu, C., and Bell, M. L. (2020). Power Difference in a χ2 Test vs Generalized Linear Mixed Model in the Presence of Missing Data - a Simulation Study. BMC Med. Res. Methodol. 20 (1), 50–12. doi:10.1186/s12874-020-00936-w
Nooij, S. A. E., Pretto, P., and Bülthoff, H. H. (2018). More Vection Means More Velocity Storage Activity: a Factor in Visually Induced Motion Sickness? Exp. Brain Res. 236, 3031–3041. doi:10.1007/s00221-018-5340-1
Nooij, S. A. E., Pretto, P., Oberfeld, D., Hecht, H., and Bülthoff, H. H. (2017). Vection Is the Main Contributor to Motion Sickness Induced by Visual Yaw Rotation: Implications for Conflict and Eye Movement Theories. PLoS One 12 (4), e0175305. doi:10.1371/journal.pone.0175305
Oman, C. M. (1982). A Heuristic Mathematical Model for the Dynamics of Sensory Conflict and Motion Sickness. Acta Oto-Laryngologica 94 (Suppl. 392), 4–44. doi:10.3109/00016488209108197
Oman, C. M. (1990). Motion Sickness: a Synthesis and Evaluation of the Sensory Conflict Theory. Can. J. Physiol. Pharmacol. 68 (2), 294–303. doi:10.1139/y90-044
Palmisano, S., Allison, R. S., and Kim, J. (2020). Cybersickness in Head-Mounted Displays Is Caused by Differences in the User's Virtual and Physical Head Pose. Front. Virtual Real. 1, 587698. doi:10.3389/frvir.2020.587698
Palmisano, S., Allison, R. S., Schira, M. M., and Barry, R. J. (2015). Future Challenges for Vection Research: Definitions, Functional Significance, Measures, and Neural Bases. Front. Psychol. 6 (193), 1–15. doi:10.3389/fpsyg.2015.00193
Palmisano, S., Bonato, F., Bubka, A., and Folder, J. (2007). Vertical Display Oscillation Effects on Forward Vection and Simulator Sickness. asem 78 (10), 951–956. doi:10.3357/asem.2079.2007
Palmisano, S., and Chan, A. Y. C. (2004). Jitter and Size Effects on Vection Are Immune to Experimental Instructions and Demands. Perception 33 (8), 987–1000. doi:10.1068/p5242
Palmisano, S., Mursic, R., and Kim, J. (2017). Vection and Cybersickness Generated by Head-And-Display Motion in the Oculus Rift. Displays 46, 1–8. doi:10.1016/j.displa.2016.11.001
Palmisano, S., and Riecke, B. E. (2018). The Search for Instantaneous Vection: An Oscillating Visual Prime Reduces Vection Onset Latency. PLoS One 13 (5), e0195886. doi:10.1371/journal.pone.0195886
Perrin, P., Lion, A., Bosser, G., Gauchard, G., and Meistelman, C. (2013). Motion Sickness in Rally Car Co-drivers. Aviation, Space Environ. Med. 84 (5), 473–477. doi:10.3357/asem.3523.2013
Pfandler, M., Lazarovici, M., Stefan, P., Wucherer, P., and Weigl, M. (2017). Virtual Reality-Based Simulators for Spine Surgery: A Systematic Review. Spine J. 17 (9), 1352–1363. doi:10.1016/j.spinee.2017.05.016
Pöhlmann, K. M. T., Föcker, J., Dickinson, P., Parke, A., and O’Hare, L. (2021). The Effect of Motion Direction and Eccentricity on Vection, VR Sickness and Head Movements in Virtual Reality. Multisens. Res. 34 (6), 623–662. doi:10.1163/22134808-bja10049
Reason, J. T. (1978). Motion Sickness Adaptation: a Neural Mismatch Model. J. R. Soc. Med. 71 (11), 819–829. doi:10.1177/014107687807101109
Rebenitsch, L., and Owen, C. (2016). Review on Cybersickness in Applications and Visual Displays. Virtual Reality 20 (2), 101–125. doi:10.1007/s10055-016-0285-9
Riecke, B. E., and Jordan, J. D. (2015). Comparing the Effectiveness of Different Displays in Enhancing Illusions of Self-Movement (Vection). Front. Psychol. 6, 713. doi:10.3389/fpsyg.2015.00713
Riecke, B. E., Schulte-Pelkum, J., Avraamides, M. N., Heyde, M. V. D., and Bülthoff, H. H. (2006). Cognitive Factors Can Influence Self-Motion Perception (Vection) in Virtual Reality. ACM Trans. Appl. Percept. 3 (3), 194–216. doi:10.1145/1166087.1166091
Risi, D., and Palmisano, S. (2019). Effects of Postural Stability, Active Control, Exposure Duration and Repeated Exposures on HMD Induced Cybersickness. Displays 60, 9–17. doi:10.1016/j.displa.2019.08.003
Rolnick, A., and Lubow, R. E. (1991). Why Is the Driver Rarely Motion Sick? the Role of Controllability in Motion Sickness. Ergonomics 34 (7), 867–879. doi:10.1080/00140139108964831
Seay, A. F., Krum, D. M., Hodges, L., and Ribarsky, W. (2002). “April). Simulator Sickness and Presence in a High Field-Of-View Virtual Environment,” in CHI'02 Extended Abstracts on Human Factors in Computing Systems, 784–785.
Seno, T., Murata, K., Fujii, Y., Kanaya, H., Ogawa, M., Tokunaga, K., et al. (2018). Vection Is Enhanced by Increased Exposure to Optic Flow. i-Perception 9 (3), 204166951877406–204166951877416. doi:10.1177/2041669518774069
Seno, T., Sawai, K.-i., Kanaya, H., Wakebe, T., Ogawa, M., Fujii, Y., et al. (2017). The Oscillating Potential Model of Visually Induced Vection. i-Perception 8 (6), 204166951774217. doi:10.1177/2041669517742176
Sharples, S., Cobb, S., Moody, A., and Wilson, J. R. (2008). Virtual Reality Induced Symptoms and Effects (VRISE): Comparison of Head Mounted Display (HMD), Desktop and Projection Display Systems. Displays 29 (2), 58–69. doi:10.1016/j.displa.2007.09.005
Smart, L. J., Stoffregen, T. A., and Bardy, B. G. (2002). Visually Induced Motion Sickness Predicted by Postural Instability. Hum. Factors 44 (3), 451–465. doi:10.1518/0018720024497745
Stanney, K. M., and Hash, P. (1998). Locus of User-Initiated Control in Virtual Environments: Influences on Cybersickness. Presence 7 (5), 447–459. doi:10.1162/105474698565848
Stoffregen, T. A., and Bardy, B. G. (2001). On Specification and the Senses. Behav. Brain Sci. 24 (2), 195–213. doi:10.1017/S0140525X01003946
Stoffregen, T. A., Chang, C.-H., Chen, F.-C., and Zeng, W.-J. (2017). Effects of Decades of Physical Driving on Body Movement and Motion Sickness during Virtual Driving. PLoS One 12 (11), e0187120. doi:10.1371/journal.pone.0187120
Stoffregen, T. A., and Riccio, G. E. (1991). An Ecological Critique of the Sensory Conflict Theory of Motion Sickness. Ecol. Psychol. 3 (3), 159–194. doi:10.1207/s15326969eco0303_1
Teixeira, J., and Palmisano, S. (2021). Effects of Dynamic Field-Of-View Restriction on Cybersickness and Presence in HMD-Based Virtual Reality. Virtual Reality 25, 433–445. doi:10.1007/s10055-020-00466-2
Turner, M., and Griffin, M. J. (1999). Motion Sickness in Public Road Transport: the Effect of Driver, Route and Vehicle. Ergonomics 42 (12), 1646–1664. doi:10.1080/001401399184730
Wada, T., Fujisawa, S., and Doi, S. (2018). Analysis of Driver's Head Tilt Using a Mathematical Model of Motion Sickness. Int. J. Ind. Ergon. 63, 89–97. doi:10.1016/j.ergon.2016.11.003
Webb, N. A., and Griffin, M. J. (2003). Eye Movement, Vection, and Motion Sickness with Foveal and Peripheral Vision. Aviat Space Environ. Med. 74 (6), 622–625.
Keywords: cybersickness, motion sickness, virtual reality, head-mounted display (HMD), vection
Citation: Teixeira J, Miellet S and Palmisano S (2022) Unexpected Vection Exacerbates Cybersickness During HMD-Based Virtual Reality. Front. Virtual Real. 3:860919. doi: 10.3389/frvir.2022.860919
Received: 24 January 2022; Accepted: 24 March 2022;
Published: 13 April 2022.
Edited by:
Diego Vilela Monteiro, Birmingham City University, United KingdomReviewed by:
Thomas A. Stoffregen, University of Minnesota Twin Cities, United StatesCopyright © 2022 Teixeira, Miellet and Palmisano. This is an open-access article distributed under the terms of the Creative Commons Attribution License (CC BY). The use, distribution or reproduction in other forums is permitted, provided the original author(s) and the copyright owner(s) are credited and that the original publication in this journal is cited, in accordance with accepted academic practice. No use, distribution or reproduction is permitted which does not comply with these terms.
*Correspondence: Stephen Palmisano, c3RlcGhlbnBAdW93LmVkdS5hdQ==
Disclaimer: All claims expressed in this article are solely those of the authors and do not necessarily represent those of their affiliated organizations, or those of the publisher, the editors and the reviewers. Any product that may be evaluated in this article or claim that may be made by its manufacturer is not guaranteed or endorsed by the publisher.
Research integrity at Frontiers
Learn more about the work of our research integrity team to safeguard the quality of each article we publish.