 Michael W. Boyce1,2,3*
 Robert H. Thomson2,3
 Joel K. Cartwright2David T. Feltner2Cortnee R. Stainrod4
 Jeremy Flynn4Christian Ackermann2John Emezie2Charles R Amburn1Ericka Rovira2
- 1United States Army DEVCOM Soldier Center, Simulation and Training Technology Center, Orlando, FL, United States
- 2Department of Behavioral Sciences and Leadership, United States Military Academy, West Point, NY, United States
- 3Army Cyber Institute, United States Military Academy, West Point, NY, United States
- 4University of Central Florida, Institute for Simulation and Training, Orlando, FL, United States
This study identifies that increasing the fidelity of terrain representation does not necessarily increase overall understanding of the terrain in a simulated mission planning environment using the Battlefield Visualization and Interaction software (BVI; formerly known as ARES (M. W. Boyce et al., International Conference on Augmented Cognition, 2017, 411–422). Prior research by M. Boyce et al. (Military Psychology, 2019, 31(1), 45–59) compared human performance on a flat surface (tablet) versus topographically-shaped surface (BVI on a sand table integrated with top-down projection). Their results demonstrated that the topographically-shaped surface increased the perceived usability of the interface and reduced cognitive load relative to the flat interface, but did not affect overall task performance (i.e., accuracy and response time). The present study extends this work by adding BVI onto a Microsoft HoloLens™. A sample of 72 United States Military Academy cadets used BVI on three different technologies: a tablet, a sand table (a projection-based display onto a military sand table), and on the HoloLens™ in a within-subjects design. Participants answered questions regarding military tactics in the context of conducting an attack in complex terrain. While prior research (Dixon et al., Display Technologies and Applications for Defense, Security, and Avionics III, 2009, 7327) suggested that the full 3D visualization used by the Hololens™ should improve performance relative to the sand table and tablet, our results demonstrated that the HoloLens™ performed relatively worse than the other modalities in accuracy, response time, cognitive load, and usability. Implications and limitations of this work will be discussed.
Introduction
Military planning is a time and resource intensive process; there currently exists a bottleneck in the soldier being able to consume, analyze, and communicate the myriad multi-sensory sources of incoming information, which leads to information processing challenges that have been a part of research for decades (Treisman, 1964; Broadbent, 1982). The Army is committed to utilizing extended reality to break through this bottleneck and enhance training and soldier decision making by integrating different types of display technologies (Sprigg, 2020). Technology will continue to increase in its availability and become readily available to assist in the training of officers with many different types of display combinations (Martin, 2019; Goldstein, 2020). The when and how to use displays has been a topic of discussion in Human Factors Engineering for decades (Aretz, 1991; Wickens and Carswell, 1995; Council, 1997; Ahlstrom and Kudrick, 2007).
Specific to training, a challenge is to simulate realistic operations in a controlled environment and be able to deploy these training exercises at scale to the operational force (Roo and Hachet, 2017). The need to represent these complex scenarios becomes more challenging as technology options and combinations grow. Even further, the information pipeline is multidimensional, multi-format, and context sensitive to the training environment. Providing the appropriate information with a suitable display configuration necessitates understanding all of the human, task, and display requirements. (Wickens and Carswell, 1995; Hall et al., 2012; Çöltekin et al., 2020).
Extended Reality Displays in the Military
Extended Reality (XR) applications in the military exist in many fields, including aviation, wargaming, weapons training, and human agent teaming applications (Hocraffer and Nam, 2017). XR environments allow soldiers to visualize information in ways not practical in traditional training (Pallavicini et al., 2016; Gawlik-Kobylinska et al., 2020; Kaplan et al., 2021). As the United States Army increases the use of environments for more realistic training and rehearsal exercises, XR investigations and capabilities will continue to be a priority.
The Army has leveraged commercial XR technologies to support improved skill acquisition for complex environments. An immediate advantage to training with XR is the ability to effectively visualize diverse elements and techniques, evaluating threats/targets, gauging spatial proximity, and inferring information relevant to friendly or enemy ground and airspace units. Conversely, each of the components described above require the operator to maintain situational awareness of the battlespace that directly affects attention management, visual search, spatial cognition, aggregation of information, and working memory (Wickens et al., 2018). Training with XR technologies have been shown to support authentic analysis of the operational environment, but more importantly have become essential for eliciting formal user feedback related to navigation, mission rehearsal, and collaborative training tasks (O’Banion et al., 2020).
Development of Battlespace Visualization and Interaction
The Army has developed its own government-owned off the shelf architecture known as Battlespace Visualization and Interaction or BVI. BVI is a java-based platform agnostic mission planning tool that was first developed to support military sand table briefings and known as ARES (Augmented Reality Sandtable; Amburn et al., 2015, please see Figure 1). BVI now supports many different display types such as augmented reality, virtual reality, mixed reality, large scale form factor displays, and devices with manipulation tools. For more information about BVI, visit DEVCOM Soldier Center: https://ccdcsoldiercenter.army.mil/whatwedo#effectiveness.
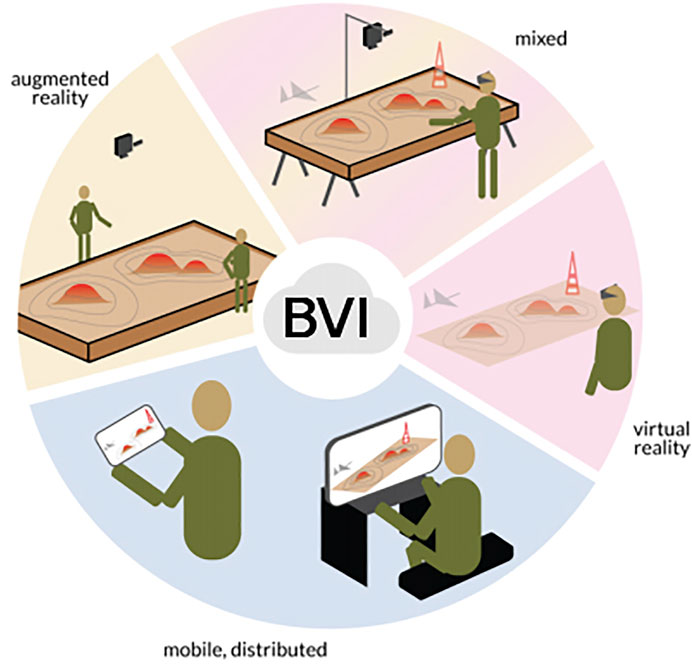
FIGURE 1. Sample applications of BVI.
Comparison of 2D and 3D Displays
Prior research has examined the appropriateness of display type to task (Haskell and Wickens, 1993; St John et al., 2000; Wickens, 2000; Herbert and Chen, 2015). Certain displays have historical been seen to be better at particular tasks. As an example, one of the more common findings is that 3D displays are better for general understanding and shape tasks, while 2D displays were better for accuracy tasks (St. John et al., 2001; Tory et al., 2005). Previous research has also indicated that for complex topographies, student learners prefer topographic maps that use 3D cues over more traditional 2D cues due to the relative ease of interpretation (Rapp et al., 2007). Furthermore, Carbonell Carrera et al. (2017) held a workshop that either taught just 2D maps or 2D maps plus a digital 3D and physical representation. They found significant differences in pre–post knowledge scores for the experimental groups and then found a significant difference between the 2D condition and the 3D digital and physical condition. Specifically, performance is relatively higher on displays integrating 3D effects when They note that when trying to determine the steepest slope or locating terrain features.
Wickens and Carswell, (1995) noted in their work on the proximity compatibility principle that the actual features of the display are less important than how those display elements map to the mental model that the user is attempting to understand (i.e., the structure of the information). When considering using displays to ensure measurable benefits, Dixon et al. (2009) recommended using a hybrid of 2D and 3D perspective views, which speaks to the need for this research. Regardless of the task, our research follows Wickens’ concept of using 3D displays to support the integration of information from displays to support comprehension (Wickens and Carswell, 1995).
Prior Research Integrating Immersive Displays in Training Tactics
The research using ARES/BVI software began in 2015–2016 to investigate the role of displays on training tactics a line of research was developed starting in a pilot study to provide empirical data. A pilot study (N = 19 ROTC Cadets) compared a single projected terrain onto a military sand table to a flat surface display. Results indicated self-assessment manikin scores pre- and post- experiment split between conditions indicated a significant difference for participants in the non flat condition on the arousal and dominance scales, indicating higher interest and feeling of control. There was also a marginal trend towards improved post test performance (Boyce et al., 2016).
A follow-on study was ran in 2017–2018 to see if terrain type or style had an effect (Boyce et al., 2017). For this study we expanded the experimental conditions looking across various types of terrains (based on actual military posts) and assessed on cognitive load, performance - measured in terms of time on task and accuracy - and user engagement, in a within subjects study. Conditions were created using 3D-printed molds of the different terrains as well as a flat condition similar to the pilot. Results demonstrated that a practice effect drove response time, such that the second condition took less time, regardless of order. Accuracy was similar across conditions, and there was not an effect for individual map type. Results also indicated a significant decrease in workload and a significant increase in user engagement, both with moderate to large effect sizes (Boyce et al., 2019).
Current Experiment
The objective of this iteration was to understand how the addition of a mixed reality device would influence military tactics assessment in terms of performance usability and cognitive load. While the BVI sand table is similar to a 3D display in that it provides additional elevation (e.g., height) information as well as length and width, the Microsoft HoloLens™ provides an immersive 3D representation of the terrain features.
Using a military tactics training methodology inspired by (Boyce et al., 2019), the present experiment was set up with a three-factor within-subjects design with the independent variable of display type (tablet, sand table, and Microsoft HoloLens™). The dependent variables included accuracy, response time, as well as usability and workload measure based on the NASA-TLX (Hart, 2006) and System Usability Survey (SUS; Brooke, 1996). A full counterbalanced design was used. In the tablet condition the participants only had a Samsung galaxy tablet to refer to. In the sand table condition they were provided with the sand table display to assist in answering questions, and in the HoloLens condition they were provided with a Microsoft HoloLens™(Please see Figure 2).
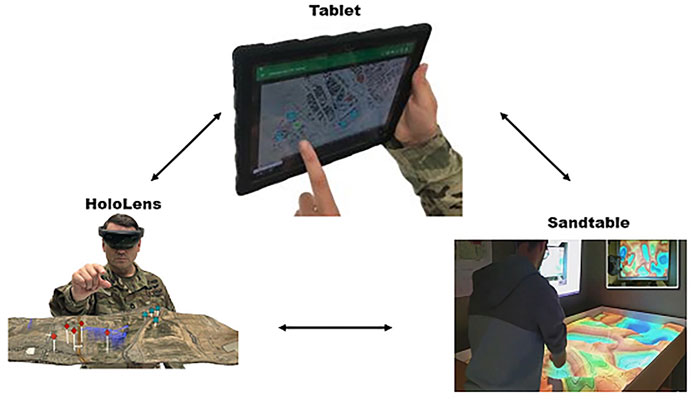
FIGURE 2. The Above Represent the Visualizations That Each Participant Experiences: Tablet, Sand table, and HoloLens™.
We hypothesize that the present study will replicate the results of Boyce et al. (2019) where the sand table was found to reduce the workload of the user with comparable performance metrics. We further hypothesize that the Microsoft HoloLens ™ will further reduce the workload of the user by helping to visualize the terrain in three dimensions.
Method
Participants
Seventy-seven cadets at the United States Military Academy were awarded extra course credit for their participation. All participants had normal or corrected-to-normal vision. Participants were recruited via the SONA system. A sample size of 60 participants was required based on an a priori power analysis using G*Power 3.1.9.7 (Verma and Verma, 2020) for a repeated measures ANOVA with a medium effect size F = 0.25, α = 0.05, number of measurements = 3, and 0.3 correlation among repeated measures. We compensated for an assumed 25 percent loss of data due to technical issues with the Microsoft HoloLens™ during pilot testing, although a patch was later released which resolved this data loss after losing 5 cadets’ data. As such, 72 cadets’ data were entered into our subsequent analyses.
Apparatus
The present study utilized three different types of technologies. A Samsung Galaxy Tab tablet which is used for mission planning and can also be used for tactical decision games, scenario authoring, and classroom exercises (Amburn et al., 2015). The sand table is a 7 ft × 4 ft table filled with play sand, and is augmented with an LCD monitor, Microsoft Kinect sensor™ and Xbox Controllers, laptop, and projector. The Microsoft HoloLens™, first generation is an augmented reality head-mounted display that creates images through a projection system with holographic images in full color. The headset can capture photos, record video, and allow users to navigate with air tap gestures. With the Microsoft HoloLens™ users can view urban structures, artillery visualization, and other elements above the terrain.
Materials
The BVI Software was used to display the scenarios to the participants. For each block, in a given trial participants use one of the technologies (tablet, sand table, or Microsoft HoloLens™) to answer multiple choice questions on a tactical scenario (see Figure 3 for a sample map). Participants answered the same 9 questions per technology (see Appendix A for the list of questions).
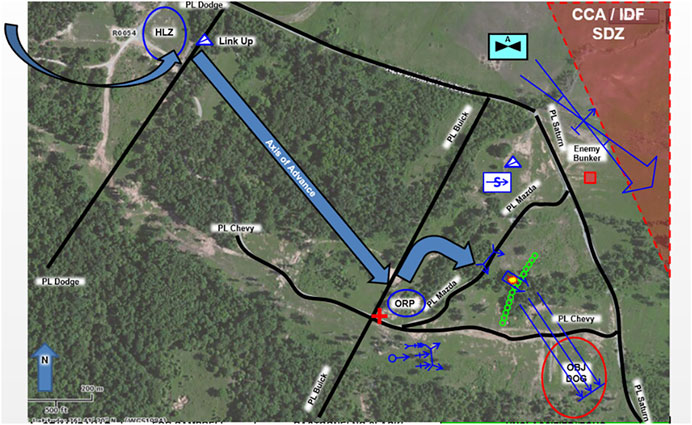
FIGURE 3. Sample scenario of an operational attack.
Each participant sees four scenarios from which they have to coordinate conducting an attack: a training mission plus one scenario per technology. All participants were trained via the tablet. These conditions include perceiving the scenario on the tablet, sand table, and the HoloLens™. After each scenario participants complete two questionnaires: the NASA-TLX and System Usability Scale (SUS)).
NASA Task Load Index
The NASA Task Load Index (NASA-TLX) is a multidimensional scale for measuring workload consisting of six sub-scales representing independent variable clusters: effort, frustration, mental demand, performance, physical demand, and temporal demand (Hart, 2006). These dimensions represent the workload of subjective experiences to predict individual task performance. Previous studies using the NASA-TLX have indicated reliability values in the 0.70 to 0.90 range, which demonstrates optimal reliability (Battiste and Bortolussi, 1988; Xiao et al., 2005; Hoonakker et al., 2011).
System Usability Scale
The System Usability Scale (SUS) uses a Likert scale format consisting of 10 questions that range with five responses from “strongly agree” to “strongly disagree” (Brooke, 1996). The SUS can be utilized as a tool to cover system usability, support, and training. Analysis across 10 years of research indicated that the SUS demonstrated strong reliability for measuring usability of a system, Cronbach’s α = 0.91 (Bangor et al., 2009). The technique captures examples of extreme expressions on a spectrum. For example, the individual might be asked to respond to statements such as “I thought the system was easy to navigate” or “I can’t imagine myself using something like this”.
Procedure
This experiment was conducted in the laboratory. Participants read, agreed to, and signed the informed consent document. Once consenting it was explained how they would be working with three different technologies (tablet, sand table, and HoloLens™) and answering questions associated with each. The participant was also told that they would be giving their answers verbally while using the technologies and then answering surveys (NASA-TLX and SUS) about the technologies in between using a computer running the surveys in the experiment room Figure 4.
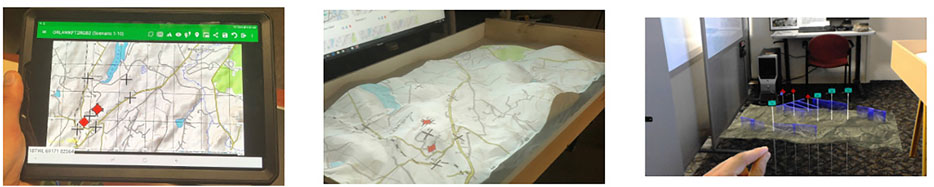
FIGURE 4. Technologies from User’s perspective.
To ensure that the participant understood the task a they first participated in a training round, where they could ask questions. It was explained that they were to take the role of a commander who has been told by his leadership to make decisions about conducting a platoon-level attack based on the information provided to them. The task of conducting an attack was specifically chosen since West Point cadets will assume the role of a platoon leader when they are out in the Army. As a part of their West Point training, they receive platoon leader instruction which makes this task both practical and important to support cadet learning. In an attack, friendly forces seek to move and shape the direction of enemy forces (called control measures) such that the enemy is at a disadvantage and can be defeated or destroyed (Army, 2012). In this task, the attack is occurring at West Point in one of the military training areas. This was done on purpose to lean on prior knowledge that cadets may have gained during their military training exercises. An example question would be “Given the present scenario, where is the most likely approach for the enemy?” to which they would be provided with multiple options in an A,B,C format.
Once training was complete and the participant felt comfortable they would begin the first of three experimental conditions Figure 4. In each condition, the map stayed the same but the scenario changed based on the question and the scenarios were static (no animation).They would do this for 9 questions across each of the three technologies.
After each set of 9 questions and surveys they would move to the next technology. The participants were told that the whole process would take around an hour, and they were debriefed at the end.
User Experience
BVI Tablet: the User Experience(UX) with the tablet consisted of viewing the map, as well as having the ability to pan and zoom to see the tactical picture. The tablet was held in whatever position the participant felt comfortable, usually resting on their lap from a seated position. When a participant was working with the tablet, the research team ensured that the other conditions were not powered on to avoid using one technology to help answer questions from another.
BVI Sandtable: the sand table condition consisted of an experience of the participant standing in front of a downward projected topographic map. Participants were allowed to move physically around the table as they answered the questions. There was no physical interaction with the table, it was solely a viewing task.
BVI HoloLens: the HoloLens condition was a standard Microsoft HoloLens (first edition) with a custom app which was written in Unity, displaying the terrain with elevation in addition to having tactical graphics attached to the terrain. The location of the terrain was pre-set by the research team before allowing the participant to view it. The participant was allowed to use zoom and pan gestures to move around the terrain and also had freedom of movement to which they could change their perspective (crouching down, moving to a 90°angle).
Results
Two separate 3-way (display type: tablet, sand table, HoloLens™) repeated measure ANOVAs were conducted for accuracy (i.e., proportion correct on multiple-choice questions) and response time (in ms). When Mauchley’s test of sphericity was violated, Greenhouse-Geisser adjusted values were reported. All post-hoc analyses are reported with pairwise Bonferroni-adjusted values. For Usability and Workload measures, Related-Samples Friedman’s Two-Way Analysis of Variance by Ranks was used because the Likert data was ordinal and non-normally distributed.
Accuracy
The main effect of display type on accuracy was significant with a small effect size F(2, 142) = 3.84, MSE = 0.031, p < 0.03, ηρ2 = 0.051, with accuracy decreasing from the tablet (M = 0.50, SD = 0.20, SEM = 0.02) and sand table (M = 0.49, SD = 0.19, SEM = 0.02) to the HoloLens™ (M = 0.42, SD = 0.19, SEM = 0.02). Bonferonni-corrected post-hoc analysis revealed that accuracy was significantly lower in the HoloLens™ when compared to the tablet (M = 0.07 percent correct, 95 percent CI [0.002, 0.147], p <=0.05), with the difference between the sand table and Hololens™ being marginally significant (M = 0.07 percent correct, 95 percent CI [-0.006, 0.139], p = 0.08).
Response Time
The main effect of display type on response time was significant with a moderate effect size, F(1.75, 123.99) = 18.93, MSE = 6.70, p < 0.001, ηρ2 = 0.21, with response time decreasing from HoloLens™ (M = 10.69, SD = 4.81, SEM = 0.57) to sand table (M = 9.04, SD = 3.29, SEM = 0.39) to tablet (M = 8.26, SD = 3.09, SEM = 0.36 s). Post-hoc analysis with a Bonferroni adjustment revealed that response time significantly decreased from the HoloLens™ to tablet (M = −2.43 s, 95 percent CI [−3.54, −1.31], p < 0.001) and from HoloLens™ to sand table (M = −1.65 s, 95 percent CI [−2.68, −0.61], p < 0.001).
Usability
System usability was statistically significantly different using the different technology, X2(2) = 49.74, p < 0.001. Post-hoc analysis with a Bonferroni adjustment revealed that System Usability was significantly different for the HoloLens™ (Mdn = 60) than either the sand table (Mdn = 75) or the tablet (Mdn = 75), p < 0.001.
Workload
Global Workload was statistically significantly different using the different technology, X2(2) = 10.15, p < 0.01. Post-hoc analysis with a Bonferroni adjustment revealed that Global Workload was significantly different from the HoloLens™ (Mdn = 38.90) to the sand table (Mdn = 34.67), p = 0.005 but not between the HoloLens™ (Mdn = 38.90) and the tablet (Mdn = 36.16), p > 0.05 or between the Tablet (Mdn = 36.16) and the sand table (Mdn = 34.67), p > 0.05.
Discussion
The goal of this study was to determine whether the fully 3D immersive interface of the Microsoft HoloLens™ would relatively improve performance and reduce workload compared to the topographic 2.5D sand table and the flat 2D tablet. Surprisingly, our hypothesis was not supported. Using the HoloLens™ led to consistently worse performance and workload measures when compared with the sand table and tablet. Performance and workload measures between the sand table and tablet were comparable and consistent with Boyce et al. (2019), but not and usability metrics. These results do support the need for further examination into when and how devices should be integrated into the training pipeline the XR research area continues to grow, consistent with more recent literature (Kaplan et al., 2021).
The fact that participants took significantly longer to respond to the questions (and were less accurate) solely for the HoloLens™ is telling. Despite receiving some task training, the lack of familiarity with the technology could have impacted their performance. It may also be the case that the more immersive environment, while higher fidelity, required more effort to process the environment. This was seen in the relatively higher workload for the HoloLens™ when compared with the sand table and tablet. While participants may have engaged with more exploratory learning, the current software was not designed to assess any exploration metrics or measures such as gaze tracking. Practically, in a military environment it would be challenging to allow enough time to achieve a desired level of exploration due to the time constraints of the participants.
The usability scores (as assessed by medians) were the same for both the tablet and the sand table, which is not consistent with the results from our previous study (Boyce et al., 2019). For context, the average SUS score is 68 (Sauro and Lewis, 2011) and the HoloLens™ scored a 60 while the other conditions scored a 75. This may have been partially due to the intrusiveness of the technology. Specifically, it could have been related to having to physically put on and wear a HoloLens ™, while the sand table was a physical object they just needed to look towards. Anecdotally, the HoloLens™ was not always comfortable to wear and sometimes took a small amount of time to reconnect to the computer hosting the BVI application.
Overall, this study identifies that moving from a topological 2.5D display to an immersive 3D display does not necessarily confer any benefits without requiring additional training. Perhaps if the immersion would have been equivalent (e.g., fully holographic) then the participants would not have had the additional physical requirements of wearing the headset, which may have confounded how usable they found the actual image. Further research is required to tease apart how much the physical technology of the HoloLens™ confounded with participants experiencing of the scenario terrain, and with additional familiarity, would the HoloLens™ be a relatively more effective training tool (in both performance and portability) when compared with the BVI sand table.
Limitations of the Study
This study has a few limitations that could be addressed in future research. Perhaps the largest issue is that participants were only familiarized with the technology and were not trained to a common level of basic proficiency. If the participants were instead allowed to train and test to a certain level of proficiency with each of the technologies then we could be sure that it is differences based on the person rather than differences on the technology. A second limitation is that the HoloLens ™ was a an early research build. Since this study, the HoloLens 2™ was released which is lighter, more powerful, and has a broader field of view.
A limitation of our population was that it was drawn from the freshman population at a Military Academy. The content was tailored to the ability levels of those cadets by military subject matter experts, but this knowledge was not the same as that of the greater operational force. Though academically that sounds compelling, in the Active Duty Army there are a wide range of skills (military occupational specialities), roles, and experience level all of which impact the nature of the content presented. It may not be the case that there is a “one size fits all” solution for training these disparate roles.
Conclusion and Future Plans
The present study provided evidence that the Microsoft HoloLens™ is not as effective a training device as the BVI sand table or tablet, with the caveat that more specialized training may be required to compensate for the lack of familiarity and physical limitations of the HoloLens™ itself. The impetus for this work was the Army’s Synthetic Training Environment Cross Functional Team’s emphasis on using technologies like HoloLens™ for training. As the Department of Defense focuses on technology as a means of addressing the future of Joint Force and Multi Domain Operations (e.g., air, land, maritime, space, and cyberspace) and training, research focused on technologies’ impact on being able to scale training using XR to reduce the need for large-scale physical training areas, allowing for operational training which could be taken on-site. Similar to what this research has found, recently released was the news that the Army’s Integrated Visualization Augmentation System (IVAS) is being delayed for roll out for army training due to challenges in technology capabilities (Kenney, 2021).
Data Availability Statement
The raw data supporting the conclusion of this article will be made available by the authors, without undue reservation.
Ethics Statement
The studies involving human participants were reviewed and approved by United States Army Research Laboratory Institutional Review Board. The patients/participants provided their written informed consent to participate in this study.
Author Contributions
MB—Research Conceptualization and Design, Protocol Writing, Data Collection, Statistical Analysis, and Manuscript Preparation RT, JC—Study Coordination, Statistical Analysis, Manuscript Preparation and Review DF—Study conceptualization and content development, IRB and manuscript writing, data analysis CS—Study Conceptualization, Data Collection, Manuscript Preparation and Review, Research Coordination JF—Manuscript Preparation, statistical analysis review. CA, JE—Data collection and initial writeups to support manuscript development—built study materials and created content. ER, CA—Study Conceptualization, coordination and facilitation support, manuscript and data analysis review.
Conflict of Interest
The authors declare that the research was conducted in the absence of any commercial or financial relationships that could be construed as a potential conflict of interest.
Publisher’s Note
All claims expressed in this article are solely those of the authors and do not necessarily represent those of their affiliated organizations, or those of the publisher, the editors and the reviewers. Any product that may be evaluated in this article, or claim that may be made by its manufacturer, is not guaranteed or endorsed by the publisher.
References
Ahlstrom, V., and Kudrick, B. (2007). Human Factors Criteria for Displays: A Human Factors Design Standard Update of Chapter 5. Atlantic City: Federal Aviation Administration William J. Hughes Technical Centre.
Amburn, C. R., Vey, N. L., Boyce, M. W., and Mize, J. R. (2015). The Augmented Reality Sandtable (Ares) (Tech. rep). Maryland, United States: Aberdeen Proving Ground.
Aretz, A. J. (1991). The Design of Electronic Map Displays. Hum. Factors 33 (1), 85–101. doi:10.1177/001872089103300107
Army, U. (2012). Offense And Defense (Tech. rep). FM 3-90-1. Washington, DC: Government Printing Office.
Bangor, A., Kortum, P., and Miller, J. (2009). Determining what Individual sus Scores Mean: Adding an Adjective Rating Scale. J. usability Stud. 4 (3), 114–123.
Battiste, V., and Bortolussi, M. (1988). Transport Pilot Workload: A Comparison of Two Subjective Techniques. Proc. Hum. Factors Soc. Annu. Meet. 32 (2), 150–154. doi:10.1177/154193128803200232
Boyce, M. W., Reyes, R. J., Cruz, D. E., Amburn, C. R., Goldberg, B., Moss, J. D., et al. (2016). Effect of Topography on Learning Military Tactics-Integration of Generalized Intelligent Framework for Tutoring (Gift) and Augmented Reality Sandtable (Ares) (Tech. rep). MD, United: Army Research Laboratory, Aberdeen Proving Ground, Aberdeen.
Boyce, M. W., Rowan, C. P., Baity, D. L., and Yoshino, M. K. (2017). Using Assessment to Provide Application in Human Factors Engineering to Usma Cadets. Int. Conf. Augmented Cognition 10285, 411–422. doi:10.1007/978-3-319-58625-0_30
Boyce, M. W., Rowan, C. P., Shorter, P. L., Moss, J. D., Amburn, C. R., Garneau, C. J., et al. (2019). The Impact of Surface Projection on Military Tactics Comprehension. Mil. Psychol. 31 (1), 45–59. doi:10.1080/08995605.2018.1529487
Broadbent, D. E. (1982). Task Combination and Selective Intake of Information. Acta Psychol. 50 (3), 253–290. doi:10.1016/0001-6918(82)90043-9
Carbonell Carrera, C., Avarvarei, B. V., Chelariu, E. L., Draghia, L., and Avarvarei, S. C. (2017). Map-reading Skill Development with 3d Technologies. J. Geogr. 116 (5), 197–205. doi:10.1080/00221341.2016.1248857
Çöltekin, A., Griffin, A. L., Slingsby, A., Robinson, A. C., Christophe, S., Rautenbach, V., et al. (2020). Geospatial Information Visualization and Extended Reality Displays. Manual of Digital Earth. Singapore: Springer, 229–277.
Council, N. R. (1997). Tactical Display for Soldiers: Human Factors Considerations. Washington, D.C: National Academies Press.
Dixon, S., Fitzhugh, E., and Aleva, D. (2009). “Human Factors Guidelines for Applications of 3d Perspectives: A Literature Review,” in Display Technologies and Applications for Defense, Security, and Avionics III, 7327. doi:10.1117/12.820853
Gawlik-Kobylinska, M., Maciejewski, P., Lebiedz, J., and Wysokinska-Senkus, A. (2020). “Factors Affecting the Effectiveness of Military Training in Virtual Reality Environment,” in Proceedings of the 2020 9th International Conference on Educational and Information Technology, 144–148.
Goldstein, P. (2020). Army Uses Ar Maketraining More Dynamic. Available at: https://fedtechmagazine.com/article/2021/01/army-uses-ar-maketraining- more-dynamic.
Hall, D. S., Shattuck, L. G., and Bennett, K. B. (2012). Evaluation of an Ecological Interface Design for Military Command and Control. J. Cognitive Eng. Decis. Mak. 6 (2), 165–193. doi:10.1177/1555343412440696
Hart, S. G. (2006). Nasa-task Load Index (Nasa-tlx); 20 Years Later. Proc. Hum. factors ergonomics Soc. Annu. Meet. 50 (9), 904–908. doi:10.1177/154193120605000909
Haskell, I., and Wickens, C. (1993). A Theoretical and Empirical Comparison of Two-And Three-Dimensional Displays for Aviation. Int. J. Aviat. Psychol. 3 (2), 87–109. doi:10.1207/s15327108ijap0302_1
Herbert, G., and Chen, X. (2015). A Comparison of Usefulness of 2d and 3d Representations of Urban Planning. Cartogr. Geogr. Inf. Sci. 42 (1), 22–32. doi:10.1080/15230406.2014.987694
Hocraffer, A., and Nam, C. S. (2017). A Meta-Analysis of Human-System Interfaces in Unmanned Aerial Vehicle (Uav) Swarm Management. Appl. Ergon. 58, 66–80. doi:10.1016/j.apergo.2016.05.011
Hoonakker, P., Carayon, P., Gurses, A. P., Brown, R., Khunlertkit, A., McGuire, K., et al. (2011). Measuring Workload of Icu Nurses with a Questionnaire Survey: The Nasa Task Load Index (Tlx). IIE Trans. Healthc. Syst. Eng. 1 (2), 131–143. doi:10.1080/19488300.2011.609524
Kaplan, A. D., Cruit, J., Endsley, M., Beers, S. M., Sawyer, B. D., and Hancock, P. A. (2021). The Effects of Virtual Reality, Augmented Reality, and Mixed Reality as Training Enhancement Methods: A Meta-Analysis. Hum. Factors 63 (4), 706–726. doi:10.1177/0018720820904229
Kenney, C. M. (2021). Army Delaysivas Display Headse. Available at: https://www.defenseone.com/technology/2021/10/army-delaysivas- display-headset-year/186217/.
Martin, L. (2019). Three Technologies Transforming Military Training. Available at: https://www.lockheedmartin.com/en-us/news/features/2019-features/three-technologies-transforming-military-training-in-2020.html.
O’Banion, M. S., Majkowicz, D. C., Boyce, M. W., Wright, W. C., Oxendine, C. E., and Lewis, N. S. (2020). Evaluating Immersive Visualization Technology for Use in Geospatial Science Education. Surv. Land Inf. Sci. 79 (1), 15–22.
Pallavicini, F., Argenton, L., Toniazzi, N., Aceti, L., and Mantovani, F. (2016). Virtual Reality Applications for Stress Management Training in the Military. Aerosp. Med. Hum. Perform. 87 (12), 1021–1030. doi:10.3357/amhp.4596.2016
Rapp, D. N., Culpepper, S. A., Kirkby, K., and Morin, P. (2007). Fostering Students' Comprehension of Topographic Maps. J. Geoscience Educ. 55 (1), 5–16. doi:10.5408/1089-9995-55.1.5
Roo, J. S., and Hachet, M. (2017). One Reality. Proc. 30th Annu. ACM Symposium User Interface Softw. Technol., 787–795. doi:10.1145/3126594.3126638
Sauro, J., and Lewis, J. R. (2011). When Designing Usability Questionnaires, Does it Hurt to Be Positive? Proc. SIGCHI Conf. Hum. factors Comput. Syst., 2215–2224. doi:10.1145/1978942.1979266
Sprigg, S. (2020). Auganix. Available at: https://www.auganix.org/us-army-researchers-develop-soldier-decisionmaking-system-that-populates-immersive-xr-environments-with-complex-data/.
St John, M., Harvey, S., Smallman, H., Oonk, H., and Cowen, M. (2000). Navigating Two-Dimensional and Perspective Views of Terrain (Tech. rep). San Diego CA: Space And Naval Warfare Systems Center.
St. John, M., Cowen, M. B., Smallman, H. S., and Oonk, H. M. (2001). The Use of 2d and 3d Displays for Shape-Understanding versus Relative-Position Tasks. Hum. Factors 43 (1), 79–98. doi:10.1518/001872001775992534
Tory, M., Kirkpatrick, A. E., Atkins, M. S., and Möller, T. (2005). Visualization Task Performance with 2d, 3d, and Combination Displays. IEEE Trans. Vis. Comput. Graph 12 (1), 2–13. doi:10.1109/TVCG.2006.17
Treisman, A. M. (1964). Selective Attention in Man. Br. Med. Bull. 20 (1), 12–16. doi:10.1093/oxfordjournals.bmb.a070274
Verma, J. P., and Verma, P. (2020). Use of G* Power Software. Determining Sample Size and Power in Research Studies. Singapore: Springer, 55–60. doi:10.1007/978-981-15-5204-5_5
Wickens, C. D., and Carswell, C. M. (1995). The Proximity Compatibility Principle: Its Psychological Foundation and Relevance to Display Design. Hum. Factors 37 (3), 473–494. doi:10.1518/001872095779049408
Wickens, C., Dempsey, G., Pringle, A., Kazansky, L., and Hutka, S. (2018). Developing and Evaluating an Augmented Reality Interface to Assist the Joint Tactical Air Controller by Applying Human Performance Models. Proc. Hum. Factors Ergonomics Soc. Annu. Meet. 62 (1), 686–690. doi:10.1177/1541931218621155
Wickens, C. D. (2000). The when and How of Using 2-d and 3-d Displays for Operational Tasks. Proc. Hum. Factors Ergonomics Soc. Annu. Meet. 44 (21), 3–403. doi:10.1177/154193120004402107
Appendix A: List of Questions Participants Answer Each Scenario
1. Which is the best location for a possible LZ?
2. What key terrain in enemy territory is most likely Between x and y?
3. What is the enemy’s most deadly course of action?
4. What is the best position for a blue force sniper?
5. What is the best location for CCP?
6. If comms don’t work on objective where is the best location to re-establish comms?
7. Where is the best location to cross the LDA on y?
8. Where is the best location for reconsolidation/PZ after the mission?
9. Where is the best location for fires plan to suppress the enemy?
As a reminder, participants were military academy cadets with specific training in viewing these kinds of scenarios. Questions were developed in consultation with Army Officers.
Keywords: EXtended reality (XR), Microsoft HoloLens, United States military academy (USMA), system usability scale, NASA—TLX, battlespace visualization and interaction (BVI), augmented REality sand table (ARES), simulation and training
Citation: Boyce MW, Thomson RH, Cartwright JK, Feltner DT, Stainrod CR, Flynn J, Ackermann C, Emezie J, Amburn CR and Rovira E (2022) Enhancing Military Training Using Extended Reality: A Study of Military Tactics Comprehension. Front. Virtual Real. 3:754627. doi: 10.3389/frvir.2022.754627
Received: 06 August 2021; Accepted: 26 May 2022;
Published: 08 July 2022.
Edited by:
Doug A. Bowman, Virginia Tech, United StatesReviewed by:
Mark Billinghurst, University of South Australia, AustraliaThammathip Piumsomboon, University of Canterbury, New Zealand
Copyright © 2022 Boyce, Thomson, Cartwright, Feltner, Stainrod, Flynn, Ackermann, Emezie, Amburn and Rovira. This is an open-access article distributed under the terms of the Creative Commons Attribution License (CC BY). The use, distribution or reproduction in other forums is permitted, provided the original author(s) and the copyright owner(s) are credited and that the original publication in this journal is cited, in accordance with accepted academic practice. No use, distribution or reproduction is permitted which does not comply with these terms.
*Correspondence: Michael W. Boyce, bWljaGFlbC53LmJveWNlMTEuY2l2QGFybXkubWls, b3JjaWQub3JnLzAwMDAtMDAwMi05ODY5LTM5ODk=