 Arash Shahbaz Badr
 Raffaele De Amicis
- School of Electrical Engineering and Computer Science, Oregon State University, Corvallis, OR, United States
Navigation is the most prevalent interaction in large urban virtual environments (VEs). Any Metaverse application that foresees navigating or exploring virtual cities requires an effective and efficient navigation technique. These environments, however, have distinct characteristics that make the navigation more challenging and the design of the interactions more critical. We have conducted an empirical study to assess how enhancing the teleportation technique with additional capabilities affects the performance of navigating large urban VEs. For this purpose, three interactions have been developed that extend the conventional point-and-click teleportation. The first one is named Mini-Map and provides a top-down view of the user’s surroundings. Portal Preview provides a preview of the selected target location and allows users to choose their desired orientation at that location. The last technique, called X-Ray Vision, makes the buildings around the user translucent and allows teleporting to locations that would otherwise be obscured. A within-subject controlled lab study with twenty five participants has been conducted, where each extension is evaluated individually as well as in combination with others. Our results show that extending the teleportation can significantly improve its performance when navigating large urban VEs. Overall, the X-Ray Vision was the most successful extension with respect to both task metrics and usability measures. Mini-Map was able to improve some of the task metrics, but did not have a significant effect on most self-reported measures. Portal Preview was the least effective extension, however, multiple participants liked the fact that they could define their desired orientation with the controller. Combining all interactions together performed well with respect to the task metrics, but this option was not favored by the participants. Extending the teleportation with X-Ray Vision and Mini-Map was by far the most favored option.
1 Introduction
The term Metaverse first appeared in a science fiction novel and has gained remarkable traction in recent years. This is in part due to substantial investments made by large corporations, such as Meta, whose CEO, Mark Zuckerberg, regards the Metaverse as an embodied internet.1 But the popularity of the Metaverse is not limited to the industrial sector, which is evidenced by the surge in the number of related publications, as determined by Ning et al. (2021), showing that the scientific community is embracing it as well. Metaverse is the integrated network of 3D virtual worlds (Dionisio et al., 2013) that facilitates interaction and collaboration in the immersive cyberspace. Metaverse operates in Extended Reality (XR), which incorporates Virtual Reality (VR), Augmented Reality (AR), and Mixed Reality (MR). Emerging visualization modalities utilizing these immersive paradigms can change how we view and interact with data (Chandler et al., 2015). In the context of smart cities, Metaverse has the potential to redefine city design activities and municipal services (Allam et al., 2022). The spatial presence facilitated by immersive technologies along with the in-situ representation of urban processes and the collaborative capabilities make the Metaverse ecosystem an excellent medium for experiencing and interacting with digital replicas of cities in a close-to-natural manner. It is therefore unsurprising that the Metaverse has become a key trend in the design of virtual cities and digital twin cities (Bibri and Allam, 2022). Many aspects of urban planning and city management can benefit from the Metaverse, including resource management and sustainability, infrastructure planning and maintenance, health and education access, intelligent transportation, and urban tourism (Allam et al., 2022; Huynh-The et al., 2023; Kemec, 2022). Moreover, Metaverse can improve services offered to the citizens (Huynh-The et al., 2023). This digital transformation is already under way with the Seoul Metropolitan Government announcing in 2021 the inception of a virtual municipal government platform named Metaverse Seol, where different administrative services will be offered in the virtual space.
To unleash the full potential of the Metaverse, besides the 3D representation and digitization of the urban space, further components are required. Ghani et al. (2018) consider interactivity, contextual setting, and auditory capabilities among the elements required for an experiential virtual urban environment. Ning et al. (2021) deem the interactivity, in particular, as one of the open issues in the Metaverse domain. Hence, there is a need for research on providing effective and user-friendly interactions to Metaverse users. Navigation is the most commonly utilized interaction in large immersive environments (Bowman et al., 2001). This prevalence highlights the importance of effective, intuitive, and efficient navigation techniques and rationalizes the exceeding research attention given to it (Çöltekin et al., 2019). The effectiveness and efficiency of the navigation become even more decisive when the immersive experience is used for critical tasks such as urban monitoring and crisis management. Aside from the use case, the technology utilized for XR delivery (e.g., head-mounted VR, CAVE (Cruz-Neira et al., 1992), head-mounted AR, handheld AR) also highly influences the choice of the navigation metaphor and the corresponding design choices. This work focuses on navigating large urban VEs in immersive VR settings.
The evaluation of navigation techniques has been the subject of a broad body of work. Nevertheless, there is only a limited number of studies that tailor the design and evaluation of the navigation to the characteristics of urban VEs. Therefore, this work contributes towards a better understanding of the implications of navigating large virtual cities, and our findings are expected to inform the design and development of future interactions for Metaverse use cases involving urban environments. A further gap in the existing literature is that the assessment of the efficiency and technical aspects of the navigation often overshadow the evaluation of the user experience (Boletsis, 2017). Moreover, an evaluation of individual components of a navigation technique, rather than the entire package, is difficult to find. Therefore, besides the design and implementation of navigational tools, we see our evaluation approach as one of the major contributions of this work. In particular, we evaluate a set of interaction techniques that extend the conventional teleportation. We evaluate each extension individually as well as in combination with others, which enables a more granular assessment of how individual components support the navigation and how users utilize them and perceive their usability.
In the remainder of this article, we provide relevant background information in Section 2 before describing our methods and procedures in Section 3. The results of our user study and the respective statistical analyses are provided in Section 4, and Section 5 discusses the relevant insights and their implications. Section 6 concludes this report.
2 Background
Despite the importance of navigation techniques and a long history of respective research work, the number of commonly-deployed navigation techniques is limited to a fairly small number of metaphors and their variations. This is partly due to the need for hardware interfaces that facilitate intuitive interactions and their limitations (e.g., accuracy and degree of freedom of the tracking method) as well as lack of portability of interactions across different hardware. Restrictions imposed by the physical limits, such as gravity, physical strain, and the dimensions of the tracked space, are further hindering factors.
Navigation consists of two components: Wayfinding and travel. The former is the cognitive component of navigation, which involves identifying one’s current location and orientation, identifying the target location, and determining a path from current to target location. Travel, also referred to as locomotion, is the motor component of the navigation and refers to techniques that allow the user to move from one location in the VE to another. Boletsis (2017) categorizes the existing travel methods based on different characteristics. The interaction type, for example, can be either physical, or artificial. The former tracks the physical movement of the user’s body to determine the direction and/or velocity of motion in the VE. Besides natural walking, instances of such techniques include redirected walking (Razzaque et al., 2001) and motion-in-place (Slater et al., 1995; Nilsson et al., 2013; McCullough et al., 2015) as well as techniques that use special hardware such as omni-directional treadmills (Darken et al., 1997; Iwata, 1999). With artificial techniques, on the other hand, the shift in the point of view in the VE is decoupled from user’s physical motion. Controlling the motion with a joystick is a common example of artificial methods. Another popular technique is teleportation, where the user selects a desired location, and they are instantaneously moved to that location. Physical navigation techniques are deemed more intuitive, less likely to induce motion sickness, and better at preserving the sense of presence (Usoh et al., 1999; Interrante et al., 2007; Krekhov et al., 2018). However, when productivity and efficiency are of essence, artificial techniques are preferred (Bowman et al., 2001).
The comparative evaluation of different navigation techniques has been the subject of a number of previous academic work. Danyluk and Willett (2019) conducted two consecutive studies comparing four navigation techniques (flight, teleportation, world-in-miniature, 3D cone-drag) and their combinations in large geographical VEs. Flight was found to be the most desired stand-alone technique, but combining multiple techniques was found to be more powerful. In particular, they recommend facilitating different types of navigation for different types of tasks and scenarios. Boletsis and Cedergren (2019) conducted an empirical evaluation of navigation techniques focused on the user experience. The techniques tested in this study are walk-in-place, controller-based motion, and teleportation, which are selected based on their prevalence in the recent literature. While describing the qualities of the techniques in the conducted interviews, participants focused on immersion, ease of use, competence, and psychophysical discomfort, which can be an indication of the factors most important to them. Coomer et al. (2018) compared the performance of teleportation and joystick-based motion to two proposed techniques dubbed arm-cycling and point-tugging. They found that with teleportation users traversed a longer path and had to turn their head significantly more in order to reorient themselves, nevertheless, users still found this technique less tiresome than the proposed methods.
Among the works that focus on navigation techniques for urban VEs, Chen et al. (2021) proposed a novel method for exploring large virtual cities, where a cylindrical deformation is applied to the city model. This allows users to gain a wide-ranging overview of the environment beyond the occluding buildings without leaving the current spatial context. This method is compared to the conventional flat view as well as a mini-map to assess its effectiveness relative to existing techniques. Although this paradigm was found to be generally effective in improving performance metrics, Chen et al. state that for street-level exploration of dense cities a see-through approach, similar to the X-Ray Vision utilized in this study, would be more powerful. A preliminary study of a similar approach was done by Zhang et al. (2021), where they focused on inspection and wayfinding tasks. Stähli et al. (2021) examined the effect of different methods of integrating navigation instructions in the virtual representation of smart cities. Overall, augmenting the environment with visual cues such as directional arrows performed best, but the conventional map-based approach performed comparably well across most metrics. The experiments were conducted in a non-immersive setting, which is listed as a limitation of the study. Halik and Kent (2021) investigated the users’ preference and behavior regarding 2D versus 3D representation of buildings when conducting exploration and navigation tasks in virtual cities. Even though the 3D representation was clearly preferred, some participants liked the 2D view, stating reasons such as easier orientation, easier navigation, and better view of a normally obstructed area. This can be seen as an indication of how the occlusion problem in urban spaces impedes taking full advantage of 3D capabilities of VR. Furthermore, Halik and Kent propose as a future research direction the assessment of the effectiveness of maps in comparison to making buildings translucent, which is part of our study.
Rather than benchmarking existing metaphors or comparing a novel navigation technique against conventional ones, this research focuses on extending the teleportation technique and measuring the corresponding effect on the navigation performance. Our focus on teleportation is due to properties that are beneficial, if not essential, for navigating large urban VEs. In a city-scale environment, the extent of the virtual world goes far beyond the tracked physical space available to the user for interacting with the system. Therefore, physical navigation metaphors are often not practicable, and artificial locomotion techniques are likely the only viable option. Instances of artificial techniques (e.g., teleportation and joystick-based continuous motion) facilitate navigating arbitrarily large VEs without imposing specific requirements on the scale of the tracked physical space. Among artificial techniques, teleportation is favorable over continuous motion for reducing motion sickness (Frommel et al., 2017) and lowering the level of fatigue (Buttussi and Chittaro, 2021). Moreover, this technique has been found to be usable, straight-forward, and fast (Boletsis and Cedergren, 2019). These strengths have been frequently echoed in the literature. Among the relevant empirical studies reviewed by Prithul et al. (2021), nearly all studies confirmed a higher performance of teleportation compared to other artificial locomotion techniques. Accordingly, the research interest in this method has grown noticeably in recent years, as evidenced by two reviews of common navigation techniques (Boletsis, 2017), and (Boletsis and Chasanidou, 2022), conducted 5 years apart.
Previous studies have shown that navigation techniques can be improved by tailoring them to the specific use case at hand or by addressing relevant shortcomings (Krekhov et al., 2018; Caputo et al., 2019; Kraus et al., 2020; Adhikari et al., 2022; Tseng et al., 2022). Nevertheless, Prithul et al. (2021) found that there are only a few publications that improve the teleportation by explicitly mitigating a known disadvantage of the technique. In this work, building upon the strengths of teleportation, we extend it with three interaction techniques dubbed Mini-Map, Portal Preview, and X-Ray Vision. These assistive techniques aim to address some of the challenges pertinent to large virtual urban environments. A major challenge is that the distance that can be traversed with each teleport is constrained by the buildings obscuring user’s view. This limitation can curtail the efficiency and usability of the teleportation, as the user may not be able to reach some locations or may need to perform significantly more teleportations, which can annoy them (Bozgeyikli et al., 2019) and increase the eye strain (Boletsis and Cedergren, 2019). All the proposed extensions address this challenge in some manner. The Mini-Map provides a top-down view of the surroundings enabling the user to gather spatial knowledge beyond the obscuring buildings. The Portal Preview allows the user to look around the corner at a street intersection, and the X-Ray Vision enables the user to see through the buildings and to teleport to locations that would otherwise be obscured. Based on the taxonomy of occlusion management proposed by Elmqvist and Tsigas (2008), the first two methods fall under the Multiple Viewports category, while the last one represents a Virtual X-Ray tool.
Furthermore, the rigid structure of the city, as defined by the locations of the streets and buildings, often means that users have to follow the path along the road network, which can be significantly longer than the direct line of sight. Additionally, in such VEs, users likely have to turn themselves more frequently (compare, for instance, maneuvering around a building or building block versus moving in an open field). In a basic implementation of the teleport technique, users need to physically rotate their bodies to change their orientation in the VE, which hinders the use of the application in the seated mode and makes the application less accessible for people with certain disabilities. Additionally, physical rotations increase the likelihood of causing fatigue or discomfort when navigating large VEs and heighten the risk of entanglement with cables in case of tethered VR. Apart from the physical constraints, there is also evidence from cognitive research that routes with the least turns or least changes of direction are preferred in both real life (Turner, 2009) and virtual worlds (Dalton, 2003). To reduce the need for physical turns, some implementations let users specify their desired orientation at the target location before concluding the teleport (Bozgeyikli et al., 2016; Funk et al., 2019). Similar to this approach, the proposed Portal Preview facilitates virtual turns using the controller. Additionally, X-Ray Vision aims to minimize the physical strain by reducing the number of teleports and the number of physical turns. Mini-Map, on the other hand, aims to achieve this goal by enabling better wayfinding decisions and avoiding navigational mistakes.
Another major shortcoming of teleportation is that users often feel disoriented after teleporting. To mitigate this spatial disorientation, the user may be translated to the desired destination with a rapid yet continuous motion, while the path and flow of the motion are visually indicated to the user (Bhandari et al., 2018). Switching between first- and third-person views is another method that can address this issue (Cmentowski et al., 2019; Griffin and Folmer, 2019). Another approach is to provide a preview of the space at the target location to the user before executing the teleportation (Elvezio et al., 2017). The Portal Preview follows this latter approach, while the Mini-Map aims to counter the disorientation by providing the users with a spatial overview of the area surrounding them.
In this research, using an empirical approach, we assess the success of the discussed three extensions in improving the performance of teleportation. Specifically, using a number of objective and subjective metrics, we measure how these assistive tools affect the usability and efficiency of the teleportation technique in large urban VEs.
3 Materials and methods
We have conducted a controlled lab experiment with the objective of measuring how enhanced versions of the teleportation perform in urban VEs. This within-subject experiment seeks to assess the efficiency and usability of the enhanced teleportation in large virtual cities by answering the following research questions:
• RQ1: How do extended features of teleportation affect the efficiency of navigation in large urban environments, where user’s view is obscured?
• RQ2: How do users perceive the usability of extended teleportation when traveling in large urban environments, where user’s view is obscured?
In the following, first the testing scenario and the respective tasks are described before introducing the developed techniques and the methodology.
3.1 Test scenario
The 3D model of an imaginary city is generated using CityEngine 2019 as a testbed. The environment spans an area of roughly 2 by 1.35 km and is populated with numerous buildings, streets, and sidewalks. This model is imported into Unreal Engine 4 (UE4), where it is enhanced with trees and various urban furniture. Figure 1 shows an aerial view of the utilized city model.
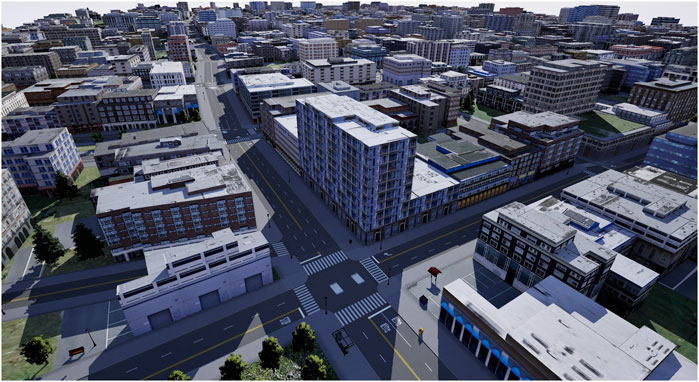
FIGURE 1. A view of the immersive virtual environment used for the experiment.
For testing the techniques, a gamified VR application has been developed, where the user searches the virtual city for virtual objects spread throughout the space and collects them. Additionally, the scene includes four Pacman-style 3D ghosts that are controlled by the AI system of UE4. These agents follow the user throughout the tasks. If an agent reaches a user’s location, the user loses all the points accumulated so far. The ghosts’ initial locations are set at random within a predefined radius around the user, and if the user gets too far from a ghost, the ghost will be relocated to a new random location closer to the user. This test scenario is designed to arouse a need in users for more-powerful navigation techniques and to entice them to take advantage of the extended capabilities. Additionally, it provides the participants with an objective to accomplish, motivating them to complete the tasks as quickly as possible and with higher engagement.
HTC Vive Pro Eye is used as the VR platform connected to a Windows workstation equipped with Intel Xeon E5-269 processor, 256 GB of RAM, and NVIDIA Quadro P6000 graphics card. The application and all the interactions have been implemented using Unreal Engine version 4.27.
3.1.1 Tasks
The tasks used to evaluate the navigation techniques involve searching for a number of pellets in the VE and collecting them. A pellet is collected when the user teleports to its location, which increases user’s score by a certain amount. The number of points associated with each pellet gradually shrinks over time. This scoring scheme along with the presence of the ghosts and a timer that is visible to the user are meant to establish a time pressure that entices the user to collect the pellets as quickly as possible. The pellets are placed along the streets in an irregular manner. More specifically, for each task, a path is created in the scene that covers multiple streets. The pellets are placed along this path and are spaced with a random distance. Each path includes multiple turns at street intersections, and as a result of subsequent turns, it is possible that users see the pellets out of order. Due to this irregular arrangement of the pellets, users are not able to recognize the path connecting them together. Therefore, this task is more difficult than traversing a path by following visual breadcrumbs. This is also evident from the fact that the distance our participants traversed during each task is significantly larger than the length of the corresponding path.
The tasks are timeboxed, and each task concludes either when all the pellets are collected or when the time runs out. Besides the time limit, there are three other parameters that characterize the complexity of the tasks: The number of pellets available in the scene, the length of the path that determines the locations of pellets, and the number of turns along the path. To ensure that all the test conditions are equally complex, all the tasks have the same parameters. In particular, for each task, there are 25 pellets to collect, the path is 2,500 m long, the path makes ten turns of roughly 90° or larger, and the user has 4 minutes for completing the task.
Before conducting each task, there is a practice session that mimics the actual test scenario but is simpler and shorter (10 pellets, 1,000 m long, five turns, 1 minute time limit). During this practice time, users can familiarize themselves with the tool that will be tested subsequently and are encouraged to ask any questions that may arise. If the researcher conducting the session notices a misunderstanding or confusion on the part of the participant during the practice, the researcher provides further clarifications to make sure the participant does not start the tasks with a misconception of the tasks or the interactions.
3.2 Interaction techniques
The interaction techniques developed for this work extend the teleportation technique. The video provided in the Supplementary Material demonstrates the use of these techniques. For the experiment, the HTC Vive Pro Eye VR equipment is utilized. Only one controller is needed for interacting with the system, which can be operated with either hand, based on user’s preference. The trigger button of the controller is used for pressing the buttons on graphical user interfaces, and the trackpad is used for navigating in the environment. Figure 2 annotates the position of these buttons on the controllers. In the following, the developed tools and interactions are described.
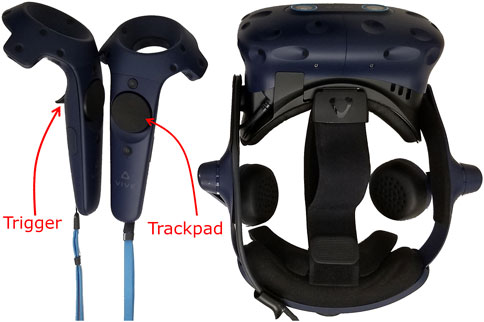
FIGURE 2. HTC Vive Pro Eye VR headset and controllers.
3.2.1 Baseline teleportation
The developed teleportation technique follows a touch-point-click pattern. The search for a teleport target is activated by touching the trackpad on the controller, upon which, a visual cue appears indicating the current location the user is pointing to. A parabolic arc cast from the controller is used for selecting the target location. A distance of up to roughly 118 m is reachable with a single teleport. Once the user is satisfied with the target location pointed to, the teleportation is executed by clicking the trackpad button. Imitating a blink of the eyes, user’s view fades in and out to a black screen over a short period of time while performing the teleport. This blink metaphor serves as an additional visual cue to confirm a successful teleport. Additionally, it can have a positive effect on reducing disorientation and motion sickness although there is no conclusive data available on its effectiveness [compare for instance (Bozgeyikli et al., 2016) and (Mahalil et al., 2019)]. While searching for a target location, the visual cue changes its color when the user points to a non-navigable location. This happens when the user is pointing to a location that is inside a building, on top of surfaces other than the ground surface, or behind an opaque object. Clicking the trackpad has no effect in these cases.
3.2.2 Mini-Map
When the Mini-Map is activated, a 2D map of the area surrounding the user is placed above the controller in upright orientation. The map becomes visible when the user touches the trackpad to search for a teleport target. This top-down view allows users to gain an overview of the area beyond the immediate surroundings, making it particularly beneficial for wayfinding during explore and search tasks. Additionally, it helps users with choosing the target location more precisely, especially, when the target is far away from the user.
To make it easier for users to orient themselves, a forward-up orientation (Darken and Cevik, 1999) is utilized, and the map is centered around user’s location. The map also includes visual cues for user’s current location and orientation, the currently pointed-to target location, and the location of nearby pellets and ghosts. The cue for the target location changes its color and shape when the user points to a location that is not navigable. Figure 3 shows a view of the Mini-Map.
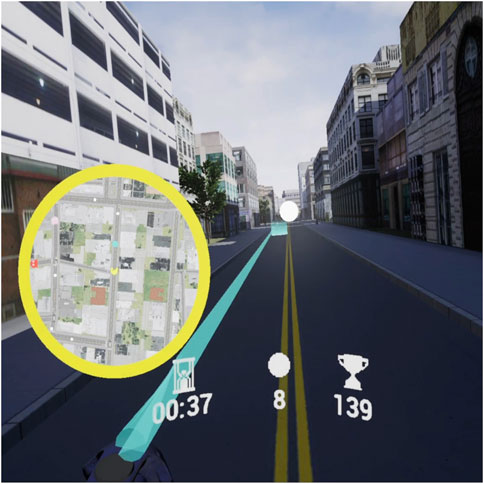
FIGURE 3. A screenshot of the implemented Mini-Map technique.
3.2.3 X-Ray vision
When the user touches the trackpad to initiate the search for a teleport target, the buildings around the user become translucent, which assists the user in two ways. First, the user can obtain a better overview of the space beyond the obscuring scene components. This is mainly helpful for search tasks, especially, when the sought destination is close-by but occluded by opaque objects. Second, the user can teleport to locations that would have been obscured without the X-Ray Vision. While this technique is activated, the collision detection remains in place, meaning that users are not allowed to teleport to a location inside a building nor can they cross a wall by physically moving or leaning toward it. But they are able to choose a teleport target that would otherwise be hidden behind a building. This capability makes the locomotion more efficient and more flexible. The former is achieved by allowing the user to teleport along a straight line rather than going around the block, and the latter is true since the user is not forced to follow the flow of streets. Figure 4 illustrates the use of the X-Ray Vision.
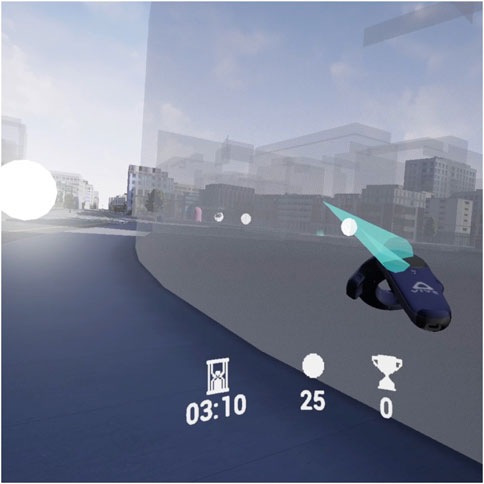
FIGURE 4. A screenshot of the implemented X-Ray Vision technique.
3.2.4 Portal preview
With this technique, after choosing the target location and before teleporting to that location, the user can choose to open a portal that shows a preview of the area around the selected target location. While pointing to a navigable target location, holding the trackpad button, rather than clicking it, will activate the portal, which is placed in front of the user in the 3D space. While the portal is open, the user can also choose their desired orientation at the target using the controller. For this purpose, the user slides their thumb horizontally over the trackpad to the left or right. The rotation modifies the point of view of the portal accordingly. Once the user is satisfied, clicking the trackpad button closes the portal and teleports the user to the selected location with the desired orientation.
The potential benefits of this tool are twofold. First, by letting users preview what they would see at the target location, the portal can reduce the disorientation that users may experience after teleporting. The portal acts as a secondary viewport rendering the target location and allows the user to obtain an impression of the space around that location, which lowers the need for reorientation after teleport. The portal shows a dynamic view, meaning that users can “look around” at the target location by moving their head and see in real time if any pellets are nearby or if a ghost is approaching the selected location. The second benefit is that users can change their orientation at the target location. This functionality aims to increase user comfort by letting users choose their desired orientation, bypassing the need for physical turns. While exploring a large urban environment, users likely would have to make frequent turns at street intersections, which can be fatiguing. Allowing them to turn using controllers can limit the physical strain and also makes it possible to experience the application in seated mode. Figure 5 shows a screenshot of the Portal Preview.

FIGURE 5. A screenshot of the implemented Portal Preview technique.
3.2.5 Bird’s eye view
To assist users with finding the pellets, a bird’s eye view mode is available, which temporarily places the user 100 m above the ground. When in this mode, the user can look around to search for pellets and ghosts, but they can’t perform any navigation. Besides helping the user with locating certain objects or landmarks, this tool can also have a positive effect on user’s satisfaction. In the experiments conducted by Danyluk and Willett (2019) users didn’t like navigating large distances using teleportation, since they found it difficult to gain a global perspective of the space. The aerial view makes it easier for users to obtain a far-reaching spatial overview, mitigating the above concern. To activate this mode, the user needs to point the motion controller to the sky and click the trackpad button. To return to the street-level view, the same button needs to be clicked again regardless of the location being pointed to. Similar to the teleport, a blink is performed when switching between the two modes to make the change of context less abrupt.
Based on the observations we made during our formative pilot studies, we decided to make this tool part of the baseline teleportation rather than testing it individually. The reason for this decision is that searching a large space for sparsely placed items can become very challenging and if the user makes a wrong wayfinding decision at some point, it is possible that they get completely lost and can’t find any further pellets from that point on. We found that this scenario, besides making the task unreasonably challenging, can become frustrating for the participants and demotivate them.
3.3 Experiment methodology
Upon approval from the institutional review board (IRB) at Oregon State University (OSU), we conducted a controlled lab study to evaluate the described navigation techniques. Convenience sampling was utilized by posting flyers throughout the OSU campus and making announcements though university and department newsletters as well as advertising in the Virtual and Augmented Reality Club at OSU. The recruitees expressed their interest by filling out an online survey that besides collecting informed consent for participation also inquired about their demographics, previous VR experience, and their perception of VR. After filling out the questionnaire, the recruitees were contacted by the research team to schedule an in-person session. Figure 6 shows the flow of the interactive session. Each session started with a short introduction to the study’s purpose and process. The participants then watched a set of short voiced-over videos, prepared by the research team, that included a guide to the VR equipment and the task description. Before testing each technique, a further video informed the participants on how to use that technique. Participants were allowed to rewatch the videos and they had the opportunity to ask clarifying questions. Subsequently, participants practiced using the technique before performing the actual task. After finishing the task, the participants were asked to provide feedback by filling out different questionnaires. The process was repeated for each test condition with a short break in between. At the end of the session, a final post-experience questionnaire was filled out by the participant. Most sessions lasted roughly between 60 and 75 min, but a small number of them lasted slightly longer, mainly due to technical glitches. After concluding the interactive session, the participants were compensated for their time with a gift card.
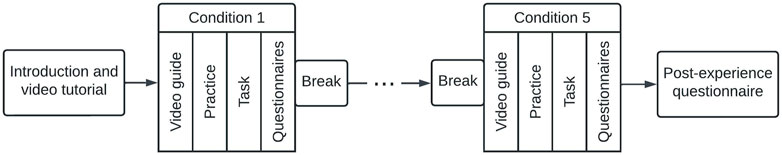
FIGURE 6. Flow of the interactive testing session.
We recruited 25 participants (13 women, 11 men, 1 genderqueer/non-binary) for our within-subject experiment. The age distribution of the participants is as follows: 18–25 (13), 26–35 (7), 36–45 (2), 46–55 (2), 56–65 (0), 66–75 (1). The majority of the participants had no or limited VR experience, with five (20%) never having experienced VR before and nine (36%) declaring to experience VR less than once per year. Seven participants (28%) use VR at least once per year and three (12%) use it at least once per month. Only one participant (4%) uses VR on a regular basis (i.e., on most days of the week). Among people who had prior VR experience, four (16%) had previously used either HTC Vive or Vive Pro (the system used for the experiment), while seven (36%) were not sure about the system they had previously used. We also asked our participants to rate their experience with VR or their perception of VR (if no prior experience). No participant had strongly negative experience/perception, and only one participant (4%) had somewhat negative experience/perception. The majority rated their experience/perception as either somewhat positive (10 participants, 40%) or strongly positive (6 participants, 24%). The remaining 8 (32%) stated to have neither a positive nor a negative mindset towards VR.
For the empirical evaluation, the availability of the interaction techniques is used as the independent variable. As seen in Table 1, five conditions have been defined accordingly. The first condition is the baseline teleportation, where the only interactions available to the user are the teleport and bird’s eye view. In the next three conditions, the teleportation is extended with exactly one of the assistive techniques. In the last condition, all the interactions are available. For simplicity, in the remainder of this manuscript, we use the letters T, M, P, X, and C to refer to these conditions. The order of testing conditions M, P, and X is chosen randomly for each participant to counter potential sequence effects. In contrast, due to their special nature, the conditions T and C are evaluated at the beginning and end of the session respectively. Each condition is tested with one task, which is preceded by a respective practice session.
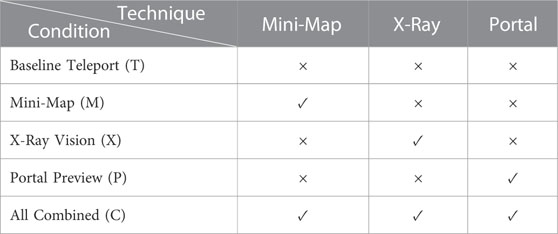
TABLE 1. Different conditions of the experiment and the corresponding availability of interaction techniques.
There are two types of dependent variables collected: objective and subjective data. The former are recorded by the developed VR application during runtime and are exported as a text file. The latter are self-reported measures that participants provide by filling out various questionnaires. The following objective measures are collected:
• Completion Time
• Traversed Distance
• Number of Teleports
• Number of Physical Turns
• Number of Collected Pellets
• Total Score
• Technique Utilization
Completion time of each task is the time elapsed until the task was concluded, which is capped at the timebox value. The traversed distance is the sum of all teleportation lengths (i.e., Euclidean distance between the locations before and after each teleport). Number of teleports specifies the number of times the user executed a teleport during each task. Number of physical rotations counts the number of times users physically changed their orientation by an angle larger than 45°. This value is collected by tracking the orientation of the VR headset. However, the count is only increased if the turn had an effect on the navigation, in other words, if the orientation of the headset was changed between two successive teleportations. In contrast, if the user turned their head (or their body) to look around but then continued teleporting in the same direction as before, a turn is not counted. Number of collected pellets, as the name suggests, refers to the number of pellets that were collected by the end of each task. Total score is the cumulative count of all points earned during a task. As mentioned before, a user loses their points when caught by a ghost. The total score metric, however, includes also the lost points. The reason for using this metric, rather the points retained by the end of the task, is that the locations and motions of the ghosts are highly randomized, and getting caught by a ghost is not an event that pertains to any of the assessed qualities of the techniques. Discarding the lost points would therefore introduce extraneous noise into the collected data.
Technique utilization records the frequency of using an individual interaction, and the particular measure is different for each technique. For Mini-Map, this metric is determined through the amount of time the user was looking at the map and the corresponding ratio to the total time spent searching for a teleport target. For this purpose, the eye tracking capability of Vive Pro Eye is utilized to record the time during which user’s eyes were gazing at the map. It has been reported that wearing glasses can reduce the precision of the eye tracking data, for example, due to reflection of lenses or partial absorption of infrared light by special coatings (Nyström et al., 2013). In our use case, we are interested in determining whether user’s gaze is towards the area where the map is visible rather than identifying the exact point they are gazing at. Therefore, our measurements are more robust against small noises, and hence we decided not to exclude people with corrected vision from our recruitment. In total, five of our participants (20%) wore glasses during the tests. The eye tracking was calibrated to participant’s eyes before practicing condition M. For three participants (12%), no eye tracking activity was recorded during the tests or the practice sessions. This is most likely due to technical issues or an imperfect fit of the headset (none of the three were wearing glasses). We removed these participants from the analyses that involved eye tracking data.
For X-Ray Vision, the tool utilization is defined as the number of times the user teleported to locations that would have been obscured by buildings without this tool. For Portal Preview, the tool utilization is measured using the number of times the portal was opened and the number of times the controller was used to make a turn larger than 45° while the portal was open.
The subjective measures are collected through these questionnaires: a custom navigation questionnaire, the System Usability Scale (SUS), the NASA Task Load Index (TLX). The questionnaires were administered through Qualtrics, and users filled them out on a computer after testing each condition. A further post-experience questionnaire was filled out at the end of the session, which asked the participants to rank the individual techniques based on the perceived usefulness and to identify which tools they would combine together if they had the option. Additionally, an optional open-ended question asked participants whether they had any further comments.
4 Results
In this section, the results of our user study are provided. The objective and subjective metrics are analyzed separately and the respective results discussed in the following.
4.1 Analysis of objective metrics
Figure 7 visualizes the average values for various objective metrics and compares them across different conditions. The error bars indicate the range of the standard deviation centered at the average. Furthermore, statistical tests are performed to verify whether the intervention had any effect on the dependent variables. As discussed earlier, the collected metrics are measured for five levels of a single independent variable in a paired (within-subject) design. With this setup, the parametric One-Way Repeated Measures ANOVA and the non-parametric Friedman test are among the candidates for detecting any potential statistical significance of differences between groups. The objective data are all of numerical type. The Shapiro–Wilk test was utilized for verifying the normality of the data, which indicated that none of the datasets had normal distribution. Therefore, parametric tests are deemed not applicable and the Friedman test is chosen as the appropriate method. Whenever a significant difference is detected, post-hoc analyses are performed for pairwise comparison of the individual conditions against the baseline teleportation. For this purpose, the non-parametric Wilcoxon signed-rank test is utilized. Table 2 provides the descriptive statistics of the measurements and summarizes the results of the statistical tests. These results are discussed in the following.
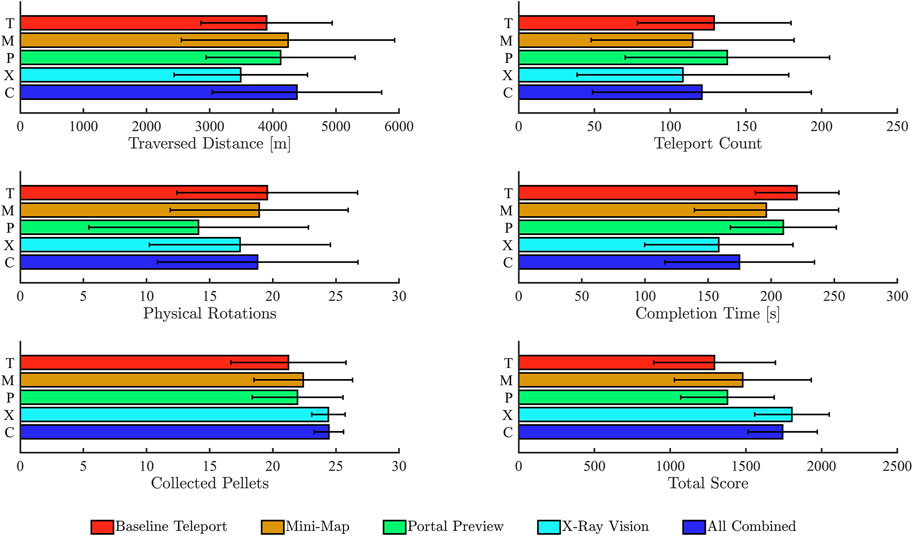
FIGURE 7. The average value of different objective metrics along with standard deviation bars.
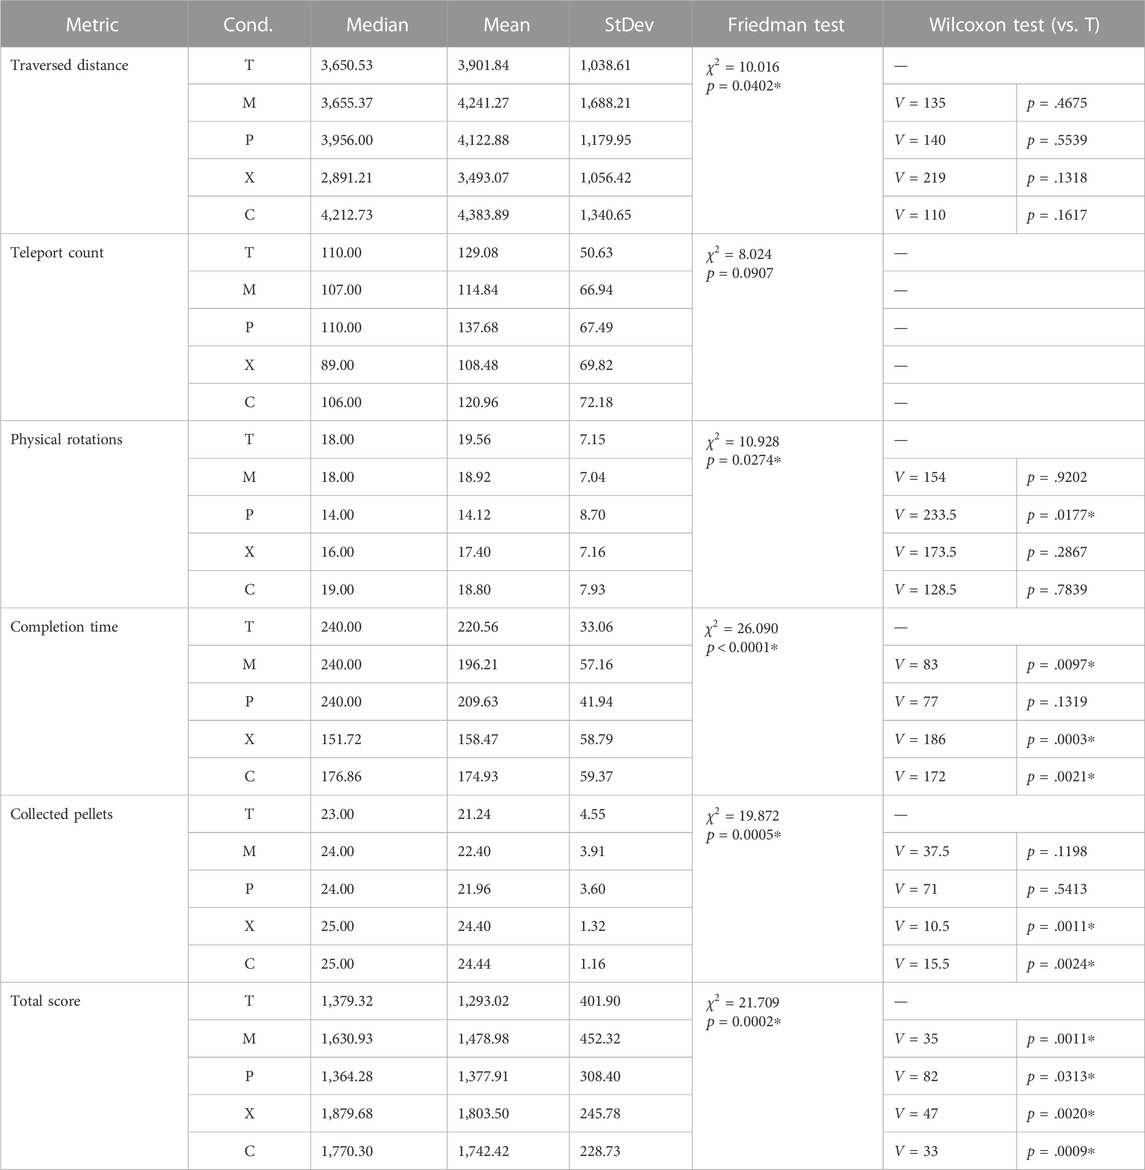
TABLE 2. Statistical test result of the objective measures. Asterisks (*) indicate statistical significance.
4.1.1 Traversed distance
As can be seen in Figure 7, the mean of the distance is lowest for condition X followed by T and P. Conditions M and C had the highest mean. As seen in Table 2, the Friedman test indicated a significant difference between the five groups, however, the post-hoc analysis with the Wilcoxon Signed Rank test, did not show a significant difference between the baseline teleport and any other individual condition. We did not anticipate that conditions M and C would in average require longer travel distances, as the Mini-Map is supposed to help the user make better wayfinding decisions. Since no significant difference was found in the pairwise comparison to the baseline, this increase may simply be due to the randomness of the experiment. However, it is worth discussing a tradeoff between the size of the area that is covered by the map versus the scale of the respective content. For the best wayfinding support, the map should cover a large area. Due to the limited size of the map, however, the content could become so small that some participants would have difficulty recognizing it. During our sessions, one participant mentioned that the content of the map matched well with the screen size that the map occupied. Therefore, extending the map to larger areas may not be a viable option. In those cases, offering a bird’s eye view tool would be helpful for supporting large-scale wayfinding activities, while the map would help with the local decision making. In line with this finding, one participant mentioned that the Mini-Map “was like a quicker, more handy version of the bird’s eye view.”
4.1.2 Number of teleports
When exploring in a large VE, a large number of teleportations are generally required, which can be perceived as mundane or tiresome. The Mini-Map aims to reduce this number by enabling users to make informed wayfinding decisions, while X-Ray vision tries to achieve this by letting users make a shortcut through large objects, such as buildings. Comparing the average number of teleportations, conditions X, M, and C, performed best, while users had to perform more teleportations during conditions T and P. Given the above explanation, this result is expected, however, the Friedman test did not detect a significant difference between the conditions. During the sessions, we observed multiple participants who teleported very rapidly with each teleport step spanning a short distance. This pattern can counter the benefits of the techniques and may be the reason for them not being as powerful as expected.
4.1.3 Number of physical rotations
Similar to the number teleporations, the number of times users have to move their body to change their orientation in the VE can also have a negative effect on their experience. For this measure, the application recorded the number of times the user changed their orientation by more than 45° by physically turning themselves. Our results, as depicted in Figure 7, show that condition P had a noticeably lower mean for this measure compared to other conditions. The Friedman test and the pairwise Wilcoxon tests confirm that condition P was the only condition with a significant difference compared to the baseline teleport. This result is plausible since Portal Preview is the only tool that directly aims to decrease this number by allowing users to change their orientation in the VE using the controllers.
4.1.4 Completion time
Condition T required on average the longest task time followed by P, M, C, and X respectively. The results of the Friedman test indicate significant difference among the conditions, and the post-hoc analysis indicated a significant difference for conditions M, X, and C compared to the baseline. It is worth pointing out that as seen in Table 2, the median for conditions T, M, and P is 240. This is due to the fact that the tasks were timeboxed at 240 s and indicates that during these conditions the majority of participants were not able to collect all the pellets within this timeframe. On the other hand, conditions X and C have a noticeably lower median, which highlights their strength in reducing the time needed for completing the tasks. It is reasonable to believe that if the participants were allowed to continue the tasks until all pellets were collected, conditions T, M, and P would have larger average and median values and the difference to X and C would be even more compelling.
To further investigate the effect of the navigation technique on task completion, we derive a new variable measuring participants’ success, which determines whether they were able to collect all the pellets before the time ran out. Eight participants (32%) succeeded in condition T. For conditions M and P, this number was 12 (48%), and for conditions X and C it was 18 (72%). We performed a Fisher’s exact test on these measurements, which confirmed that the null hypothesis of independence can be rejected (p = .0169). Hence, we can conclude that there is a relationship between the utilized technique and the success rate.
4.1.5 Number of collected pellets
The number of collected pellets indicates how successful a participant was in the search task. For each task, there were exactly 25 pellets available in the environment. The best result was achieved during condition X closely followed by C. The descending order of the remaining conditions is: M, P, and T. The Friedman test identified a significant difference among the five groups, and the post-hoc analysis showed that there was a significant difference for conditions X and C when compared to T.
4.1.6 Total score
Similar to the number of collected pellets, the total score is also an indicator of the success in the search task. However, due to the scoring scheme introduced earlier in this article, this metric is also a measure of the efficiency of the technique. The measurements follow the same pattern as the number of collected pellets. The highest average score was achieved in condition X followed by C, M, P, and T. The Friedman test showed a significant difference among the groups, and the pairwise comparison to T identified a significant difference for all conditions. This underscores the efficacy of the developed techniques in improving the effectiveness and efficiency of the conventional teleportation.
4.1.7 Utilization of techniques
The metric used for task utilization differs based on the specific interactions. For Mini-Map, we measured the time spent gazing at the map. In addition, we report the percentage of the gaze time relative to the time where the map was visible (i.e., during the search for a teleport target). As mentioned previously, these results are calculated using data from 22 participants due to missing eye tracking data for the other three participants. For condition M, participants on average spent 76.77 s gazing at the map, which was 48.51% of the time the map was visible. In other words, almost half of the search for a target location was conducted using the Mini-Map. For condition C, these values are 26.96s and 23.31% respectively. The lower value for the combined condition can be explained by the fact that in this condition the user could rely on other techniques (e.g., the X-Ray Vision) to make the search process easier and reduce the need for looking at the map.
For X-Ray vision, we measured the number of times the participant teleported behind a building (i.e., teleportation that would not be possible without X-Ray vision). This number was on average nine for condition X and 8.04 for condition C. That is on average 10.57% and 9.67% of all teleports performed during conditions X and C respectively.
For Portal Preview, the number of times the participants opened the Portal was recorded. Our participants on average opened the Portal 6.16 times during condition P and .44 times during condition C. Comparing these numbers to the total number of teleportations each participant performed per task shows that an average of 5.44% of the teleportations in condition P were made utilizing the portal. For condition C, this value is considerably smaller at .43%. Another measure that we looked at was the frequency of users reorienting themselves virtually using the Portal relative to the number of times the Portal was opened during that task. We determined that in condition P, 39.38% of the times the Portal was opened a rotation of greater than 45° was performed using the controller. For condition C, this value is noticeably higher, with 64.29% of Portal usage being associated with a virtual rotation. Considering the small number of times the Portal Preview was used during condition C, we can reason that the participants utilized this tool very selectively and mainly with the purpose of turning themselves in the VE. This pattern is consistent with the observations we made during the sessions. Additionally, as discussed previously, condition P was the only condition where the number of physical turns made by the user was significantly less than those in condition T. Based on these findings, we can conclude that although the Portal was not utilized very frequently, the users could still benefit from it by reducing the physical strain.
4.2 Analysis of subjective metrics
After experiencing each condition, participants filled out three questionnaires. The first one is a custom navigation questionnaire, which is discussed as next. The other two questionnaires (NASA TLX and SUS) are discussed subsequently followed by the results of the post-experience questionnaire, which was filled out at the end of the sessions.
4.2.1 Navigation questionnaire
This questionnaire includes ten questions with a 5-step Likert scale. The steps are labeled not at all, slightly, moderately, somewhat, and extremely corresponding to ordinal values one through five. For each question, these labels are extended with the relevant keyword from the question (e.g., somewhat difficult or extremely demanding). The recorded responses are evaluated with the same procedure as the objective measures (i.e., Friedman test and post-hoc Wilcoxon signed-rank test if necessary). Figure 8 visualizes the average values along with standard deviation bars, and Table 3 summarizes the statistical analysis of the data.
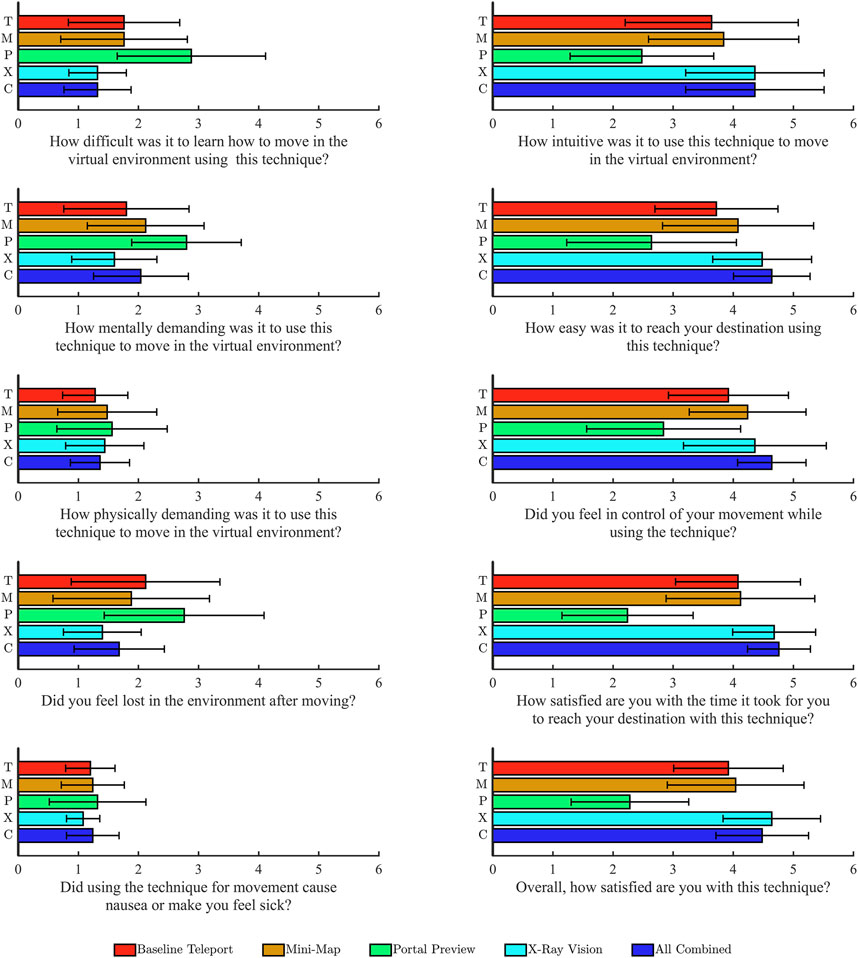
FIGURE 8. The average value of different subjective metrics along with standard deviation bars.
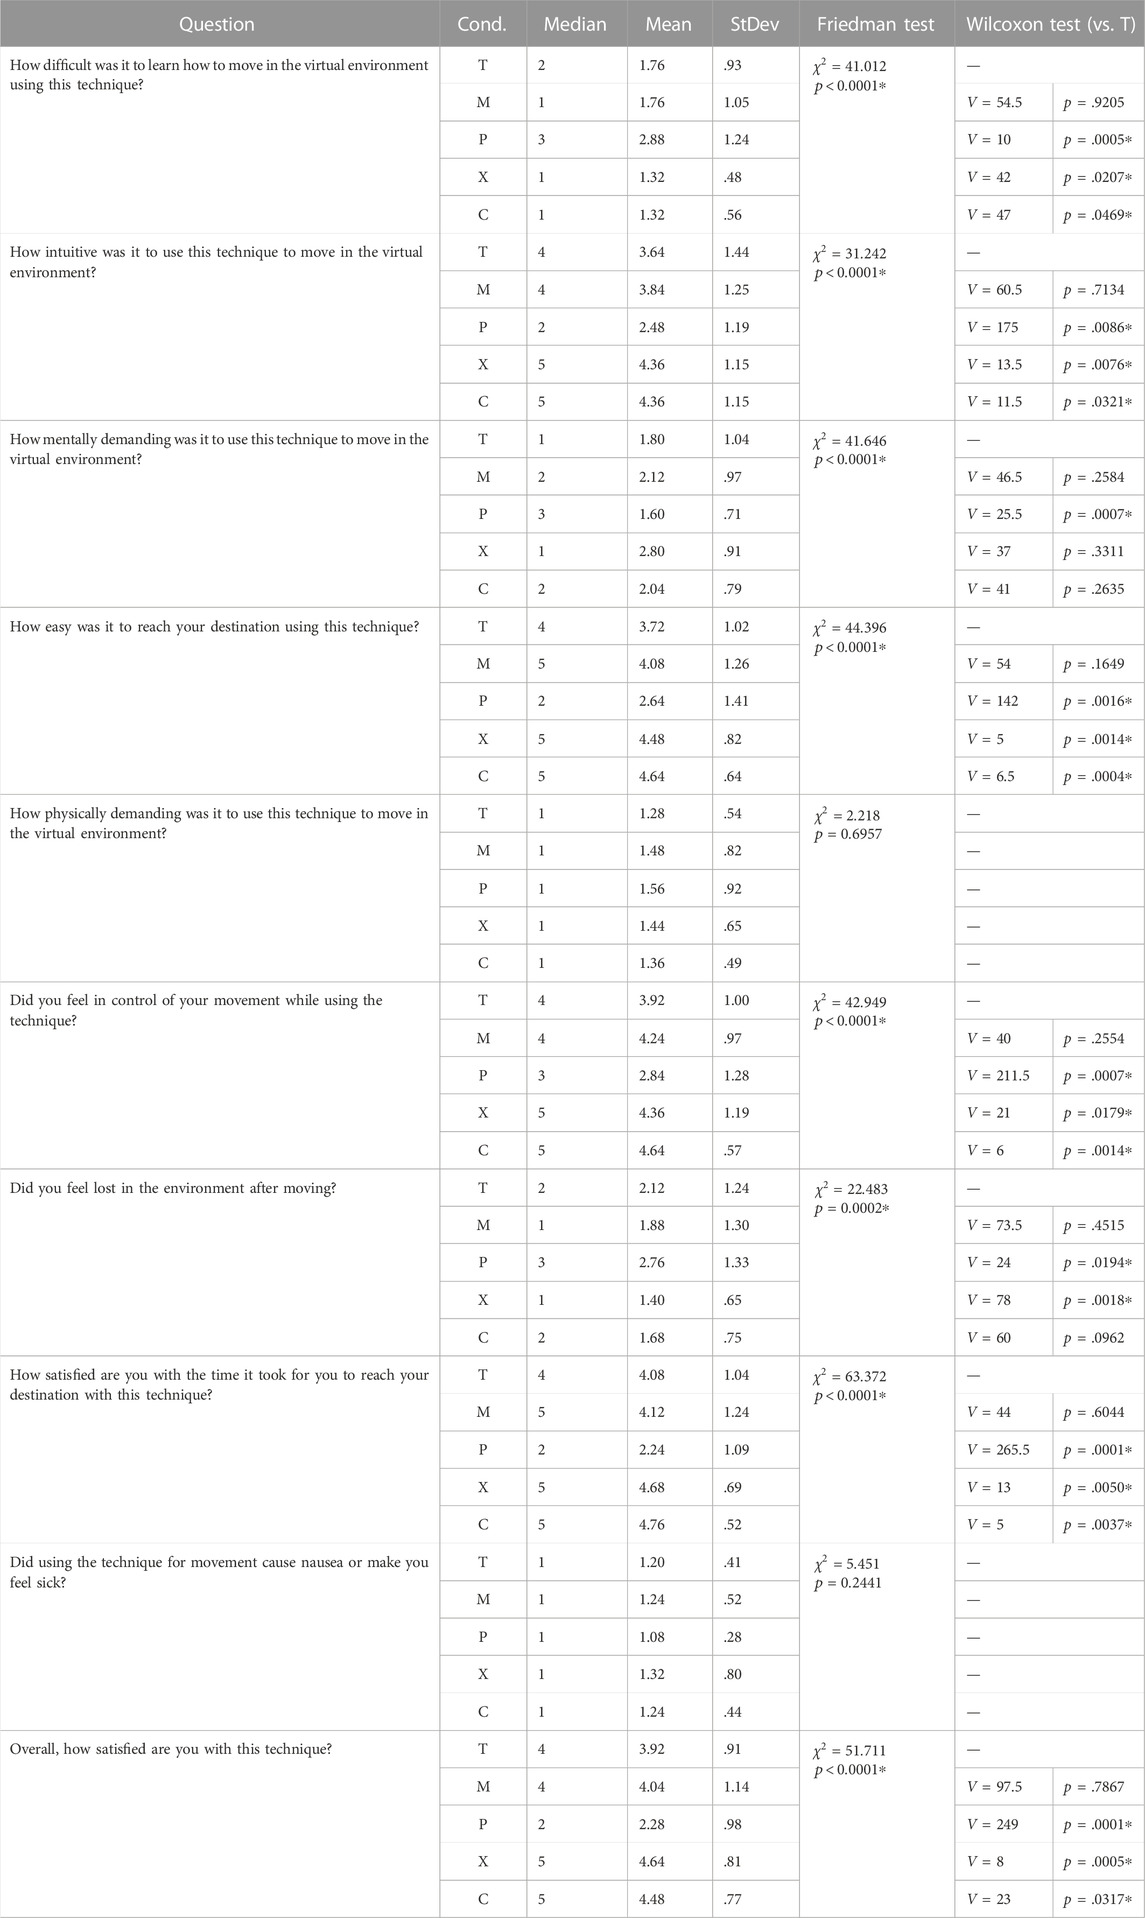
TABLE 3. Statistical test result of the navigation questionnaire. Asterisks (*) indicate statistical significance.
Regarding the difficulty of learning how to move in the environment, a significant difference between the conditions was detected. The post-hoc analysis revealed that all conditions except M showed a significant difference in the pairwise comparison to T. Additionally, the mean for condition P was significantly higher than T, making it the most difficult interaction to learn. M and T had the same average value, while X and C shared the lowest difficulty ranking. The intuitiveness of the techniques showed the same pattern. Condition M ranked slightly better than T, but there was no significant difference detected. P was significantly less intuitive than T, while X and C were significantly more intuitive.
Motion sickness can be a serious challenge when navigating large VR spaces, therefore we inquired about the level of nausea experienced when utilizing different techniques. The ascending average level of induced nausea caused by conditions is as follows: X, T, M and C (tie), and P. Although there was no statistical significance detected, the fact that M, C and P performed slightly worse than the traditional teleport is reasonable. Both the Mini-Map and the Portal create a virtual window in the 3D space that shows a live feed of some part of the VE. For performance reasons, the frame rate of this window was set lower than the frame rate of the scene render, which can increase the risk of motion sickness.
No significant difference was detected for the physical demand of the individual conditions either. The techniques are ranked based on the mean value from least to most demanding as follows: T, C, X, M, P. With regards to the mental demand associated with each technique, the Friedman test identified a significant difference among the groups. X-Ray vision was the only technique that performed better than the baseline teleport, but the difference was not found to be significant according to the Wilcoxon test. Condition P, however, imposed significantly more mental demand in comparison to T. This is plausible due to the fact that using this technique is more involved and the user has to remember more types of interactions compared to other techniques. According to one participant, “the portal technique would definitely take awhile to get used to.”
Additionally, our results show that the participants felt significantly less in control when teleporting using the Portal. Based on our observations, we believe that this is mainly due to the perceived difficulty of specifying the desired orientation using the trackpad. The process is further complicated by the fact that the point of view of the Portal is determined based on the input from the trackpad as well as the orientation of the head, which was designed this way to allow the user to look around at the destination point by simply rotating their head and without utilizing the controller. However, some participants found this interaction unintuitive. As one participant put it: “It was hard to use […] I was confused that you can move your head but can also move the trackpad.” The other techniques performed better than the baseline, and while condition M did not experience a statistically significant improvement, conditions X and C were significantly better than condition T, and condition C yielded the highest average score. This same pattern was observed when we asked the participants how easy it was to reach their destination in the VE.
The potential disorientation after a teleport can be detrimental to the sense of presence. We asked our participants how lost they felt after moving. Among the tested techniques, X-Ray vision was most successful in alleviating this effect. Conditions M and C both showed an improvement relative to the baseline, but no significance emerged in the post-hoc analyses for either of them. On the other hand, P performed significantly worse than T. We expected the Mini-Map to mitigate the loss of orientation more effectively compared to the other techniques as it is designed to provide an overview of the surroundings. One possible explanation for the fact that X and C performed better is that they better preserve the spatial awareness in the environment, while a map only provides the 2D representation. One of our participants pointed out that they were mostly paying attention to the map instead of looking at the environment, which made the experience more 2D than 3D and, in their words, less fun. Additionally, utilizing the map leads to a visual attention switch (Giannopoulos et al., 2015), which can impose a higher cognitive load.
To inquire about the perceived efficiency of the different tools, we asked participants how satisfied they were with the time it took to reach a destination. Based on the responses, the conditions are ranked from least to most satisfactory in the following order: P, T, M, X, C. All conditions except M were significantly different from condition T. This ranking deviates from the objective metric of completion time, where T took the longest for completing the task and X the shortest. In terms of overall satisfaction, condition X had the highest ranking followed by C, M T, P. As with the previous metric, all conditions but M showed statistical significance in the pairwise comparison to T.
4.2.2 NASA TLX
The NASA TLX questionnaire was administered after experiencing each condition to assess what effect the utilized technique had on the perceived workload of the tasks. This questionnaire includes six relevant dimensions: mental demand, physical demand, temporal demand, performance, effort, and frustration. The summary of statistical tests of participants’ responses can be found in Table 4. Based on the average rating, the participants perceived the lowest mental demand during condition X, followed by M and C in a tie. Condition T was ranked fourth followed by P with a large gap in between. The Friedman test showed significant difference among conditions, and the post-hoc analyses revealed the presence of significant difference in conditions X and P when compared to the baseline. Hence, while X-Ray Vision significantly reduced the amount of mental demand, Portal Preview had the opposite effect and imposed a considerably high mental workload.
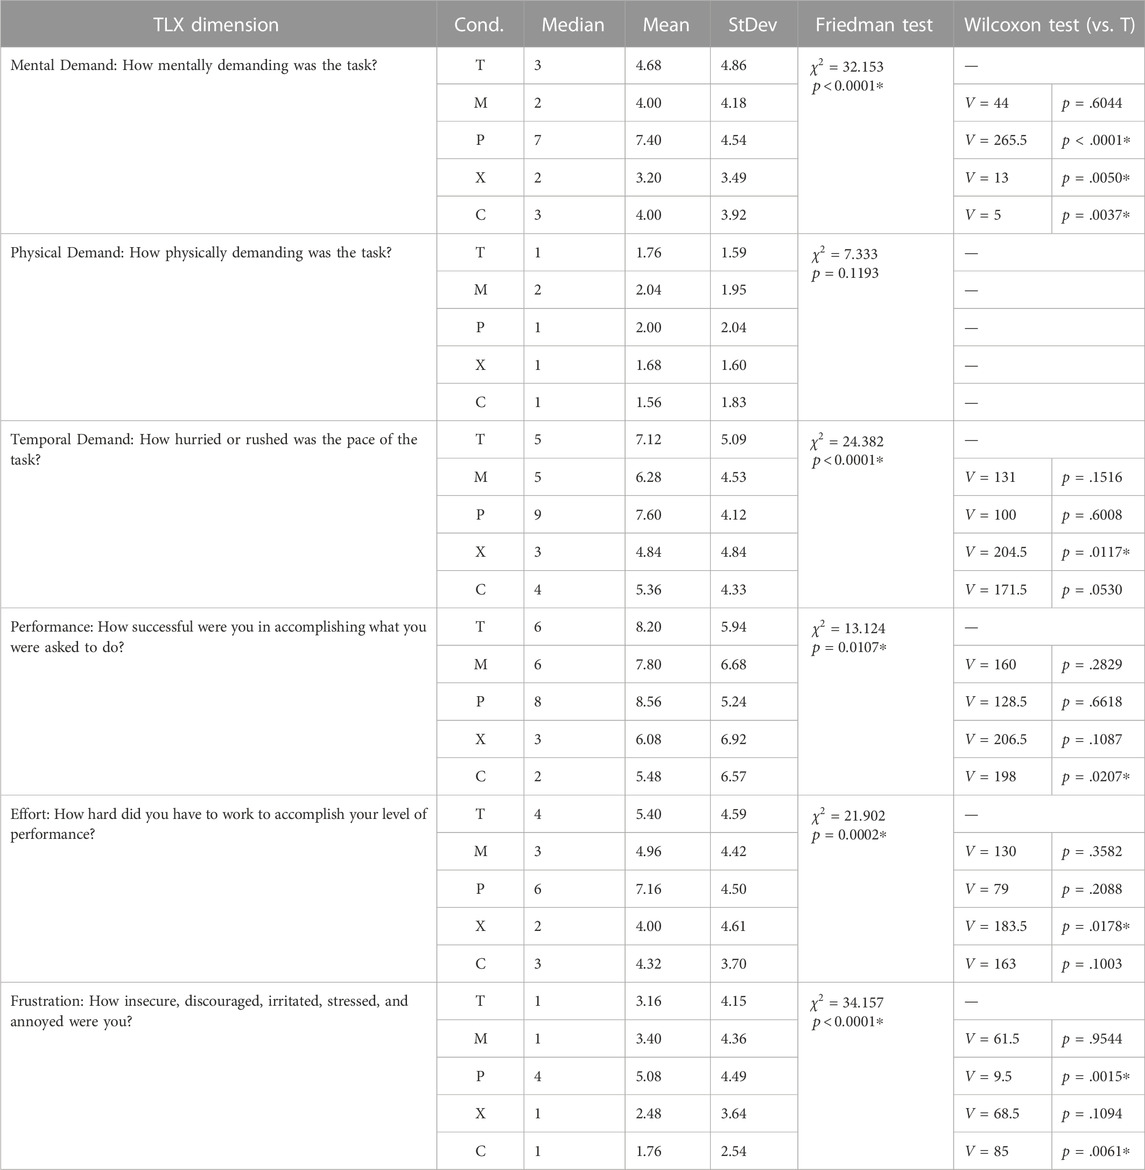
TABLE 4. Statistical test result of NASA TLX. Asterisks (*) indicate statistical significance.
The lowest average physical demand was experienced in condition C followed by X, T, P, and M. There was, however, no significant difference detected by the Friedman test. Regarding temporal demand, the participants felt least hurried during condition X followed by C, M, T, and P. Based on the post-hoc analyses, the only condition that showed a significant difference was X. The ranking of the effort followed the same pattern.
In terms of avoiding frustration, condition C performed best, followed by X, T, M, and P. The Wilcoxon test determined that there was significant difference for conditions C and P. Lastly, the participants perceived being most successful during condition C followed by X, M, T, and P. The only condition that showed a significant difference in the pairwise analyses was C.
Summarizing these findings, X-Ray vision was the most successful tool for reducing the mental and temporal demand as well as the required effort. On the other hand, combining all techniques performed better in improving participants’ perception of their own success and lowering their frustration.
4.2.3 SUS
To be able to assess the usability of each of the techniques with a standardized tool, the participants filled out the System Usability Scale (SUS) questionnaire after concluding each condition. The participants were asked to answer the questions for the tested navigation technique as a package (e.g., teleportation combined with X-Ray Vision). The results of the survey are provided in Table 5.
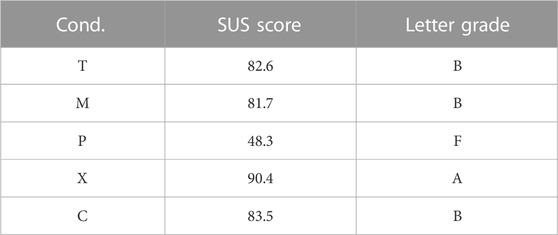
TABLE 5. The SUS score for all conditions and the corresponding letter grade.
The Portal Preview scored 48.3, which corresponds to a failing grade of F based on the scale provided in (Bangor et al., 2009). Mini-Map achieved a score of 81.7 closely followed by traditional teleport and the combination of all techniques. These scores are all associated with a B grade. The highest score was awarded to the X-Ray vision, the only technique that received an A. These results are similar to the results from the self-reported satisfaction measure as reported earlier with the difference that there, M scored slightly higher than T but with no statistical significance.
4.2.4 Ranking of the techniques
After concluding all conditions, participants were asked to rank the three assistive tools (Mini-Map, Portal-Preview, and X-Ray vision) based on their preference. A large majority of the participants (76%) chose the X-Ray vision as their first choice followed by Mini-Map (24%). Twenty four participants (96%) chose the Portal Preview as their third choice. Figure 9 visualizes these results.
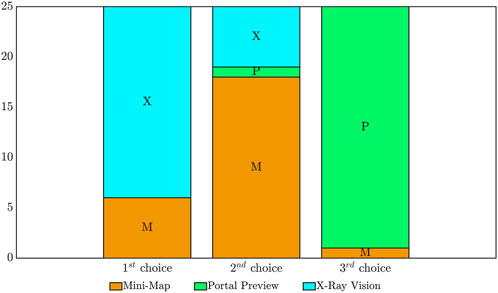
FIGURE 9. Ranking of the techniques based on participants’ preference.
4.2.5 Choice of available tools
We also asked the participants to identify how they would combine the available tools with each other. More specifically, we asked them to specify how they would extend the teleportation with the tested assistive tools. Participants were able to choose any of the possible six combinations (including the combination of all tools), but only four different combinations emerged from the responses. As seen in Figure 10, the combination of Mini-Map and X-Ray vision (in addition to teleport) was by far the most common answer (84%). Notably, none of the participants chose to combine all three assistive tools together. Our interpretation of this result is that having too many options may overwhelm the user. As one of our participants said, it was “a bit overwhelming to have all the different types of navigation tools in the way.”
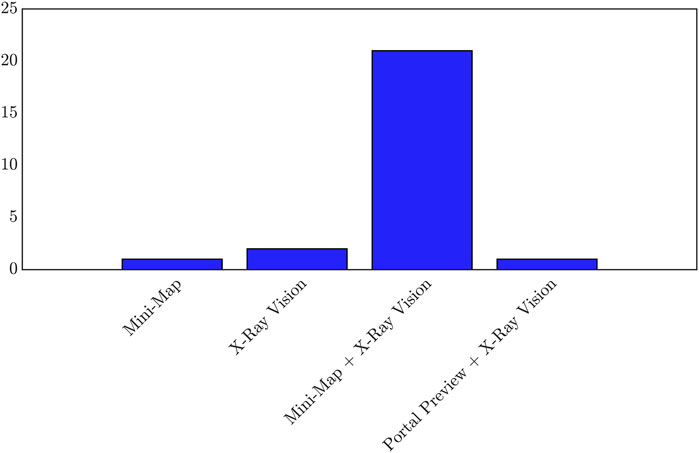
FIGURE 10. Participant’s preference for combining individual techniques.
5 Discussion
The analyses of our empirical data show that extending the teleportation can have a positive effect on both efficiency and usability of the navigation technique when traversing large urban VEs. In the following, we summarize the insights gained regarding each of the tested techniques and discuss their implications.
Among the tested extensions, X-Ray Vision is the most promising. By letting users see through buildings that would otherwise obscure their view, this technique allows them to make better wayfinding decisions. Additionally, users can teleport behind these buildings, which improves the efficiency of the travel component of navigation. The collected data show that with regards to all the objective metrics, except for the total number of collected pellets, X-Ray Vision performed best. In the case of completion time and the total score, the improvements relative to the baseline teleport were statistically significant. These results are consistent with the results of the study done by Chittaro and Scagnetto (2001) who evaluated navigating indoor VEs using a desktop-VR setting and found that making the walls semi-transparent significantly improved the navigation performance. The X-Ray Vision performed equally well with regards to the subjective measures. Our participants consistently gave their best rating to either the X-Ray or the combination of all techniques. In line with these findings, X-Ray Vision was the only extension that received an A-rating for its usability based on the respective SUS score, and 76% of the participants picked this technique as their first choice among the tested conditions. When asked which extensions the participants would combine together, there was only one participant who picked an option that did not include the X-Ray vision. The favorable rating was also reflected in the participants’ comments, who stated that they “liked being able to cut corners,” and that this technique “made it a lot easier to navigate” and it made it “easier to locate the objects, and since movement across the buildings are also allowed, that makes it even more easy to hit the target sooner.” Two other participants agreed that it felt “like cheating” since this tool made it “almost too easy.”
The Mini-Map has also great potential for improving the performance of traditional teleport. This tool reduced the task time with statistical significance when compared to the basic teleport. Similarly, the total score was significantly improved when this feature was available, which is an indication of its effectiveness and efficiency. Zagata et al. (2021) asserted that longer examination of the map negatively affects the efficiency of navigation. This finding is intuitive since the time spent viewing a map directly adds to the total task time. That study did not include a condition without the map, which makes it difficult to assess whether providing the map is overall beneficial. In our study, however, the comparison of the performance metrics for the conditions M and T shows that facilitating the Mini-Map indeed improves both efficiency and effectiveness. This improvement may partially be attributed to Mini-Map’s potential to support users with building and maintaining a more accurate mental map of the space. Kraus et al. (2020) showed that a map improves task completion time as well as user’s memorization and retracing ability in certain tasks. However, those results may not entirely be applicable to our setup, since the map utilized in that study covered the entirety of the navigable space, trading off the visibility of individual scene components for a global overview.
With respect to the subjective measures, this technique was less successful. For many measures, the Mini-Map performed comparably to the traditional teleportation or only slightly better with no significant effect. There are multiple potential reasons for this evaluation. The previously discussed motion sickness due to the map frame rate is one of them. Another reason could be the placement of the map in the 3D space. One participant found that “it is a little hard to have both the map and screen at the same time,” and another participant pointed out that “it might be better suited in a stagnant location like one of the corners of the screen.” Nevertheless, we could observe that map was beneficial not only for finding the closest pellets, but also for making higher-level wayfinding decisions. One participant mentioned that they were thinking about an algorithm for finding the shortest path connecting multiple close by pellets. Another interesting pattern that we observed was that multiple participants used the map also for increasing their precision when choosing the teleport target. As one participant put it, “it made it a lot easier to get to [the pellets] faster and more accurately.” The positive evaluation of the Mini-Map is also reflected in participants’ response to the question regarding the tools they would like to combine together. While only one participant preferred the Mini-Map to be the sole available extension, 21 participants (84%) chose the Mini-Map combined with X-Ray as their preferred combination.
The Portal Preview was the least successful feature we tested. Overall, this technique performed better than the basic teleport with regards to the objective measures, but the only metrics that showed statistical significance were the number of physical rotations and the total score. The subjective evaluations indicated that this technique performed worse than the teleportation concerning multiple measures. One main reason for the poor evaluation was that this tool requires some extra time for operating. This includes the time that the user has to hold the button to open the portal and the time required for selecting the desired orientation. It is understandable that in a fast-paced scenario some users may find the tool rather hindering than helpful. This criticism was also evident in multiple participants’ comments: “It didn’t seem worth it to use the portals, because it would take a long time”; “it is easier and faster to go without it”; “it would be much faster for me to just swivel my head and move my body instead of using the portal”.
Nevertheless, we believe that users would benefit from a tool that allows them to turn themselves virtually. As discussed earlier, despite the infrequent utilization of the Portal Preview, this tool was able to significantly reduce the number of times that the participants had to make a physical turn. We observed multiple participants during condition P who changed their orientation primarily through the portal rather than turning themselves physically, and one participant mentioned that they “did like being able to change orientation within the teleportation”. In a study comparing the physical rotation to various instances of discrete and continuous virtual rotations, Wolf et al. (2021) found that the physical rotation was more efficient, however, participants favored three of the discrete virtual rotation conditions over the physical one. We therefore believe that facilitating both physical and virtual rotations may accommodate users’ needs best. However, more research in this regard is needed. Another reason for the unfavorable evaluation of the Portal Preview was the motion sickness caused by the continuous rotation using the trackpad as well as the lower frame rate of the portal window, as discussed earlier. As the findings of Wolf et al. (2021) suggest, replacing the continuous rotation with discrete rotational steps may be a solution. Additionally, some participants found the approach for choosing the desired orientation “confusing,” and another participant felt that it would “take a while to get used to” it. Therefore, more familiarization with this tool may be necessary before users are able to fully benefit from it. Moreover, based on our observations and participants’ feedback, the main reason for opening the portal was to change the orientation and not for previewing the destination. In the literature, there is no conclusive evidence on what impact portals have on the sense of orientation. The preview mechanism developed by Elvezio et al. (2017) was not empirically evaluated. The redirected teleportation method proposed by Liu et al. (2018) caused higher disorientation, but it is not possible to determine the effect of the portal preview in isolation from other confounding components. Atkins et al. (2021) also utilized a portal metaphor. However, the proposed portal was used for visualizing the flow of a continuous motion rather than previewing the target location. No significant difference was found in that study between the portal technique and the teleportation with respect to spatial awareness.
Combining multiple extensions can have great value for the users. There were participants who “liked having all the techniques of looking around and moving available” and felt that “it was great using all of them together”. Each tool has its strengths and weaknesses, and each one is more suitable for a different scenario. Providing different navigation methods allows the user to utilize the one that seems most appropriate for a given situation. For example, one participant found that “the X-Ray technique made it a lot easier to navigate and the Mini-Map technique made it easier to find the last few pellets on the map”. This strategy is in line with the findings of Danyluk and Willett (2019), who recommend providing different navigation techniques for supporting different tasks and scenarios. Nevertheless, as discussed earlier, having multiple features and interactions enabled can also overwhelm the user. In our experiment, none of the participants chose the combination of all features as their preferred option, whereas the combination of Mini-Map and X-Ray Vision was strongly desired. Therefore, the choice of available tools has to be made carefully, considering the added value of each feature in tradeoff to the mental and physical demand imposed upon users. It is also noteworthy that the combination of all techniques had a significant positive effect on exactly the same objective metrics that were also significantly affected by the X-Ray Vision individually. This could be an indication that the bulk of the improvements to the task metrics may be afforded by the X-Ray Vision.
6 Conclusion
In this research, we investigated the efficiency and usability of enhanced versions of the teleportation technique for navigating large virtual urban environments. There exists limited research seeking to study the navigation in the context of virtual urban spaces or attempting to adapt the navigation techniques to these environments. Therefore, our results are expected to contribute to the design of future interaction techniques for Metaverse applications representing virtual cities. For this work, we designed and developed three interaction techniques that extend the teleportation and conducted a controlled lab study with 25 participants to assess how they affect the navigation. Our analysis of the collected empirical data confirms that these extensions can significantly improve teleportation’s usability and increase the navigation efficiency in large urban VEs. Overall, the X-Ray Vision performed best among the tested extensions. By allowing users to see through the buildings and teleport to locations that would otherwise be obscured by them, this technique improves both wayfinding and travel. A significant positive effect on various task metrics was detected and users consistently ranked this extension above the baseline teleportation, which is also reflected in the fact that this extension received the highest SUS usability score among all tested conditions. Most participants chose this technique as their first choice for extending the teleportation. The Mini-Map had a significant effect on reducing the task completion time and increasing users’ total score, confirming a positive impact on the wayfinding by providing a top-down view of users’ surroundings. Based on the self-reported measures, however, no significant effect was detected on the perceived usability of the navigation technique. The Portal Preview had a significant effect on reducing the number of physical rotations and increasing the total score. The former metric is particularly noteworthy as it indicates that the primary objective for using the portal was to perform virtual rotations and hints at users’ desire for the availability of a virtual rotation mechanism in addition to the physical turning. On the other hand, the questionnaire responses show that this technique significantly lowered the rating of a number of usability metrics. Combining all the techniques together significantly improved several objective and subjective measures and received the second highest SUS score. However, when participants were asked how they would combine the tested extensions, none of them chose the combination of all techniques as their preferred choice. This shows that facilitating numerous capabilities and interfaces is not necessarily a desired option, and interaction designers need to critically gauge the value that each interaction adds to the user experience. In our experiment, extending the teleportation with X-Ray Vision and Mini-Map was by far the most preferred combination.
Data availability statement
The anonymized raw data supporting the conclusion of this article will be made available by the authors, upon request.
Ethics statement
The studies involving human participants were reviewed and approved by Human Research Protection Program, Institutional Review Board—Oregon State University. The patients/participants provided their written informed consent to participate in this study.
Author contributions
RD was responsible for this research’s conceptualization, overseeing the experiment, and securing funding. RD also contributed to the design of the software, the experiment design, and writing the manuscript. AS contributed to the design and development of the software, the experiment design, carrying out the experiment, data collection and analyses, and writing the manuscript.
Acknowledgments
We would like to thank the participants of our user study for their valuable feedback. We are also thankful to Vaishnavi Rangarajan for her contribution to the experiment design and preparation as well as Jordan Henstrom for his feedback on the study.
Conflict of interest
The authors declare that the research was conducted in the absence of any commercial or financial relationships that could be construed as a potential conflict of interest.
Publisher’s note
All claims expressed in this article are solely those of the authors and do not necessarily represent those of their affiliated organizations, or those of the publisher, the editors and the reviewers. Any product that may be evaluated in this article, or claim that may be made by its manufacturer, is not guaranteed or endorsed by the publisher.
Supplementary material
The Supplementary Material for this article can be found online at: https://www.frontiersin.org/articles/10.3389/frvir.2022.1075811/full#supplementary-material
Footnotes
1https://about.fb.com/news/2021/10/founders-letter
References
Adhikari, A., Zielasko, D., Aguilar, I., Bretin, A., Kruijff, E., Heyde, M. v. d., et al. (2022). Integrating continuous and teleporting VR locomotion into a seamless HyperJump paradigm. IEEE Trans. Vis. Comput. Graph. 1, 1–17. doi:10.1109/TVCG.2022.3207157
Allam, Z., Sharifi, A., Bibri, S. E., Jones, D. S., and Krogstie, J. (2022). The Metaverse as a virtual form of smart cities: Opportunities and challenges for environmental, economic, and social sustainability in urban futures. Smart Cities 5, 771–801. doi:10.3390/smartcities5030040
Atkins, A., Belongie, S., and Haraldsson, H. (2021). “Continuous travel in virtual reality using a 3D portal,” in The adjunct publication of the 34th annual ACM symposium on user interface software and technology (virtual event USA: ACM), 51–54. doi:10.1145/3474349.3480227
Bangor, A., Kortum, P., and Miller, J. (2009). Determining what individual SUS scores mean: Adding an adjective rating scale. J. Usability Stud. 4, 114. doi:10.5555/2835587.2835589
Bhandari, J., MacNeilage, P., and Folmer, E. (2018). Teleportation without spatial disorientation using optical flow cues. Proc. Graph. Interface 6, 230–237. doi:10.20380/GI2018.22
Bibri, S. E., and Allam, Z. (2022). The Metaverse as a virtual form of data-driven smart urbanism: On post-pandemic governance through the prism of the logic of surveillance capitalism. Smart Cities 5, 715–727. doi:10.3390/smartcities5020037
Boletsis, C., and Cedergren, J. E. (2019). VR locomotion in the new era of virtual reality: An empirical comparison of prevalent techniques. Adv. Human-Computer Interact. 2019, 1–15. doi:10.1155/2019/7420781
Boletsis, C., and Chasanidou, D. (2022). A typology of virtual reality locomotion techniques. Multimodal Technol. Interact. 6, 72. doi:10.3390/mti6090072
Boletsis, C. (2017). The new era of virtual reality locomotion: A systematic literature review of techniques and a proposed typology. Multimodal Technol. Interact. 1, 24. doi:10.3390/mti1040024
Bowman, D. A., Kruijff, E., LaViola, J. J., and Poupyrev, I. (2001). An introduction to 3-D user interface design. Presence Teleoperators Virtual Environ. 10, 96–108. doi:10.1162/105474601750182342
Bozgeyikli, E., Raij, A., Katkoori, S., and Dubey, R. (2019). Locomotion in virtual reality for room scale tracked areas. Int. J. Human-Computer Stud. 122, 38–49. doi:10.1016/j.ijhcs.2018.08.002
Bozgeyikli, E., Raij, A., Katkoori, S., and Dubey, R. (2016). “Point & teleport locomotion technique for virtual reality,” in Proceedings of the 2016 annual symposium on computer-human interaction in play (Austin Texas USA: ACM). doi:10.1145/2967934.2968105
Buttussi, F., and Chittaro, L. (2021). Locomotion in place in virtual reality: A comparative evaluation of joystick, teleport, and leaning. IEEE Trans. Vis. Comput. Graph. 27, 125–136. doi:10.1109/TVCG.2019.2928304
Caputo, A., Borin, F., and Giachetti, A. (2019). A comparison of navigation techniques in a virtual museum scenario. Eurogr. Workshop Graph. Cult. Herit. 8, 1348. doi:10.2312/GCH.20191348
Chandler, T., Cordeil, M., Czauderna, T., Dwyer, T., Glowacki, J., Goncu, C., et al. (2015). “Immersive analytics,” in 2015 big data visual analytics (BDVA) (Hobart, Australia: IEEE), 1. doi:10.1109/BDVA.2015.7314296
Chen, S., Miranda, F., Ferreira, N., Lage, M., Doraiswamy, H., Brenner, C., et al. (2021). UrbanRama: Navigating cities in virtual reality. IEEE Trans. Vis. Comput. Graph. 1, 4685–4699. doi:10.1109/TVCG.2021.3099012
Chittaro, L., and Scagnetto, I. (2001). “Is semitransparency useful for navigating virtual environments?,” in Proceedings of the ACM symposium on Virtual reality software and technology - vrst ’01 (Baniff, Alberta, Canada: ACM Press), 159. doi:10.1145/505008.505039
Cmentowski, S., Krekhov, A., and Krüger, J. (2019). “Outstanding: A multi-perspective travel approach for virtual reality games,” in Proceedings of the annual symposium on computer-human interaction in play (Barcelona Spain: ACM), 287–299. doi:10.1145/3311350.3347183
Çöltekin, A., Oprean, D., Wallgrün, J. O., and Klippel, A. (2019). Where are we now? Re-Visiting the digital earth through human-centered virtual and augmented reality geovisualization environments. Int. J. Digital Earth 12, 119–122. doi:10.1080/17538947.2018.1560986
Coomer, N., Bullard, S., Clinton, W., and Williams-Sanders, B. (2018). “Evaluating the effects of four VR locomotion methods: Joystick, arm-cycling, point-tugging, and teleporting,” in Proceedings of the 15th ACM symposium on applied perception (Vancouver British Columbia Canada: ACM), 1. doi:10.1145/3225153.3225175
Cruz-Neira, C., Sandin, D. J., DeFanti, T. A., Kenyon, R. V., and Hart, J. C. (1992). The CAVE: Audio visual experience automatic virtual environment. Commun. ACM 35, 64–72. doi:10.1145/129888.129892
Dalton, R. C. (2003). The secret is to follow your nose: Route path selection and angularity. Environ. Behav. 35, 107–131. doi:10.1177/0013916502238867
Danyluk, K., and Willett, W. (2019). “Evaluating the performance of virtual reality navigation techniques for large environments,” in Advances in computer graphics. Editors M. Gavrilova, J. Chang, N. M. Thalmann, E. Hitzer, and H. Ishikawa (Cham: Springer International PublishingLecture Notes in Computer Science), 203–215. doi:10.1007/978-3-030-22514-8_17
Darken, R., and Cevik, H. (1999). Map usage in virtual environments: Orientation issues.” in Proceedings IEEE virtual reality. 133–140. doi:10.1109/VR.1999.756944
Darken, R. P., Cockayne, W. R., and Carmein, D. (1997). “The omni-directional treadmill: A locomotion device for virtual worlds,” in Proceedings of the 10th annual ACM symposium on User interface software and technology - uist ’97 (Banff, Alberta, Canada: ACM Press), 213. doi:10.1145/263407.263550
Dionisio, J. D. N., Iii, W. G. B., and Gilbert, R. (2013). 3D virtual worlds and the Metaverse: Current status and future possibilities. ACM Comput. Surv. 45, 1–38. doi:10.1145/2480741.2480751
Elmqvist, N., and Tsigas, P. (2008). A taxonomy of 3D occlusion management for visualization. IEEE Trans. Vis. Comput. Graph. 14, 1095–1109. doi:10.1109/TVCG.2008.59
Elvezio, C., Sukan, M., Feiner, S., and Tversky, B. (2017). “Travel in large-scale head-worn VR: Pre-oriented teleportation with WIMs and previews,” in 2017 IEEE virtual reality (VR) (Los Angeles, CA, USA: IEEE), 475–476. doi:10.1109/VR.2017.7892386
Frommel, J., Sonntag, S., and Weber, M. (2017). “Effects of controller-based locomotion on player experience in a virtual reality exploration game,” in Proceedings of the 12th international conference on the foundations of digital games (Hyannis Massachusetts: ACM), 1. doi:10.1145/3102071.3102082
Funk, M., Müller, F., Fendrich, M., Shene, M., Kolvenbach, M., Dobbertin, N., et al. (2019). “Assessing the accuracy of point & teleport locomotion with orientation indication for virtual reality using curved trajectories,” in Proceedings of the 2019 CHI conference on human factors in computing systems (Glasgow Scotland Uk: ACM). 1–12. doi:10.1145/3290605.3300377
Ghani, I., Abdul Rahman, N., Mat Nayan, N., and Bahaluddin, A. (2018). Experiential virtual urban environments: A preliminary investigation. Plan. Malays. J. 16, 408. doi:10.21837/pmjournal.v16.i5.408
Giannopoulos, I., Kiefer, P., and Raubal, M. (2015). “GazeNav: Gaze-Based pedestrian navigation,” in Proceedings of the 17th international conference on human-computer interaction with mobile devices and services (Copenhagen Denmark: ACM), 337–346. doi:10.1145/2785830.2785873
Griffin, N. N., and Folmer, E. (2019). “Out-of-Body locomotion: Vectionless navigation with a continuous avatar representation,” in 25th ACM Symposium on Virtual Reality Software and Technology (New York, NY, USA: Association for Computing Machinery), 1–8. doi:10.1145/3359996.3364243
Halik, L., and Kent, A. J. (2021). Measuring user preferences and Behaviour in a topographic immersive virtual environment (TopoIVE) of 2D and 3D urban topographic data. Int. J. Digital Earth 14, 1835–1867. doi:10.1080/17538947.2021.1984595
Huynh-The, T., Pham, Q.-V., Pham, X.-Q., Nguyen, T. T., Han, Z., and Kim, D.-S. (2023). Artificial intelligence for the Metaverse: A survey. Engineering Applications of Artificial Intelligence 117. doi:10.48550/ARXIV.2202.10336
Interrante, V., Ries, B., and Anderson, L. (2007). Seven league boots: A new metaphor for augmented locomotion through moderately large scale immersive virtual environments. IEEE Symposium 3D User Interfaces, 167–170. doi:10.1109/3DUI.2007.340791
Iwata, H. (1999). “Walking about virtual environments on an infinite floor,” in Proceedings IEEE virtual reality (cat. No. 99CB36316 (Houston, TX, USA: IEEE Comput. Soc), 286–293. doi:10.1109/VR.1999.756964
Kemec, A. (2022). From reality to virtuality: Re-Discussing cities with the concept of the Metaverse. Int. J. Manag. Account. 12, 20. doi:10.34104/ijma.022.00120020
Kraus, M., Schäfer, H., Meschenmoser, P., Schweitzer, D., Keim, D. A., Sedlmair, M., et al. (2020). A comparative study of orientation support tools in virtual reality environments with virtual teleportation” in IEEE international symposium on mixed and augmented reality. ISMAR, 227. doi:10.1109/ISMAR50242.2020.00046
Krekhov, A., Cmentowski, S., Emmerich, K., Masuch, M., and Krüger, J. (2018). “GulliVR: A walking-oriented technique for navigation in virtual reality games based on virtual body resizing,” in Proceedings of the 2018 annual symposium on computer-human interaction in play (Melbourne VIC Australia: ACM), 243–256. doi:10.1145/3242671.3242704
Liu, J., Parekh, H., Al-Zayer, M., and Folmer, E. (2018). “Increasing walking in VR using redirected teleportation,” in Proceedings of the 31st annual ACM symposium on user interface software and technology (Berlin Germany: ACM), 521–529. doi:10.1145/3242587.3242601
Mahalil, I., Yusof, A. M., Ibrahim, N., Mahidin, E. M. M., and Rusli, M. E. (2019). “Implementation of an effective locomotion technique in virtual reality stress therapy,” in 2019 IEEE conference on graphics and media (GAME) (Malaysia: Pulau Pinang IEEE), 1. doi:10.1109/GAME47560.2019.8980987
McCullough, M., Xu, H., Michelson, J., Jackoski, M., Pease, W., Cobb, W., et al. (2015). “Myo arm: Swinging to explore a VE,” in Proceedings of the ACM SIGGRAPH symposium on applied perception (Tübingen Germany: ACM), 107. –113. doi:10.1145/2804408.2804416
Nilsson, N. C., Serafin, S., Laursen, M. H., Pedersen, K. S., Sikstrom, E., and Nordahl, R. (2013). “Tapping-In-Place: Increasing the naturalness of immersive walking-in-place locomotion through novel gestural input,” in 2013 IEEE symposium on 3D user interfaces (3DUI) (Orlando, FL: IEEE), 31–38. doi:10.1109/3DUI.2013.6550193
Ning, H., Wang, H., Lin, Y., Wang, W., Dhelim, S., Farha, F., et al. (2021). A survey on Metaverse: The state-of-the-art, technologies, applications, and challenges, 09673. doi:10.48550/ARXIV.2111.09673
Nyström, M., Andersson, R., Holmqvist, K., and van de Weijer, J. (2013). The influence of calibration method and eye physiology on eyetracking data quality. Behav. Res. Methods 45, 272–288. doi:10.3758/s13428-012-0247-4
Prithul, A., Adhanom, I. B., and Folmer, E. (2021). Teleportation in virtual reality; A mini-review. Front. Virtual Real. 2, 730792. doi:10.3389/frvir.2021.730792
Razzaque, S., Kohn, Z., and Whitton, M. C. (2001). “Redirected walking,” in Eurographics 2001-short presentations) (Manchester, United Kingdom: Eurographics Association). doi:10.2312/egs.20011036
Slater, M., Usoh, M., and Steed, A. (1995). Taking steps: The influence of a walking technique on presence in virtual reality. ACM Trans. Computer-Human Interact. 2, 201–219. doi:10.1145/210079.210084
Stähli, L., Giannopoulos, I., and Raubal, M. (2021). Evaluation of pedestrian navigation in smart cities. Environ. Plan. B Urban Anal. City Sci. 48, 1728–1745. doi:10.1177/2399808320949538
Tseng, C.-M., Chen, P.-Y., Lin, S. C., Wang, Y.-W., Lin, Y.-H., Kuo, M.-A., et al. (2022). “HeadWind: Enhancing teleportation experience in VR by simulating air drag during rapid motion,” in Proceedings of the 2022 CHI conference on human factors in computing systems (New York, NY, USA: Association for Computing Machinery), 1. doi:10.1145/3491102.3501890
Turner, A. (2009). “The role of angularity in route choice,” in Spatial information theory. Editors K. S. Hornsby, C. Claramunt, M. Denis, and G. Ligozat (Berlin, Heidelberg: SpringerLecture Notes in Computer Science). doi:10.1007/978-3-642-03832-7_30
Usoh, M., Arthur, K., Whitton, M. C., Bastos, R., Steed, A., Slater, M., et al. (1999). “Walking > walking-in-place > flying, in virtual environments,” in Proceedings of the 26th annual conference on Computer graphics and interactive techniques (USA: ACM Press/Addison-Wesley Publishing Co), 359–364. SIGGRAPH ’99. doi:10.1145/311535.311589
Wolf, D., Rietzler, M., Bottner, L., and Rukzio, E. (2021). Augmenting teleportation in virtual reality with discrete rotation angles. doi:10.48550/ARXIV.2106.04257
Zagata, K., Gulij, J., Halik, L., and Medyńska-Gulij, B. (2021). Mini-map for gamers who walk and teleport in a virtual stronghold. ISPRS Int. J. Geo-Information 10, 96. doi:10.3390/ijgi10020096
Keywords: Metaverse, urban, smart cities, teleportation, navigation, 3D interactions, virtual reality
Citation: Shahbaz Badr A and De Amicis R (2023) An empirical evaluation of enhanced teleportation for navigating large urban immersive virtual environments. Front. Virtual Real. 3:1075811. doi: 10.3389/frvir.2022.1075811
Received: 20 October 2022; Accepted: 23 December 2022;
Published: 10 January 2023.
Edited by:
Shuva Chowdhury, Southern Institute of Technology, New ZealandReviewed by:
Costas Boletsis, SINTEF Digital, NorwayMarc Aurel Schnabel, Victoria University of Wellington, New Zealand
Copyright © 2023 Shahbaz Badr and De Amicis. This is an open-access article distributed under the terms of the Creative Commons Attribution License (CC BY). The use, distribution or reproduction in other forums is permitted, provided the original author(s) and the copyright owner(s) are credited and that the original publication in this journal is cited, in accordance with accepted academic practice. No use, distribution or reproduction is permitted which does not comply with these terms.
*Correspondence: Arash Shahbaz Badr, c2hhaGJhYXJAb3JlZ29uc3RhdGUuZWR1