 Timothy McMahan
 Tyler Duffield
 Thomas D. Parsons
94% of researchers rate our articles as excellent or good
Learn more about the work of our research integrity team to safeguard the quality of each article we publish.
Find out more
ORIGINAL RESEARCH article
Front. Virtual Real., 09 August 2021
Sec. Virtual Reality and Human Behaviour
Volume 2 - 2021 | https://doi.org/10.3389/frvir.2021.673191
This article is part of the Research TopicVirtual Learning Environments in Educational InstitutionsView all 6 articles
An adaptive virtual school environment can offer cognitive assessments (e.g., Virtual Classroom Stroop Task) with user-specific distraction levels that mimic the conditions found in a student’s actual classroom. Former iterations of the virtual reality classroom Stroop tasks did not adapt to user performance in the face of distractors. While advances in virtual reality-based assessments provide potential for increasing assessment of cognitive processes, less has been done to develop these simulations into personalized virtual environments for improved assessment. An adaptive virtual school environment offers the potential for dynamically adapting the difficulty level (e.g., level and amount of distractors) specific to the user’s performance. This study aimed to identify machine learning predictors that could be utilized for cognitive performance classifiers, from participants (N = 60) using three classification techniques: Support Vector Machines (SVM), Naive Bayes (NB), and k-Nearest Neighbors (kNN). Participants were categorized into either high performing or low performing categories based upon their average calculated throughput performance on tasks assessing their attentional processes during a distraction condition. The predictors for the classifiers used the average cognitive response time and average motor response dwell time (amount of time response button was pressed) for each section of the virtual reality-based Stroop task totaling 24 predictors. Using 10-fold cross validation during the training of the classifiers, revealed that the SVM (86.7%) classifier was the most robust classifier followed by Naïve Bayes (81.7%) and KNN (76.7%) for identifying cognitive performance. Results from the classifiers suggests that we can use average response time and dwell time as predictors to adapt the social cues and distractors in the environment to the appropriate difficulty level for the user.
Virtual reality (VR) classroom platforms immerse users into simulated classroom environments, wherein the user inhabits an avatar while “seated” at a desk and responds to cognitive construct stimuli (while ignoring distractors) presented on a virtual blackboard. These VR platforms are increasingly utilized for neurocognitive assessment of attention and executive functioning (Lalonde et al., 2013; Iriarte et al., 2016). Of note, there are two recent reviews examining efforts to assess persons with neurodevelopmental disorders using Virtual Reality Classroom-based measures: attention-deficit hyperactivity disorder (ADHD) (Parsons et al., 2019) and Autism Spectrum Disorder (ASD) (Duffield et al., 2018). Results of the meta-analysis with an ADHD population revealed psychometric support for the construct validity of the Virtual Reality Classroom continuous performance task (CPT).
Virtual Classroom CPTs aspire to mimic traditional two-dimensional CPT protocols (Figure 1). The 2D CPTs are computerized measures that assess attention, impulsiveness, and vigilance through the logging and analysis of correct responses, omission errors, commission errors, reaction time, and reaction time variability. The 2D CPTs are often used to differentiate between typically developing persons and persons with potential ADHD. While there are various versions of CPT, the most common stimulus presentation is the X, No-X, which involves display of a single target stimulus, such as the letter “X” to which the participant responds. There are also non target stimuli presented. A variant of the “X” target CPT is the AX CPT, which involves having the participant respond to the target stimulus (e.g., “X”) only when the target directly follows a specific letter (i.e., “A”).
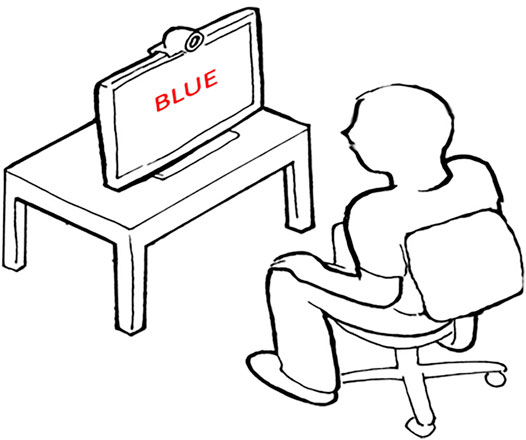
FIGURE 1. Example of a 2D computerized Stroop.
Meta-analytic review findings have been mixed, with older reviews demonstrating small to moderate effect sizes for commission and omission errors between controls and individuals with ADHD, and the inability to examine reaction time in the aggregate (Huang-Pollock et al., 2012). These previous reviews were critiqued for sampling and measurement error, and for not correcting for publication bias (Huang-Pollock et al., 2012). Even more recent 2D CPT meta-analytic review findings revealed that reaction time variability is the metric with the greatest effect size in differentiating how children and adolescents with attention-deficit hyperactivity disorder differ from typically developing groups (Kofler et al., 2013). It is important to note that the meta-analysis also revealed that not all participants with attention-deficit hyperactivity disorder had deficient performance in reaction time variability. Similarly, other meta-analytic findings have revealed that hyperactivity is ubiquitous across ADHD subtypes and best predicted by situations with high executive function demands or low stimulation environments (Kofler et al., 2016). The testing environment not being a classroom may account for psychometric inconsistencies of the 2D CPT with a limited capacity for simulating the difficulties persons with ADHD experience in everyday life (Pelham et al., 2011).
Further, there is need for adaptive algorithms that tailor the assessment to the individual participant’s strengths and weaknesses (Reise and Waller, 2009; Gibbons et al., 2016). These algorithms can be used for developing an adaptive virtual school environment that dynamically adjusts complexity of stimulus presentations and distractors. Moreover, artificially intelligent platforms can monitor participant performance and message the virtual teacher when the participant needs social cues for reorienting attention to learning material. When working with students, the following considerations need to be taken into account: 1) not all participants with or without clinical diagnoses perform in a consistent manner; 2) children with ADHD show deficient time on task and more variable visual attending to required learning stimuli in the classroom (Kofler et al., 2008); 3) evidence has emerged that the increase in academic demands at young ages has coincided with increased prevalence of ADHD predicated upon expectation effects (e.g., parents or teachers) using gold-standard behavioral rating measures (Brosco and Bona, 2016); 4) and generally consistent meta-analytic findings for virtual classroom CPT (3D) performances with previous meta-analyses of computerized CPTs (2D) regarding the commonly used omission, commission, and hit reaction time variables.
While there are several Virtual Reality Classrooms, two of the most widely used for neurocognitive assessment are the Digital Media Works ClinicaVR suite (Figure 2: presented via eMagine z800) and the AULA Nesplora (Figure 3; presented via Oculus Rift). Each of the Virtual Reality Classrooms mentioned uses a version of the continuous performance test protocol (Digital Media Works AX CPT; AULA Nesplora X, no-X CPT) with CPT stimuli presented on the blackboard as distractors occur in the simulated classroom. In the virtual classroom, around the user’s avatar are other student avatars seated at desks, a teacher, a window, and a blackboard. During assessment protocols, users are immersed in the virtual reality classroom and instructed to respond (button presses) to target stimuli as they are presented on the virtual blackboard. Virtual distractors (auditory, visual, and mixed audio/visual) are presented at various times and locations of the simulated classroom.
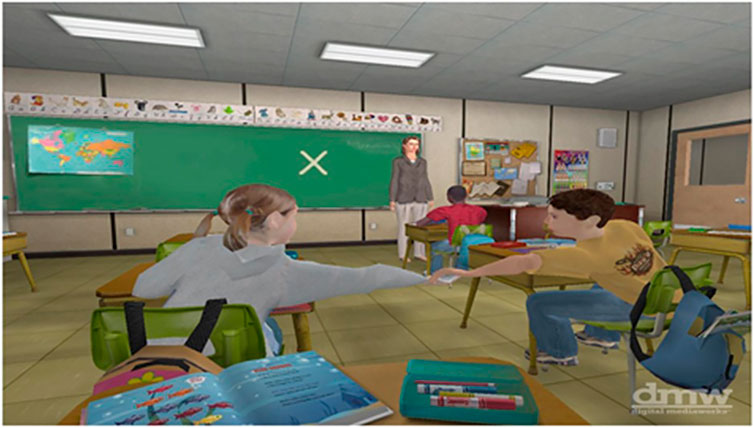
FIGURE 2. Digital Media Works Virtual Classroom. Reprinted with permission (Rizzo, et al., 2006).
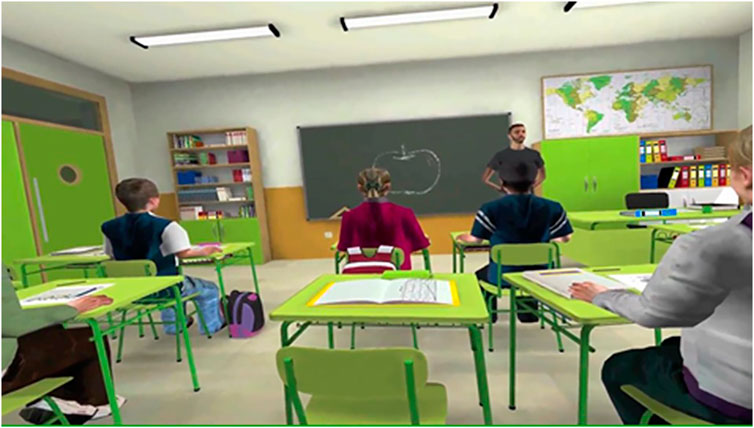
FIGURE 3. AULA Nesplora Virtual Classroom (norms for N = 1,272 participants). Reprinted with permission (Diaz-Orueta et al., 2020).
For the AULA Nesplora, the X, No-X paradigm is used. The AULA Nesplora Virtual Classroom CPT is notable for the large normative database that has been developed with over 1,200 students (N = 1,272 participants; 48.2% female; age range: 6–16 years (M = 10.25, SD = 2.83). Results revealed that while males typically responded more rapidly (faster reaction times for both correct and incorrect responses) and with greater motor activity (e.g., head movement) where they did not have fixed view of the virtual blackboard, females had greater accuracy regardless of the level of distraction in the virtual classroom environment. Given the notable speed and accuracy trade-off, these platforms should consider the addition of throughput algorithms (Thorne, 2006). While throughput algorithms would not replace reaction time and accuracy scores, they would offer another metric (i.e., efficiency) that balances the two. Variability in performance was also notable across age groups.
The lack of stability relative to gender and age is yet another basis for inclusion of adaptive algorithms that would allow for researchers and clinicians to notably reduce testing time and provide the option to personalize stimulus presentation and environmental cues relevant to real world treatment/training targets and optimal classroom functioning recommendations.
In addition to Virtual Classroom CPTs, there are Virtual Classroom Stroop tests. Instead of CPT stimuli, the Virtual Classroom Stroop task superimposes Stroop stimuli onto a virtual blackboard (Lalonde et al., 2013; Parsons and Carlew, 2016). The Virtual Classroom Stroop Task aims to mimic the classic Stroop task that is used to evaluate selective attention and inhibitory control. The Stroop is one of the most utilized measures of attentional control in the human neurosciences (Stroop, 1992; Norman and Shallice, 1986). Although some variations exist in Stroop studies (e.g., type of stimuli; number of stimuli; stimulus durations), they all aim to evaluate response conflict, response inhibition, freedom from distractibility, and selective attention (MacLeod, 1992; Melara and Algom, 2003).
Most Stroop tests include both congruent (participant names the color of stimuli of the same color; incongruent (participant names the color stimuli when incongruent color words are presented (e.g., BLUE). A standard 2D computerized Stroop is found in Figure 1. During the Stroop users may be required to press a labelled (red, green, or blue) computer key that signifies their response to each color stimulus presented. Often, there are three blocks (50 trials each): Word Reading (words RED, GREEN, and BLUE are presented individually in black type on the display and user reads each word aloud while pressing a corresponding key for each word (“red” = 1; “green” = 2; and “blue” = 3); Color Naming (a sequence of XXXXs is presented on the display in one of three colors (red XXXXs, green XXXXs, or blue XXXXs). User may be told to say aloud the color of the XXXXs while pressing the corresponding key based on color; and Incongruent (sequence of single words (“RED,” “GREEN,” or “BLUE”) may be presented in a color that does not match the name of the color depicted by the word. Users may be told to say aloud the color of the word instead of reading the actual word while pressing the associated response key for that color. The users respond to each individual color stimulus as quickly as possible (without making mistakes). For some Stroop tasks, each new stimulus appears only after the user correctly identifies the previous stimulus.
The Virtual Classroom Stroop task is very similar to the 2D computerized Stroop. Users respond physically using an individual response key that allows for the assessment of cognitive and motor inhibition. Similar to the Virtual Classroom CPT, construct validity has also been found for the Virtual Reality Classroom Stroop (VCST) in both typically developing participants (Lalonde et al., 2013) and persons with high functioning Autism (Parsons and Carlew, 2016).
A recent iteration of the Virtual Classroom Stroop task has been included in an adaptive Virtual School environment (Unity engine) that includes an interactive virtual human teacher (Figure 4). While the Virtual Classroom platforms reviewed above enhance the ecological validity of cognitive tasks, the lack of artificial intelligence and social interactions in the nonplayer characters (teacher and students) in the early Virtual Classroom platforms can be enhanced via the development and validation of adaptive Virtual School environments with intelligent virtual teachers and interactive virtual students. While immersed in the virtual school environment, the user takes part in an adaptive and interactive virtual classroom, hallway, and playground environments where the user interacts with a virtual human teacher.
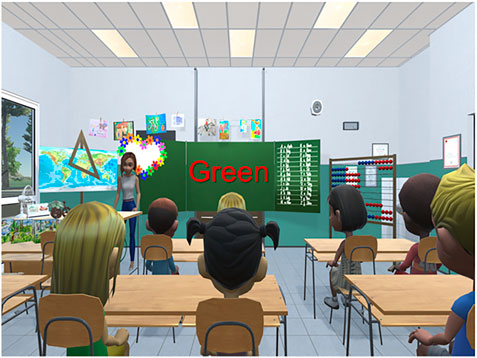
FIGURE 4. Virtual Classroom Stroop task.
The adaptive nature of the current iteration of the virtual teacher and classroom includes several cognitive and affective (i.e., emotion) measures that can be administered with or without social cues from the virtual human teacher: Stroop test; continuous performance test; and picture naming. Like earlier iterations, the current Virtual Classroom platform includes rows of desks (that can be moved to various locations and configurations); a teacher’s desk (at the front but can be moved); a whiteboard (or blackboard depending on preference); various decorations, a virtual human teacher (male and female options); and other virtual avatar peers seated around the user’s avatar in the virtual room. Once immersed (uses either HTC Vive or Oculus head mounted displays) in the Virtual School environment, the virtual teacher instructs (heard through headphones) the user to look around, point to objects, and name the objects pointed at within the virtual environment (one minute acquaintance period). Next, the virtual human teacher informs the user that they are going to “play a game” and participants are given instructions for the task (e.g., virtual Stroop task) and a series of stimuli (e.g., CPT or Stroop) that appear briefly to the left and right of the virtual human teacher on the board. A random inter-stimulus interval is included between the advent of the stimuli (e.g., Stroop) and the series of asynchronous stimulus onsets (and offsets) to the left and right of the virtual human teacher. Distracters are presented throughout. An example of one distractor can be seen in Figure 2. Two children are passing a note to each other in front of the participant. For half the trials, the virtual teacher uses social cues (e.g., gesturing and eye gaze) to reorient the user to the task and to direct user to the appropriate stimuli. A state system drives the social cues of the virtual teacher.
The Virtual Classroom Stroop Task found in the Virtual School Environment has several conditions. In addition to both low and high levels of distraction (audio and video distractors) conditions, there are various modalities for presenting visual, auditory, and bimodal presentations of stimuli. Moreover, the addition of a virtual teacher yields several quantitative metrics: Attention to Task: accuracy (number of correct responses) and average reaction time for correct targets [as well as throughput score (Thorne, 2006)]; Teacher-Directed Attention to Task: accuracy (number of correct responses) and average reaction times relative to virtual teacher orientation (as well as throughput score); and Attention to Tasks during Social and Non-Social Distracters: accuracy (number of correct responses in Social, Non-Social and No Distracter conditions) and related average reaction times (as well as throughput score). This research paradigm aims to provide information relevant to performance with and without social cues from the virtual human teacher.
Effective Virtual Reality assessment of attention can be enhanced by adaptive algorithms and decision rules based on predictive classifiers. The traditional VCSTs may not always offer optimal assessment of attentional processing as they are not designed to be personalized to the diverse and dynamic response patterns of users. Instead, they use environmental distractors to extend the pre-defined stimulus presentations and activities found in the 2D computerized Stroop assessments. While this historic approach is valid, adaptive algorithms offer the potential for more personalized assessment and training experiences in which the level and amount of distractors is personalized to the user. Moreover, adaptive presentations of distractions in the virtual classroom Stroop tasks may overcome limitations of current 2D and 3D cognitive tasks ability to meaningfully characterize within group heterogeneity and intra-individual differences in performance across time and context for conditions such as ADHD. (Kofler et al., 2008; Brosco and Bona, 2016; Parsons et al., 2019).
The study used data collected from sixty undergraduate and graduate students. Demographics included mean age = 20.3 (range 18–30); 66.67% of the participants were female; Education level included high school degree and some college. Ethnicity distributions consist of: N = 7 African American, N = 3 Asian, N = 8 Hispanic, N = 41 Caucasians, and N = 1 Other. 86.6% of the participants were right-handed.
The experimental sessions and data gathering had a duration of 90-minutes. Upon arriving at the laboratory, the participant (i.e., user) was told about the study’s procedures, potential risks, and benefits. Potential participants were also, told that they could choose to not participate. Prior to starting the protocol (before starting study and pre-immersion), participants were asked to sign a written informed consent (approved by the university’s institutional review board) that designated their approval to take part in testing and immersion in the virtual environment. Following informed consent, general demographic data was gathered. Further, participants responded to questions aimed at assessing their prior computer experience, general comfort with technologies, computer usage activities, and their perception of their computer skill level (Likert scale (1–not at all to 5–very skilled); and what type of games they played (e.g., role-playing; eSports, etc.).
The Virtual Classroom Stroop task was used to immerse participants in the virtual environment. The Virtual Classroom was delivered using the HTC VIVE connected to an Alienware desktop computer containing an Intel i7 processor with 32 GB of memory, a Nvidia GeForce GTX 1080 graphics card, running Windows 10. While immersed in the VCST, the participant’s avatar is seated at a desk near the center of the virtual class and surrounded by other avatars at their desks. The Virtual Classroom does not require the participant to move around in the environment. So, the participant was seated in the real world to match the scenario in the environment for a more realistic experience. Seating the participant also reduced the prospects of the participant experiencing simulator sickness. As mentioned earlier, the Virtual Classroom Stroop Task is developed using principles found in the classic Stroop tasks, which measures cognitive workload and interference. There are also go/no go components (assessing motor inhibition) and external interference from visual and auditory distractors). The participant views a sequence of Stroop stimuli (e.g., colored rectangles and colored words) on the blackboard. A female voice stated the names of colors (red, blue, or green). Participants were instructed to press a button (as quickly as possible) when hearing a color that matches the color of the stimuli on the Virtual blackboard. They were also instructed to withhold a response if the colors did not match. A total of 144 stimuli were presented, with 72 targets and 72 non-targets.
For this study, box and word conditions were implemented in a high distraction condition without teacher social cues. The current study aimed to focus on participant performance metrics that can be modeled with machine learning to develop decision rules for teacher social cues and environmental distractors. The box condition involved the matching of auditory and visual stimulus modalities for assessing selective attention. Environmental distractors were included to assess inhibition of external interferences. In the box condition, there were simultaneous bimodal presentations of visual and auditory stimuli in a virtual classroom environment that included auditory (e.g., bell ringing) and visual distractors (e.g., students passing notes). In the visual modality, a sequence of color rectangles: red, green, or blue) were presented on the classroom blackboard (red, blue, green). In the auditory modality, the virtual teacher’s voice is heard naming of colors (red, green, or blue). After each bimodal presentation, participants were to pull (as quickly as possible) the trigger button on the VIVE controller (with their preferred hand) when the auditory stimulus (color named) modality matched the visual stimulus (color shown) modality. Participants were instructed that they were to withhold responses in mismatched trials.
The color words condition was designed for assessment of Stroop interference in the presence of environmental distractors. As in the box condition, the word condition in includes both visual and auditory stimulus presentation modalities. Printed text (visual modality) of a word color (red, green, or blue) is presented on the blackboard at the same time that the colors are auditorily presented by the virtual teacher’s voice (see box condition). Participants are to pull the trigger button on the VIVE controller (as quickly as possible) when the color read is the same as the font color (target stimuli), while ignoring the color word read. Of note, participants did complete the simulator sickness questionnaire, which includes both a pre- and post-VR exposure symptom checklist. No significant simulator sickness was found.
Statistica version 13.3 was utilized for all analyses. Descriptive statistics were evaluated for classroom Stroop prediction variables and participant demographics. Case wise deletion was utilized for any data that was missing from the data set. Prediction variables were identified from participant data that could be used as input for the machine learning algorithms (Table 1). Inputs were selected based upon the criteria that the variables are available for use in real-time within adaptive environments to supply the machine learning algorithms with the objective of predicting the participants performance level. Figure 5 depicts the dissemination of high performers and low performers for average classroom response times and average dwell times. Understanding a participant’s performance level allows the classroom environment to determine and adjust to the optimal difficulty level to improve the user experience. Using the identified inputs, the descriptive statistics were calculated for each predictor (Table 2).
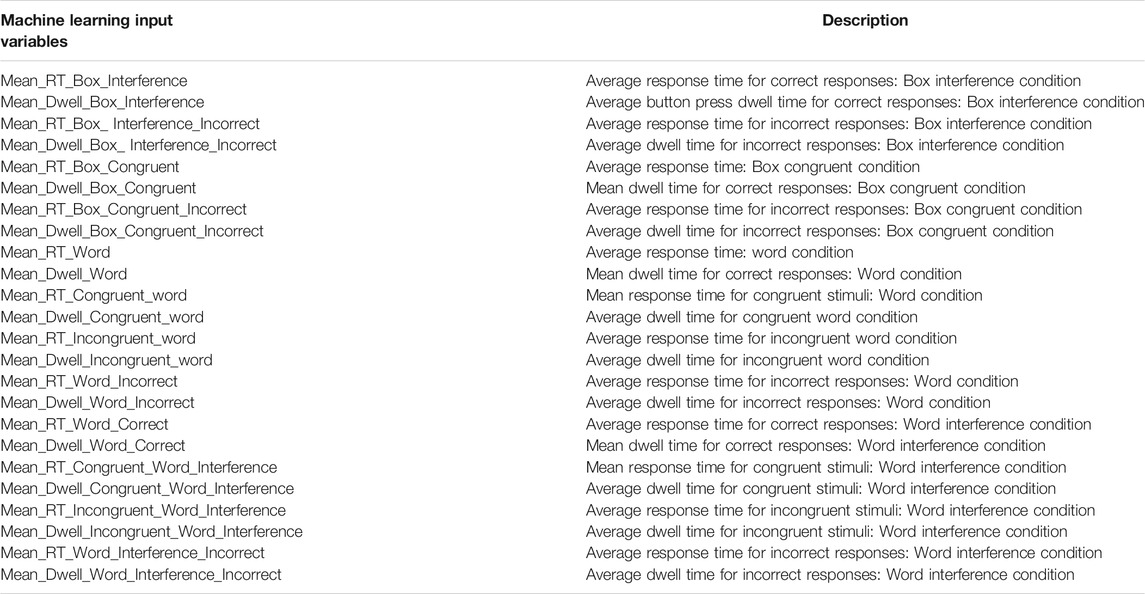
TABLE 1. Machine learning input variables.
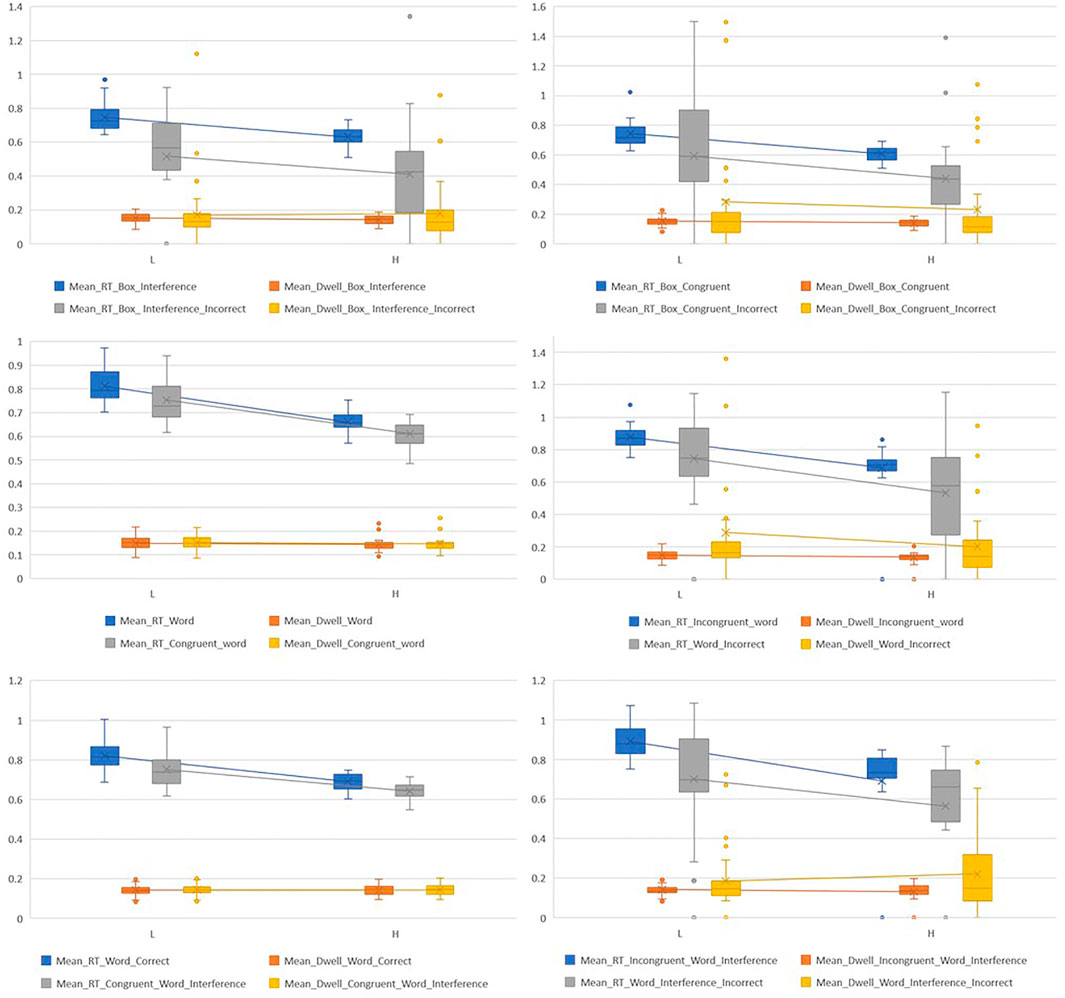
FIGURE 5. Distribution of input variables based upon High and Low performance.
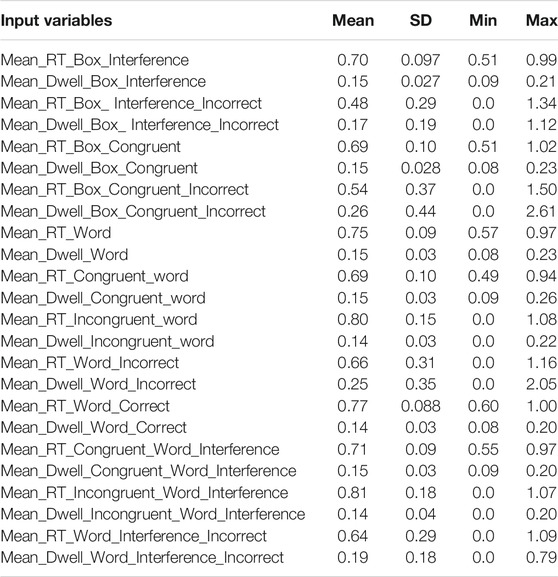
TABLE 2. Descriptives of inputs variables.
The machine learning algorithms require data to train on. Building a training set requires all participants to be categorized as either a high performer or a low performer. For the classroom Stroop, the total correct is not a valid metric for placing participants into high or low performers as it does not account for response style (conservative, liberal, or balanced), or a speed-accuracy trade-off. Thus, it is possible that a user could have a high percentage of correct responses because they took more time to make sure they picked the correct answer (conservative style of responding that emphasized accuracy over speed). These participants should not fall into the high performer category. Instead, throughput was calculated for each section of the classroom Stroop (Thorne, 2006).
The mean throughput was calculated across all sections for each participant, giving an overall throughput score. The mean throughput score across all participants was 12.05. If the participant had a larger throughput than the mean throughput the participant was assigned to the high performer category. If the participant fell below the mean they were assigned into the lower performer category. The category distribution was 30 high performers to 30 low performers.
1) Support Vector Machine: Utilizing a hyperplane, support vector machine (SVM) segments binary labelled data into two classes. SVM use data from both categories to train and attempts to place the data into a higher dimensional space. The objective of the SVM is produce a hyperplane that separates the two categories with a maximum distance. SVM algorithms have several options for building hyperplanes including linear, polynomial, and radial basis function. Once the SVM is trained, testing data can be used with the algorithm, and it will attempt to place the test data into one of the two categories. The SVM chooses the category based upon the side of the hyperplane the test data lands. Selecting the maximum margins between the hyperplane and data is one method for optimizing the hyperplane. The SVM algorithm can achieve this by transforming the data from input space to feature space. This study implemented a Type 1 classification using C = 2.0 and a radial basis function kernel (gamma = 0.04167). The maximum number of iterations was set to 1,000 with a stop error of 0.001. 10 v-fold cross validation which segmented the data into 90% training and 10% testing was used to validate the classifier.
2) Naïve Bayes: The Naïve Bayes (NB) classifier is based upon the Bayes theorem and is best used when the dimensionality of inputs is high. NB provides an advantage over other classifier in that it does not require a large set of training data. The NB classifier calculates a probability using 1) to determine what category a data point should be assigned. Using the highest calculated probability, the NB algorithm chooses the category for the data point. The NB is a supervised learning algorithm and is efficient at calculating the probability that data belongs to a specific group. This makes the algorithm highly effective in real-time applications. NB assumes that the algorithm inputs are independent from other inputs. For each category, the algorithm creates a feature vector to store the training data. When testing data, the classifier uses maximum likelihood to put data into the correct categories. 10 v-fold cross validation which segmented the data into 90% training and 10% testing was used to for testing for the Naïve Bayes classifier. A normal distribution was assumed for each predictor.
3) k-Nearest Neighbor: The k-Nearest Neighbor (kNN) is a supervised learning algorithm that uses location to decide which category data fits. During the training phase kNN uses feature vectors to store the categories datum. During the testing phase the algorithm uses 2) to assess the shortest distance to one of the two categories for new data. kNN suffers from uneven data distribution, which will cause the algorithm to select one category over the other. In this study, the kNN classifier used 10 v-fold cross validation which segmented the data into 90% training and 10% testing. The distance measure was set to Cityblock (Manhattan).
The chosen inputs (Table 2) from the randomly chosen participants were used to categorize participants into high performers and low performers using a Support Vector Machine (SVM), a Naïve Bayes (NB) classifier, and k-Nearest Neighbor (kNN) classifier (Table 3). With an N = 60 participants the data was randomly segmented into 54 algorithm training samples and 6 algorithm testing samples. Each sample contains 24 data points that are used as inputs for the machine learning algorithms.
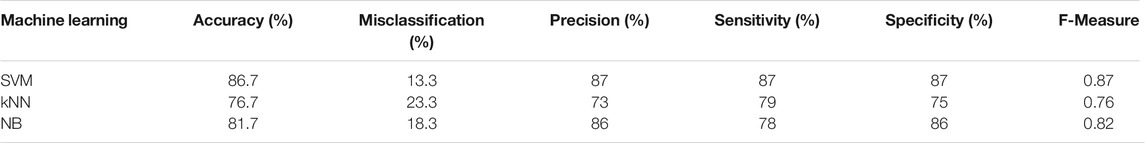
TABLE 3. Machine learning classifier results.
The strongest classifier was the SVM, which produced an accuracy rate of 86.7% (std dev: 3.27) followed by NB (81.7%, std dev: 2.5) which was with a little bit better then kNN (76.7%, std dev: 5.74). The SVM also had better Precision and Sensitivity, indicative of superiority at correctly assigning high performing participants. kNN was better when attempting to correctly assign low performing participants (Figure 6). The kNN algorithm may have favored the low over the high performer category due to the sensitivity level achieved. Naïve Bayes performance was average likely because the dataset was not Naïve. It is also possible that the inputs were not completely independent, resulting in more false positives. Figure 7 shows the confusion matrices for the 24 predictors.
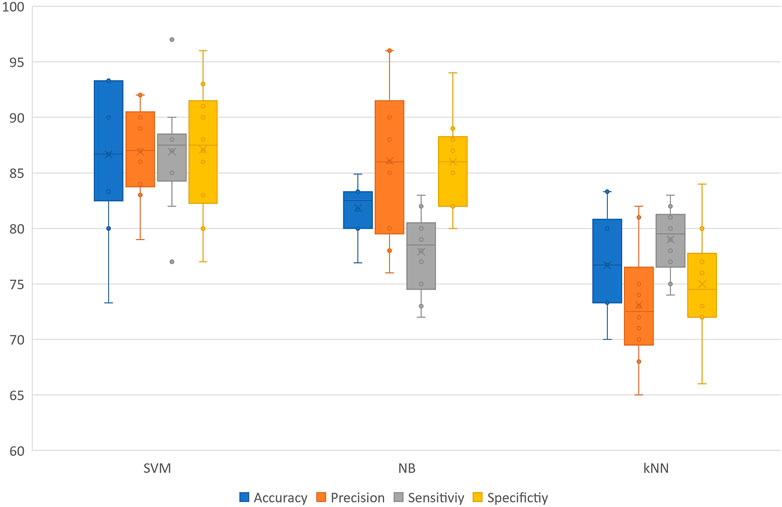
FIGURE 6. Comparison of classifiers accuracy, precision, sensitivity, and specificity based upon 10 v-fold cross validation data.
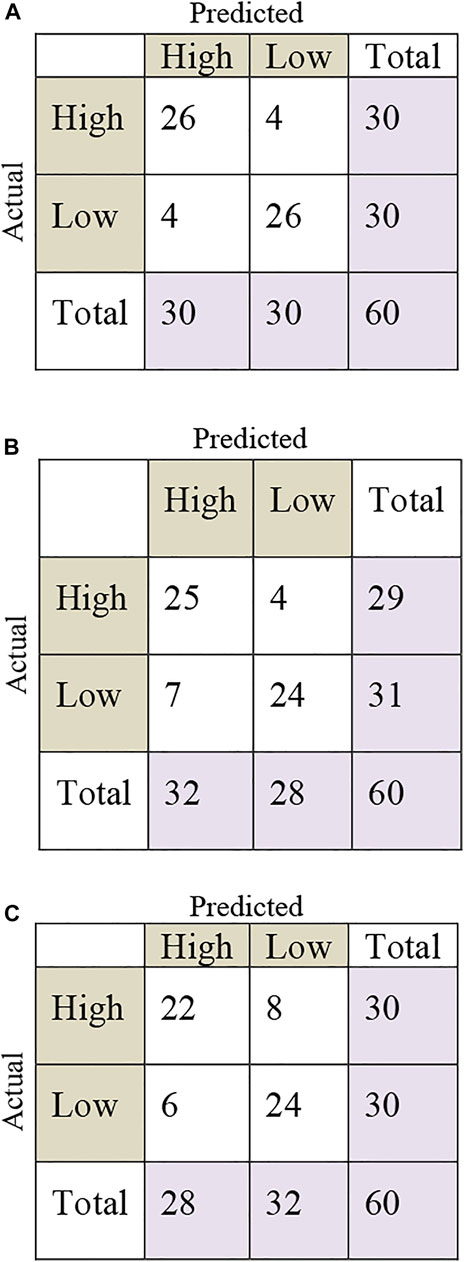
FIGURE 7. (A) Confusion Matrix for SVM based upon 10 v-fold cross validation results; (B) Confusion Matrix for NB based upon 10 v-fold cross validation results; (C) Confusion Matrix for kNN based upon 10 v-fold cross validation results.
Virtual classroom assessment environments have demonstrated measurement value by providing a dynamic simulation with distractors that mimic the conditions of the real world (Iriarte et al., 2016; Parsons et al., 2019). The next incremental advancement is the ability for testing conditions to adapt based upon individual user performance. Computerized adaptive testing provides concise item pools and avoids floor or ceiling effects that can significantly reduce testing length, while providing equal to or greater precision at establishing ability levels compared to normative data referenced paper-and-pencil tests (Gibbons et al., 2008). Artificially intelligent and adaptive virtual classroom environments may also overcome limitations of current 2D and 3D cognitive tasks with static presentations. Machine learning offers the capacity for dynamically adaptive environments that can more meaningfully characterize the within group heterogeneity and intra-individual differences found in performance across time and contexts for persons with ADHD (Kofler et al., 2008; Brosco and Bona, 2016). Further, an adaptive classroom environment can theoretically provide data driven treatment outcome metrics that have greater likelihood to generalize to actual classroom academic performances and barriers to learning. When participant performance feedback is messaged to the virtual teacher, social and reorienting cues can be communicated to the participant to bring their attention away from distractors to learning material.
Machine learning is one tool that can be utilized to develop an adaptive virtual teacher and classroom environment. First, existing metrics need to be identified that can be used as inputs for the machine learning algorithm to detect when the environment must adapt for the user. Herein, the input variables were drawn from specific selective attention and executive functioning tasks (e.g., box and word conditions of Stroop tasks). These input variables (cognitive performance in the presence of distractors) were modeled using three machine learning algorithms: Support Vector Machine (SVM), Naïve Bayes (NB), and k-Nearest Neighbor (kNN). Moreover, these three machine learning algorithms were compared regarding optimal ascertainment of instances when an environment needs to adapt to participant performance. 24 input variables were selected from participants performing tasks within the virtual classroom environment. The 24 predictors are considered an upper threshold to identify the best predictors. Using 10 v-fold cross validation the SVM classifier was strongest with superior accuracy (86.7%) and precision (87%), as well as sensitivity (87%) and specificity (87%) for assigning high or low performance categorization. kNN did very well at assigning low performing participants, but this may be due to it favoring the low performing category.
Once the adaptive virtual classroom environment categorizes a participant as high performing or low performing it must then adapt the environment to best tailor the individual user deficits or needs. Thus, sets of decision rules must be developed for determination of how to optimally adapt for each performance category (e.g., low performer), specific task, or identified treatment outcome (e.g., attending to teacher during lecture). For example, if a user is considered a high performer, the system could adapt to make the current task more difficult by modifying the complexity of the distractor presentation (number, frequency, location, multi-modal, etc.) or teacher interaction behaviors until the user becomes a low performer for training enhancement purposes. Alternatively, reducing or modifying distraction presentations (e.g., distractors occur more proximal to teacher) in the environment may help improve low performances. Providing supplemental practice time could be an additional adaptation for low performers who simply may be slower learners. These are but a few examples of many possibilities to leverage adaptive capabilities to optimize intervention and assessment metrics.
The goal of this paper was to identify specific machine learning predictors that can be utilized in the development of an adaptive framework for the social cues and environmental distractors occurring in the virtual environment during the Stroop Task in a Virtual School Environment for potential attention enhancement or remediation purposes. Thus, the VSE is intended to function as an integrated assessment and intervention paradigm. The initial step in developing this system is identifying and evaluating the predictors that can be utilized in the machine learning algorithms. The current model implements 24 input predictors as an upper-level boundary to identify the best predictors and the strongest classifier to implement within the framework. When a user is working within the adaptive environment not all predictors will be available at the start of the assessment. The framework will take this into account and adjust the model as data is collected in the assessment. Optimizing these techniques is required in future work. This study does not address all issues that might arise from implementing an adaptive task, nor was the goal to change the parameters or standardization of the Stroop task. Future research will examine design features, stimulus presentation configurations, and computational aspects of a validation methodology for the adaptive Stroop Task. The adaptive framework must be rigorously tested to substantiate the learning model for accuracy as the test is adapted to the user.
The raw data supporting the conclusion of this article will be made available by the authors, without undue reservation.
The studies involving human participants were reviewed and approved by the University of North Texas Institutional Review Board. The patients/participants provided their written informed consent to participate in this study.
TP, TM, and TD conceived and wrote the paper. All authors have read and agreed to the published version of the manuscript.
The authors declare that the research was conducted in the absence of any commercial or financial relationships that could be construed as a potential conflict of interest.
All claims expressed in this article are solely those of the authors and do not necessarily represent those of their affiliated organizations, or those of the publisher, the editors and the reviewers. Any product that may be evaluated in this article, or claim that may be made by its manufacturer, is not guaranteed or endorsed by the publisher.
Brosco, J. P., and Bona, A. (2016). Changes in Academic Demands and Attention-Deficit/Hyperactivity Disorder in Young Children. JAMA Pediatr. 170 (4), 396–397. doi:10.1001/jamapediatrics.2015.4132
Diaz-Orueta, U., Blanco-Campal, A., Lamar, M., Libon, D., and Burke, T. (2020). Marrying Past and Present Neuropsychology: Is the Future of the Process-Based Approach Technology-Based? Front. Psychol. 11, 361. doi:10.3389/fpsyg.2020.00361
Duffield, T. C., Parsons, T. D., Landry, A., Karam, S., Otero, T., Mastel, S., et al. (2018). Virtual Environments as an Assessment Modality with Pediatric ASD Populations: A Brief Report. Child. Neuropsychol. 24 (8), 1129–1136. doi:10.1080/09297049.2017.1375473
Gibbons, R. D., Weiss, D. J., Frank, E., and Kupfer, D. (2016). Computerized Adaptive Diagnosis and Testing of Mental Health Disorders. Annu. Rev. Clin. Psychol. 12, 83–104. doi:10.1146/annurev-clinpsy-021815-093634
Gibbons, R. D., Weiss, D. J., Kupfer, D. J., Frank, E., Fagiolini, A., Grochocinski, V. J., et al. (2008). Using Computerized Adaptive Testing to Reduce the Burden of Mental Health Assessment. Psychiatr. Serv. 59 (4), 361–368. doi:10.1176/ps.2008.59.4.361
Huang-Pollock, C. L., Karalunas, S. L., Tam, H., and Moore, A. N. (2012). Evaluating Vigilance Deficits in ADHD: A Meta-Analysis of CPT Performance. J. Abnormal Psychol. 121 (2), 360–371. doi:10.1037/a0027205
Iriarte, Y., Diaz-Orueta, U., Cueto, E., Irazustabarrena, P., Banterla, F., and Climent, G. (2016). AULA-Advanced Virtual Reality Tool for the Assessment of Attention. J. Atten Disord. 20 (6), 542–568. doi:10.1177/1087054712465335
Kofler, M. J., Raiker, J. S., Sarver, D. E., Wells, E. L., and Soto, E. F. (2016). Is Hyperactivity Ubiquitous in ADHD or Dependent on Environmental Demands? Evidence from Meta-Analysis. Clin. Psychol. Rev. 46, 12–24. doi:10.1016/j.cpr.2016.04.004
Kofler, M. J., Rapport, M. D., and Matt Alderson, R. (2008). Quantifying ADHD Classroom Inattentiveness, its Moderators, and Variability: A Meta-Analytic Review. J. Child Psychol. Psychiatry 49 (1), 59–69. doi:10.1111/j.1469-7610.2007.01809.x
Kofler, M. J., Rapport, M. D., Sarver, D. E., Raiker, J. S., Orban, S. A., Friedman, L. M., et al. (2013). Reaction Time Variability in ADHD: A Meta-Analytic Review of 319 Studies. Clin. Psychol. Rev. 33 (6), 795–811. doi:10.1016/j.cpr.2013.06.001
Lalonde, G., Henry, M., Drouin-Germain, A., Nolin, P., and Beauchamp, M. H. (2013). Assessment of Executive Function in Adolescence: A Comparison of Traditional and Virtual Reality Tools. J. Neurosci. Methods 219 (1), 76–82. doi:10.1016/j.jneumeth.2013.07.005
MacLeod, C. M. (1992). The Stroop Task: The "gold Standard" of Attentional Measures. J. Exp. Psychol. Gen. 121 (1), 12–14. doi:10.1037/0096-3445.121.1.12
Melara, R. D., and Algom, D. (2003). Driven by Information: A Tectonic Theory of Stroop Effects. Psychol. Rev. 110 (3), 422–471. doi:10.1037/0033-295x.110.3.422
Norman, D. A., and Shallice, T. (1986). Attention to Action: Willed and Automatic Control of Behavior. Conscious. Self-regulation 1, 1–18. doi:10.1007/978-1-4757-0629-1_1
Parsons, T. D., and Carlew, A. R. (2016). Bimodal Virtual Reality Stroop for Assessing Distractor Inhibition in Autism Spectrum Disorders. J. Autism Dev. Disord. 46 (4), 1255–1267. doi:10.1007/s10803-015-2663-7
Parsons, T. D., Duffield, T., and Asbee, J. (2019). A Comparison of Virtual Reality Classroom Continuous Performance Tests to Traditional Continuous Performance Tests in Delineating ADHD: A Meta-Analysis. Neuropsychol. Rev. 29 (3), 338–356. doi:10.1007/s11065-019-09407-6
Pelham, W. E., Waschbusch, D. A., Hoza, B., Gnagy, E. M., Greiner, A. R., Sams, S. E., et al. (2011). Music and Video as Distractors for Boys with ADHD in the Classroom: Comparison with Controls, Individual Differences, and Medication Effects. J. Abnorm Child. Psychol. 39 (8), 1085–1098. doi:10.1007/s10802-011-9529-z
Reise, S. P., and Waller, N. G. (2009). Item Response Theory and Clinical Measurement. Annu. Rev. Clin. Psychol. 5, 27–48. doi:10.1146/annurev.clinpsy.032408.153553
Rizzo, A. A., Bowerly, T., Buckwalter, J. G., Klimchuk, D., Mitura, R., and Parsons, T. D. (2006). A Virtual Reality Scenario for All Seasons: the Virtual Classroom. CNS Spectr. 11 (1), 35–44. doi:10.1017/s1092852900024196
Stroop, J. (1992). Studies of Interference in Serial Verbal Reactions. J. Exp. Psychol. Gen. 18 (6), 643–662.
Keywords: adaptive virtual environments, neuropsychological assessment, cognitive, machine learning, adaptive assessment
Citation: McMahan T, Duffield T and Parsons TD (2021) Feasibility Study to Identify Machine Learning Predictors for a Virtual School Environment: Virtual Reality Stroop Task. Front. Virtual Real. 2:673191. doi: 10.3389/frvir.2021.673191
Received: 27 February 2021; Accepted: 21 July 2021;
Published: 09 August 2021.
Edited by:
Athanasios Vourvopoulos, Instituto Superior Técnico (ISR), PortugalReviewed by:
Sergi Bermúdez i Badia, University of Madeira, PortugalCopyright © 2021 McMahan, Duffield and Parsons. This is an open-access article distributed under the terms of the Creative Commons Attribution License (CC BY). The use, distribution or reproduction in other forums is permitted, provided the original author(s) and the copyright owner(s) are credited and that the original publication in this journal is cited, in accordance with accepted academic practice. No use, distribution or reproduction is permitted which does not comply with these terms.
*Correspondence: Thomas D. Parsons, dGhvbWFzLnBhcnNvbnNAdW50LmVkdQ==
Disclaimer: All claims expressed in this article are solely those of the authors and do not necessarily represent those of their affiliated organizations, or those of the publisher, the editors and the reviewers. Any product that may be evaluated in this article or claim that may be made by its manufacturer is not guaranteed or endorsed by the publisher.
Research integrity at Frontiers
Learn more about the work of our research integrity team to safeguard the quality of each article we publish.