
94% of researchers rate our articles as excellent or good
Learn more about the work of our research integrity team to safeguard the quality of each article we publish.
Find out more
ORIGINAL RESEARCH article
Front. Virtual Real. , 31 May 2021
Sec. Virtual Reality and Human Behaviour
Volume 2 - 2021 | https://doi.org/10.3389/frvir.2021.655273
This article is part of the Research Topic Use of body and gaze in extended reality View all 6 articles
 Juliana Melendrez-Ruiz1*
 Isabelle Goisbault2Jean-Christophe Charrier2
 Kevin Pagnat2
 Laurence Dujourdy3
 Gaëlle Arvisenet1
 Stéphanie Chambaron1
Despite numerous health and environmental benefits, the consumption of pulses (i.e. lentils, chickpeas … ) in France has decreased over the past few decades. One potential barrier to pulse consumption may be their shelf placement in French supermarkets. We studied gaze behavior toward pulses in a virtual supermarket. Products from four food categories (animal-based, pulses, starches, and vegetables) were randomly presented on four shelves (canned, dried, ready-to-eat, and refrigerated). Then, a composite super-shelf combined the canned, dried, and refrigerated shelves. Gaze behavior was recorded for the 108 participants in two screening phases: i) the four shelves one-by-one, ii) the super-shelf. Pulses were not strong “eye-catchers”: gaze behavior toward pulses varied from shelf to shelf. Similarly, visual attention was different for each food-group during super-shelf screening. These results could be used to implement specific strategies that should be developed in supermarkets to encourage the choice of pulses by consumers, and thus increase pulse consumption.
Pulses are considered as foods particularly adapted to contribute to a more healthy and sustainable diet. However, in France, their consumption is very low despite the recommendations of Public Authorities. Consequently, the barriers and possible levers to their consumption need to be explored. Barriers to pulses consumption were found at different levels of the food chain (production, transformation, preparation at home, consumers attitudes), but so far, they have not really been studied at the level of distribution, because of methodological issues. The use of virtual reality is a real opportunity to tackle this question.
In French supermarkets, pulses do not benefit from specific shelves, whereas in the United Kingdom or the United States, retailers dedicate shelves specifically to plant proteins (Magrini, 2016). In France, pulses can be found in several different shopping areas in a supermarket, with different types of presentation: in the fresh fruit and vegetable area (uncooked pulses); beside the starch food-group in the dry-shelf (uncooked pulses); next to ready-to-eat dishes, in the canned food area (canned pulses); or even on the shelf specifically dedicated to international foods (Rio, 2017). Such a spreading could reduce the visibility of pulses and thus represent a barrier to their choice among French people. As a consequence, this could contribute to the low consumption of these sustainable products.
The position of products on supermarket shelves and its consequences on consumers’ attention and food choices have been previously studied. For instance, within a category, the product located in the center is chosen more often than products located on the left or right in the shelf (Atalay et al., 2012). Similarly, shelf position on the vertical dimension can influence brand evaluation: when the brand is on the top of the shelf, it can strengthen the positive impact of higher attention, while if the brand is in the middle shelves, it can weaken this positive impact (Chandon et al., 2009). Furthermore, an increase in the number of options on a shelf, also known as “choice overload”, could impact negatively consumer motivations or satisfaction toward the final choice (Scheibehenne et al., 2010). The authors mentioned that choice overload can result from the structure of the assortment in the shelf. Different factors can contribute to this overload, such as a lack of clear categories among the choice set, a need for comparison, or time pressure (i.e., too much information to process in a short time). Besides, the perception of the assortment (variety and satisfaction with product choice) depends on the persons’ familiarity with the category. It is important to match the assortment layout to the consumer’s internal scheme, especially for consumers that are more familiar with a category (Morales et al., 2005). Other factors that influence the visual attention of consumers, when exposed to a shelf, are the number of facings and brand evaluations (Chandon et al., 2009). Overall, the assortment organization within a shelf has been identified as a form of choice architecture that can influence consumer behavior, simply through exposure in a shopping context and without explicit instructions (Lamberton and Diehl, 2013).
Conducting a study in a real-life retail environment, such as a supermarket, is a complex procedure, with many constraints (e.g., negotiating an agreement between researchers and store managers, having some control over the many possible environmental cues, etc.). To overcome these issues, Virtual Reality (VR) can be used to control the environment for each participant, while creating a higher ecological validity than in a laboratory setting (Hartmann and Siegrist, 2019). Virtual reality is a scientific and technical domain that uses computer science (both hardware and software) and behavioral interfaces (recording sensory-motor information) to simulate a virtual world that interacts with the user in real-time (Fuchs and Guitton, 2011). In the last few years, virtual supermarkets have been developed to understand consumer food choices and purchases and represent valid tools to measure consumer behavior. The results obtained are comparable to those in real-life store settings (van Herpen et al., 2016; Pizzi et al., 2019; Siegrist et al., 2019).
The types of products selected, the amount of money spent, the consumers’ responses to price promotions (van Herpen et al., 2016), the products purchased, and the amount of time spent in front of a given shelf can all be measured in VR environments (Pizzi et al., 2019). With such approaches, researchers can obtain data without directly asking consumers about their behavior, motivations, or choices, and thus avoid potential biases linked to direct questioning. Eye-tracking devices have lately been used in the retail environment to assess the visual attention of consumers (Bialkova et al., 2020). Eye-tracking devices measure eye movement, either through the position of the eye relative to the head, or the orientation of the eye in space (Duchowski, 2007). When participants are not aware of the goal of the study, measurement of their gaze behavior is informative about their behaviors: “eye tracking can be regarded as an implicit measurement capturing automatic, involuntary, and unconscious reactions, which are not biased by conscious cognitive thinking” (Duerrschmid and Danner, 2018, p. 281). Visual attention can be influenced by many other factors (Orquin and Mueller Loose, 2013), which may be bottom-up (e.g. image saliency, shape, color, number of images, etc.) or top-down (goal-driven attention, task instruction, individual preference). In an eye-tracking study, Van der Lans et al. (2008) found that in a supermarket display, bottom-up factors (salience—package color and brightness) guide visual attention and search among brands twice more than the consumers’ search goals (top-down factor). This finding goes in accordance with Chandon et al. (2009) who found that in-store factors do influence visual attention more than out-of-store factors. Consequently, combining VR with eye-tracking devices has been identified as an opportunity to better understand consumer behavior in a shopping environment (Meißner et al., 2017). To our knowledge, only one study to date, carried out by Siegrist et al. (2019), has combined VR and eye-tracking measures. These authors compared the purchasing behavior of consumers toward breakfast cereals, in front of a real-life supermarket shelf, and a VR supermarket shelf, by measuring the impact of nutritional information on consumers’ gaze behavior. Results showed that participants had similar gazing behaviors in both real-life and virtual supermarkets.
This exploratory study aimed to capture the behavior of French consumers toward pulses, in a virtual food-shopping environment. Using a VR setting, we immersed participants in a virtual supermarket and studied their gaze behavior by eye-tracking technology. Our objectives were 1) to understand if consumers’ gaze behavior is affected by the composition and organization of different shelves in front of them; 2) to compare the gaze behavior of consumers toward pulse-based products and toward products from other food groups. We hypothesized that (H1) the gaze behavior of consumers toward pulses would vary according to the content and organization of the shelf presented to them. We also hypothesized (H2) that the visual attention of consumers would be lower toward pulses than toward other food-groups when all food-groups were present in equal quantities on the shelf.
Participants (N = 120, aged between 20 and 65) were recruited from the Chemosens Platform’s PanelSens database. This database complies with national data protection guidelines and has been examined by French National authorities (Commission Nationale Informatique et Libertés—CNIL—135 n = 1,148,039). The study was conducted in accordance with the Declaration of Helsinki and was approved by the local ethical committee of INSERM N°18-506. Institutional Review Board INSERM (CEEI/IRB) (IRB00003888, IORG0003254, FWA00005831).
The inclusion criteria for the study were to be resident in Dijon, to read, write, and speak French fluently, and to buy food in a supermarket at least once a month. The exclusion criteria were to have visual problems, to need thick eyeglasses with strong corrective lenses, to be prone to dizziness, or to follow a restrictive food diet (e.g. vegetarian, vegan, without gluten, without lactose, etc.).
Participants were convened to the study under false pretenses (i.e., to participate in a virtual reality study), to avoid having participants focus on pulses, which could bias their gaze behavior. At the end of the study, participants were given full information about the real objectives of the study and were also given a €20 voucher.
Twelve participants were excluded from the study, after data collection. For ten of them, a technical problem prevented the data from being recorded. Another participant did not follow the instructions correctly, and one participant guessed the real aim of the study. Table 1 shows the characteristics of the 108 participants finally included in the study.
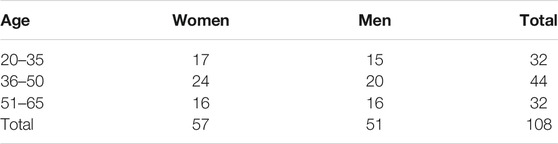
TABLE 1. Distribution of participants in the study, by age range, and sex.
Field observations in French supermarkets allowed us to identify the types of pulse-based food products and their location. Four shelves were identified where the presence of pulses was more prominent: the canned goods shelf, the dried goods shelf, the refrigerated shelf, and the ready-to-eat shelf. A virtual environment was created to reproduce each of these shelves, (Figure 1).
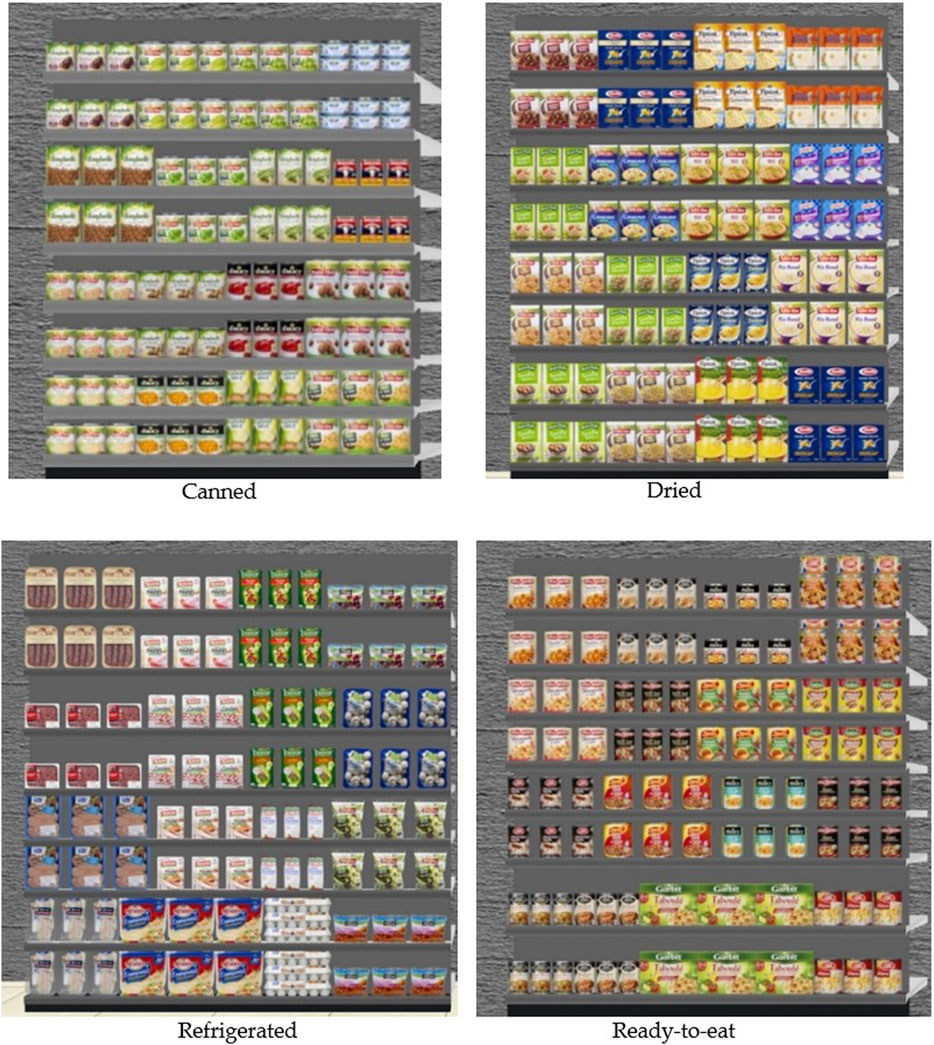
FIGURE 1. An example of the visual design of the four shelves built for the experiment.
All the products presented on the virtual shelves were products actually available in supermarkets at the time of the study. In total, 64 products were included in the experiment, sorted by food-group as follows:
− Foods from animal sources (including meat, fish, chicken, sausage, cheese, eggs, and cream), which will be referred to as animal-based products throughout this paper.
− Pulses (including lentils, dried beans, chickpeas, and dried peas)
− Starches (including pasta, rice, wheat, quinoa, and potatoes)
− Vegetables (including lettuce, tomatoes, carrots, green beans, mushrooms, spinach)
The products used in our study were selected to represent each food-group equally. The level of transformation was also taken into account, following the NOVA classification (Monteiro et al., 2018) (Table 2). When several references were available for a specific product, the selected product was chosen so that its color and shape would not be too different from the other products on the virtual shelf, in order to limit some attentional bias, linked to bottom-up effects related to the color or shape of the product.
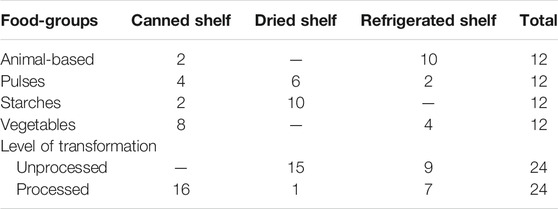
TABLE 2. Construction of the canned, dried, and refrigerated shelves.
Products were purchased from several French supermarkets. All products were photographed in high definition and then integrated into the virtual supermarket using a specific 3D software program. All indications about the expiry date and price were removed. All the products were presented in multiple exemplars, to fill a shelf seemingly as large as a real-life supermarket shelf.
The products in the four different shelves were balanced according to the food group they belong to “canned,” “dried” and “refrigerated” shelves contained products from a single food-group (starches, animal-based, pulses, or vegetables), either unprocessed or processed (Table 2). On the ready-to-eat shelf, products were all based on two major ingredients, belonging to different food-groups (Table 3), and were all classified as ultra-processed, according to the NOVA classification.
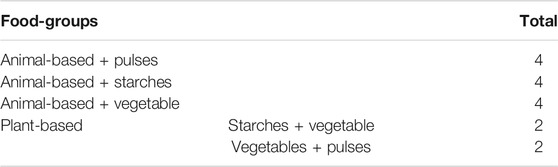
TABLE 3. Construction of the ready-to-eat shelf.
The position of a food product on the shelf may influence consumers’ visual attention (Duerrschmid and Danner, 2018). To avoid any potential order-effect bias, we designed four product organizations for each shelf, by changing the respective position of each food-group on the shelf (Figure 2). The R planor Package (Kobilinsky et al., 2016) was used to balance presentation order, and the four-shelf organizations across participants, using a superposition of two orthogonal Latin squares to obtain a Greco-Latin square.
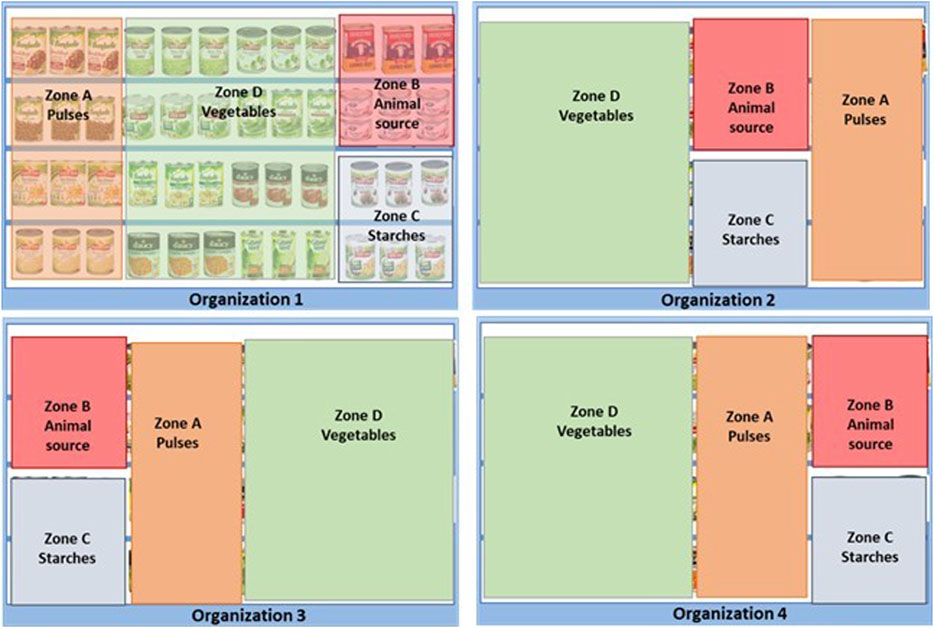
FIGURE 2. Example of the four organizations of the canned shelf used in the test, to balance the position of food-groups across participants. Red is used for animal-based products, green for vegetables, blue for starches, and orange for pulses.
To test the second hypothesis in our study, a “super-shelf” was constructed by placing the canned shelf on the left, the dried shelf in the center, and the refrigerated shelf on the right (Figure 3). The shelves were always presented in this order, but the organization within each shelf was different across participants, as previously explained (Figure 2). Here, 48 different products composed the super-shelf. When divided into food-groups, the super-shelf contained an equal number of animal-based products, pulses, starches, and vegetables.
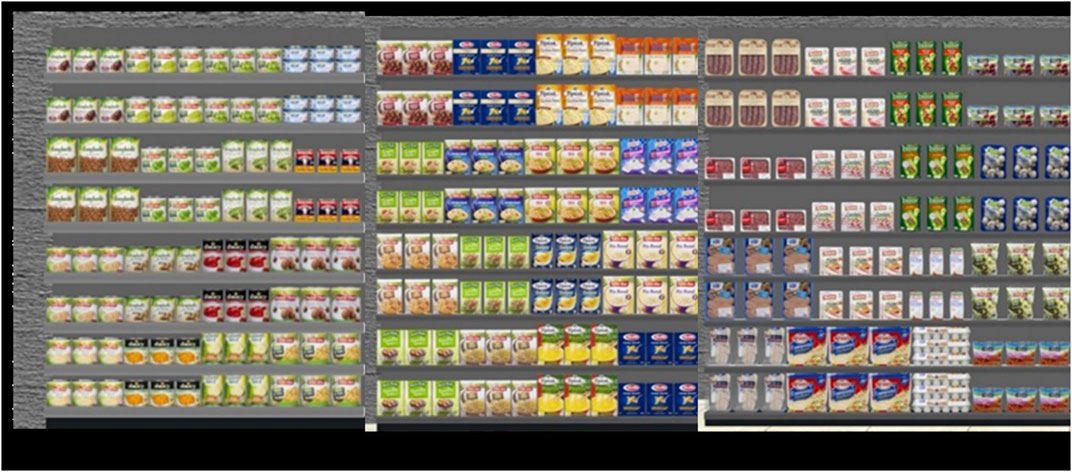
FIGURE 3. Example of organization of the “super-shelf.” From left to right: canned shelf, dried shelf, and refrigerated shelf.
The Virtual Reality set up consisted of a Gear VR headset powered by Oculus, using a Samsung Galaxy S8. A Samsung hand controller was connected via Bluetooth. The field of view in the headset was 101°, with an image resolution of 1480 × 1440 for each eye. The Strategir team developed a specific application to record the virtual eye-tracking data.
An innovative technique called “VR tracking” was used in this study. It differs from classical “eye” or “head” tracking, in the fact that it uses a point at the center of the screen to catch the attention of the participant and allows him to interact with the environment. This approach is similar to the one used in video games: the point is always in the center of the screen and this gaze pointer is managed by the movement of the participant’s head. The field of vision of participants wearing the headset is more restricted than usual (60°), and this requires respondents to naturally move their head more.
This system does not record the xy coordinates (vs. what eye-trackers would do), but the objects (products) that will be identified as an area of interest. Thanks to this technology, not only we were able to track that point but also a certain area around that point, so that it reflects what the eye usually “catches” when looking at a shelf. A specific product is considered as seen if at least a part of it belongs to this “tracking area”. We developed a short video to show the technique used in the study (Supplementary Material). In the left side of the video, we have the headset 360° vision (what participants sees), while in the right side is the preview of the VR application (record data), the red square represents the gaze of participants by the movement of the head.
The distance between the virtual position of the participant and the shelves is limited to 1 m thanks to a virtual and invisible wall behind the participant. At this distance, participants are able to observe all the products contained in a simple shelf. When a larger shelf was used (“super-shelf”), the number of items in the field of view depends on the participants’ decided distance. In this case, participants were able to get closer to the products using the hand controller.
A researcher received one participant at a time, in a neutral room of the laboratory, for a session that lasted about 15 min. Before starting the experiment, participants signed a consent form and were given a brief explanation regarding the material to be used (headset and hand controller). Participants were seated in a chair throughout the study. Participants were able to move freely in the virtual space by using the hand controller connected via Bluetooth.
The researcher helped the participant to put on and adjust the headset. Once ready, the participant was asked to read aloud the instructions that appeared in the virtual environment. This precaution was taken to ensure that all participants read all the instructions carefully. The session was divided into two phases: a screening of each shelf individually, and a screening of the super-shelf.
Before starting the study, a training phase was proposed to teach the participant how to use the controller and to move through the virtual environment. The shelf used for this training phase contained hair-care products with neutral bottles (no brands, pictures or names).
Participants had to observe the four different shelves (Figure 1) for a time-lapse of 20 s per shelf. A standardized visual distance of 1 m was fixed between each shelf and the participant. Participants were stopped in front of the center of each shelf at this distance. The instruction: “Observe the shelf in front of you” was displayed before each shelf appeared.
Once the participants had finished looking at the four shelves, they had to observe the super-shelf (Figure 3) for a standardized time of 40 s. When the super-shelf appeared, participants were placed opposite its center, but participants were then able to move along the super-shelf in the virtual supermarket by using the hand controller, to get closer to the products, and/or to see one particular part of the super-shelf more closely.
Each zone delimitating a food-group on a shelf was determined as an area of interest (AOI). Each shelf contained four AOIs, as did the super-shelf. From the screening phases (individual shelves, and super-shelf), the following measures were obtained for each participant through the eye-tracking device:
− The first fixation (first F): the first Area Of Interest (AOI) seen by each participant
− Time to first fixation (first TF): time from the start of measurement until the beginning of the first fixation, for each AOI (in seconds)
− First fixation duration (first Du): time spent on the AOI first fixed (in seconds)
− Total fixation duration (Du F): sum of all fixation durations within an AOI (in seconds)
− Total number of fixations (Nb F): number of fixations within an AOI (frequency)
Gazes shorter than 200 ms were not considered as fixations (Widdel, 1984). A fixation duration was calculated when participants gazed at the same AOI at least two consecutive times for a period of 200 ms. All these gaze measures were obtained during the screening phase.
Calculations used RStudio Version 1.2.5042 (RStudio Team, 2020) with R-4.0.0 (R Core Team, 2020) with packages: “ez” (Lawrence, 2016), “agricolae” (de Mendiburu, 2020), “PMCMR” (Pohlert, 2014) and XLSTAT for Windows (Addinsoft, version 2020-1).
Descriptive statistics were used for data obtained during the screening phase of each shelf, as the number of food-groups within each shelf was not equal (Table 2). Each measure was transformed into a ratio, obtained by dividing the raw measured value by the total number of food-products within each AOI. Indeed, the size of a zone is proportional to the number of products it contains.
For data obtained during the screening of the super-shelf, we focused on the total fixation duration and the total number of Fixations. For the time measures, a one-way repeated-measures ANOVA was performed, with total fixation duration as the dependent variable, AOI (food-groups) as the independent variable, and participant as within-subjects. ANOVA was applied after checking that 1) observations were independent (or, more precisely, independent and identically distributed variables), 2) the variables followed a multivariate normal distribution in the population (this assumption is not necessary if the sample size≥25), and 3) sphericity. When applicable, multiple pairwise comparisons were carried out with a Tukey test. For the total number of Fixations, Friedman tests followed by Nemenyi pairwise comparisons were run to determine if the differences between the total numbers of fixations were significant for a given food-group.
A significance level of 0.05 was set for all the analyses.
In the screening phase, the visual attention of consumers toward each food-group was studied for each shelf independently. Table 4 shows the results obtained and transformed into ratios, taking into consideration the number of products within each AOI, for the canned, dried, and refrigerated shelves. The number of products from each food group was not the same in each shelf, because each food group does not exist in each type of shelves. For this reason, this paragraph will only be descriptive.

TABLE 4. Gaze behavior in seconds converted into ratios (eye-tracking measures) of consumers toward each AOI (food-group) in the screening for the canned, dried, and refrigerated shelves. First fixation (1st F, in %), Time to First Fixation (1st TF, in sec), First Fixation Duration (1st Du, in sec), and Number of fixations (NbF).
For the canned shelf, we can note that 36% of consumers looked first at the vegetables, while many others looked first at starches. The time to the first fixation was shorter for vegetables and longer for animal-based products. The first fixation duration, the total fixation duration, and the total number of fixations were all shorter for vegetables, and particularly high for starches compared to other canned products.
On the dried shelf, there were only pulses and starches, because vegetables and meat are not products sold dried in French supermarkets. Here, the first fixation of participants was a little higher for pulses than for starches. The time to the first fixation was also higher for pulses than for starches. On the contrary, the first fixation duration, the total fixation duration, and the total number of fixations were all shorter for pulses than for starches.
The refrigerated shelf did not contain starches, like refrigerated shelves in French supermarkets. For this shelf, two-thirds of the participants looked first at vegetables. The time to the first fixation, the first fixation duration, the total fixation duration, and the total number of fixations were higher for pulses than for products from other groups. The time to the first fixation was shorter for animal-based products than for other products, and the three other indexes were lower for vegetables.
As the ready-to-eat shelf contained products combining multiple food-groups, the results were analyzed independently (Table 5). The first fixation of participants was more frequent toward pulses–vegetables and less frequent toward starches–vegetables. The time to the first fixation and the first fixation duration were longer toward starches–vegetables, and shorter for animal-based products–starches and animal-based products–pulses. Finally, the total fixation duration and the total number of fixations were higher for starches–vegetables and lower for animal-based products–starches and animal-based products—vegetables.

TABLE 5. Gaze behavior in seconds converted into ratios, eye-tracking measures of consumers toward each AOI (food-group) in the screening of the ready-to-eat shelf. First fixation (1st F, in %), Time to First Fixation (1st TF, in sec), First Fixation Duration (1st Du, in sec), and Number of fixations (NbF).
In a second step of the screening phase, consumers had to observe the super-shelf, where products from the four categories were presented in equal numbers. The first fixation was often for pulses and starches, and less frequently directed toward vegetables. This result needs to be considered with caution, because the dried shelf, composed of pulses and starches, was positioned in the center of the super-shelf for all participants. Therefore, participants had these products just in front of them when they “stood” in front of the middle of the shelf, and the first fixation for these products could perhaps be explained by a positioning effect. Unfortunately, this positioning bias could not be avoided when designing the experiment, because of technical limitations that prevented any possibility of randomizing the position of the individual shelves within the super-shelf. Thus, in this case, the first fixation may not be informative and needs to be considered with caution, as well as the time to first fixation and first fixation duration, which directly depend on the first fixation. Here, the first fixation duration was similar across food-groups.
Consequently, to address this drawback and to measure if there were differences in the gaze behavior of participants toward the different food-groups on the super-shelf, we focused on the total duration of fixation and the total number of fixations. The repeated measures ANOVA showed significant differences between the total fixation duration and the food-groups (p < 0.0001). Pairwise comparisons obtained by a Tukey test (Figure 4) show that participants spent significantly more time looking at the products from the starch’s food-group, compared to the animal-based (p = 0.013) and vegetable food-groups (p < 0.0001). Participants observed for a longer time the pulses (p = 0.000) and the animal-based food-groups (p = 0.013) compared to the vegetable food group.
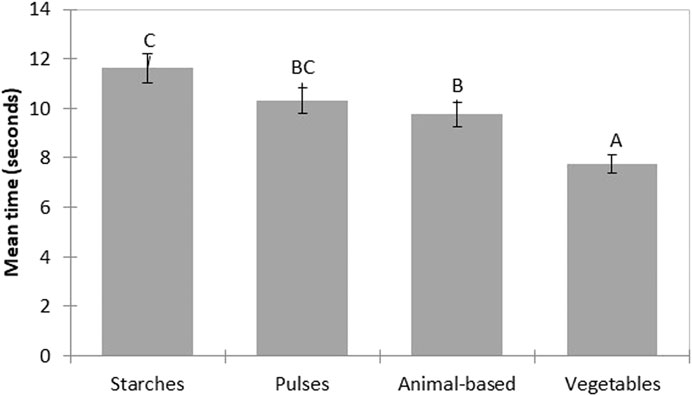
FIGURE 4. Mean time of total fixation duration. Products with the same letter were chosen with a comparable frequency (pairwise Tukey test; p < 0.05).
Regarding the total number of fixations, results were converted to ranks and analyzed by a Friedman test. This analysis showed significant differences among food-groups (p < 0.0001). Figure 5 shows that the starches had a higher number of fixations than the animal-based and vegetable food groups. Pulses had a higher number of fixations than the vegetable food group.

FIGURE 5. Mean number of fixations for each food-group. Letters indicate a comparable number of fixations across food-groups (two-tailed Nemenyi test; p < 0.05).
The main objective of this study was to understand the gaze behavior of French consumers toward pulses in front of virtual shelves.
Participants in this study had to perform a screening of four different shelves, to understand how their visual attention is affected by the composition and organization of shelves. The first fixation for a specific type of product seemed to change across shelves. In the two individual shelves where vegetables were present, vegetables were fixated first by many participants. In these individual shelves, the attention is primarily oriented toward vegetables whereas pulses are rarely fixated first. By contrast, on the dried shelf, where there were no vegetables, about half the participants directed their first gaze toward pulses and the other half toward starches. Knowing that on this shelf, there were only unprocessed pulses and starches, this result suggests two possible explanations: 1) participants’ visual attention was attracted by unprocessed pulses more than by cooked and prepared pulses, or/and 2) the attention toward a certain category of products depends on the other products presented on the same shelf. This is in line with Burke and Leykin (2014), who stated that some key drivers of attention toward a product, when shoppers are just browsing at a shelf, are proximity between categories, shelf position, product presentation, and visual distinction. Regarding the ready-to-eat shelf, the first fixation of participants was more frequently directed toward products that combined pulses and vegetables. This result seems surprising because we expected that products combining pulses and animal-based products would attract participants’ visual attention more than products combining pulses and vegetables, as ready-to-eat products containing pulses are generally combined with animal-based products in French supermarkets. One potential explanation of the visual attention toward vegetables on all shelves could be based on a particularly strong mental representation of vegetables for French consumers. Indeed, in the recent decade, there has been a lot of public health communication promoting vegetables.
In our study, based on the total fixation duration and the total number of fixations, pulses had lower visual attention in the dried and canned shelves, whereas there was higher visual attention in the refrigerated shelf. Consequently, our results highlighted that participants in our study looked at pulses differently on each shelf, either for long or shorter periods, showing that with the same instructions and the same time of screening, visual attention changed across shelves. These results suggest that shelf organization and presentation have an impact, yet some differences were observed between the different measures (first fixation, the total number of fixations, and the total duration of fixation).
These differences in visual attention in relation to the composition of the shelf may also be explained by the duration of the screening phase, set at 20 s. In a previous eye-tracking study Potthoff and Schienle, (2020) investigated visual attention toward high calorie, low-calorie food, and non-food products for a standard duration of 6 s, the authors found an overall visual preference (longer fixation) toward high-calorie food only in the first second, followed by a shift in visual attention which developed toward the low-calorie products. This could explain why we found differences between the first fixation and the other measures, and it highlights the need to study first fixations with caution. Based on these considerations, we think that our first hypothesis (H1: the visual attention of consumers toward pulses would vary according to the content and organization of the shelf presented to them) can be validated. The visual attention of French consumers toward pulses varies according to the type of shelf on which pulses are presented. This could be explained by the characteristics of pulses products themselves, but also by the characteristics of the other products of the shelf.
In our study, participants had to perform a screening of a super-shelf, composed of three out of the four shelves (canned, dried, and refrigerated) to compare the gaze behavior of consumers toward pulses and other food-groups. The design of the super shelf allowed us to compare the gaze behavior of consumers toward pulses with their gaze behavior toward the other food-groups. The super-shelf was constructed so that the number of products was equal for each food-group (starches, pulses, vegetables, and animal-based products). Participants had a different gaze behavior toward each food-group. They observed pulses more often and for a longer time than they observed the vegetable food group. Thus, our second hypothesis (H2: the visual attention of consumers would be lower toward pulses than toward other food-groups when all food-groups were present in equal quantities on the shelf) is not validated. A recent study (Gere et al., 2020) has shown that the product group influences gaze behavior (top-down processes) more than the perception of the color or size of a product (bottom-up processes). A previous eye-tracking study also found that participants had different fixation durations toward two different food-groups (milk chocolate and orange juice). The authors observed longer fixations toward the nutritional table for the orange juice, whereas for milk chocolate, participants looked longer at the brand (Steinhauser et al., 2019). This result suggests that participants spend more or less time on a product depending on the characteristic of the products that interest them the most. Besides, it arises the question of the role of bottom-up and top-down factors in visual attention. In our study, participants were only asked to look at/to screen the shelf, without any other task instruction (top-down factor). We also erased specific information such as price and expiry date from packaging, thus lessening this bottom-up effect (visual characteristics). But it cannot be excluded that participants in our study could pay more or less visual attention to a particular food-group, focusing on a characteristic meaningful to them. It has also been shown that personal preferences toward food with different forms (regular, chopped, or blended) can increase the total number of fixations and the total fixation duration (Yasui et al., 2019). Thus, we could imagine that the personal preference of consumers toward the products on the super-shelf may have influenced their gaze behavior. Similarly, familiarity with the products presented (brands) could have also influenced the gaze behavior of participants. Indeed, in an eye-tracking study, Atalay et al. (2012) presented to participants brands that did not exist, arguing that previous exposure or purchase could impact gaze behavior. Thanks to this protocol, they demonstrated that eye fixations can result from memory-based factors. Regarding the visual attention toward pulses, perhaps the low consumption of pulses in France [1.7 kg per person per year (ANSES, 2017)] could induce a low level of familiarity of participants toward pulses based products in the retail environment. Indeed, participants not consuming pulses often could result into an infrequent exposure to these products on the market and a low familiarity with pulses packages. This could even lead to a vicious circle, with pulses no catching consumer’s attention because they are not familiar, and not being chosen because they do not catch attention, which results in low consumption and a low familiarity. In this sense, retailers have to make an extra effort to make pulses more visible for French non-vegetarian consumers in their shelves.
With our experimental design, we constructed different shelves that reflect what can be found in French supermarkets, but with a limited number of products. Our results highlighted that the gaze behavior of participants toward pulses on each shelf was different. In two out of the four shelves, visual attention was lower for pulses than for other food-groups, whereas for the super-shelf, participants looked at pulses less often than at starches.
From a practical point of view, our study raised different possible perspectives. It has been shown that consumers find specific products on a shelf faster when they have in mind a clear picture of the desired brand (Burke and Leykin, 2014). Thus, consumers can be oriented in decision-making about pulses by reducing their mental effort (i.e., with national brands, association in a single shelf … ). For consumers who tend to browse, it may be useful to provide in-store display cues (i.e. arrows, labels … ) to suggest shopping goals (Morales et al., 2005). Other strategies like nudging have been identified, to impact consumer behavior. A nudge is defined as “any aspect of the choice architecture that alters people’s behavior predictably, without forbidding any options or significantly changing their economic incentives. To count as a mere nudge, the intervention must be easy and cheap to avoid” (Thaler and Sunstein, 2008).
One strength of our study is the use of Virtual Reality (VR) in the food domain thanks to the building of a virtual supermarket which allowed us to study participants’ gaze behavior toward a diversified offer of products. The use of the VR allowed us to study the context in which choices are done. Indeed, it has been shown that the role of context on food choice cannot be neglected (Sester et al., 2013). Studying this effect in a real supermarket is particularly difficult and does not allow to control the different variables, thus the virtual supermarket is a good compromise between a laboratory setting and a real context of choice. Previous study showed similar behavior in real and virtual supermarket, where the issue of not walking was not identified as a barrier (van Herpen et al., 2016).
Our study followed rigorous methodological aspect concerning the building of the virtual shelves. Four different shelves were identified in the French supermarkets and re-created in a virtual environment. Participants were asked only to observe each shelf for a limited time but were not asked to choose a product. While participants were screening each shelf, eye-tracking measures were obtained. One of the advantages of this type of assessment is that it can provide information about the possible reasons for consumer choices when exposed to a specific shelf organization, without any explicit instructions.
To protect against bias linked to a tendency to look preferentially at a specific zone, we balanced the position of the four groups of products on each individual shelf between participants, so that the measured differences in gaze behavior cannot be the result of product positioning. Our results showed that the first gaze of participants tended to be directed toward the zone located on the upper left side of the shelf (results not shown). Products positioned in this zone tend to be looked at first. Thanks to the balanced design of our study, we were able to overcome this tendency, and could therefore compare gaze behavior toward each zone of interest without any bias. Unfortunately, one of the limitations is that the dried shelf was always placed in the center of the super-shelf. As a consequence, we were not able to study the first fixation for the super-shelf. This limit will probably be overcome as technology progresses.
In our study, product visual characteristics were controlled on each shelf to reduce bottom-up effects as much as possible: on the canned shelf, only metallic cans were presented; in the dried shelf, only cardboard; on the refrigerated shelf, only products with transparent plastic presentation, and on the ready-to-eat shelf, mainly canned products (with one exception). Comparatively to what is commonly done in marketing studies, we also tried as much as possible to balance the different colors of product packaging on each shelf so as not to attract visual attention.
Our study also highlighted that the other products presented on the shelf can also influence the gaze behavior of consumers toward the product of interest. Consequently, to observe more realistic behavior with eye-tracking and virtual reality studies, it is necessary to pay attention to the surrounding products besides choosing the products of interest carefully.
Anyway, the virtual design did not allow us to consider as many product references as currently proposed in real supermarkets. For this reason, the set of studied products was sparse in comparison to the products really available in a real grocery store. Additionally, and because of this global low number of products, the proportion of pulses in our study was higher than that of real supermarkets, because we wanted to present a balanced number of products in each food group. In a real supermarket, the number of food products is greater and pulses products could become lost amongst all the other products.
Overall, the implicit measures by eye-tracking allowed us to identify the gaze behavior of French consumers toward pulses in different shelves of a virtual supermarket. We found that pulses were not great eye-catchers, especially for the dried and canned shelves. Yet, they created visual interest (consumers looked at them for some time) on the refrigerated shelf and on the ready-to-eat shelf, revealing that visual attention toward pulses changes according to the composition and organization of the shelf to which a consumer is exposed. In the screening of the super-shelf, pulses attracted more visual attention than vegetables but less than starches and animal-based products, which suggests differences in gaze behavior in relation to food categories. Participants allocated visual attention differently to each food-group. There is a need to develop adapted strategies in French supermarkets to incentivize consumers to choose pulses more frequently in their shopping behavior. For instance, a specific shelf for pulses could result in a more salient visual option for pulses, making them easy to find and identify, creating cues such as arrows marking the presence of a pulse product on a shelf, or implementing nudging strategies inside the retail environment. From a more technical point of view our study highlighted that the use of virtual reality is challenging and can still be improved, especially when studying consumer behavior toward food. For instance, it will be possible in the future to increase the complexity of the virtual environment by, adding more food products. In addition, it would be interesting to improve the interaction and feeling of immersion of participants in the virtual environment, by allowing a better grasping of food products or an easier mobility of participants in the environment. Considering the challenges that have to be overcome in the food domain, this area of application should be considered as an opportunity in the forthcoming development of virtual reality. In particular, in the research field, new implicit methodologies would benefit from being implemented in environments as close to a real life context but with a strict control of the different factors.
The datasets presented in this study can be found in online repositories. The names of the repository/repositories and accession number(s) can be found below: https://doi.org/10.6084/m9.figshare.13574567.v1.
The studies involving human participants were reviewed and approved by the INSERM N°18-506. Institutional Review Board INSERM (CEEI/IRB) (IRB00003888, IORG0003254, FWA00005831). The patients/participants provided their written informed consent to participate in this study.
Conceptualization of the study: JM-R, SC, GA, IG, J-CC, and KP. Data curation and formal analysis was carried out by JM-R and LD. Investigation and methodology by JM-R, SC, and GA. Resources by IG, J-CC, and KP. Validation SC, GA, and KP. Writing—original draft by JM-R and SC. Writing—review and editing: JM-R, SC, GA, LD, IG, J-CC, and KP. Supervision, SC and GA. Funding acquisition and project administration by GA.
This work was supported by the Carnot institute Qualiment®
The authors declare that the research was conducted in the absence of any commercial or financial relationships that could be construed as a potential conflict of interest.
The authors thank Cecile Schneider in the collection of data. Carmela Chateau-Smith is particularly acknowledged for English proofreading. We thank the other colleagues of Strategir, Hélène Aubrier and Alexiane Luc for their help.
The Supplementary Material for this article can be found online at: https://www.frontiersin.org/articles/10.3389/frvir.2021.655273/full#supplementary-material
ANSES. (2017). INCA 3: Evolution des habitudes et modes de consommation, de nouveaux enjeux en matière de sécurité sanitaire et de nutrition [Dossier de presse].
Atalay, A. S., Bodur, H. O., and Rasolofoarison, D. (2012). Shining in the Center: Central Gaze Cascade Effect on Product Choice. J. Consum Res. 39 (4), 848–866. doi:10.1086/665984
Bialkova, S., Grunert, K. G., and van Trijp, H. (2020). From Desktop to Supermarket Shelf: Eye-Tracking Exploration on Consumer Attention and Choice. Food Qual. Preference 81, 103839. doi:10.1016/j.foodqual.2019.103839
Burke, R. R., and Leykin, A. (2014). “Identifying the Drivers of Shopper Attention, Engagement, and Purchase”. Review of Marketing Research. Editors D. Grewal, A. L. Roggeveen, and J. NordfÄlt (Bingley: Emerald Group Publishing Limited), Vol. 11, 147–187. doi:10.1108/S1548-643520140000011006
Chandon, P., Hutchinson, J. W., Bradlow, E. T., and Young, S. H. (2009). Does In-Store Marketing Work? Effects of the Number and Position of Shelf Facings on Brand Attention and Evaluation at the Point of Purchase. J. Marketing 73 (6), 1–17. doi:10.1509/jmkg.73.6.1
de Mendiburu, F. (2020). Agricolae: Statistical Procedures for Agricultural Research. Available at: https://CRAN.R-project.org/package=agricolae.
Duerrschmid, K., and Danner, L. (2018). “Eye Tracking in Consumer Research,” in Methods in Consumer Research. Volume 2: Alternative Approaches and Special Applications. Editors G. Ares, and P. Varela-Tomasco (Cambridge, MA: Woodhead Publishing, an imprint of Elsevier).
Fuchs, P., and Guitton, P. (2011). “Introduction to Virtual Reality,” in Virtual Reality: Concepts and Technologies. Editor G. Moreau (Boca Raton, FL: CRC Press). doi:10.1201/b11612-3
Gere, A., Danner, L., Dürrschmid, K., Kókai, Z., Sipos, L., Huzsvai, L., et al. (2020). Structure of Presented Stimuli Influences Gazing Behavior and Choice. Food Qual. Preference 83, 103915. doi:10.1016/j.foodqual.2020.103915
Hartmann, C., and Siegrist, M. (2019). Virtual Reality and Immersive Approaches to Contextual Food Testing. In CONTEXT: the effects of environment on product design and evaluation. Available at: http://search.ebscohost.com/login.aspx?direct=true&scope=site&db=nlebk&db=nlabk&AN=1908134.
Kobilinsky, A., Bouvier, A., and Manod, H. (2016). An R Package for the Automatic Generation of Regular Fractional Factorial Designs. INRA, UR 341, Unité MIAJ (Math ématiques et Informatique Appliquées - Jouy).
Lamberton, C. P., and Diehl, K. (2013). Retail Choice Architecture: The Effects of Benefit- and Attribute-Based Assortment Organization on Consumer Perceptions and Choice. J. Consum Res. 40 (3), 393–411. doi:10.1086/671103
Lawrence, M. A. (2016). Easy Analysis and Visualization of Factorial Experiments. Available at: http://github.com/mike-lawrence/ez.
Magrini, M.-B. (2016). Les légumes secs en France (LES LÉGUMES SECS, QUELS DÉVELOPPEMENTS POSSIBLES À L’ÉCHELLE DES TERRITOIRES ?) [Synthèse des débats - Journée d’échanges organisée par le Réseau action climat et Solagro au Ministère de l’environnement, de l’énergie et de la mer]. Available at: https://solagro.org/images/imagesCK/files/publications/f78_actes_-legumes-secs-2016.pdf.
Meißner, M., Pfeiffer, J., Pfeiffer, T., and Oppewal, H. (2019). Combining Virtual Reality and mobile Eye Tracking to Provide a Naturalistic Experimental Environment for Shopper Research. J. Business Res. 100, 445–458. doi:10.1016/j.jbusres.2017.09.028
Monteiro, C. A., Cannon, G., Moubarac, J.-C., Levy, R. B., Louzada, M. L. C., and Jaime, P. C. (2018). The UN Decade of Nutrition, the NOVA Food Classification and the Trouble with Ultra-processing. Public Health Nutr. 21 (01), 5–17. doi:10.1017/S1368980017000234
Morales, A., Kahn, B. E., McAlister, L., and Broniarczyk, S. M. (2005). Perceptions of Assortment Variety: The Effects of Congruency between Consumers' Internal and Retailers' External Organization. J. Retailing 81 (2), 159–169. doi:10.1016/j.jretai.2005.03.007
Orquin, J. L., and Mueller Loose, S. (2013). Attention and Choice: A Review on Eye Movements in Decision Making. Acta Psychologica 144 (1), 190–206. doi:10.1016/j.actpsy.2013.06.003
Pizzi, G., Scarpi, D., Pichierri, M., and Vannucci, V. (2019). Virtual Reality, Real Reactions?: Comparing Consumers' Perceptions and Shopping Orientation across Physical and Virtual-Reality Retail Stores. Comput. Hum. Behav. 96, 1–12. doi:10.1016/j.chb.2019.02.008
Pohlert, T. (2014). The Pairwise Multiple Comparison of Mean Ranks Package (PMCMR), R Package. Available at: https://CRAN.R-project.org/package=PMCMR.
Potthoff, J., and Schienle, A. (2020). Time-course Analysis of Food Cue Processing: An Eye-Tracking Investigation on Context Effects. Food Qual. Preference 84, 103936. doi:10.1016/j.foodqual.2020.103936
R Core Team (2020). R: A Language and Environment for Statistical Computing. R Foundation for Statistical Computing. Available at: https://www.R-project.org/.
Rio, C. (2017). Les légumes secs, aliments de choix à valoriser. Cahiers de Nutr. de Diététique 52 (2), 71–77. doi:10.1016/j.cnd.2016.11.006
RStudio Team (2020). RStudio: Integrated Development for R. RStudio, PBC. Available at: http://www.rstudio.com/.
Scheibehenne, B., Greifeneder, R., and Todd, P. M. (2010). Can There Ever Be Too Many Options? A Meta-Analytic Review of Choice Overload. J. Consum Res. 37 (3), 409–425. doi:10.1086/651235
Sester, C., Deroy, O., Sutan, A., Galia, F., Desmarchelier, J.-F., Valentin, D., et al. (2013). “Having a Drink in a Bar”: An Immersive Approach to Explore the Effects of Context on Drink Choice. Food Qual. Preference 28 (1), 23–31. doi:10.1016/j.foodqual.2012.07.006
Siegrist, M., Ung, C.-Y., Zank, M., Marinello, M., Kunz, A., Hartmann, C., et al. (2019). Consumers' Food Selection Behaviors in Three-Dimensional (3D) Virtual Reality. Food Res. Int. 117, 50–59. doi:10.1016/j.foodres.2018.02.033
Steinhauser, J., Janssen, M., and Hamm, U. (2019). Consumers' purchase Decisions for Products with Nutrition and Health Claims: What Role Do Product Category and Gaze Duration on Claims Play? Appetite 141, 104337. doi:10.1016/j.appet.2019.104337
Thaler, R. H., and Sunstein, C. R. (2008). Nudge: Improving Decisions about Health, Wealth, and Happiness. New Haven: Yale University Press.
van der Lans, R., Pieters, R., and Wedel, M. (2008). Research Note-Competitive Brand Salience. Marketing Sci. 27 (5), 922–931. doi:10.1287/mksc.1070.0327
van Herpen, E., van den Broek, E., van Trijp, H. C. M., and Yu, T. (2016). Can a Virtual Supermarket Bring Realism into the Lab? Comparing Shopping Behavior Using Virtual and Pictorial Store Representations to Behavior in a Physical Store. Appetite 107, 196–207. doi:10.1016/j.appet.2016.07.033
Widdel, H. (1984). Operational Problems in Analysing Eye Movements. in Advances in Psychology. North Holland: Elsevier, 22, 21–29. doi:10.1016/S0166-4115(08)61814-2
Keywords: gaze behavior, consumer, immersive environment, plant-based food, implicit method
Citation: Melendrez-Ruiz J, Goisbault I, Charrier J-C, Pagnat K, Dujourdy L, Arvisenet G and Chambaron S (2021) An Exploratory Study Combining Eye-Tracking and Virtual Reality: Are Pulses Good “Eye-Catchers” in Virtual Supermarket Shelves?. Front. Virtual Real. 2:655273. doi: 10.3389/frvir.2021.655273
Received: 18 January 2021; Accepted: 17 May 2021;
Published: 31 May 2021.
Edited by:
Daniel Thalmann, École Polytechnique Fédérale de Lausanne, SwitzerlandReviewed by:
Florian Daiber, German Research Center for Artificial Intelligence (DFKI), GermanyCopyright © 2021 Melendrez-Ruiz, Goisbault, Charrier, Pagnat, Dujourdy, Arvisenet and Chambaron. This is an open-access article distributed under the terms of the Creative Commons Attribution License (CC BY). The use, distribution or reproduction in other forums is permitted, provided the original author(s) and the copyright owner(s) are credited and that the original publication in this journal is cited, in accordance with accepted academic practice. No use, distribution or reproduction is permitted which does not comply with these terms.
*Correspondence: Juliana Melendrez-Ruiz, SnVsaWFuYS5tZWxlbmRyZXpydWl6QGlucmFlLmZy
Disclaimer: All claims expressed in this article are solely those of the authors and do not necessarily represent those of their affiliated organizations, or those of the publisher, the editors and the reviewers. Any product that may be evaluated in this article or claim that may be made by its manufacturer is not guaranteed or endorsed by the publisher.
Research integrity at Frontiers
Learn more about the work of our research integrity team to safeguard the quality of each article we publish.