- 1Department of Microbiology and Immunology, Drexel University College of Medicine, Philadelphia, PA, United States
- 2Center for Molecular Virology and Gene Therapy, Institute for Molecular Medicine and Infectious Disease, Drexel University College of Medicine, Philadelphia, PA, United States
- 3Center for Pathogenic Emergence and Bioinformatics, Institute for Molecular Medicine and Infectious Disease, Drexel University College of Medicine, Philadelphia, PA, United States
- 4Sidney Kimmel Cancer Center, Thomas Jefferson University, Philadelphia, PA, United States
Accounting for genetic variation is an essential consideration during human immunodeficiency virus type 1 (HIV-1) investigation. Nanopore sequencing preserves proviral integrity by passing long genomic fragments through ionic channels, allowing reads that span the entire genome of different viral quasispecies (vQS). However, this sequencing method has suffered from high error rates, limiting its utility. This was the inspiration behind HIV-Quasipore: an HIV-1-specific Nanopore basecaller suite designed to overcome these error rates through training with gold-standard data. It comprises three deep learning-based R9.4.1 basecallers: fast, high accuracy (HAC), super accuracy (SUP), and two R10.3 deep learning-based basecallers: HAC and SUP. This was accomplished by sequencing the HIV-1 J-Lat 10.6 cell line using Nanopore and high-quality Sanger techniques. Training significantly reduced basecaller error rates across all models (Student’s one-sided t-test; p = 0.0) where median error rates were 0.0189, 0.0018, 0.0008, for R9.4.1 HIV-Quasipore-fast, HAC, SUP, and 0.0007, 0.0011 for R10.3 HIV-Quasipore-HAC, and SUP, respectively. This improved quality reduces the resolution needed to accurately detect a vQS from 22.4 to 2.6% of total positional coverage for R9.4.1 HIV-Quasipore-fast, 6.9 to 0.5% for R9.4.1 HIV-Quasipore-HAC, 4.5 to 0.3% for R9.4.1 HIV-Quasipore-SUP, 8.0 to 0.3% for R10.3 HIV-Quasipore-HAC, and 5.4 to 0.3% for R10.3 HIV-Quasipore-SUP. This was consistently observed across the entire J-Lat 10.6 genome and maintained across longer reads. Reads with greater than 8,000 nucleotides display a median nucleotide identity of 0.9819, 0.9982, and 0.9991, for R9.4.1 HIV-Quasipore-fast, HAC, SUP, and 0.9993, 0.9988 for R10.3 HIV-Quasipore-HAC, and SUP, respectively. To evaluate the robustness of this tool against unseen data, HIV-Quasipore and their corresponding pretrained basecallers were used to sequence the J-Lat 9.2 cell line and a clinical isolate acquired from the Drexel Medicine CARES cohort. When sample reads were compared against their corresponding consensus sequence, all HIV-Quasipore basecallers displayed higher median alignment accuracies than their pretrained counterparts for both the J-Lat 9.2 cell line and clinical isolate. Using Nanopore sequencing can allow investigators to explore topics, such as vQS profile detection, HIV-1 integration site analysis, whole genome amplification, gene coevolution, and CRISPR-induced indel detection, among others. HIV-Quasipore basecallers can be acquired here: https://github.com/DamLabResources/HIV-Quasipore-basecallers.
Introduction
Accounting for genetic variation is an essential consideration during many types of investigations concerning human immunodeficiency virus type 1 (HIV-1) pathogenesis and disease, namely, those centered on the development of new and innovative vaccines, therapeutics, and viral reservoirs, among many others. This diversity stems from the error-prone HIV-1 reverse transcriptase (1, 2), APOBEC3G-induced hypermutation (3, 4), and host immune pressures. Different variants can be observed within individual patients—referred to as viral quasispecies (vQS) (5–10)—and have clinical consequences. Through gRNA-target mismatches, HIV-1 can mutate around antiretroviral therapy (ART) by introducing drug-resistance mutations (11–13) and anti-HIV-1 gene editing therapies (14–18) through gRNA-target mismatches. Each patient has a unique vQS profile and understanding its composition and evolution can aid in cure strategy development and enhance precision medicine.
Current sequencing methods are not suited for vQS investigation. Sanger sequencing generates a single consensus HIV-1 genome, rendering it incapable of observing patient vQS without labor-intensive cloning techniques. Illumina sequencing is capable of highly accurate haplotype assembly (19, 20), opening a window into the vQS population of a patient. However, these are algorithmic reconstructions and may be subject to unknowable biases. While it captures intra-patient HIV-1 genetic variation, individual reads (~150–300 bps) are unable to encapsulate the entire provirus, rendering it incapable of performing investigations such as distant coevolution studies (e.g., across tat and rev exons) and detecting vQS-specific large-scale deletions pervasive within the latent reservoir (21). An ideal sequencing method should maintain vQS genomic integrity and display enough sensitivity to detect subtle variability within each genome. Third-generation sequencing techniques like Pacific Biosciences (PacBio) and Nanopore sequencing fit these criteria. However, PacBio is currently cost inefficient for smaller sample sizes and has low throughput (22). Conversely, the Nanopore MinION sequencer is inexpensive ($1,000 as of 08/24/21) (23), high throughput, pocket-sized, allows for live-basecalling, and can quickly generate up to 50 GB of data per run, making it practical and easy to implement, even in low-income clinical settings (23).
Nanopore sequencing occurs by threading single-stranded DNA through an ionic channel (24). As the sequence passes through the channel, it disrupts the electric current of the channel (24–27). These disruptions are captured by the sequencer as trace data. Each nucleotide has its own disruption signature, making it simple to map each signature to a corresponding nucleotide. Because the library preparation does not require sequence fragmentation, Nanopore sequencing maintains vQS integrity using reads that can capture most or the entirety of its genome, which allows for an accurate reconstruction of the vQS profile of an individual.
Early Nanopore sequencing has suffered from high error rates (PromethION: 11.2% error rate; MinION 15.6% error rate) (28), limiting its utility. However, recent algorithmic developments have minimized these error rates to an acceptable level [e.g., a modal 98.3% read accuracy was achieved on the Zymo mock community sample using an R9.4.1 flowcell and a “super accuracy” basecaller (“Nanopore Sequencing Accuracy” 2022)]. Oxford Nanopore Technologies’ (ONT) currently endorsed basecallers are underpinned by deep neural networks and outperform their predecessors and open-source competitors (25–27). Neural networks are machine learning models that can be trained to minimize the error between the called reads and true sequences, allowing them to accurately basecall trace data. ONT’s basecallers were trained using Homo sapiens trace data, allowing them to excel at H. sapiens-specific basecalling but suffer at calling other dissimilar organisms, such as HIV-1. If the primary goal is to detect HIV-1 vQS, these basecallers must excel at calling HIV-1-specific trace data. Neural networks have the unique ability to be applied to a separate but similar task that they were trained to solve by undergoing additional training using task-specific data. This technique is referred to as “transfer learning”. Because these basecallers are pretrained neural networks, they can be further refined using HIV-1 trace data to excel at HIV-1-specific basecalling.
This is the inspiration behind the development of HIV-Quasipore—a set of fast, high-accuracy (HAC) and super-accuracy (SUP) HIV-1-specific basecallers. HIV-1 trace data are acquired from the J-Lat 10.6 cell line and are used to refine the basecallers and allow them to excel at HIV-1 basecalling and vQS detection. As the names imply, the HAC and SUP basecallers yield highly accurate reads at the cost of speed, while the fast basecaller can quickly call reads at the cost of accuracy. Each is designed for separate purposes. While HAC and SUP basecallers are designed for pipeline incorporation, fast basecallers are designed to be implemented during live Nanopore basecalling. The differences between these basecallers are a direct result of their composition. While all basecallers are underpinned by deep neural networks, fast basecallers have fewer parameters than HAC basecallers, which have fewer parameters than SUP basecallers. This allows calls to be processed quicker than in the HAC and SUP models, but suffers from accuracy loss as it lacks the size to capture how complex trace patterns correspond to different nucleotides. The converse is true for the HAC and SUP basecallers. They are large enough to accurately predict nucleotides from even the most complex trace patterns, but suffer from slower basecalling. The SUP basecaller is larger and has more parameters than the HAC basecaller, which allows for subtle signal detection at the cost of slower basecalling. Training these three models allows a user to freely choose which one best suits their needs.
Nanopore sequencing allows the potential to spearhead otherwise impossible analyses (e.g., vQS-specific tat and rev exon matching, true coevolution studies, vQS-specific integration site investigations) and simplify challenging analyses (e.g., HIV-1 whole genome amplification, vQS-specific CRISPR-induced InDel detection) that leverage other sequencing technologies. Training and applying HIV-Quasipore are the first steps toward generating a more complete vQS profile and gaining novel insights through enhanced vQS investigation.
Materials and Methods
Flip-Flop and Bonito Basecallers
Fast and HAC-pretrained basecallers are underpinned by a flip-flop model—a deep recurrent neural network that incorporates prior and subsequent trace data to call the current signal. ONT makes these models publicly available on their Taiyaki GitHub repository: https://github.com/Nanoporetech/taiyaki/tree/v5.3.0/models. “mGru_flipflop_remapping_model_r9_DNA.checkpoint” and “mLstm_flipflop_model_r941_DNA.checkpoint” were used for fast and HAC R9.4.1 basecalling, respectively. “mLstm_flipflop_model_r103_DNA.checkpoint” was used for R10.3 HAC basecalling. To our knowledge, there is no available pretrained fast basecaller checkpoint for the R10.3 flow cell.
SUP models are a recently developed addition to the Nanopore basecalling suite comprise a deep convolutional-recurrent neural network. This incorporates a prior and subsequent signal when basecalling but also recognizes common signal patterns that correspond to specific nucleotides. These pretrained basecallers are publicly available using ONT’s bonito (v0.4.0) Python package and were acquired using their download script. The “dna_r9.4.1@v3.3” and “dna_r10.3@v3.3” SUP models were used for HIV-1 refinement.
HIV-Quasipore Training Data Generation
ONT’s Taiyaki (v5.3.0) flip-flop model training framework and Bonito’s training framework (Figure 1) were used to generate training data. Trace data were first called using the pretrained basecallers, mapped to the reference genome using Minimap2 (29) (v2.17), and sorted using samtools (30) (v1.11). By default, the guppy_basecaller (v5.0.16) command-trimmed adapters off reads to prepare them for further analysis. To remove any bias from regions with disproportionally high coverage, mapped reads were sampled until a maximum coverage of 4,000 was achieved at each position (Figure 2). All sampled trace data were then isolated using ont-fast5-api’s (v3.3.0) fast5_subset.py script into a new read directory for downstream processing.
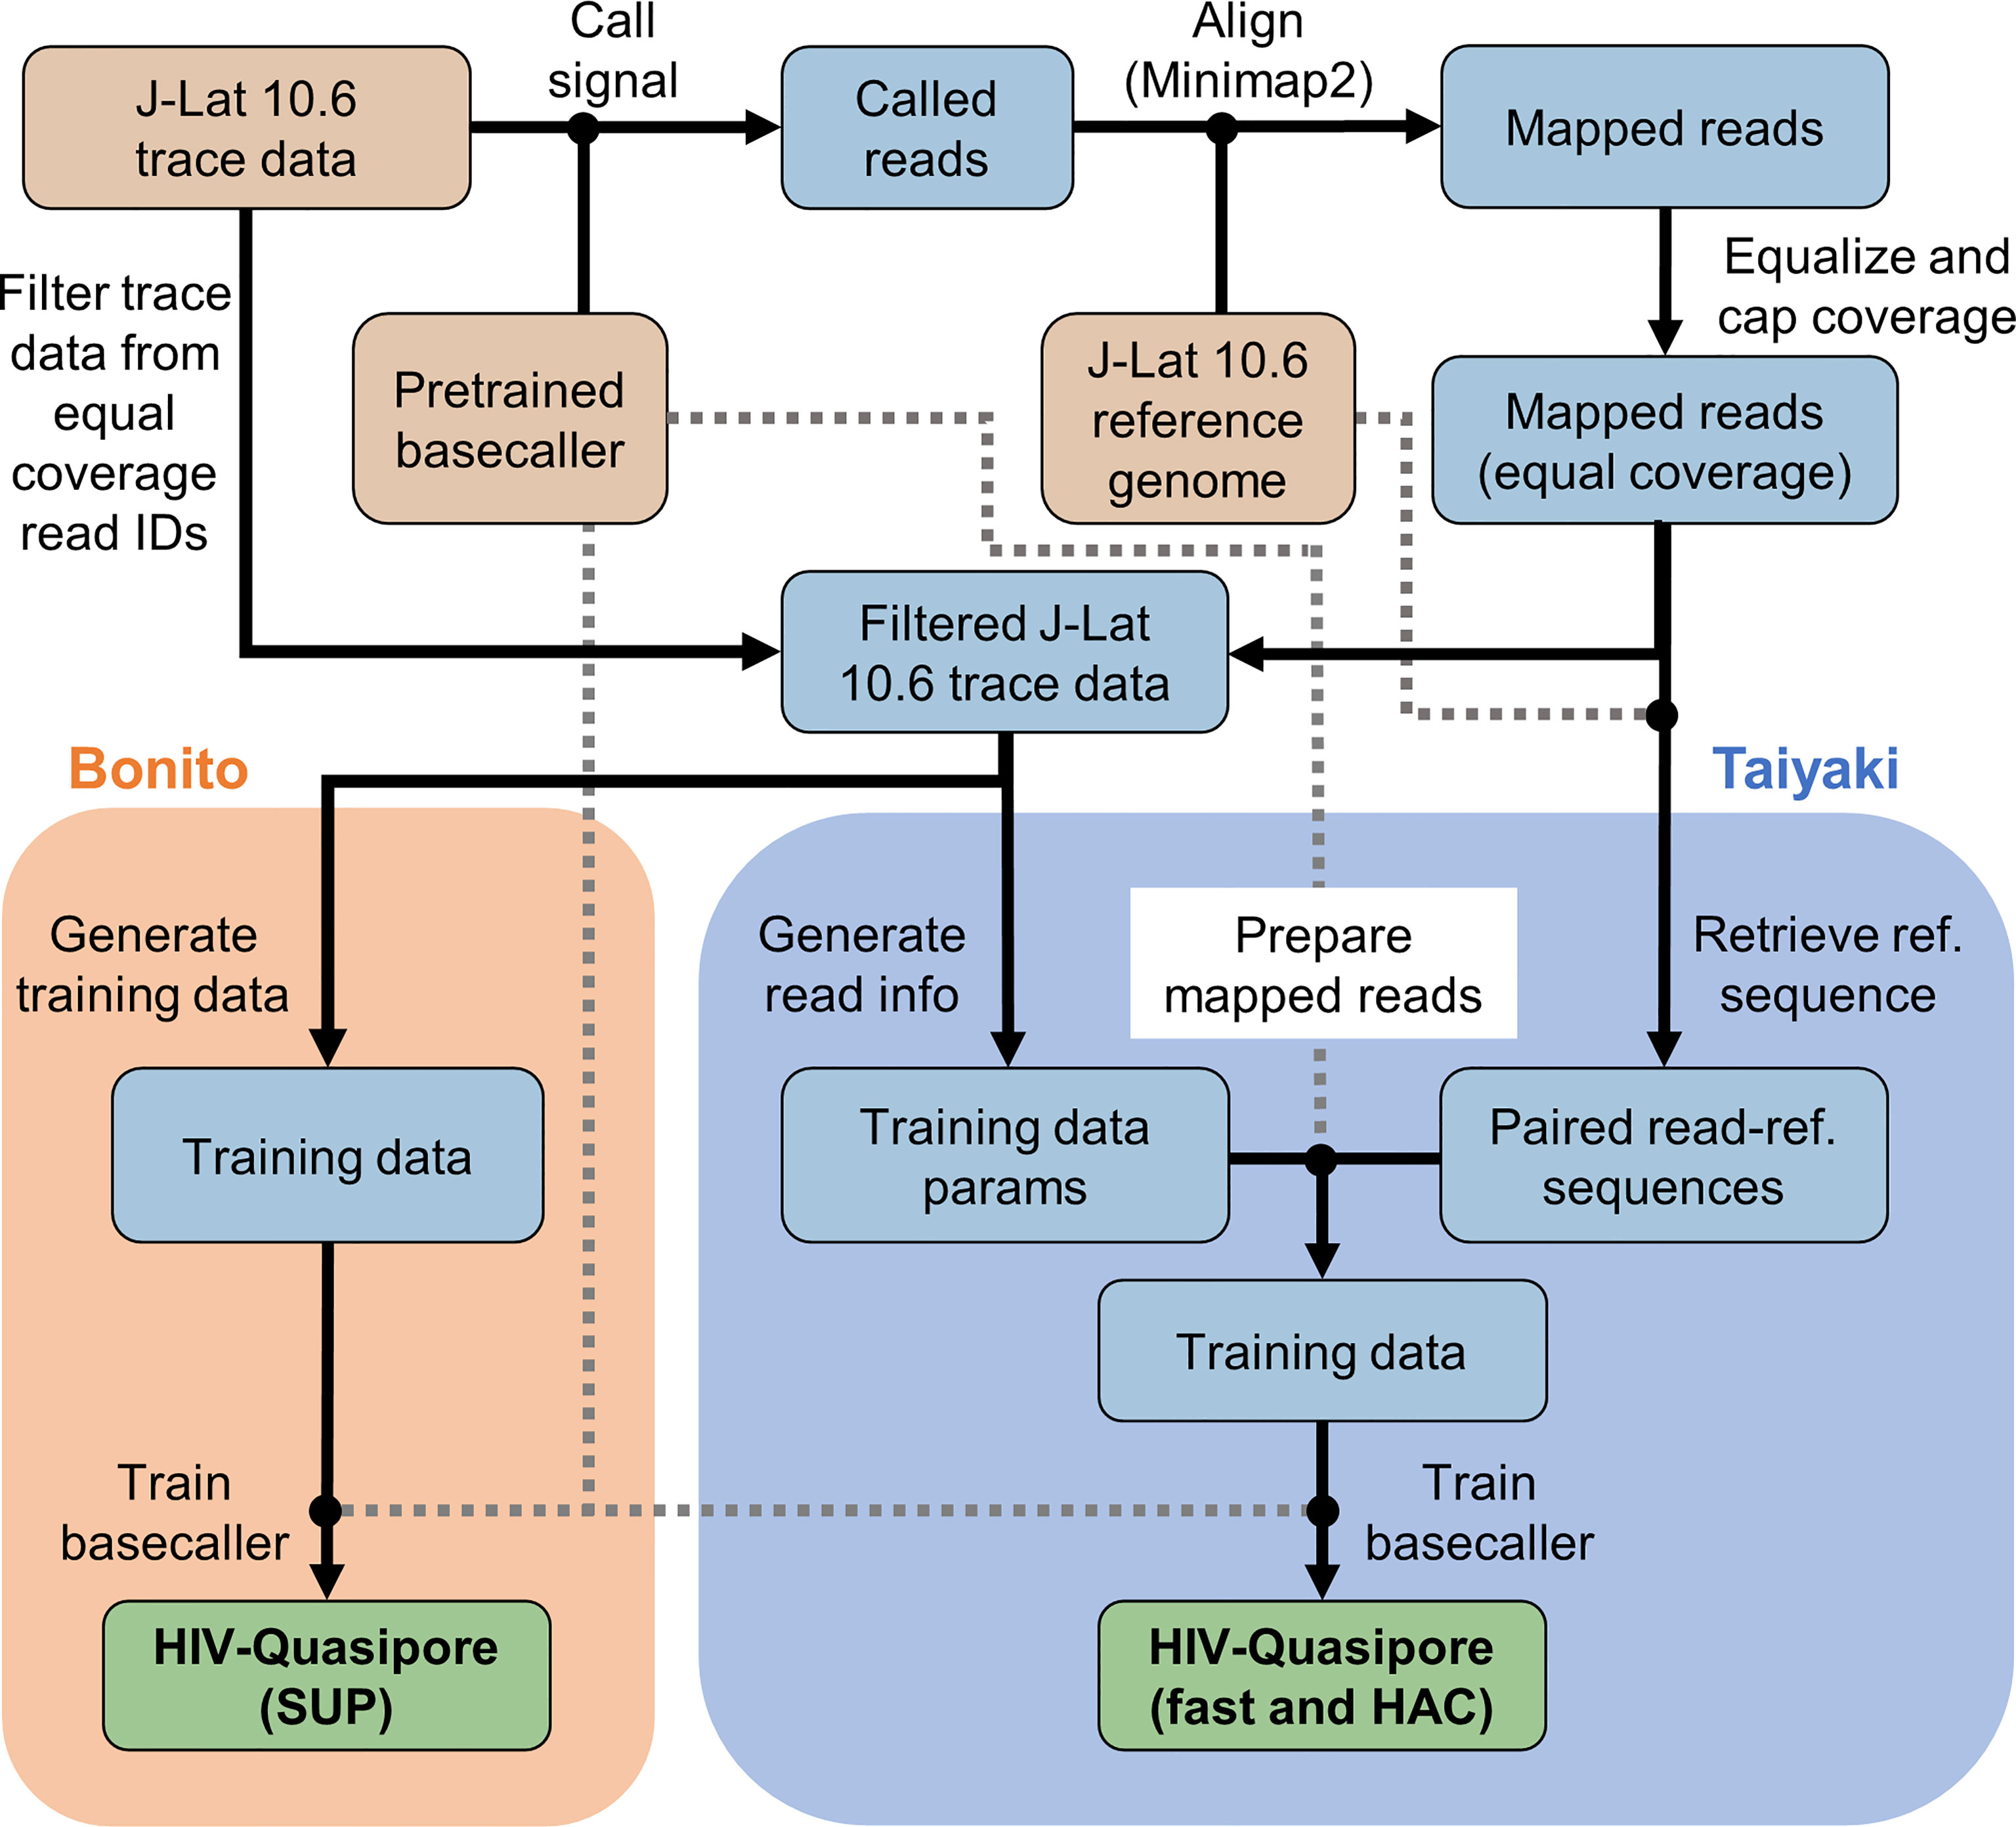
Figure 1 HIV-Quasipore training overview. The HIV-Quasipore training pipeline was designed to refine a pretrained flip-flop or Bonito basecaller using J-Lat 10.6 nanopore trace data and a J-Lat 10.6 reference genome. Brown cells indicate a pipeline input, blue cells indicate a pipeline intermediate, and green cells indicate the final HIV-Quasipore basecallers. Gray-dash lines are intended to ease visualization of the otherwise overlapping black lines. Orange shading represents steps exclusive to Bonito model training. Blue shading represents steps exclusive to flip-flop model training using the Taiyaki framework.

Figure 2 HIV-Quasipore training data comprise long reads and are equally spread across the J-Lat 10.6 genome. (A) Coverage was capped at 4,000 depth and equalized across the J-Lat 10.6 genome. Each point represents a single position within the reference genome. (B) Training data reads are predominantly within the 8,500–9,000 nucleotides range with few short reads equally distributed between 0 and 8,000 nucleotides.
For training fast and HAC basecallers, paired read-reference sequences were then isolated using Taiyaki’s get_ref_from_align.py. These filtered trace data were then parsed for trimming and scaling information and documented using Taiyaki’s generate_per_read_params.py convenience script. The true reference sequences, isolated trace data, trace data documentation, and pretrained flip-flop basecaller were used to generate training data using Taiyaki’s map_read_signal.py convenience script. This was performed using both HIV-Quasipore-fast and HAC for basecaller-specific training data. For SUP models, training data were generated from these filtered reads using Bonito’s basecaller command and specifying the –save-ctc argument. All other arguments were left as default.
Nanopore Sequencing
Primer sets were designed to target the near-full length (NFL) amplicons. Primer set A targeted the HIV-1 5’long terminal repeat (LTR; A forward outer and inner or AFO and AFI) to the env region (A reverse or AR), while primer set B targeted HIV-1 gag (BF) to the 3’LTR (BRO and BRI) to yield two halves near 8.5 kb amplicons. The NFL primers were designed to emphasize a near-8.5 kb hemi-nested approach. All forward and reverse primer sequences can be found in Supplementary Table 1. All primers were manufactured and purchased from Integrated DNA Technologies (IDT).
PCR reactions were performed using the following cycling conditions: initial denaturation at 94°C for 2 min, followed by 30 cycles of denaturation at 94°C for 30 s, annealing at 60.4°C for 30 s, and extension at 68°C for 9 min 30 s, with a final extension at 68°C for 9 min 30 s. All PCR amplifications were performed using Taq DNA polymerase High Fidelity (HF) (Catalog #11304029, Invitrogen). The first round PCR amplifications for Taq DNA polymerase HF were performed in a 50 ul total reaction volume, containing 5 µl (20 ng/µl) of genomic DNA and 45 µl of reaction mixture, composed of 34.5 µl nuclease free water, 5 µl 10× HF PCR buffer (Invitrogen), 1 µl 10 mM dNTPs (Ref: U151B, Lot:0000390963, Promega), 2 µl 50 mM MgSO4 (Invitrogen), 0.2 µl Taq DNA polymerase HF (Invitrogen), 1 µL (10 uM) each forward and reverse primers. For a hemi-nested approach, 5 µl of the first round of PCR product was used as a template, added to 45 µl of reaction mixture, maintaining a total final volume of 50 µl for the second round of PCR. For this reaction, reagents and cycling conditions were maintained as previously stated, with the exception of the primers (refer to the primer design). All PCR products were electrophoresed on a 1% agarose gel at 90 V for 1 h against a 1 kb molecular weight DNA ladder (6,000 µl; G754A, Promega) and imaged using a Fluorochem SP Transilluminator (Alpha Innotech) to confirm the length of the amplified products.
PCR products were purified using the QIAquick PCR purification procedure (Cat. No./ID: 28106) according to the protocol of the manufacturer and quantified using the Qubit 4 fluorometer (Catalog #Q33238). DNA library preparation was conducted using the ONT Native barcoding genomic DNA LSK-109 procedure. This process included an initial end preparation by dA-tailing of PCR fragments to prepare the DNA ends for barcode attachment, followed by uniquely barcoding (1–12 provided in the kit) the DNA ends of each sample. These libraries were pooled together in equimolar concentration and ligated with sequencing adapters to the DNA ends. Pooled libraries were then maintained on ice until ready for priming and loading onto the flow cell. Approximately 50 fmol of this pooled library was run on a fresh R9.4.1 and 100 fmol was loaded onto an R10.3 flowcell as previously described by the manufacturer. These were run for 24 h each using the default settings in the MinKnow software, preserving the raw fast5 trace-files for downstream processing.
PacBio Sequencing
The clinical isolate sample was obtained from the sample repository of the Clinical and Translational Research Support Core (CTRSC) of the Comprehensive Center for NeuroHIV Research (CNHC). The sample was donated by a therapeutically suppressed, non-cognitively impaired middle-aged black man and was obtained with informed consent under IRB protocol 1609004807. The sample was provided as a deidentified sample. The clinical isolate sample was prepared for PacBio sequencing as follows. Genomic DNA (gDNA) from peripheral blood mononuclear cells (PBMCs) was isolated using the AllPrep DNA/RNA Mini procedure (Qiagen), as described by the manufacturer. The DNA concentration for each gDNA sample was determined using the Quant-iT dsDNA Assay, high sensitivity protocol (Invitrogen), as described by the manufacturer.
The clinical isolate amplicon was prepared for PacBio sequencing using a 4 kb fully nested PCR amplification strategy with two rounds of PCR total. Nested PCR primers for the 4 kb assay are listed in Supplementary Table 2. The inner primer pair had additional anchoring nucleotides and a 5’ Amino Modifier C6 to allow the addition of the adapter sequence for barcode-dependent sample multiplexing for the PacBio Sequel sequencing platform, as specified by Pacific Biosciences. All PCR amplifications were performed using the Phusion High Fidelity DNA Polymerase procedure (Thermo Scientific). The first round of nested PCR (outer) was performed in a 25 µl total reaction volume containing 100 ng gDNA and was added to 15 ul of reaction mixture, composed of 6.25 µl nuclease-free water, 5 µl of 5× HF or GC reaction buffer, 1.125 µl of 5mM MgCl2, 0.875 µl of 10 mM dNTPs (Promega), and 0.75 µl of 10 µM round 1 oligonucleotide primers resuspended in nuclease-free water (IDT). Nuclease-free water was added to achieve a 25 µl volume in each reaction. For the second round of the 4 kb-nested approach (inner), 5 µl of the first round PCR product was added directly to 20 µl of reaction mix, composed of 13.75 µl of nuclease-free water, 5 µl of 5× HF or GC reaction buffer, 1.125 µl of 5 mM MgCl2, 0.875 µl of 10 mM dNTPs (Promega), and 0.75 of 10 µM round 2 oligonucleotide primers resuspended in nuclease-free water (IDT). Thermal cycler conditions for the 4 kb-nested PCR approach are summarized in Table 1. PCR products (3 ul of the round 2 reaction) were subjected to electrophoresis on a 1% agarose gel at 110 V for 1.5 h against a 1 kb molecular weight DNA ladder (6 µl; G754A, Promega) and imaged using the Flurochem SP Transilluminator (Alpha Innotech) to confirm the length of the amplified products.
The clinical isolate 4 kb amplicon was prepared for sequencing on the PacBio Sequel platform first by multiplexing the samples using the Barcoded Universal Primers Plate v2 (Pacific Biosciences), followed by magnetic bead purification with the AMPure PB Beads protocol (Pacific Biosciences). The sample concentration was determined using the Quant-iT dsDNA Assay, high sensitivity protocol (Invitrogen) before equimolar pooling of samples. Pooled samples were subjected to electrophoresis on a 1% agarose gel and visualized with SYBR Safe DNA gel stain (Invitrogen). The 4 kb band was excised and purified from the gel using the QIAquick Gel Extraction protocol (Qiagen), and was quantified using the Quant-iT dsDNA Assay, high sensitivity protocol (Invitrogen). The gel-extracted pools were processed for library preparation according to the PacBio SMRTbell Library Preparation and Sequencing protocol. Clinical isolate SMRTbell libraries were prepared using either the SMRTbell Express Template Prep procedure 1.0-SPv3 protocol (Pacific Biosciences #100-991-900) or the SMRTbell Express Template Prep procedure 2.0 protocol (Pacific Biosciences #100-938-900).
Cell Line and Clinical Isolate Reference Genome Construction
Training HIV-Quasipore requires both HIV-1 Nanopore trace data and ground truth to compare called reads against. For the J-Lat 10.6 cell line, this ground truth is a high-quality Sanger sequenced J-Lat 10.6 HIV-1 genome, sequenced as previously described (31). The average coverage and Phred quality score are 2.02 and 55.27, respectively, establishing themselves as the gold-standard reference genome for Nanopore read comparison (Figure 3).
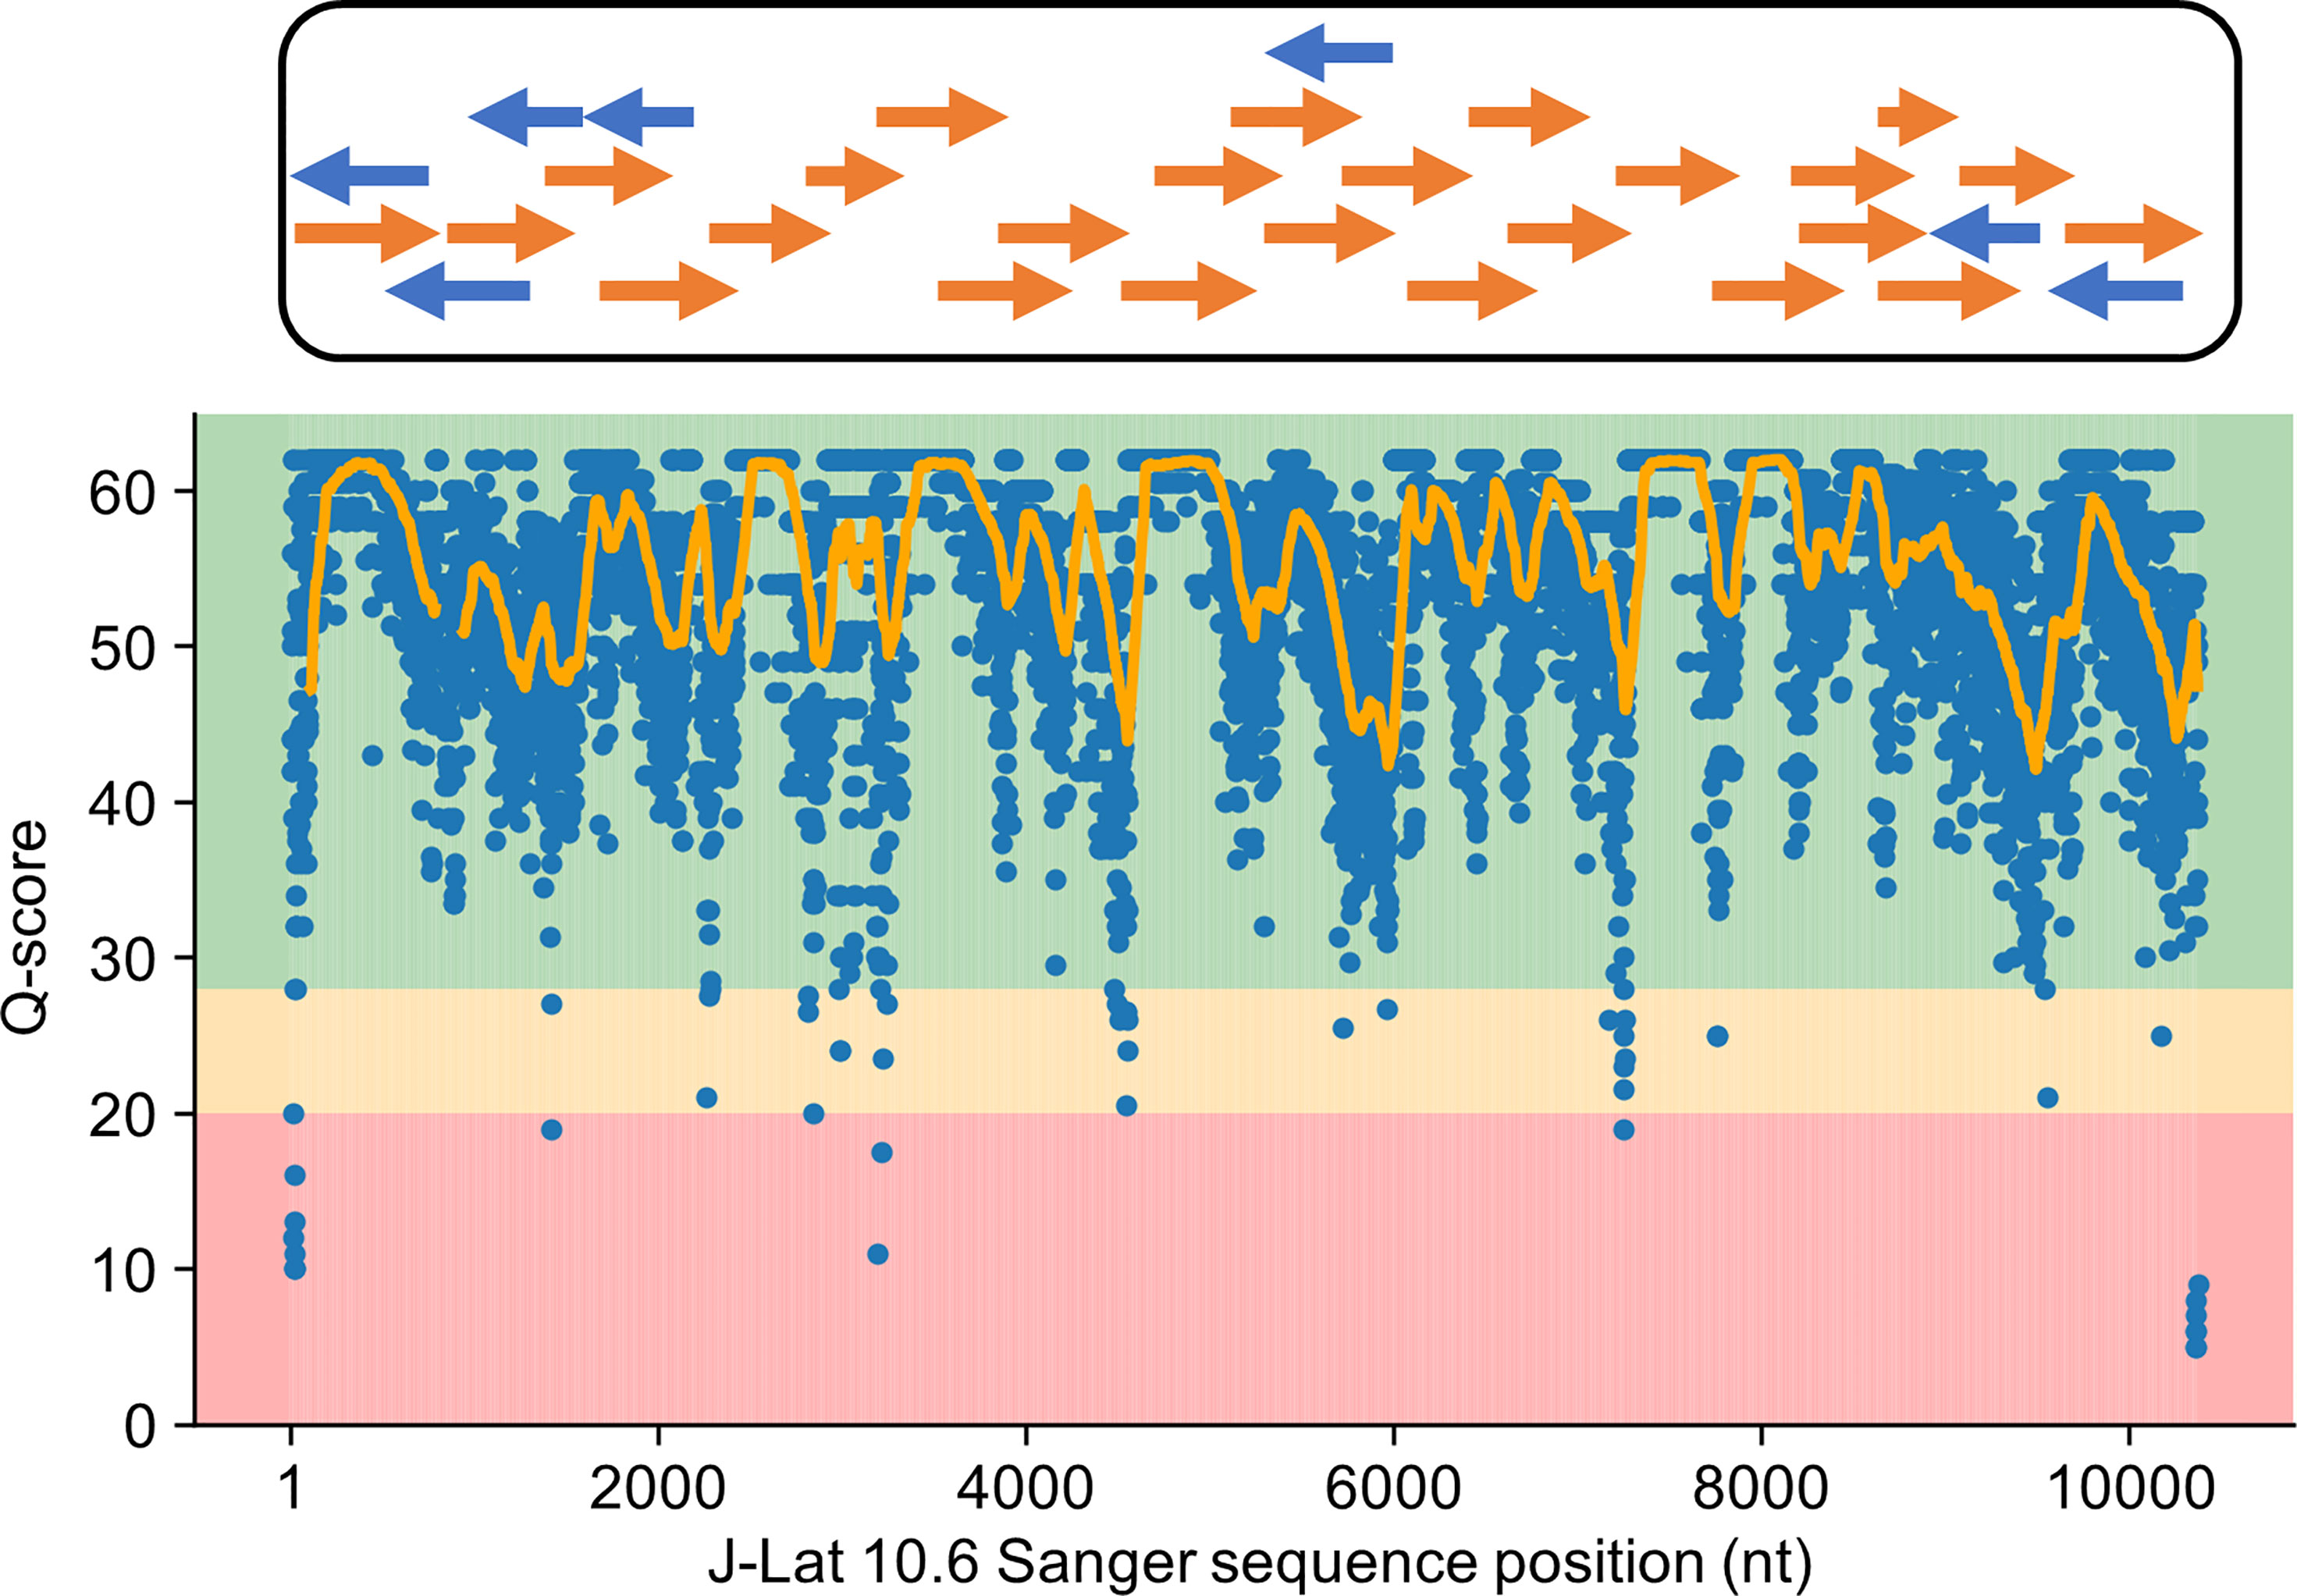
Figure 3 Sanger sequenced J-Lat 10.6 genome served as a high-quality reference genome. Orange and blue arrows represent the forward and reverse stranded Sanger sequences used to construct the reference J-Lat 10.6 genome. The Phred quality scores for overlapping contigs at each position were averaged together into a single positional quality score and plotted along with a line corresponding to a 100-bp rolling average. Positional Phred scores largely reside in the 40–60 range, corresponding to accuracies between 99.99 and 99.9999%. Given this, the J-Lat 10.6 genome can serve as a high-quality-reference to evaluate the performance of and train HIV-Quasipore basecallers.
The J-Lat 9.2 genome was constructed using publicly available Illumina sequencing data (BioSample: SAMN11026402) (32). These reads were mapped to the J-Lat 10.6 genome using bwa-mem2 (33) (v2.2.1) and a majority base rule was used to generate the J-Lat 9.2 reference genome. The consensus was formed using quasitool’s (34) (v0.7.0) consensus command with a -p 100 setting. J-Lat 9.2 gene coordinates were mapped from the J-Lat 10.6 GenBank file using Liftoff (35) (v1.6.1). This GenBank file was manually converted into a Liftoff-compatible GFF file.
The clinical isolate-derived PacBio sequences were demultiplexed using Lima (v2.0.0)—the PacBio barcode demultiplexer—to include sequences containing both forward and reverse barcoding and amplifying primers, then matched to respective barcoded universal primers. These reads were used to polish the HXB2 (K03455.1) reference genome using Flye (36) (v2.9) to output the clinical isolate-specific reference genome. The –meta and –pacbio-raw arguments were used for polishing. Due to the previously described primer design, only the 3’ half of the HIV-1 genome could be polished to become an isolate-specific reference sequence. The clinical-isolate genome was 4,022 bps long. Gene coordinates were mapped from the HXB2 GenBank file using Liftoff, as described above.
HIV-Quasipore Training
For the fast and HAC basecallers, reads were randomly fragmented into chunks between 3,000–8,000 and 2,000–4,000 bps for the HAC and fast basecallers, respectively. An Adam optimizer (37) was used with a weight decay of 0.01 and was trained for 12,000 batches. The learning rate was adjusted during training using a cosine-decay scheduler and ranged between 0.0001 and 0.004. It reached its peak of 3,000 batches and decreased during training. A seed value of 255 was assigned for reproducible training. Training was performed using a Taiyaki convenience script—train_flipflop.py. During training, the model was evaluated using a held-out validation dataset for every 50 batches. After training, basecallers were converted into a guppy-compatible json file for future use using Taiyaki’s dump_json.py script.
SUP basecallers were trained using Bonito’s training script using the generated training data for 10 epochs and assigning each pretrained model to the –pretrained option. All other arguments were left as default. After training, basecallers were converted into a guppy-compatible json file for future use using Bonito’s export script.
HIV-Quasipore Evaluation Against Temporal Splits
To confirm that HIV-Quasipore is applicable outside of this analysis, it needs to be evaluated on unseen trace data. To establish this, HIV-Quasipore basecallers were trained using reads either from the beginning or end of the sequencing run and evaluated using the unseen counterpart. After initial basecalling, the generated sequencing summary table was parsed and sorted based on sequencing start time. Reads were then split into the beginning and ending halves of the sequencing run. For unbiased training data generation coverage was capped at 2,000 depth and equally distributed across the reference genome. Afterwards, training data generation and flip-flop training proceeded as previously described for 1,000 batches, using 200 batches to achieve a peak learning rate. The Bonito basecallers were trained as previously described for 3 epochs.
Both the beginning and end reads were then called using the HIV-Quasipore basecallers, regardless of training data. Reads were then aligned to the J-Lat 10.6 genome and parsed using pysam (v0.16.0.1). The mean read alignment accuracy distribution was then plotted for both the beginning and end data for comparison. The degree of overlap between the beginning and end mean alignment accuracy distributions was quantified using Cohen’s d.
Genomic Alignment Accuracy Evaluation
To ensure that the quality was consistent across the genome, the average read alignment accuracy overlapping each position was evaluated. Pretrained and HIV-Quasipore models called for all available HIV-1 trace data. Reads were then aligned to the J-Lat 10.6 genome and assigned an MD tag using samtools’ calmd function. These data were parsed using pysam and each mapped read was imported as an AlignedSegment object. For each AlignedSegment, read coordinates were mapped to reference coordinates using the get_reference_positions function. From there, the MD tag was examined for nucleotide casing. If a nucleotide was upper case, it indicated a read-reference match and a 1 was assigned to its corresponding reference coordinate. If it was lowercase, it indicated a read-reference mismatch and its corresponding reference coordinate was assigned a 0. The average of these values across each coordinate was calculated to acquire the average alignment accuracy across each reference nucleotide.
To further evaluate the robustness of HIV-Quasipore against unseen trace data, the above analysis was also replicated using the J-Lat 9.2 and clinical isolate Nanopore trace data and reference genomes. Reads were filtered to be between 7,000 and 8,000 bps, and read coverage was capped at 2,000 when applicable.
HIV-Quasipore Error Evaluation
Investigating basecalling biases is essential for an investigator to better contextualize the types of errors produced by HIV-Quasipore. Error calculations were performed by parsing mapped reads using pysam and using each AlignSegment’s get_cigar_stats function if it mapped to the reference. Insertion and deletion counts were automatically determined by the function. Mismatch counts were calculated by subtracting the number of insertions and deletions from the total error count. Total error proportions were calculated by dividing the number of mismatches by the number of matches, insertions, and deletions.
Novel vQS Detection Resolution Calculation
To decisively determine whether a vQS exists, its frequency must exceed the expected number of errors within coverage. The resolution of detection is the minimum number of vQS occurrences needed to accurately determine its existence. To measure the improvement in resolution, HIV-Quasipore and pretrained basecaller median error rates were used to calculate the expected number of errors found in 1,000× coverage. The expected number of errors found in 1,000× coverage was also calculated using Pacific Biosciences (PacBio) sequencing—which has an error rate as low as 0.0172 using the circular consensus sequence (38)—as a comparator between sequencing platforms. The likelihood that a vQS exists given a resolution of coverage can then be modeled using a Poisson cumulative distribution function where λ equals the expected number of errors. This probability was then converted into a Q-score. The resolution was incrementally increased until the quality score reached 10. vQS resolution calculations were performed using quasitool’s (34) (v0.7.0) calculate_variant_qual function.
Read Length Versus Accuracy
Nanopore sequencing generates long reads that span different vQS, but these need to be accurate and high quality to establish a vQS profile of a patient. To acquire the association between read length and alignment accuracy, the HIV-Quasipore and pretrained basecaller alignment files were parsed using pysam and each read’s query length and nucleotide percentage identity were isolated from each read’s CIGAR string.
HIV-Quasipore Time Comparison
To compare basecalling speeds between HIV-Quasipore basecallers, trace data were sampled and split into 1, 3, 5, 7, and 10 GB bins. Basecallers were evaluated on identical data using a Quadro RTX 6000 GPU. For each experiment, four basecallers were used, with eight runners/device, 250 chunks/runner, and a chunk size of 2,000. All other arguments were left as default. Four replicates were performed with each basecaller and the data size bins. Each experiment was timed using Ubuntu 18.04.5’s time command. GPU applications are inherently parallelized, so the “real” time metric is not an accurate measure of call time. Therefore, the largest time metric was recorded as the completion time of each basecaller. Experiments with evaluation times that were either greater than the third quartile of the dataset plus 1.5× the interquartile range (IQR) or less than the first quartile of the dataset minus 1.5× the IQR were considered outliers and removed from subsequent analysis.
Results
HIV-Quasipore Reduced Error Rates and Improved Resolution Required to Detect vQS
Overall, HIV-Quasipore error rates were significantly reduced from their pretrained counterparts (Figure 4A) (Mann–Whitney one-sided U test; p = 0.0 for all models). The median error rates were reduced from 0.0365 to 0.0008 (R9.4.1 SUP), 0.0442 to 0.0011 (R10.3 SUP), 0.0579 to 0.0018 (R9.4.1 HAC), 0.068 to 0.0007 (R10.3 HAC), and 0.2045 to 0.0189 (R9.4.1 fast). HIV-1-specific training also reduced the error rate for STDs across all HIV-Quasipore basecallers. This was reduced from 0.0313 to 0.0286 (R9.4.1 SUP), 0.0280 to 0.0217 (R10.3 SUP), 0.0306 to 0.0247 (R9.4.1 HAC), 0.0282 to 0.0180 (R10.3 HAC), and 0.0754 to 0.0298 (R9.4.1 fast). Training-validation loss curves for HIV-Quasipore basecallers can be found in Figure 5.
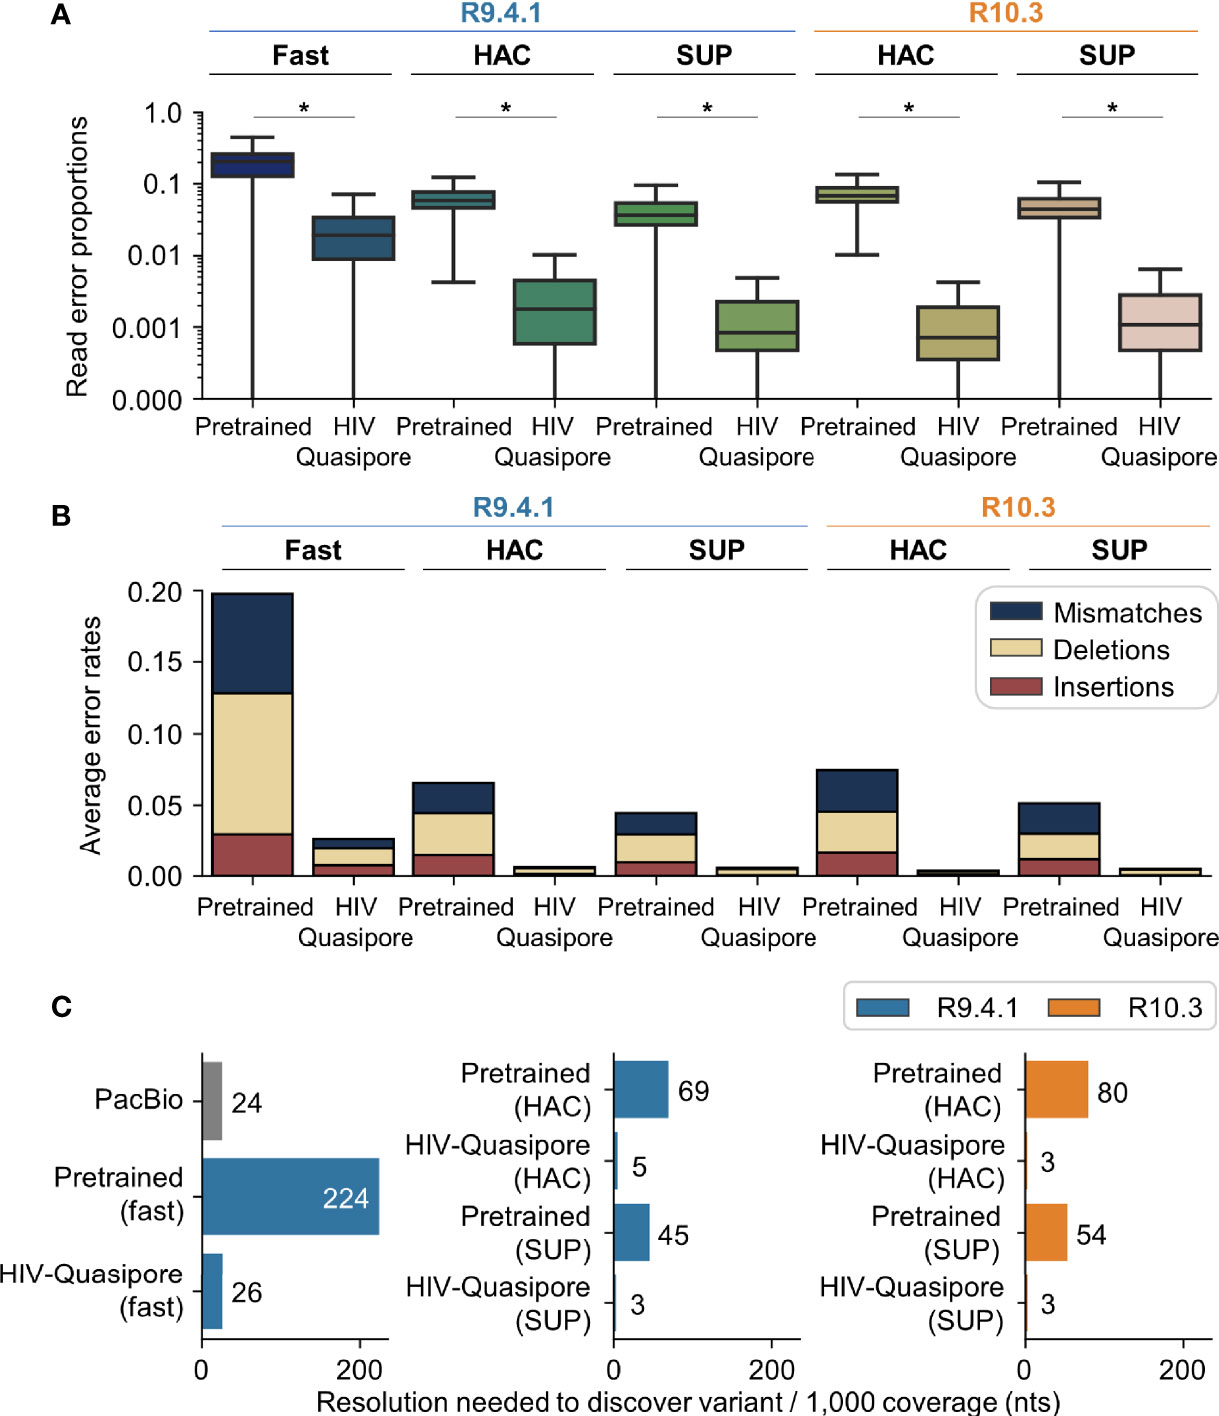
Figure 4 HIV-Quasipore basecallers displayed lower error rates than pretrained basecallers and thus required less coverage to discover vQS. (A) Using HIV-Quasipore models significantly reduced basecalling errors (*p <0.05). (B) HIV-Quasipore basecaller mean error rates are lower than their pretrained counterparts. All error types were reduced, but read mismatches saw the largest drop in frequency in all models. (C) HIV-Quasipore lowered the minimum coverage needed to accurately call patient vQS per 1,000 coverage, as specified by the numbers after the bars (variant Q-score = 10).
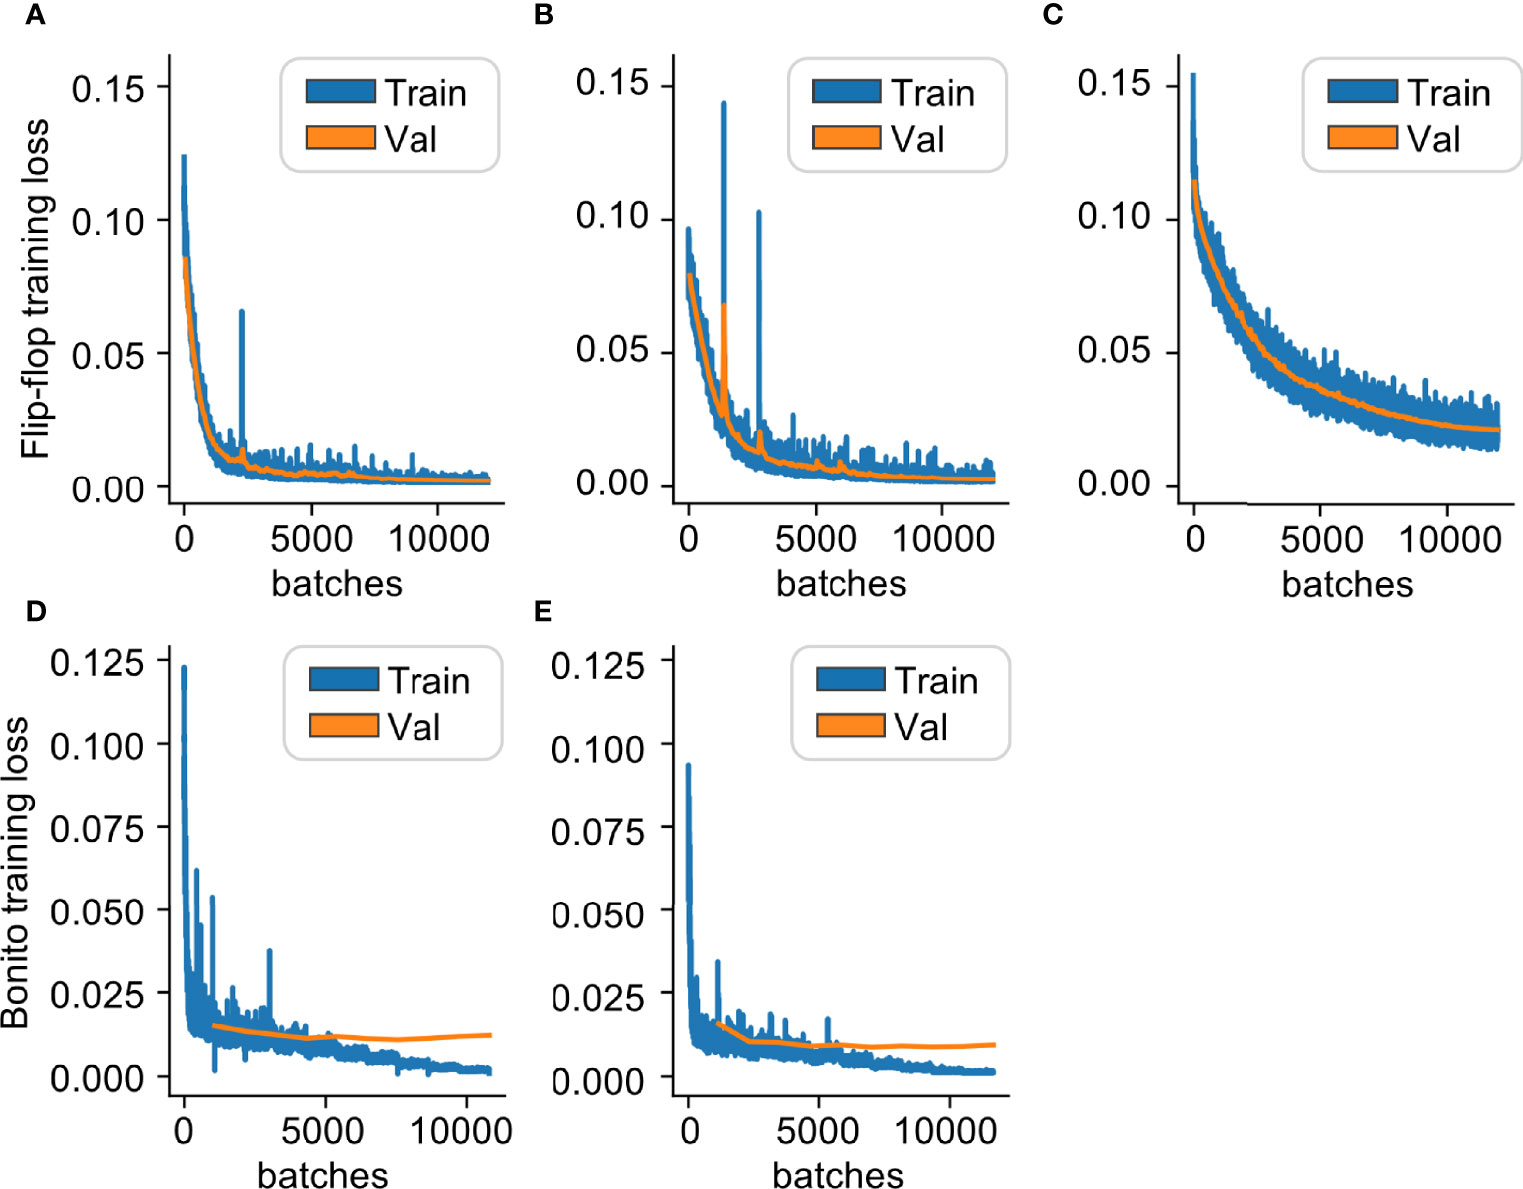
Figure 5 Training HIV-Quasipore basecallers minimized the differences between called reads and the J-Lat 10.6 reference genome. Training and validation loss curves for: (A) R10.3 HAC, (B) R9.4.1 HAC, (C) R9.4.1 fast, (D) R10.3 SUP, and (E) R9.4.1 SUP. All curves consistently and stably decrease as batches increase, indicating that both models were successfully trained and have improved HIV-1-specific basecalling ability.
R9.4.1 HIV-Quasipore-fast, HAC, and SUP reduced average error rates from 0.197 to 0.026, 0.066 to 0.006, and 0.045 to 0.005, respectively (Figure 4B). R10.3 HIV-Quasipore-HAC reduced average error rates from 0.075 to 0.006 and SUP reduced average error rates from 0.052 to 0.005. This reduction was predominantly from fewer mismatch counts, which were reduced from 0.069 to 0.006, 0.021 to 0.001, and 0.015 to 0.0006 for R9.4.1 HIV-Quasipore-fast, HAC, and SUP, respectively. These were reduced from 0.029 to 0.0004 for R10.3 HIV-Quasipore-HAC and 0.021 to 0.0004 for R10.3 HIV-Quasipore-SUP.
All HIV-Quasipore basecallers improved the resolution needed to accurately determine vQS (Figure 4C). For R9.4.1 basecallers, the required depth per 1,000 reads to accurately call a vQS was reduced from 224 to 26 reads for HIV-Quasipore-fast, 69 to 5 reads for HIV-Quasipore-HAC, and 45 to 3 reads for HIV-Quasipore-SUP. This corresponds to a minimum resolution of 2.6, 0.5, and 0.3% of the total reads to accurately call a vQS for HIV-Quasipore-fast, HAC, and SUP, respectively. For R10.3 basecallers, the depth to accurately call a vQS was reduced from 80 to 3 (0.3% minimum resolution) for HIV-Quasipore-HAC and from 54 to 3 (0.3% minimum resolution) for HIV-Quasipore SUP. As a comparison, calculations using PacBio error rates result in a minimum resolution of 2.4% of the total reads (24 out of 1,000 reads) to accurately call vQS.
HIV-Quasipore Improved Read Alignment Accuracy Across the J-Lat 10.6 Genome
As expected, HIV-Quasipore consistently improved read alignment accuracy across the J-Lat 10.6 genome (Figure 6). Pretrained basecallers displayed consistently low read alignment accuracies across the genome, with median read alignment accuracies of 0.986, 0.980, and 0.927 for SUP, HAC, and fast R9.4.1 basecallers, respectively. Similar results were observed for R10.3 SUP and HAC basecallers, with a median read alignment accuracy of 0.980 and 0.972, respectively. Training has improved the median read alignment accuracy to 0.9998 for R9.4.1 HIV-Quasipore-SUP, 0.9998 for R10.3 HIV-Quasipore-SUP, 0.9993 for R9.4.1 HIV-Quasipore-HAC, 0.9998 for R10.3 HIV-Quasipore-HAC, and 0.995 for R9.4.1 HIV-Quasipore-fast.
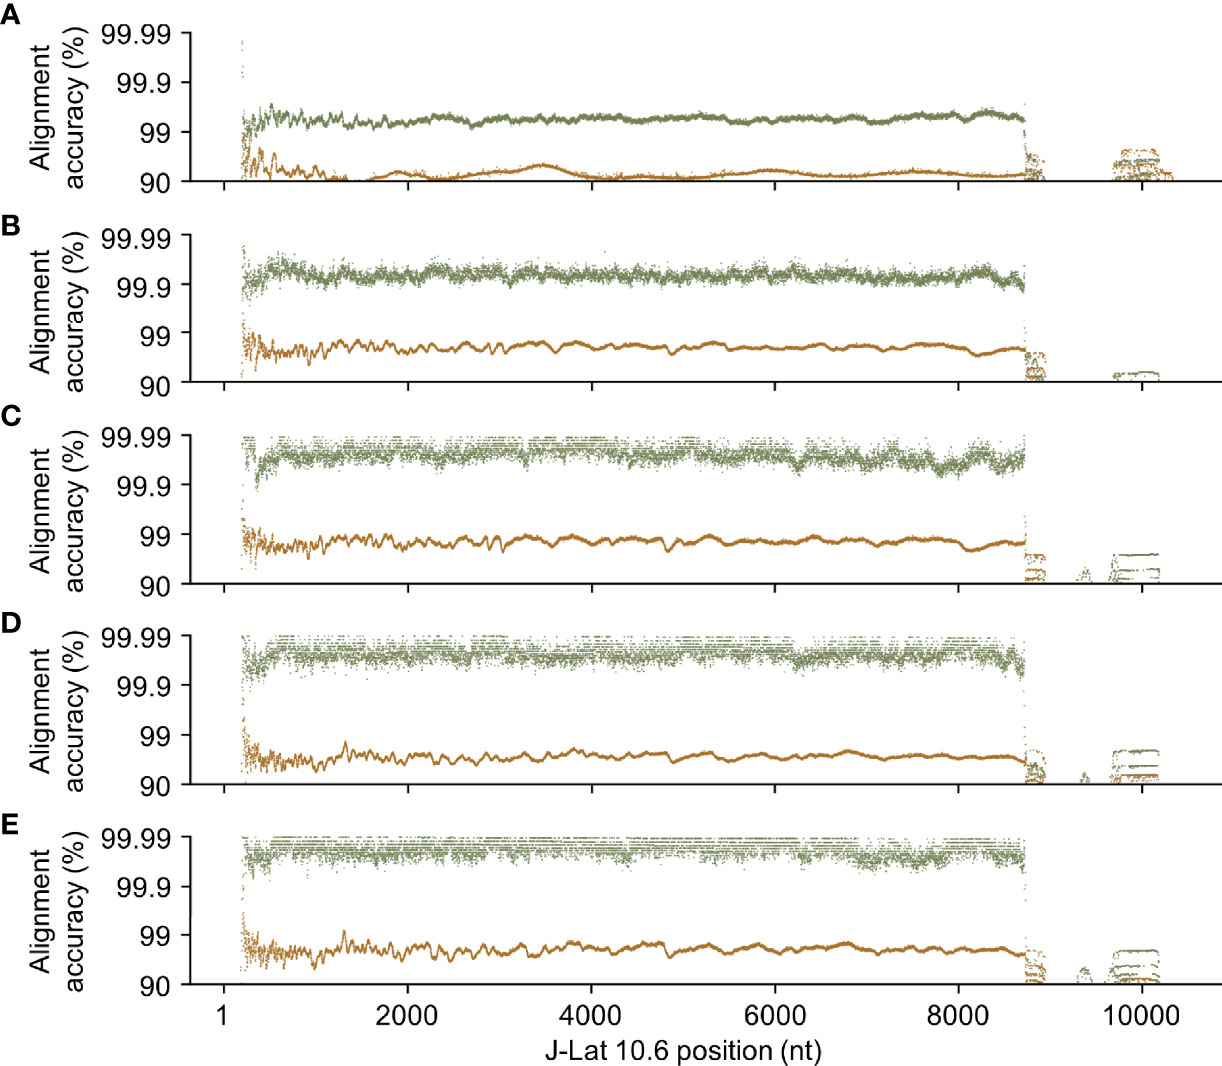
Figure 6 HIV-Quasipore basecallers improved read quality across the entire HIV-1 genome. Each point represents the average alignment accuracy from reads overlapping a position within the J-Lat 10.6 reference genome for (A) R9.4.1 fast, (B) R9.4.1 HAC, (C) R9.4.1 SUP, (D) R10.3 HAC, and (E) R10.3 SUP basecallers. Green points represent HIV-Quasipore basecallers while brown points represent their pretrained counterparts.
HIV-Quasipore read accuracy of STDs predominantly decreased after HIV-1 refinement. The only basecaller to notably increase STD is R9.4.1 HIV-Quasipore-fast, which increased from 0.061 to 0.066. The only basecaller to maintain read alignment accuracy for STD is R10.3 HIV-Quasipore-SUP, which remained stable from 0.040 to 0.041. The R9.4.1 HIV-Quasipore-HAC and SUP decreased from 0.065 to 0.039 and from 0.049 to 0.024, respectively. The R10.3 HIV-Quasipore-HAC read alignment accuracy STD decreased from 0.045 to 0.030.
HIV-1 Alignment Accuracy Was Maintained Across Long Reads
Training successfully improved accuracy across different read lengths (Figure 7). Improved quality was also maintained across longer reads, where reads greater than 8,000 nucleotides display a median alignment accuracy of 0.9819, 0.9982, and 0.9991, for R9.4.1 HIV-Quasipore-fast, HAC, and SUP, and 0.9993 and 0.9988 for R10.3 HIV-Quasipore-HAC and SUP, respectively. Reads of 99.5, 99.6, and 99.3% showed improved alignment accuracy using HIV-Quasipore-fast, HAC, and SUP, respectively, for R9.4.1 flow cells, while 99.8 and 99.6% of reads displayed improved accuracy for HIV-Quasipore HAC and SUP for R10.3 flow cells. Most of the reads that exhibit decreased accuracy are short reads of less than 1,000 nucleotides. Investigating reads with greater than 90% alignment accuracy showed that training nearly always improves them to >99% accuracy. The number of reads that exceeded 99% alignment accuracy increased as read length increased.
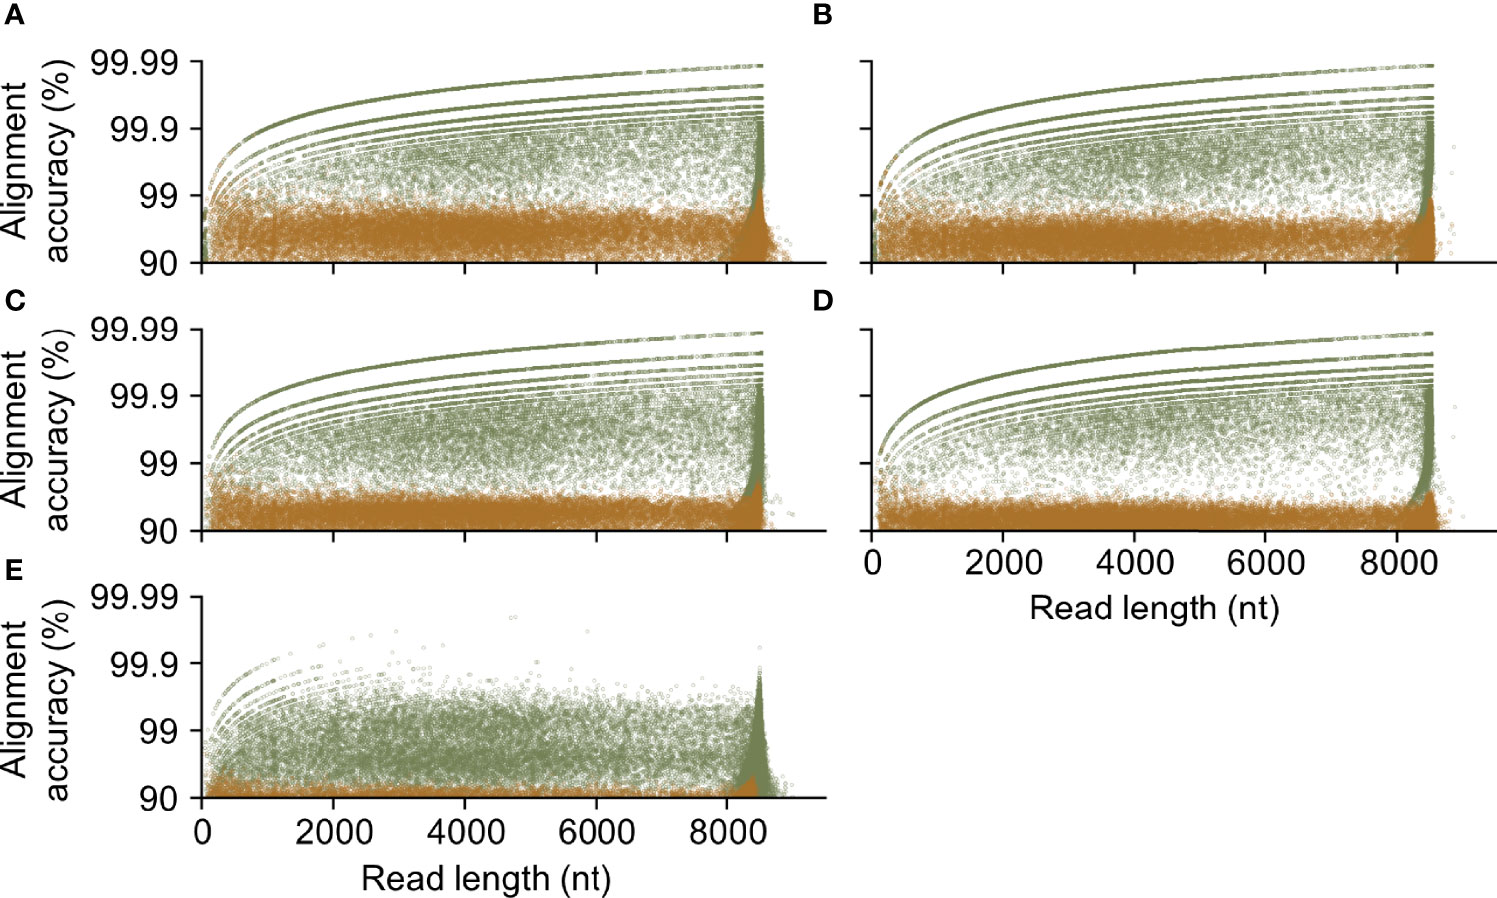
Figure 7 HIV-Quasipore yielded highly accurate long reads. The relationship between length and alignment accuracy of a read was plotted for (A) R9.4.1 SUP, (B) R10.3 SUP, (C) R9.4.1 HAC, (D) R10.3 HAC, and (E) R9.4.1 fast pretrained and HIV-Quasipore basecallers. Each point corresponds to a single read with an alignment accuracy ≥90%. Brown and green points correspond to the pretrained and HIV-Quasipore basecallers, respectively.
HIV-Quasipore Basecallers Were Robust Against Unseen Temporal Data
The HIV-Quasipore basecallers were robust to the unseen half of the trace data (Figure 8). Cohen’s d for unseen and seen HIV-Quasipore-SUP basecallers were 0.077 and 0.07 for beginning and end-trained R9.4.1 models, respectively, and 0.025 and 0.038 for beginning and end-trained R10.3 models, respectively. Cohen’s d for unseen and seen HIV-Quasipore-HAC basecallers were 0.145 and 0.044 for beginning and end-trained R9.4.1 models, respectively, and 0.044 and 0.049 for beginning and end-trained R10.3 models, respectively. Cohen’s d for unseen and seen HIV-Quasipore-fast basecallers were 0.144 and 0.118 for beginning and end-trained models, respectively. With the exception of the HIV-Quasipore-fast basecallers and R9.4.1 HIV-Quasipore-HAC, all effect sizes were ≤0.077, indicating substantial overlap between read accuracy distributions regardless of training data used. Even with the maximum effect size of 0.145, this still falls below what Cohen considered a “small” effect size (39). This establishes HIV-Quasipore’s robustness against unseen data.
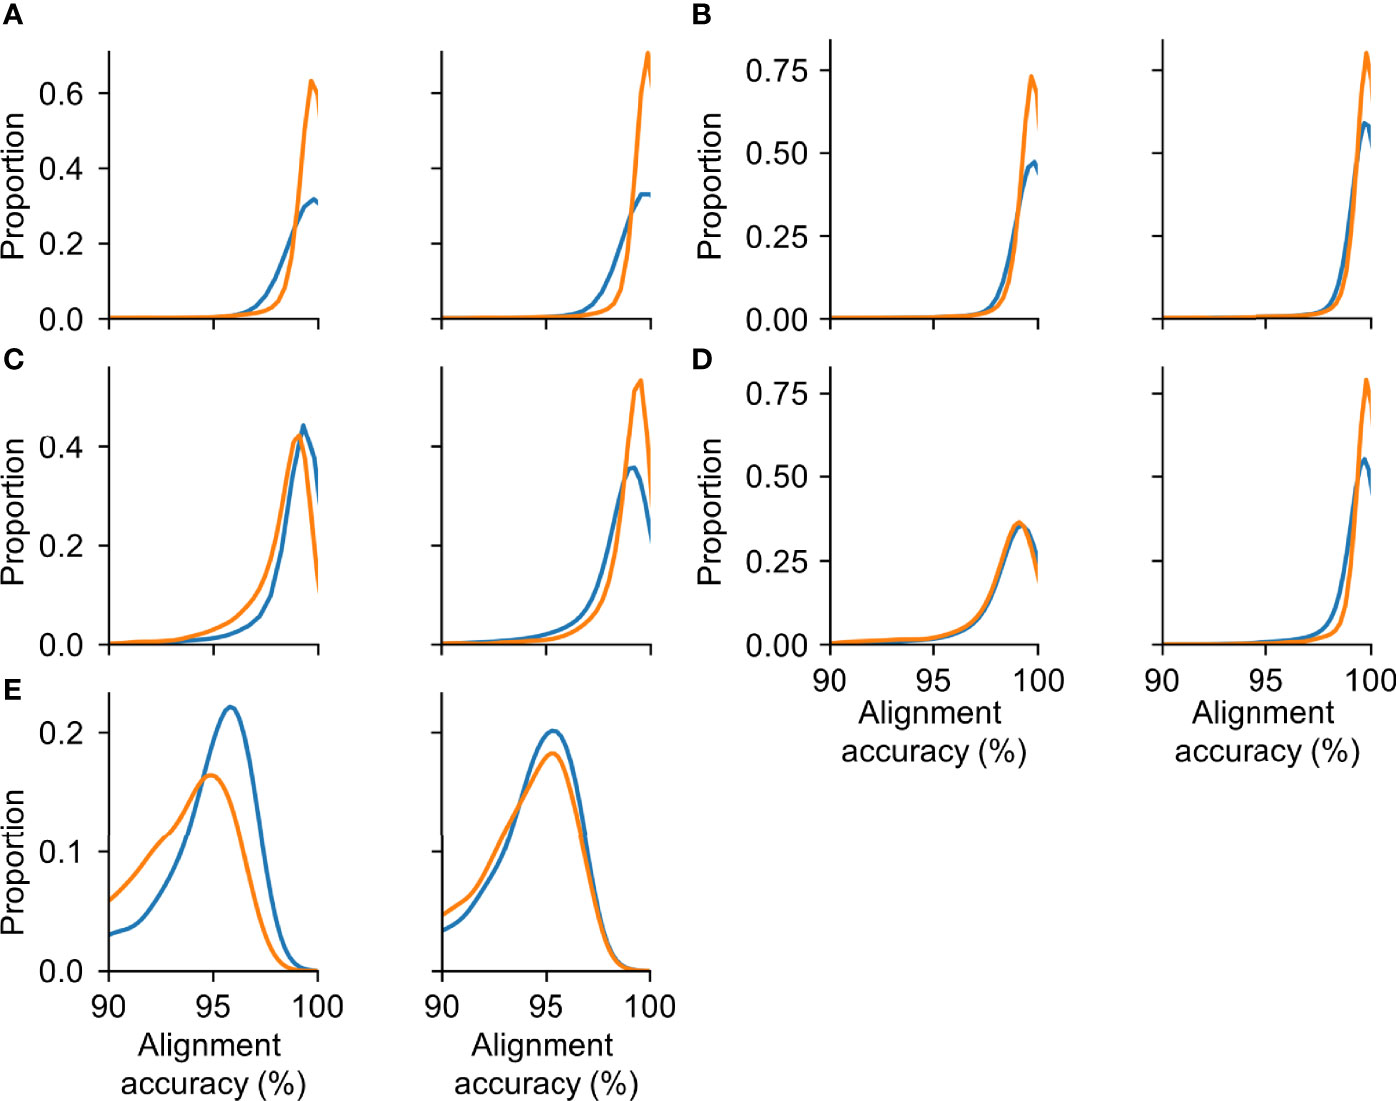
Figure 8 HIV-Quasipore achieved a similar mean read accuracy for evaluation and training data. The distribution of observed read alignment accuracies using different training and evaluation datasets for (A) R9.4.1 SUP, (B) R10.3 SUP, (C) R9.4.1 HAC, (D) R10.3 HAC, and (E) R9.4.1 fast. The left panels correspond to models that were trained using the first half of the trace data generated during sequencing and evaluated using trace data from the second half of the sequencing. The right panels correspond to the opposite training-evaluation scheme. Blue and orange lines represent the read accuracy distribution of data observed during the first and final halves of sequencing, respectively. While the distribution is constructed using all mapped reads, only reads with an alignment accuracy of ≥90% are displayed.
Flow Cell Choice Negligibly Influenced HIV-Quasipore Error Rates
Although flow cell choice significantly influenced HIV-Quasipore error rates (Figure 9) (Mann–Whitney two-sided U test; HAC p = 0.0, SUP = 0.0), changes in read error proportions were negligible for both SUP and HAC models. Error proportions substantially overlapped for both HAC—0.006 ± 0.025 (R9.4.1) (mean ± STD); 0.004 ± 0.018 (R10.3)—and SUP—0.005 ± 0.029 (R9.4.1); 0.005 ± 0.022 (R10.3) basecallers. Error proportion medians were 0.001 for R9.4.1 HIV-Quasipore-SUP, R10.3 HAC, and R10.3 SUP, while they were 0.002 for R9.4.1 HIV-Quasipore-HAC.
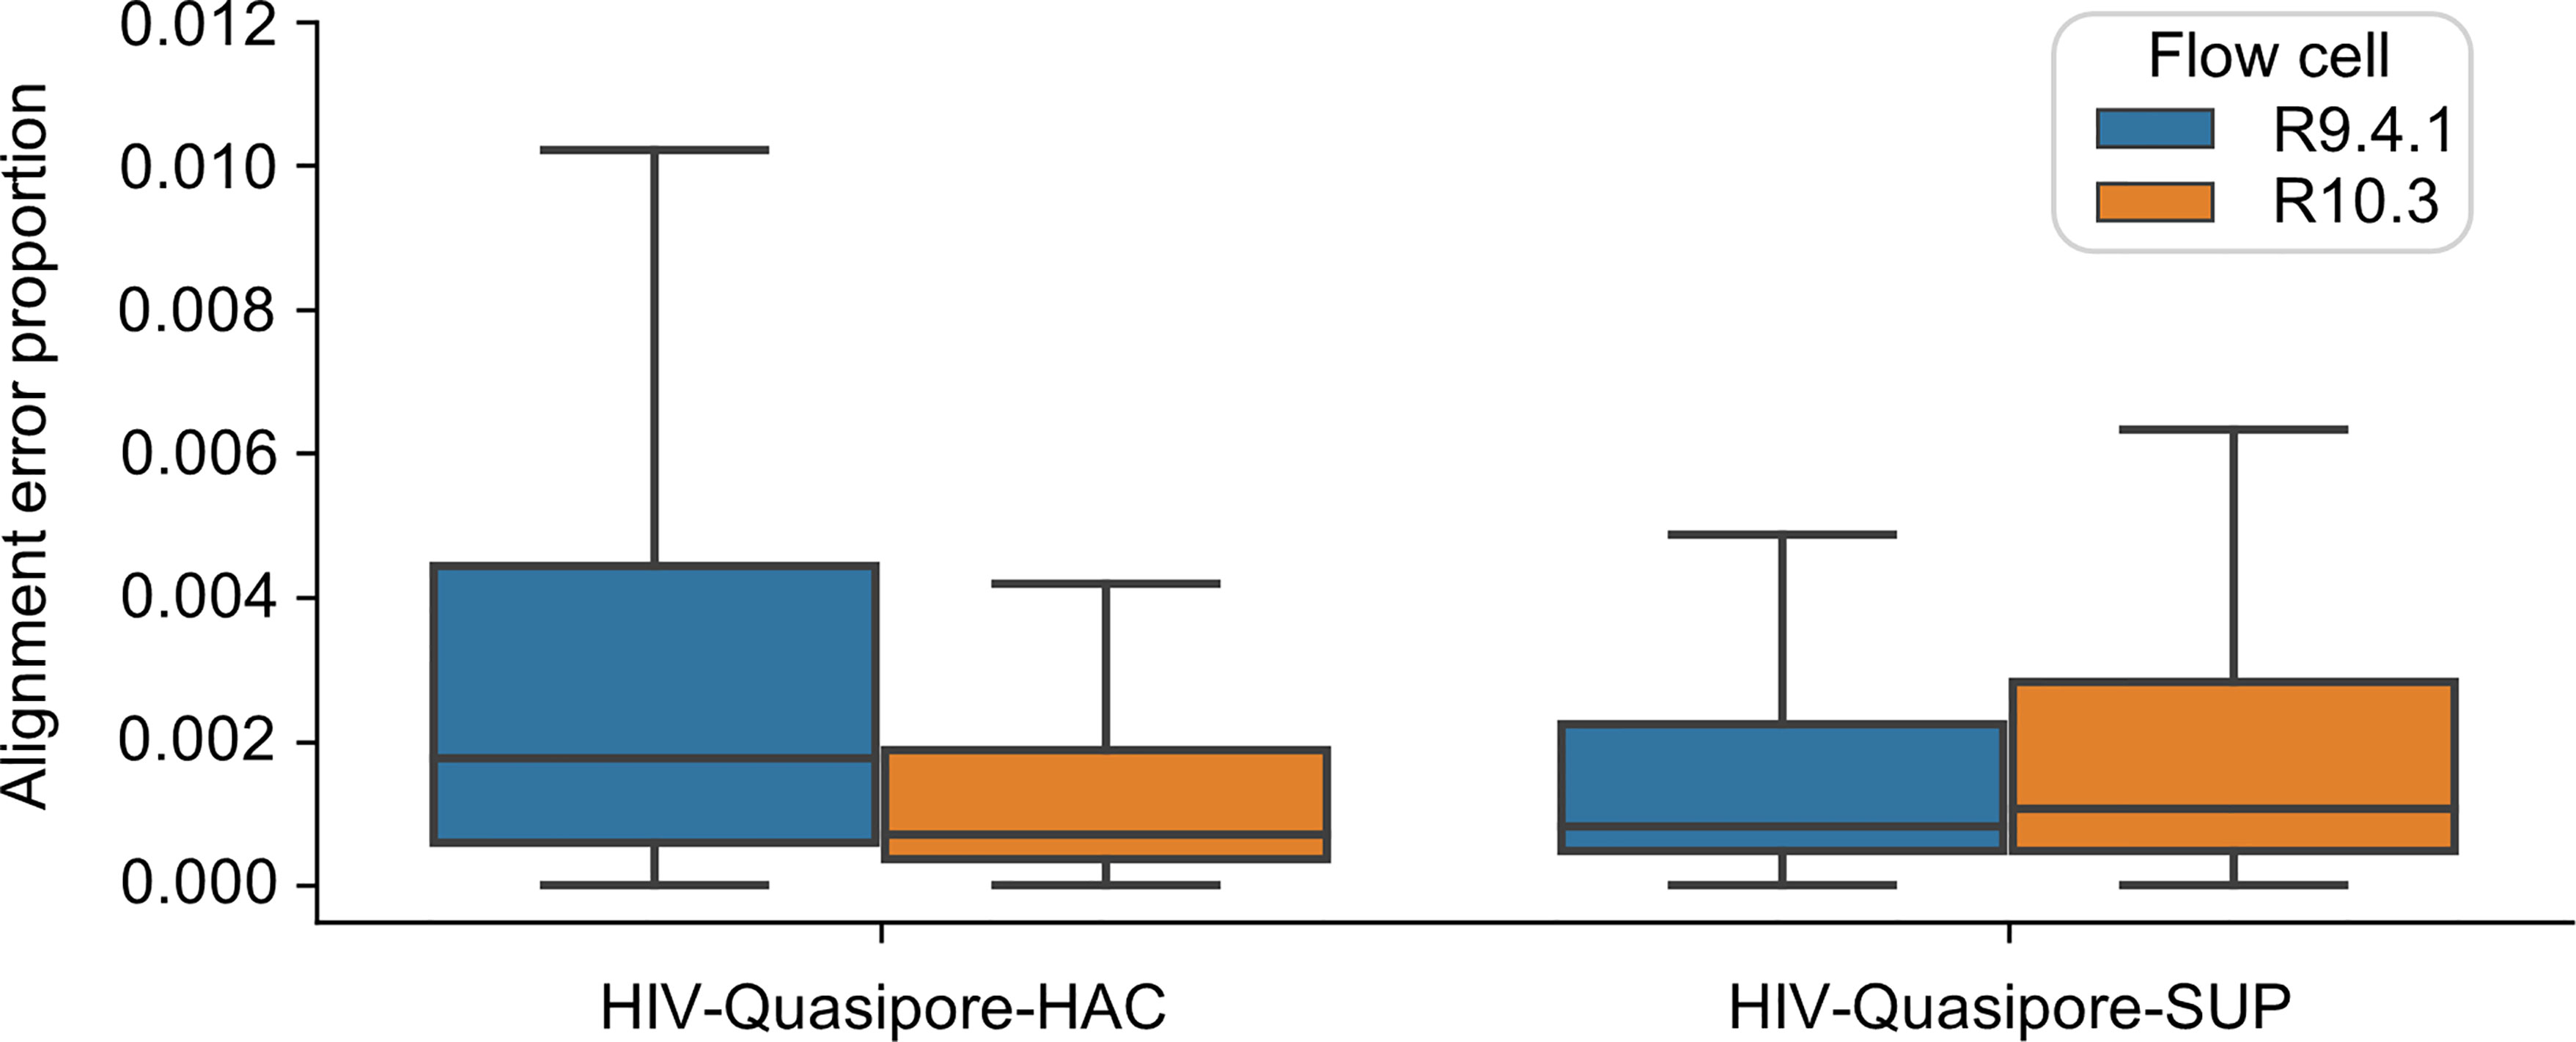
Figure 9 Nanopore flow cell choice did not affect HIV-Quasipore error rates. Box plots display the distribution of read alignment errors when called by HIV-Quasipore-HAC and SUP for R9.4.1 and R10.3 data, represented by blue and orange colors, respectively.
HIV-Quasipore-Fast Was Significantly Faster Than HAC, Which Was Significantly Faster Than SUP
Unsurprisingly, HIV-Quasipore-fast was significantly faster than HIV-Quasipore-HAC (Student’s one-sided t-test; p <0.00005 all datasets), which was significantly faster than HIV-Quasipore-SUP (Student’s one-sided t-test; R10.3 7GB p <0.05, p <0.00005 all other datasets) on all datasets for both flow cells (Figure 10). On average, R9.4.1 HIV-Quasipore-fast was 553.3 ± 90.4% faster than HAC. R9.4.1-HAC was on average 36.3 ± 1.0% faster than R9.4.1 SUP while 10.3 HIV-Quasipore-HAC was on average 30.5 ± 9.4% faster than 10.3 SUP. Experiment-specific fold means and STDs can be found in Table 2.
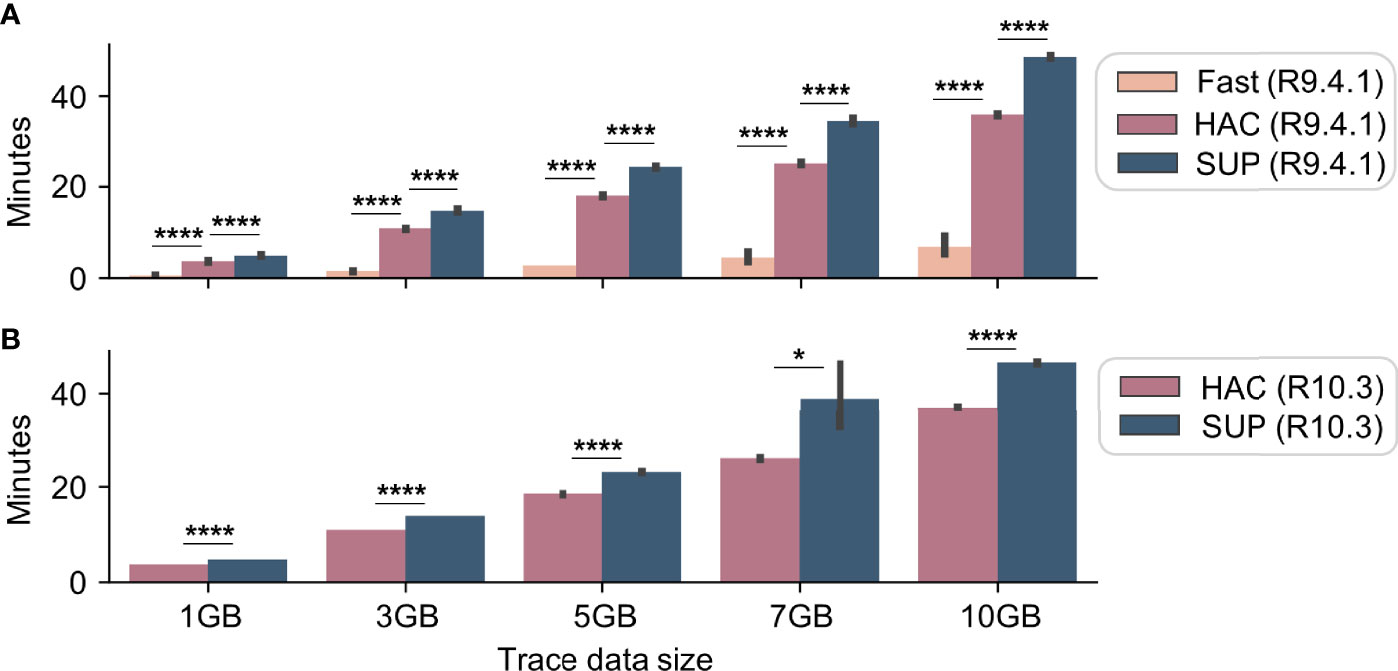
Figure 10 HIV-Quasipore basecaller speed benchmarks. Benchmark experiments were performed to evaluate the basecalling speed of R9.4.1 (A) and R10.3 (B) HIV-Quasipore basecallers using 1, 3, 5, 7, and 10 GB datasets for four replicates. As expected, the HIV-Quasipore-fast was significantly faster than the HAC across all datasets. HIV-Quasipore-HAC was significantly faster than HIV-Quasipore-SUP (*p < 0.05, ****p < 0.00005). These results were consistent across flow cells.
R9.4.1 and R10.3 HIV-Quasipore Models Displayed Comparable Basecalling Speed
R9.4.1 and R10.3 basecallers displayed comparable basecalling speed, but HAC models performed significantly faster for R9.4.1 data compared to R10.3 (Student’s one-sided t-test; p <0.005 for all datasets except 1 GB (p = 0.110)) while SUP models performed significantly faster for R10.3 compared to R9.4.1 (Student’s one-sided t-test; p <0.005 for all datasets except 7 GB (p = 0.821)). R9.4.1 HIV-Quasipore-HAC was an average of 3.1 ± 0.4% faster than R10.3 HIV-Quasipore-HAC. HIV-Quasipore-SUP was an average of 1.8 ± 6.5% faster than R10.3 HIV-Quasipore-SUP. Experiment-specific fold means and STDs can be found in Table 2.
HIV-Quasipore Basecallers Improved Read Alignment Accuracy Against J-Lat 9.2 and Clinical Isolate-Derived Genomes
HIV-Quasipore basecallers consistently improved read alignment accuracy across the unseen J-Lat 9.2 genome (Figure 11). Unsurprisingly, pretrained basecallers displayed comparable median read alignment accuracy to those of the J-Lat 10.6 genome. The median read alignment accuracies for the J-Lat 9.2 genome were 0.988, 0.982, and 0.959 for pretrained R9.4.1 SUP, HAC, and fast basecallers, respectively. For R10.3 pretrained basecallers, the median read alignment accuracies for the J-Lat 9.2 genome were 0.979 and 0.971 for the pretrained SUP and HAC basecallers, respectively. R9.4.1 The HIV-Quasipore basecaller displayed median read alignment accuracies of 0.9996, 0.999, and 0.994 across the J-Lat 9.2 genome for HIV-Quasipore-SUP, HAC, and fast, respectively. The median read length accuracies across the J-Lat 9.2 genome for R10.3 HIV-Quasipore SUP and HAC were 1.000 and 0.9995, respectively.
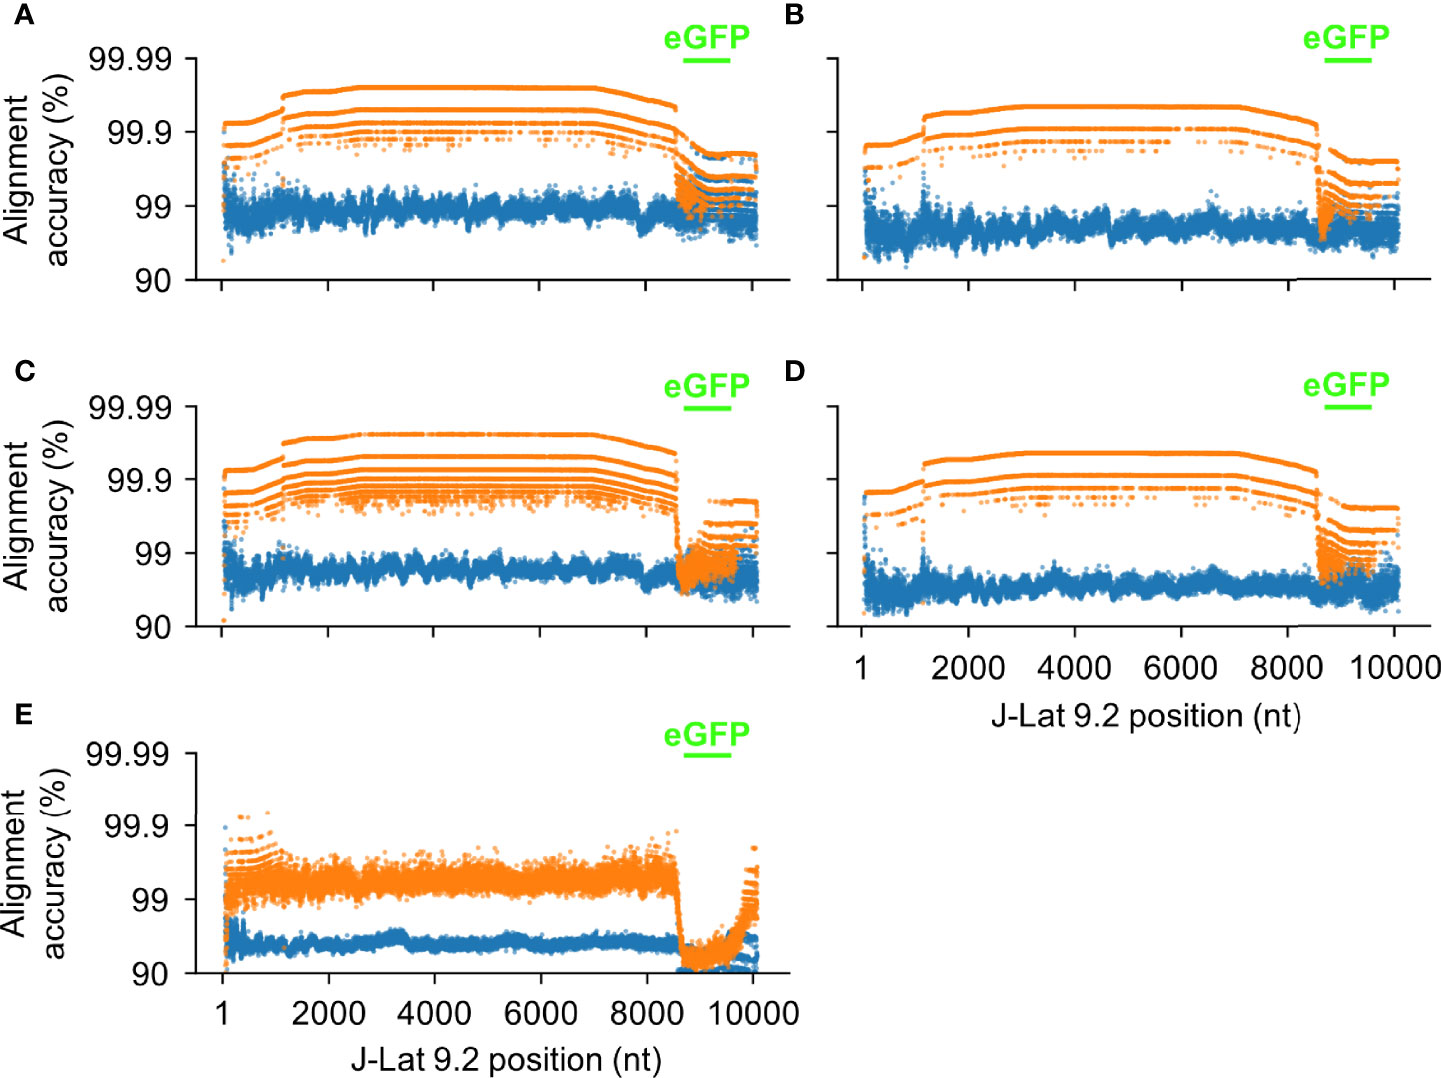
Figure 11 HIV-Quasipore improved read quality across the unseen J-Lat 9.2 genome. Each point represents the average alignment accuracy from reads overlapping a position within the J-Lat 9.2 reference genome for (A) R9.4.1 SUP, (B) R10.3 SUP, (C) R9.4.1 HAC, (D) R10.3 HAC, and (E) R9.4.1 fast pretrained and HIV-Quasipore basecallers. Orange points represent HIV-Quasipore basecallers while blue points represent their pretrained counterparts. Positions encompassing the mapped eGFP region within the J-Lat 9.2 genome are signified by green dashes.
All HIV-Quasipore basecallers noticeably decreased in performance within the J-Lat 9.2 eGFP region—denoted by the green lines in Figure 11. For R9.4.1 HIV-Quasipore basecallers, the median alignment accuracy was decreased by 0.004, 0.012, and 0.0527 for SUP, HAC, and fast basecallers, respectively. This decrease was present but less noticeable for R10.3 HIV-Quasipore basecallers. The median alignment accuracy was decreased by 0.005 for HIV-Quasipore-SUP and by 0.007 for HIV-Quasipore-HAC within the eGFP region. Alignment accuracy changes within eGFP using the R9.4.1 and R10.3 pretrained basecallers were negligible. The average change in median alignment accuracy between total median alignment accuracies and eGFP median alignment accuracies was 0.003 ± 0.002 and 0.001 ± 0.000 for R9.4.1 and R10.3 pretrained basecallers, respectively.
The HIV-Quasipore basecallers also consistently improved read alignment accuracy across the unseen clinical isolate-derived HIV-1 (Figure 12) genome. The evaluation using the clinical isolate sample reflected the above results. The median alignment accuracy for R10.3 HIV-Quasipore basecallers was 0.953 and 0.925 for SUP and HAC basecallers, respectively. Their pretrained counterparts displayed a 0.882 for pretrained SUP and a 0.881 for pretrained HAC. The HIV-Quasipore also reduced the STD for both basecallers, which decreased from 0.069 to 0.043 using HIV-Quasipore SUP and from 0.067 to 0.048 when using HIV-Quasipore HAC. A noticeable dip in performance was observed for all basecallers between positions 6,500 and 7,000. This region corresponds to the V1 and V2 loops within gp120, denoted by the black and gold lines in Figure 12, respectively. These results were expected,as the V1 and V2 loops are hypervariable, so reads mapping to those regions are unlikely to conform to the consensus sequence.
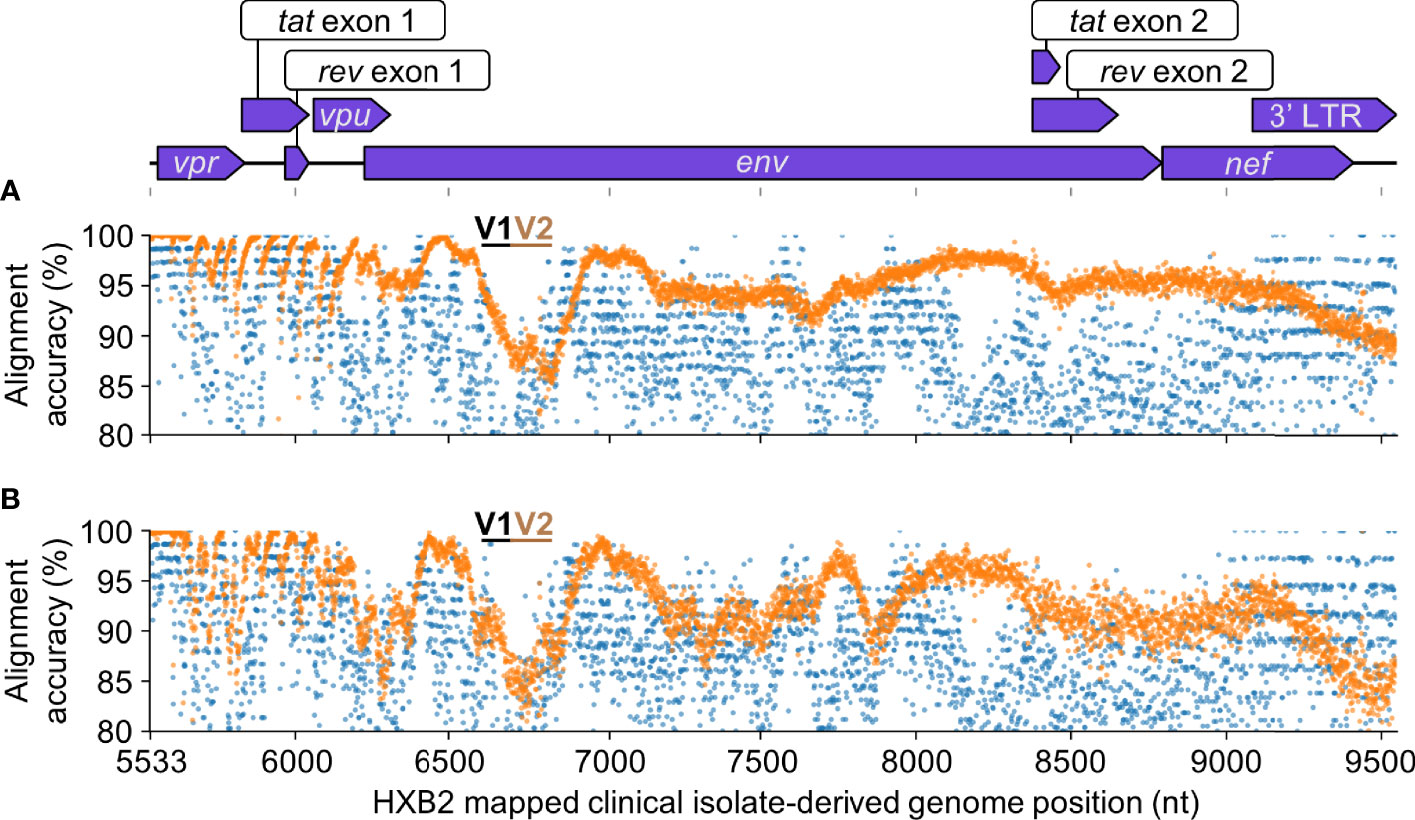
Figure 12 HIV-Quasipore improved read quality across the unseen clinical isolate-derived HIV-1 genome. Each point represents the average alignment accuracy from reads overlapping a position within the clinical isolate-derived HIV-1 reference genome for (A) R10.3 SUP and (B) R10.3 HAC basecallers. Orange points represent HIV-Quasipore basecallers while blue points represent their pretrained counterparts. Clinical isolate genome coordinates are mapped to their HXB2 equivalent positions. Features present within the clinical isolate-derived genome are displayed above the graphs. Positions encompassing the V1 and V2 loops within gp120 are signified using black and gold dashes, respectively.
Discussion
HIV-Quasipore overcomes the traditionally high error rates associated with Nanopore sequencing, which allows investigators to leverage longer reads when performing vQS analyses. Investigators can now determine true coevolution studies among vQS. While Illumina sequencing can gain insight into the vQS, short read reconstruction cannot accurately determine whether these sections truly originated from a single vQS. With reads spanning the length of the genome, it will be known which regions correspond to an individual vQS. This also grants insight into vQS-specific tat and rev exon matching, which previously could not be properly matched together by short read assembly due to long intronic sequences bridging the two exons. These long reads can also assist with simplifying complex vQS-specific analyses such as whole-genome amplification or CRISPR-induced InDel analysis. Integration site analysis can also be performed, as short read assemblies are unlikely to reconstruct any integration sites.
The HIV-Quasipore substantially decreases the coverage needed to accurately determine novel vQS found within patient samples. This quality was consistent across all samples tested in this study for all basecallers, meaning that this improved resolution was not isolated to only a select few portions of the HIV-1 genome. HIV-Quasipore also maintained alignment accuracy for longer reads, allowing it to preserve vQS integrity and maintain most genomic information. This is especially true for longer reads, as both alignment accuracy and quality are observed to scale with length. While a standard 5-fold cross-validation was impractical due to long training times—about half a day on average to train each model—the robustness of HIV-Quasipore basecallers was evaluated using unseen J-Lat 9.2 and clinical isolate-derived data. These results were consistent across the J-Lat 9.2 and clinical isolate-derived HIV-1 genomes, which establishes the robustness of the HIV-Quasipore system against unseen data.
Interestingly, the alignment accuracies for all HIV-Quasipore and pretrained basecallers were well below their corresponding performance on the clinical isolate compared to the J-Lat 10.6 or 9.2 reference genomes. We hypothesize that this is due to the biological difference between the sample types. The reference genomes contain a single integrated proviral sequence while the clinical isolates contain a spectrum of distinct proviral sequences. When evaluating reference sequences, all corresponding reads are homologous only to that genome. However, the diverse pool of a clinical isolate will generate reads that do not conform to a single consensus sequence. Most bases mapped to the sample reference genome should still correspond to the base of the reference position, so alignment accuracy is an informative metric for basecaller comparison. However, additional metrics should also be developed and applied to evaluate basecaller performance for sequencing genetically diverse populations.
Surprisingly, HIV-Quasipore-HAC and SUP basecallers showed comparable alignment accuracy and error rates across multiple experiments. This could be because HIV-Quasipore basecallers are underpinned by deep learning models where model size does not always scale with performance for a given training dataset. Smaller networks peak in performance faster than larger models given identical training data, which might explain why HIV-Quasipore-HAC outperforms SUP for both flow cells despite the higher performance of pretrained SUP models than the pretrained HAC models. Given more training data in the form of other HIV-1 cell lines (e.g., ACH2, U1) trace data and their corresponding high-quality reference genomes, it might allow HIV-Quasipore-SUP to outperform HAC. However, given the current results, it would be advantageous to leverage HIV-Quasipore-HAC over HIV-Quasipore-SUP given its faster basecalling speed and comparable performance.
Due to their corresponding strengths, both R9.4.1 and R10.3 flow cells are used to best suit the specific needs of an investigator. State-of-the-art R10.3 flow cells leverage longer channels and use dual reader heads, allowing for improved read accuracy in homopolymer runs and repetitive sequences over R9.4.1 flow cells and have already been applied for improved human leukocyte antigen (HLA) region matching (40) and noninvasive prenatal testing (41). Conversely, R9.4.1 flow cells have lower DNA input requirements, a higher sequencing output rate, and can be used in more basecallers than R10.3 flow cells. Concerning HIV-1 vQS detection, this means that R9.4.1 flow cells yield a higher genomic throughput while R10.3 flow cells result in more accurate reads. However, HIV-Quasipore basecallers display comparable alignment accuracy and error rates for both flow cells. While R9.4.1 flow cells have the same price as the R10.3 flow cells, the lower input requirement and greater yield lead to a preference for R9.4.1 flow cells when calling vQS using HIV-Quasipore. This also allows investigators to use R9.4.1 HIV-Quasipore-fast for live basecalling results, which is not available for R10.3 HIV-Quasipore.
HIV-Quasipore basecallers are trained using data generated from the MinION sequencer, which raises the question of whether they apply to other Nanopore sequencers. Examining different Nanopore workflows reveals that identical basecallers are used across different sequencing kits and sequencers, suggesting that HIV-Quasipore could be applied where those basecallers are applied. Sequencer and method-specific compatibility can be checked where configuration files are stored in the guppy basecaller software.
Traditionally, sequencers will generate a base-specific quality score, indicating the likelihood that a base was correctly called. This is not the case with HIV-Quasipore. ONT has moved away from calculating per-base quality scores with the most recent Bonito basecaller module, electing not to generate any per-base quality scores. This is because a disparity exists between true measures of basecalling quality (e.g., alignment accuracy) and per-base quality scores, even with Q-score calibration. While these metrics are not generated, read alignment accuracy and error rate analyses display confidence in the quality of the HIV-Quasipore suite. While this work focuses on applying HIV-Quasipore for improved basecalling quality and accuracy, changes in experimental design can be used to further enhance read quality. A recent tagging method (42) has been released, which reduces Nanopore sequencing error rates to <0.0042% without any change to the basecaller backend. Using this in conjunction with HIV-Quasipore can further improve the basecalling quality and resolution needed to detect vQS and perform vQS-specific analyses.
Data Availability Statement
HIV-Quasipore models and instructions can be acquired here: https://github.com/DamLabResources/HIV-Quasipore-basecallers. The J-Lat 10.6 HIV-1 reference genome is deposited under GenBank ID: MN989412.1. All J-Lat 10.6, J-Lat 9.2, and clinical isolate Nanopore and PacBio sequences are deposited under BioProject PRJNA812612.
Author Contributions
Conceptualization, RWL and WD. Methodology, RWL and WD. Software, RWL. Validation, RWL. Formal analysis, RWL. Investigation, RWL. Resources, MRN, BW, and WD. Data curation, RWL, WD, DRD, CS, ARM, and C-HC. Writing—original draft preparation, RWL, DRD, CS, and ARM. Writing—review and editing, RWL, DRD, CS, ARM, C-HC, MRN, BW, and WD. Visualization, RWL. Supervision, MRN, BW, and WD. Project administration, WD. Funding acquisition, MRN, BW, and WD. RWL has designed all figures. All authors listed have made a substantial, direct, and intellectual contribution to the work and approved it for publication.
Funding
The authors were funded in part by the Public Health Service, National Institutes of Health, through grants from the National Institute of Mental Health (NIMH) R01 MH110360 (Contact PI, BW), the NIMH Comprehensive NeuroAIDS Center (CNAC) P30 MH092177 (KK, PI; BW, PI of the Drexel subcontract involving the Clinical and Translational Research Support Core), the Ruth L. Kirschstein National Research Service Award T32 MH079785 (PI, Tricia Burdo; BW, Principal Investigator of the Drexel University College of Medicine component), and from the National Institute of Neurological Disorders and Stroke (NINDS) R01 NS089435 (PI, Michael R. Nonnemacher). The contents of the paper are solely the responsibility of the authors and do not necessarily reflect the official views of the NIH.
Conflict of Interest
The authors declare that the research was conducted in the absence of any commercial or financial relationships that could be construed as a potential conflict of interest.
Publisher’s Note
All claims expressed in this article are solely those of the authors and do not necessarily represent those of their affiliated organizations, or those of the publisher, the editors and the reviewers. Any product that may be evaluated in this article, or claim that may be made by its manufacturer, is not guaranteed or endorsed by the publisher.
Supplementary Material
The Supplementary Material for this article can be found online at: https://www.frontiersin.org/articles/10.3389/fviro.2022.858375/full#supplementary-material
Supplementary Table 1 | Nested/hemi-nested PCR primers designed to target HIV-1 near full genome from patient samples. Primers were designed to target the HIV-1 near full genome based on sequence alignments with reference strains obtained from LANL database. To amplify the ~8.5kb amplicons, two rounds of amplification were conducted in a hemi-nested approach.
Supplementary Table 2 | Amplifying PCR primers for PacBio sequencing of tat-containing fragments. Oligonucleotide sequences of outer and inner nested PCR primers used to isolate 4 kb amplicons from clinical isolate gDNA. Start nucleotide numbering corresponds to HXB2 coordinates.
References
1. Roberts JD, Bebenek K, Kunkel TA. The Accuracy of Reverse Transcriptase From HIV-1. Science (1988) 242(4882):1171–3. doi: 10.1126/science.2460925
2. Svarovskaia ES, Cheslock SR, Zhang WH, Hu WS, Pathak VK. Retroviral Mutation Rates and Reverse Transcriptase Fidelity. Front Biosci (2003) 8:d117–34. doi: 10.2741/957
3. Armitage AE, Deforche K, Chang CH, Wee E, Kramer B, Welch JJ, et al. APOBEC3G-Induced Hypermutation of Human Immunodeficiency Virus Type-1 Is Typically a Discrete “All or Nothing” Phenomenon. PloS Genet (2012) 8(3):e1002550. doi: 10.1371/journal.pgen.1002550
4. Okada A, Iwatani Y. APOBEC3G-Mediated G-To-A Hypermutation of the HIV-1 Genome: The Missing Link in Antiviral Molecular Mechanisms. Front Microbiol (2016) 7:2027. doi: 10.3389/fmicb.2016.02027
5. Alves BM, Siqueira JD, Garrido MM, Botelho OM, Prellwitz IM, Ribeiro SR, et al. Characterization of HIV-1 Near Full-Length Proviral Genome Quasispecies From Patients With Undetectable Viral Load Undergoing First-Line HAART Therapy. Viruses (2017) 9(12). doi: 10.3390/v9120392
6. Dampier W, Nonnemacher MR, Mell J, Earl J, Ehrlich GD, Pirrone V, et al. HIV-1 Genetic Variation Resulting in the Development of New Quasispecies Continues to Be Encountered in the Peripheral Blood of Well-Suppressed Patients. PloS One (2016) 11(5):e0155382. doi: 10.1371/journal.pone.0155382
7. Hedskog C, Mild M, Jernberg J, Sherwood E, Bratt G, Leitner T, et al. Dynamics of HIV-1 Quasispecies During Antiviral Treatment Dissected Using Ultra-Deep Pyrosequencing. PloS One (2010) 5(7):e11345. doi: 10.1371/journal.pone.0011345
8. Kijak GH, Sanders-Buell E, Chenine AL, Eller MA, Goonetilleke N, Thomas R, et al. Rare HIV-1 Transmitted/Founder Lineages Identified by Deep Viral Sequencing Contribute to Rapid Shifts in Dominant Quasispecies During Acute and Early Infection. PloS Pathog (2017) 13(7):e1006510. doi: 10.1371/journal.ppat.1006510
9. Liu Y, Jia L, Su B, Li H, Li Z, Han J, et al. The Genetic Diversity of HIV-1 Quasispecies Within Primary Infected Individuals. AIDS Res Hum Retroviruses (2020) 36(5):440–9. doi: 10.1089/AID.2019.0242
10. Yu F, Wen Y, Wang J, Gong Y, Feng K, Ye R, et al. The Transmission and Evolution of HIV-1 Quasispecies Within One Couple: A Follow-Up Study Based on Next-Generation Sequencing. Sci Rep (2018) 8(1):1404. doi: 10.1038/s41598-018-19783-3
11. Frost SD, McLean AR. Quasispecies Dynamics and the Emergence of Drug Resistance During Zidovudine Therapy of HIV Infection. AIDS (1994) 8(3):323–32. doi: 10.1097/00002030-199403000-00005
12. Obasa AE, Ambikan AT, Gupta S, Neogi U, Jacobs GB. Increased Acquired Protease Inhibitor Drug Resistance Mutations in Minor HIV-1 Quasispecies From Infected Patients Suspected of Failing on National Second-Line Therapy in South Africa. BMC Infect Dis (2021) 21(1):214. doi: 10.1186/s12879-021-05905-2
13. Rong L, Feng Z, Perelson AS. Emergence of HIV-1 Drug Resistance During Antiretroviral Treatment. Bull Math Biol (2007) 69(6):2027–60. doi: 10.1007/s11538-007-9203-3
14. Chung CH, Allen AG, Atkins A, Link RW, Nonnemacher MR, Dampier W, et al. Computational Design of gRNAs Targeting Genetic Variants Across HIV-1 Subtypes for CRISPR-Mediated Antiviral Therapy. Front Cell Infect Microbiol (2021) 11:593077. doi: 10.3389/fcimb.2021.593077
15. Dampier W, Sullivan NT, Chung CH, Mell JC, Nonnemacher MR, Wigdahl B. Designing Broad-Spectrum Anti-HIV-1 gRNAs to Target Patient-Derived Variants. Sci Rep (2017) 7(1):14413. doi: 10.1038/s41598-017-12612-z
16. Dampier W, Sullivan NT, Mell JC, Pirrone V, Ehrlich GD, Chung CH, et al. Broad-Spectrum and Personalized Guide RNAs for CRISPR/Cas9 HIV-1 Therapeutics. AIDS Res Hum Retroviruses (2018) 34(11):950–60. doi: 10.1089/AID.2017.0274
17. Darcis G, Binda CS, Klaver B, Herrera-Carrillo E, Berkhout B, Das AT. The Impact of HIV-1 Genetic Diversity on CRISPR-Cas9 Antiviral Activity and Viral Escape. Viruses (2019) 11(3). doi: 10.3390/v11030255
18. Sullivan NT, Dampier W, Chung CH, Allen AG, Atkins A, Pirrone V, et al. Novel gRNA Design Pipeline to Develop Broad-Spectrum CRISPR/Cas9 gRNAs for Safe Targeting of the HIV-1 Quasispecies in Patients. Sci Rep (2019) 9(1):17088. doi: 10.1038/s41598-019-52353-9
19. Knyazev S, Tsyvina V, Shankar A, Melnyk A, Artyomenko A, Malygina T, et al. Accurate Assembly of Minority Viral Haplotypes From Next-Generation Sequencing Through Efficient Noise Reduction. Nucleic Acids Res (2021) 49(17):e102–e102.
20. Knyazev S, Hughes L, Skums P, Zelikovsky A. Epidemiological Data Analysis of Viral Quasispecies in the Next-Generation Sequencing Era. Brief Bioinformatics (2021) 22(1):96–108.
21. Ho YC, Liang S, Hosmane N, Wang J, Laskey S, Rosenbloom D, et al. Replication-Competent Noninduced Proviruses in the Latent Reservoir Increase Barrier to HIV-1 Cure. Cell (2013) 155(3):540–551.
22. Rhoads A, Au KF. PacBio Sequencing and Its Applications. Genomics Proteomics Bioinformatics (2015) 13(5):278–89. doi: 10.1016/j.gpb.2015.08.002
23. MinION: The Only Portable, Real-Time Devices for DNA and RNA Sequencing. Available at: https://nanoporetech.com/products/minion (Accessed August 14th).
24. Varongchayakul N, Song J, Meller A, Grinstaff MW. Single-Molecule Protein Sensing in a Nanopore: A Tutorial. Chem Soc Rev (2018) 47(23):8512–24. doi: 10.1039/c8cs00106e
25. Talaga DS, Li J. Single-Molecule Protein Unfolding in Solid State Nanopores. J Am Chem Soc (2009) 131(26):9287–97. doi: 10.1021/ja901088b
26. Chen P, Gu J, Brandin E, Kim YR, Wang Q, Branton D. Probing Single DNA Molecule Transport Using Fabricated Nanopores. Nano Lett (2004) 4(11):2293–8. doi: 10.1021/nl048654j
27. Si W, Aksimentiev A. Nanopore Sensing of Protein Folding. ACS Nano (2017) 11(7):7091–100. doi: 10.1021/acsnano.7b02718
28. De Coster W, De Rijk P, De Roeck A, De Pooter T, D'Hert S, Strazisar M, et al. Structural Variants Identified by Oxford Nanopore PromethION Sequencing of the Human Genome. Genome Res (2019) 29(7):1178–87. doi: 10.1101/gr.244939.118
29. Li H. Minimap2: Pairwise Alignment for Nucleotide Sequences. Bioinformatics (2018) 34(18):3094–100. doi: 10.1093/bioinformatics/bty191
30. Li H, Handsaker B, Wysoker A, Fennell T, Ruan J, Homer N, et al. The Sequence Alignment/Map Format and SAMtools. Bioinformatics (2009) 25:2078–95. doi: 10.1093/bioinformatics/btp352
31. Chung CH, Mele AR, Allen AG, Costello R, Dampier W, Nonnemacher MR, et al. Integrated Human Immunodeficiency Virus Type 1 Sequence in J-Lat 10.6. Microbiol Resour Announc (2020) 9(18):e00179–20. doi: 10.1128/MRA.00179-20
32. Iwase S, Miyazato P, Katsuya H, Islam S, Tan Jek Yang B, Ito D, et al. HIV-1 DNA-Capture-Seq Is a Useful Tool For the Comprehensive Characterization of HIV-1 Provirus. Scientific Reps (2019) 9(1):1–12.
33. Vasimuddin MD, Misra S, Katsuya H, Li H, Aluru S, et al. Efficient Architecture-Aware Acceleration of BWA-MEM for Multicore Systems. In 2019 IEEE International Parallel and Distributed Processing Symposium (IPDPS) (2019) :314–324.
34. Marinier E, Enns E, Tran C, Fogel M, Peters C, Kidwai A, et al. Quasitools: A Collection of Tools for Viral Quasispecies Analysis. bioRxiv (2019), 733238. doi: 10.1101/733238
35. Shumate A, Salzberg S. Liftoff: Accurate Mapping of Gene Annotations. Bioinformatics (2021) 37(12):1639–1643.
36. Kolmogorov M, Yuan J, Yu L, Pevzner P. Assembly of Long, Error-Prone Reads Using Repeat Graphs. Nature Biotechnology (2019) 37(5):540–546.
37. Kingma DP, Ba J. Adam: A Method for Stochastic Optimization. In: Arxiv Preprint (2015). Available at: https://arxiv.org/abs/1412.6980.
38. Weirather JL, de Cesare M, Wang Y, Piazza P, Sebastiano V, Wang XJ, et al. Comprehensive Comparison of Pacific Biosciences and Oxford Nanopore Technologies and Their Applications to Transcriptome Analysis. F1000Res (2017) 6:100. doi: 10.12688/f1000research.10571.2
39. Cohen J. Statistical Power Analysis for the Behavioral Sciences. Milton Park, Abingdon-on-Thames, Oxfordshire, England, UK: Routledge (1988).
40. Liu C, Yang X, Duffy BF, Hoisington-Lopez J, Crosby M, Porche-Sorbet R, et al. High-Resolution HLA Typing by Long Reads From the R10.3 Oxford Nanopore Flow Cells. Hum Immunol (2021) 82(4):288–95. doi: 10.1016/j.humimm.2021.02.005
41. Jiang F, Liu W, Zhang L, Guo Y, Chen M, Zeng X, et al. Noninvasive Prenatal Testing for Beta-Thalassemia by Targeted Nanopore Sequencing Combined With Relative Haplotype Dosage (RHDO): A Feasibility Study. Sci Rep (2021) 11(1):5714. doi: 10.1038/s41598-021-85128-2
Keywords: HIV-1, nanopore, viral quasispecies, sequencing, deep learning, genetic diversity, genetic variation, coevolution
Citation: Link RW, De Souza DR, Spector C, Mele AR, Chung C-H, Nonnemacher MR, Wigdahl B and Dampier W (2022) HIV-Quasipore: A Suite of HIV-1-Specific Nanopore Basecallers Designed to Enhance Viral Quasispecies Detection. Front.Virol. 2:858375. doi: 10.3389/fviro.2022.858375
Received: 19 January 2022; Accepted: 11 April 2022;
Published: 23 May 2022.
Edited by:
Diego Forni, Eugenio Medea (IRCCS), ItalyReviewed by:
Francesca Di Giallonardo, University of New South Wales, AustraliaSergey Knyazev, University of California, Los Angeles, United States
Copyright © 2022 Link, De Souza, Spector, Mele, Chung, Nonnemacher, Wigdahl and Dampier. This is an open-access article distributed under the terms of the Creative Commons Attribution License (CC BY). The use, distribution or reproduction in other forums is permitted, provided the original author(s) and the copyright owner(s) are credited and that the original publication in this journal is cited, in accordance with accepted academic practice. No use, distribution or reproduction is permitted which does not comply with these terms.
*Correspondence: Will Dampier, d25kMjJAZHJleGVsLmVkdQ==
 Robert W. Link
 Diehl R. De Souza
 Cassandra Spector
 Anthony R. Mele
 Cheng-Han Chung
 Michael R. Nonnemacher
 Brian Wigdahl
 Will Dampier
