 Inbar Cohen-Gihon1
 Ofir Israeli1
 Avital Tidhar1
 Anita Sapoznikov1Yentl Evgy1Dana Stein1
 Moshe Aftalion1
 David Gur1Irit Orr2
 Anat Zvi1Tamar Sabo1Chanoch Kronman1
 Reut Falach1*
- 1Department of Biochemistry and Molecular Genetics, Israel Institute for Biological Research, Ness-Ziona, Israel
- 2Bioinformatics Unit, Life Sciences Core Facilities, Weizmann Institute of Science, Rehovot, Israel
Severe manifestations of coronavirus disease 2019 (COVID-19) are mostly restricted to distinct groups of people who have preexisting morbidities. Most COVID-19 animal models develop a mild pathology that resolves within a relatively short period of time, reflecting the more prevalent asymptomatic-to-mild performance of the disease observed in humans. Mice are normally unaffected by SARS coronavirus-2 infection, because of the inability of the virus to bind effectively to the murine angiotensin-converting enzyme 2 (ACE2) receptor. We have previously demonstrated that induction of mild and transient pulmonary morbidity, by application of low doses of ricin, rendered CD1 mice to be susceptible to this virus, which was displayed by sustained body weight loss and mortality rates >50%. In the present study, we performed transcriptomic analyses charting the major alterations in gene expression of mice that were pre-exposed to low doses of ricin and then subjected to SARS-CoV-2 infection compared to mice that were solely exposed to ricin or infected with SARS-CoV-2. Mice intoxicated and infected with ricin and SARS-CoV-2 demonstrated a marked stimulation of essential immunity genes and biological pathways involved in the activation of natural-killer response, cell death receptors, cytotoxic T-cells, Toll-like receptor signaling and the NLRP3 inflammasome pathway. At the protein level, an induced early and transient interferon response was recorded which was subsequently suppressed. The activation of this array of genes predicts clinical manifestations that are consistent with severe COVID-19 in humans, thereby establishing the suitability of this unique animal model for the study of severe COVID-19 disease.
Introduction
Severe acute respiratory syndrome coronavirus 2 (SARS-CoV-2), the causative agent of coronavirus disease 2019 (COVID-19), belongs to the Coronaviruses (CoV) family, a group of enveloped, single, positive-stranded RNA viruses causing mild to severe respiratory illnesses in humans (1–3). There are common motifs that characterize the immune response to infection by respiratory viruses, including the CoV family. After infection, viruses are typically detected by pattern recognition receptors (PRRs) such as the inflammasome sensor NLRP3, which signal the release of interferons (IFNs) and inflammatory cytokines including the IL-1 family, IL-6, and TNF, that activate a local and systemic response to infection (4, 5). This involves the recruitment, activation, and differentiation of innate and adaptive immune cells, including neutrophils, inflammatory myeloid cells, CD8 T cells, and natural killer (NK) cells. Resolution of infection is largely dependent on the cytotoxic activity of CD8 T cells and NK cells, which enable clearance of virus-infected cells. Failure to clear virus-infected cells may facilitate a life-threatening hyper-inflammatory cytokine storm (6, 7).
Suitable animal models are essential for revealing the pathogenesis of SARS-CoV-2 and evaluating countermeasures and vaccines. In the literature, most COVID-19 animal models, including hamsters, non-human primates and ferrets, develop mild symptoms and transient inflammation which resolves within a relatively short period of time reflecting the more prevalent asymptomatic-to-mild manifestation of the disease observed in humans (8–10). Mice are normally unaffected by SARS-CoV-2 infection, since the virus does not bind effectively to the murine version of the angiotensin-converting enzyme 2 (ACE2) receptor molecule (11). A few transgenic mouse models expressing the human ACE2 gene are available (11–13) but most except for the K18-hACE2 transgenic mouse show limited infectability by SARS-CoV-2 and develop mild symptoms upon infection. Although severe clinical manifestations were observed in K18-hACE2 transgenic mouse, these were not dependent on pre-existing morbidities and may well be due to high-level indiscriminate expression of human ACE2 in a wide spectrum of cells which do not normally express this molecule.
Nevertheless, a previous study carried out at our laboratory demonstrated that induction of pulmonary morbidities by application of low doses of the acute lung injury stimulant ricin toxin, rendered outbred genetically non-modified mice to be susceptible to this virus (14). Specifically, exposure of CD-1 mice to SARS-CoV-2 after induction of mild pulmonary injury by administration of low-dose ricin (LDR-SC2 mice) caused a severe disease which was manifested by sustained body weight loss (~30%) and mortality rates >50%. Mice that were only exposed to low-dose ricin (LDR-mice) or SARS-CoV-2 (SC2 mice) presented transient and mild weight loss (10%) or no weight loss at all, respectively and without mortality. Furthermore, quantitative RT-PCR analysis of lungs 2 days after infection demonstrated the presence of significantly higher levels of viral RNA in the lungs, nasal turbinate, trachea, heart and serum of LDR-SC2 mice compared with SC2 mice and this levels remained high in the lungs, heart and serum even 7 days after infection. Additionally, viral growth kinetic profiling and sub-genomic RNA analysis of lung extracts at 3 days post infection testified the presence of infectible and multiplying virus in the lungs derived from the acute lung injury stimulant-pretreated mice (LDR-SC2). The deleterious effects of SARS-CoV-2 infection were effectively alleviated by passive transfer of polyclonal or monoclonal antibodies generated against the SARS-CoV-2 receptor binding domain (RBD), indicating that viral cell entry in the sensitized mice occurs via viral RBD binding, albeit by a mechanism other than the canonical ACE2-mediated uptake route (14).
The existence of a unique mode of entry for the SARS-CoV-2 virus, justifies the characterization of the disease that develops in the wake of such a viral infection. In the present study, by performing comparative transcriptomic analyses, we charted the major alterations in gene expression of mice that were pretreated with low doses of ricin and then subjected to viral infection. The activation of a large array of differentially expressed genes (DEGs) predicts clinical manifestations that are consistent with severe COVID-19 in humans, thereby establishing the suitability of this unique animal model for the study of severe COVID-19 disease.
Materials and Methods
Cells and Virus
African green monkey kidney clone E6 cells (Vero E6, ATCC® CRL-1586TM) were grown in Dulbecco's Eagle's medium (DMEM) containing 10% fetal bovine serum (FBS), MEM non-essential amino acids (NEAA), 2 mM L-Glutamine, 100 units/ml penicillin, 0.1 mg/ml streptomycin, 12.5 units/ml nystatin (P/S/N) (Biological Industries, Israel). Cells were cultured at 37°C, 5% CO2 at 95% air atmosphere.
SARS-CoV-2 (GISAID accession EPI_ISL_406862) was kindly provided by Bundeswher Institute of Microbiology, Munich, Germany. Virus stocks were propagated (four passages) and titered on Vero E6 cells. Handling and working with SC2 virus were conducted in a BSL3 facility in accordance with the biosafety guidelines of the Israel Institute for Biological Research (IIBR).
Ricin
Crude ricin was prepared by us, as described previously (15), from seeds of endemic Ricinus communis.
Animal Experiments
Animals in this study were female CD-1 mice (Charles River Laboratories Ltd., Margate, UK) at the age of 8–10 weeks, weighing 27–32 grams Prior to treatment or infection, animals were habituated to the experimental animal unit for at least 5 days. All mice were housed in filter-top cages in an environmentally controlled room and maintained at 21 ± 2°C and 55 ± 10% humidity. Lighting was set to mimic a 12/12 h dawn to dusk cycle. Animals had access to food and water ad libitum. Treatment of animals was in accordance with regulations outlined in the USDA Animal Welfare Act and the conditions specified in the National Institute of Health Guide for Care and Use of Laboratory Animals.
Ricin (1.7 μg/kg) was administered intranasally (25 μl per nostril) to mice anesthetized by an intraperitoneal (i.p.) injection of ketamine (1.9 mg/mouse) and xylazine (0.19 mg/mouse). Mice displaying weight loss of >30%, were euthanized by cervical dislocation.
SARS-CoV-2 diluted in PBS supplemented with 2% FBS was intranasally instilled to mice anesthetized as above at a dose of 5 x 10⁶ PFU/mouse.
RNA Extraction
Mice, under deep anesthesia (ketamine, 1.9 mg/mouse and xylazine, 0.19 mg/mouse), were employed to in situ infusion of the RNA preserving reagent RNAlater (1 ml, Thermo Fisher Scientific, Waltham, MA, USA) into the lungs through the trachea. The thoracic cavity was dissected, lungs were removed after PBS perfusion via the heart and subsequently placed in a 50 mL test tube containing 25 mL RNAlater for 24 h. RNA was isolated from lungs using Qiagen RNeasy mini kits (Qiagen, CA, USA) with an on-column DNase step (Qiagen, CA, USA) according to the manufacturers' instructions. RNA quantification was carried out in a Qubit fluorometer using the Qubit RNA HS assay kit (Invitogen, CA, USA). Quality control analysis of RNA integrity was performed using High Sensitivity RNA ScreenTape and the TapeStation Analysis software (Agilent Technologies). All the samples reached a RIN (RNA integrity number) score of >8.
RNA-Seq
RNA-seq was performed at the JP Sulzberger Columbia Genome Center (NY, NY). Libraries were generated using the Ilumina TrueSeq Standard mRNA kit according to manufacturers' instructions. Sequencing of 100 bp paired-end was performed on the Ilumina NovaSeq 6000 system. RNA-seq quality control was performed using fastQC v0.11.5, checking for per base sequence quality, per sequence quality scores and adapter content. Pseudoalignment to a kallisto index created from transcriptomes (Mouse: GRCm38) was performed using kallisto (0.44.0) (16). We verified that each sample reached at least 78.7% of the target read goal and checked for adequate sequence alignment percentages. Sequencing yielded 15 M to 24.9M reads per sample resulting in identification of 35,199 transcripts. Analysis of differentially expressed genes under various conditions was performed using the R package DESeq2 v1/18.1 (17) with default parameters. DESeq2 uses a negative binomial distribution to model the RNA-seq counts, having a good balance between specificity and sensitivity. Its input consists of non-normalized read counts at either the gene or transcript level. Once each gene is modeled, a Wald Test is usually applied for hypothesis testing, followed by Benjamini-Hochberg multiple test correction. DESeq2 results tables describe the log2 fold changes, standard errors, p-values and adjusted p-values (FDR) for each gene. In this study, genes with an adjusted p-value below a threshold of 0.01 and fold change (FC) of ≥ 1.5 or ≤ 0.66 were defined as Differentially Expressed Genes. The mouse GRCm38 annotation file was downloaded from the ensemble BioMart website (https://www.ensembl.org/Mus_musculus/Info/Index).
Data and Materials Availability
The transcriptomic data have been deposited in NCBI's Gene Expression Omnibus (GEO) (accession number of the transcriptome series is GSE189015 and the SRA BioProject number is PRJNA781200).
IPA Functional Analysis
Differentially expressed genes were functionally analyzed based on the QIAGEN's Ingenuity Pathway Analysis (IPA®, QIAGEN Redwood City, www.qiagen.com/ingenuity) software, which included canonical pathway analysis, upstream regulators and gene networks. The IPA system was used for subsequent downstream analysis. A network algorithm was applied to segment the network map between molecules into multiple networks and assign scores for each network (18, 19). Canonical pathways were scored for degree by analyzing a ratio of the number of genes that map to the pathway. The created genetic networks describe functional relationships among genes or proteins based on known associations in the databases. The p-value calculated by Fisher's exact test was used to determine whether the probability of the association was not due to chance. For upstream regulators, the P-value of overlap <0.01 was set as the threshold.
Broncho-Alveolar Lavage Fluid Analysis
Mice were anesthetized by an intraperitoneal (i.p.) injection of ketamine (1.9 mg/mouse) and xylazine (0.19 mg/mouse). BAL was preformed by flushing the lungs with 1 ml of PBS using a tracheal cannula. BAL fluids were centrifuged at 3,000 rpm at 4°C for 10 min. Supernatants were collected and stored at −20°C until further use. BAL fluids of Interferone-α (IFN-α), IFN-β and IFN-γ were determined by ELISA (R&D systems, Minneapolis, MN, USA).
Results and Discussion
cDNA libraries were prepared from lungs of CD-1 mice subjected to the following treatments (1) intranasal exposure to low dose ricin (1.7 μg/kg body weight, LDR, n = 4), (2) intranasal infection with SARS-CoV-2 (5 x 10⁶ PFU per mouse, SC2, n = 3), (3) exposure to low dose ricin and 2 days later, infection with SARS-CoV-2 (a combination of 1 and 2; LDR-SC2, n = 4). A fourth group comprising naïve mice, served as control (n = 4). Lungs of mice groups 1–3 were harvested 4 days after ricin application and/or 2 days following viral infection (Figure 1A). The rational for performing the RNA-seq analysis on lungs 2 days post SARS-CoV-2 infection stems from the fact that at this time point the viral RNA levels are highest compared to later time points tested (5 and 7 days post infection) in lungs of LDR-SC2 and SC2 mice. Moreover, at this time point the viral growth kinetic profiling and the subgenomic RNA analysis of the virus indicated on the presence of infectible and multiplying virus in both infected groups (14).
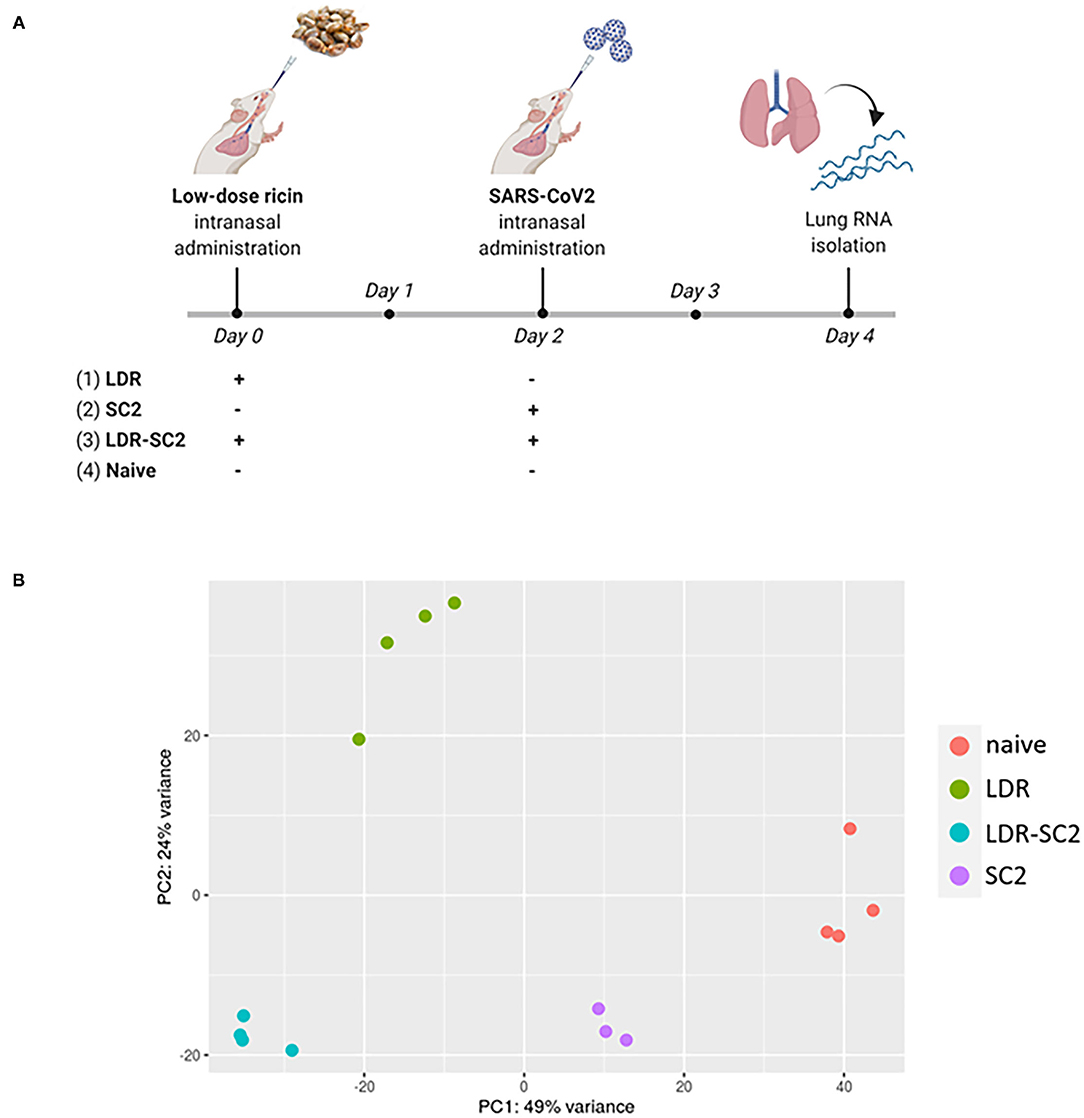
Figure 1. (A) Time-table for treatment and lung harvest for RNA-seq analysis of the various mice groups. The scheme was created with BioRender.com. (B) PCA scatter plot of gene expression in lungs of mice. PCA analysis shows clustering of RNA-seq samples by treatment.
Sequence Output
In total, 327,586,108 reads were generated for the 15 samples (3–4 mice per group), ranging between 19.1 and 29.3 million per sample. On average, 83.4%, ranging between 79.5 and 85%, of all the clean reads were aligned to the reference genome. A summary of the RNA sequencing and mapping of all 15 samples is presented in Supplementary Table S1. Principal Component Analysis (PCA) performed on the normalized counts (based on the DESeq2 method) demonstrated unequivocally the distinct clustering of RNA-seq samples of the various treatment groups, highlighting the differential impact of the various treatments on the overall transcription in the mice lungs (Figure 1B). While PC1, explaining 49% of the total variance, separates all treated samples from control (naïve) samples, PC2, explaining 24% of the total variance, differentiates LDR from LDR+SC2 samples.
Analysis of Differentially Expressed Genes
Lung transcripts of each treated group were subjected to statistical analysis to evaluate differential gene expression compared to the naïve group. Differentially Expressed Genes (DEGs) were defined as such when having false discovery rate (FDR) value (p-adjusted) of ≤ 0.01 and a fold change (FC) of ≥1.5 or ≤ 0.66. The numbers of up/downregulated DEGs following the different treatments are displayed as volcano plots in Figures 2A–C.
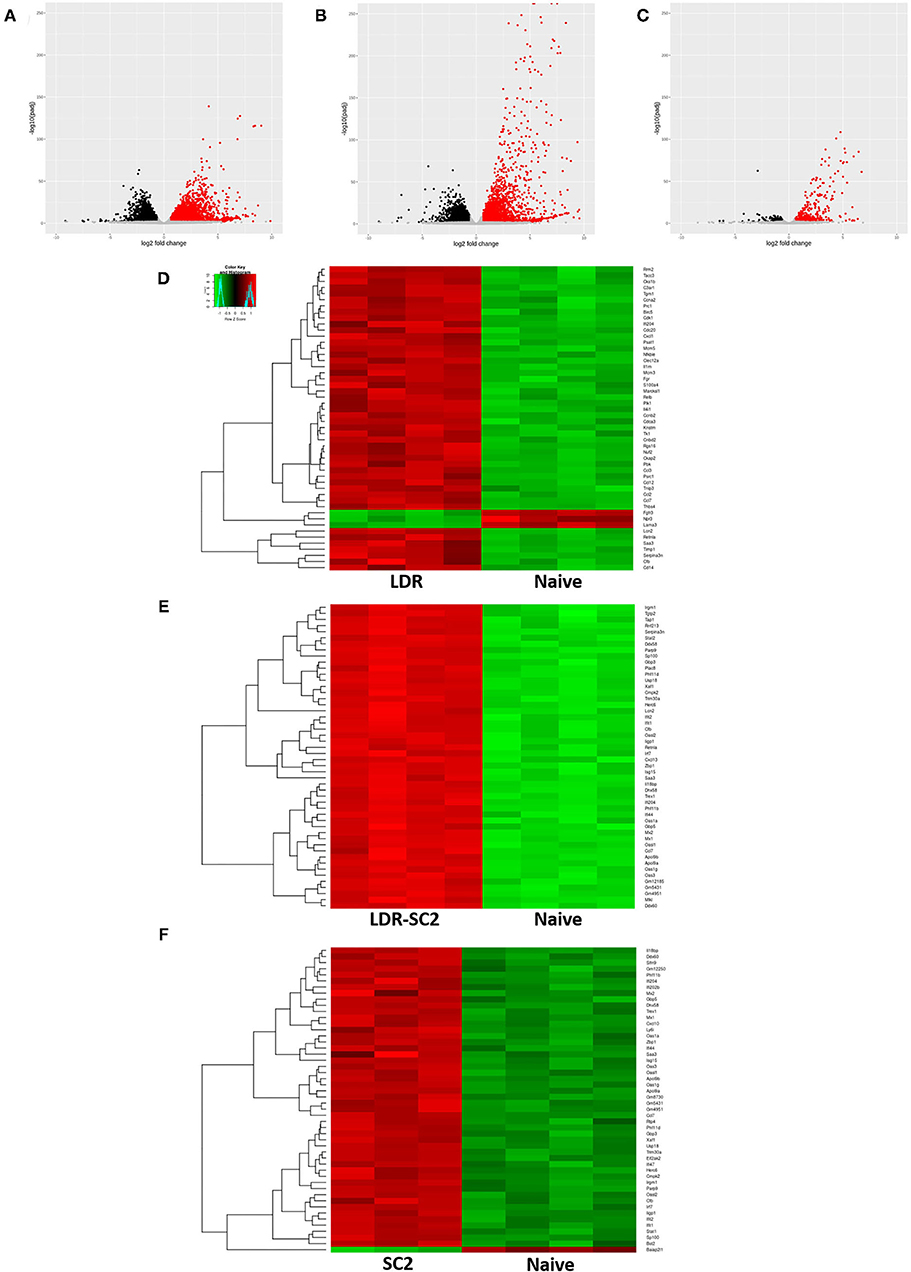
Figure 2. RNA-seq data analysis. (A–C) Volcano plot representation of differential expression analysis of genes in the LDR (A), LDR-SC2 (B) and SC2 (C) treatment groups vs. naïve mice. Black and red dots mark the genes with significantly decreased and increased expression, respectively (p ≤ 0.01). The x-axis shows log2 fold-changes in expression and the y-axis the p-value (log10) of a gene being differentially ex-pressed. (D–F) Heatmap of hierarchical clustering performed for the 50 top DEGs (ranked by p-adjusted value) indicating differentially expressed genes (rows) in LDR (D), LDR-SC2 (E) and SC2 (F) treatment groups vs. naïve mice (fold-change ≥ 1.5 or ≤ 0.66, P < 0.01). Notice the clear presence of groups of genes that are systematically, either up-regulated (red) or down-regulated (green) in each analyzed group, n = 3–4.
Analysis of LDR-treated mice transcripts resulted in the detection of 6684 DEGs, 55% upregulated and 45% downregulated as compared to naïve mice. Similarly, in LDR-SC2 treated mice, a total of 6,044 genes were differentially expressed, 52% induced and 48% repressed. Considerably fewer (797, 67% upregulated and 33% downregulated) DEGs were differentially expressed in the SC2 mice group. Nevertheless, the appearance of even hundreds of DEGS in this treatment group was more than expected in view of the fact that SARS-CoV-2 infection alone does not cause any noticeable clinical disease in CD-1 mice (14).
Hierarchical clustering analyses (according to the Pearson correlation) performed for the 50 top regulated DEGs (ranked by p-adjusted value) in each treatment group are presented as heat maps (Figures 2D–F). Individual gene expression was normalized across samples to percentages ranging from marked downregulation (deep green) to marked upregulation (deep red). These heat maps suggest that the treatments and naive samples were clearly separated by the expression profile of DEGs.
Detailed examination of the 50 top DEGs (Supplementary Table S2) detected in the LDR treated mice group revealed that 40% of these are involved in the inflammation response (e.g., Ccl7, Cxcl1, Ccl12, Nfkbie, Ccl3, Cd14) and 38% are cell cycle related genes (ex. Cdk1, Psrc1, Cdc20, Ckap2, Cks1b, Mcm3). Only 14% of these genes were found to overlap with the 50 top DEGs of the LDR-SC2 group. In contrast, in the LDR-SC2 and SC2 groups (Supplementary Table S2), 60 and 62%, respectively, of the top regulated genes were found to be interferon-stimulated genes (ISG, e.g., Mx1, Mx2, Iigp1, Usp18, Apol9a, Trim30a, Oas1, Oas3) with a 76% match in the 50 top DEGs between these two groups. The induction of an interferon response following viral stimulus is expected since interferons provide a first line of defense against virus infections by generating an intracellular environment that restricts virus replication by signaling the presence of a viral pathogen to the adaptive arm of the immune response. Interferons stimulate cells in the local environment to activate a network of interferon-stimulated genes encoding for proteins that possess antiviral, antiproliferative and immunomodulatory activities (20). In a single-cell RNA sequencing (scRNA-seq) study of peripheral blood mononuclear cells (PBMCs) from COVID-19 patients, a strong upregulation of numerous ISGs was observed in a patient with severe disease compared to patients with mild disease (21). Moreover, a transcriptome study of BAL fluid from COVID-19 patients showed increased expression of numerous ISGs in addition to marked increases in proinflammatory and chemokine genes, suggesting proinflammatory roles of upregulated ISGs in COVID-19 (22). However, the fold change expression of these identical genes in the LDR-SC2 group is on average 5.6 higher than in the SC2 group, consistent with the fact that the pathological outcome manifested in the mice of these two treatment groups differs dramatically; while combined LDR-SC2 treatment leads to a severe pulmonary disorder, SC2 treatment in itself does not cause any discernable pathology.
Functional Analysis of Gene Expression
The identified DEGs were subjected to functional analyses, employing the Ingenuity Pathway Analysis (IPA) tool. As described above, DEGs were defined as having p-adjusted ≤ 0.01 and fold change ≥1.5 or ≤ 0.66. Figure 3 depicts the significant canonical pathways identified in all three treatment groups, (ranked according to their –log (P-value) >2.5 threshold) as well as the ratios between the number of molecules from the dataset mapping to the pathway and the total number of molecules that map to the canonical pathway according to the IPA database. Consistent with the data gleaned from the analysis of individual genes, the canonical pathways identified in the LDR-SC2 treatment group displayed a 65 and 40% overlap with those determined for in the LDR and SC2 treatment groups, respectively. The vast majority of these pathways are related to inflammatory responses (e.g., “interferon signaling,” “role of pattern recognition receptors in recognition of bacteria and viruses” and “communication between innate and adaptive immune cells”). As to pathways which are unique to the LDR-SC2 treatment group, comparison of these pathways to those of the LDR treatment group, demonstrates advanced activation of T cells and specific antiviral defense mechanisms (e.g., “role of PKR in interferon induction and antiviral response” and “role of RIG1-like receptors in antiviral innate immunity”) in the former group. Comparison of the unique pathways of the LDR-SC2 treatment group to those of the SC2 group demonstrates in the former an induction of the inflammasome pathway, Natural Killer cell signaling and T-Helper cell differentiation, as well as anti-inflammatory pathways (e.g., IL-10 signaling, MSP-RON signaling and inhibition of Matrix Metalloproteases).
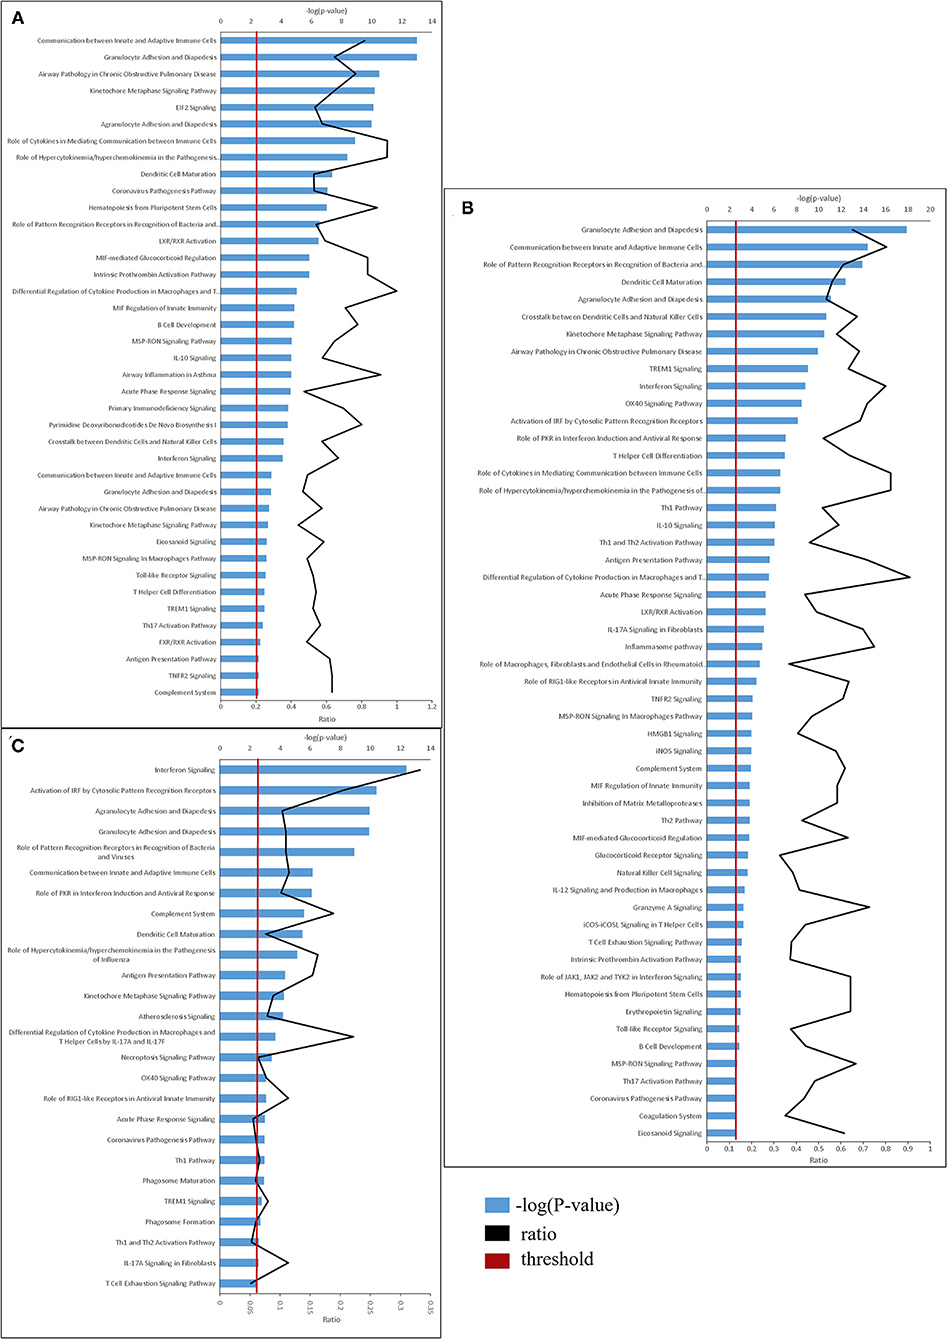
Figure 3. Top canonical pathways derived from Ingenuity pathway analysis. The canonical pathways are analyzed with both up and down-regulated genes (p ≤ 0.01) and ranked ac-cording to their –log (P-value) (blue bars). “Threshold” (red line) indicates the minimum significance level (scored as –log [P-value] set here at 2.5). “Ratio” (black curve) indicates the number of molecules from the data set that map to the pathway listed divided by the total number of molecules that map to the canonical pathway from within the IPA database. (A) naïve vs. LDR. (B) naïve vs. LDR-SC2. (C) naïve vs. SC2.
The canonical pathway “Coronavirus pathogenesis” was found to be affected in all three treatment groups, however the direction of its regulation toward activation or inhibition, differed between treatment groups (as reflected by the z-score, z>0-upregulated, z <0 downregulated). Thus, as shown in Figure 4A, this pathway is strongly downregulated in the LDR group, slightly inhibited in mice which were only infected with SC2 and upregulated in the LDR-SC2 group. These finding are fully in line with the fact that LDR-treated mice were not exposed to the virus, SC2-treated mice were exposed to the virus but did not develop any discernible disease while the LDR-SC2-treated mice groups displayed severe symptoms and high mortality rates following viral infection (14). The fact that the “Coronavirus pathogenesis” pathway is activated in the lungs of LDR-SC2 mice demonstrates that our severe COVID-19 mouse model is a bona fide model for human COVID-19 disease.
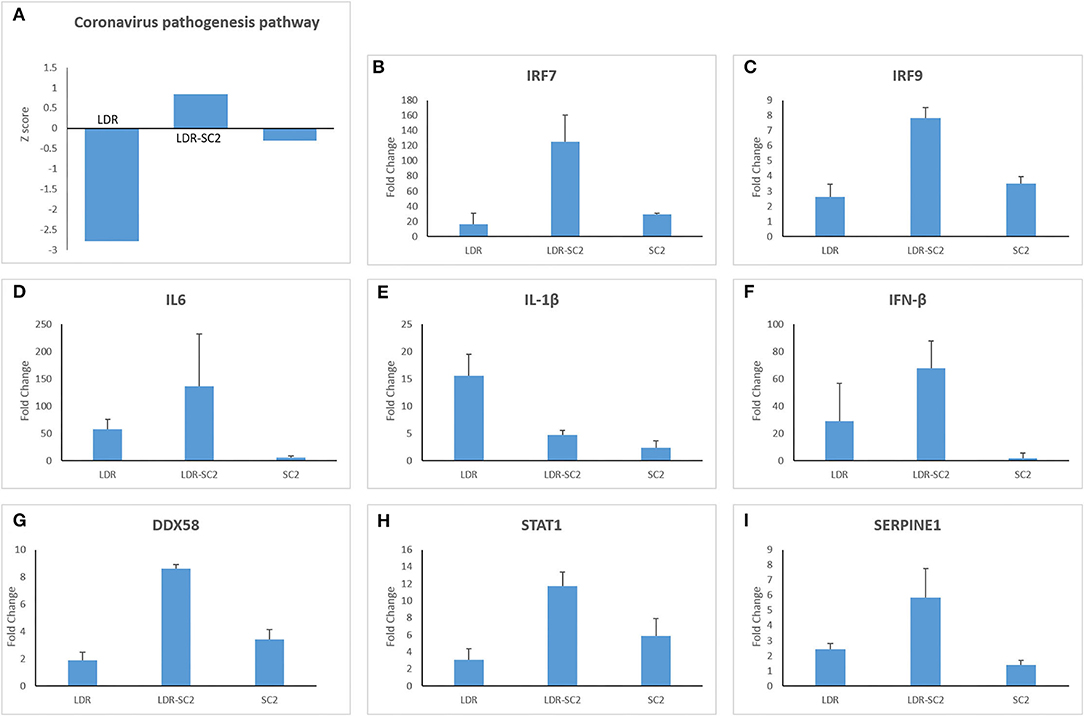
Figure 4. The canonical pathway “Coronavirus pathogenesis.” (A) Biological pathway analysis revealed significant activation of the “Coronavirus pathogenesis pathway” for all 3 treatments (LDR, LDR-SC2 and SC2) presented by their Z-scores. Positive and negative values indicate overall activation or inhibition of downstream targets, respectively (B–I). Expression levels (presented as fold change values compared to non-treated (naïve) mice group) of a subset of the expressed genes of the “Coronavirus pathogenesis pathway” in the various treatment groups presented by their Fold Change value.
The DEGs comprising this pathway are presented in Figures 4B–I. Three transcription regulators, IRF7, IRF9 and STAT1, which mediate type I interferon (IFN)-dependent immune responses are upregulated in all three treatment groups, the rank order of overexpression being LDR-SC2>>SC2 > LDR (Figures 4B,C,H). However genes of the “coronavirus pathogenesis” pathway that specify an active inflammation response, like IL-6, IL-1β and IFN-β, were not activated in the SC2 treatment group (Figures 4D–F). As to these three genes, IL-1β was upregulated mostly in the LDR group while IL-6 and IFN-β were mainly amplified in the LDR-SC2 group. As expected, DDX58, an innate immune receptor that senses cytoplasmic viral nucleic acids, exhibited increased expression only in the mice groups that were exposed to the virus, being markedly higher in the LDR-SC2 group (x2.5) than in the SC2 group (Figure 4G). Upregulation of the Serpin1 gene was observed mostly in the LDR-SC2 treatment group (Figure 4I). This gene, which belongs to the serine protease inhibitor (SERPIN) gene family, codes for the major physiologic inhibitor of the urokinase plasminogen activator (uPA)-dependent pericellular plasmin-generating cascade. The urokinase pathway regulates fibrinolytic and procoagulative responses designed to prevent vascular permeability and hemorrhage (23, 24). We suggest that lethal SC2 infection overwhelms the normally protective, profibrinolytic signaling of the urokinase pathway, leading to overall dysregulation, including increased Serpin1 expression, and severe lung disease. While fibrin is required for normal wound healing, persistent and excessive intra-alveolar fibrin levels can contribute to acute inflammatory and chronic interstitial lung disease.
Identification of the changes in expression of downstream genes by transcriptomic analysis, may enable to predict upstream regulators responsible for these observed changes. Indeed, by employing the Ingenuity analysis tool, we were able to detect 1,365, 1,565 and 1,045 upstream potential regulators (P < 0.01) in the LDR, LDR-SC2 and SC2 treatment groups, respectively. The 20 top significant upstream regulators of the LSR-SC2 group, compared to those of the LDR and SC2 groups (sorted by their Z score value which predict their activation or inhibition status) are presented in Figure 5 under three molecular type headings: cytokines, transcription regulators and transmembrane receptors. Overall, substantial differences (activated Z-score ratio ≥ 2 between groups) were observed mostly between the LDR and LDR-SC2 groups compared to the SC2 group. Six cytokines (TNF, IL1B, CSF2, IL6, IL2 and CD40LG) were found to be considerable upregulated in the LDR-SC2 group as compared to the SC2 group. Most interestingly is IL4, a Th2 cytokine with pleiotropic effects on the immune system. While being activated in LDR and LDR-SC2 treatment groups, this particular cytokine is inhibited in the lungs of mice that were only infected with SC2. Among the upstream transcription regulators, STAT3, IRF8, CEBPB, NFKB1 and ETS1, all of which have an important role in the regulation of genes involved in the immune and inflammatory response, were found to be activated to a significantly lesser degree in the SC2 treatment group than in the LDR-SC2 treatment group. As in the case of IL-4, the TREM1 receptor (Triggering receptor expressed on myeloid cells 1) of the “transmembrane receptors” category was activated in the LDR and LDR-SC2 treatment groups and inhibited in the lungs of mice only infected with SC2. This receptor which is mainly expressed on myeloid cells, has been recently implicated to play an important role in modulating the intensity of innate immune responses by amplifying Toll-like receptors induced inflammation (25). As to the trans-membrane receptors CD28, CD40, Klrk1, TNFRSF1B and CTLA4 level of expression, these were found to be markedly higher in the LDR-SC2 treatment group than in the SC2 treatment group. These transmembrane receptors are mainly expressed on immune cells (CD40- antigen presenting cells, CD28 and CTLA4- T cells, Klrk1- NK cells) and have a pivotal role in regulating cell inflammatory response. It should be noted that upstream regulator analyses failed to detect any significant difference between the predicted upstream regulators of the LDR-SC2 and LDR treatment groups, even though only in the case of combined LDR-SC2 treatment, the arising inflammatory response leads to severe and sustained illness and mortality.

Figure 5. Analysis of upstream regulators. The Ingenuity pathway analysis revealed upstream regulators responsible for gene expression changes in the LDR-SC2 group com-pared to the LDR and SC2 groups presented by their activated Z-score value. Thresh-old was defined as p < 0.05 and −2 ≥ Z-score or Z-score >2 in the RS group. (A) cytokines. (B) transcription regulators. (C) transmembrane receptors.
The major significant entities (canonical pathways, upstream regulators, biological functions) and the links between them as predicted by the Ingenuity analysis (Figure 6), allows us to appreciate the main biological processes that occur in each of the treatment groups. The main processes identified in the lungs of the LDR treated mice are related to tissue damage, cell death and immune pro-inflammatory response (activation of TNF-α, IL-1β and IL-6). In both the SC2 and LDR-SC2 treatment groups, activation of immune-response and interferon-response pathways were observed. On the other hand, the two groups differed in the intensity of their inhibition of viral replication responses, which was markedly more prominent in mice treated with SC2 only (inhibition of replication of viral replicon/virus). Likewise, specific inhibition of infection responses in the lungs were observed too in this treatment group. In the case of LDR-SC2 treated mice, the pathways related to activation of T-helper immune response and natural killer cells were specifically stimulated. It seems that the difference between the LDR-SC2 and SC2 treated lungs is in the intensity and effectiveness of the inflammation that develops with the exposure to the virus. The ability of the SARS-CoV-2 virus to enter cells and to replicate in them, as indeed happens in the LDR-SC2 but not in the SC2 treatment group (14) leads to a dysregulated and excessive immune response characterized by overexpression of proinflammatory cytokines/chemokines, massive infiltration of inflammatory cells to the lungs, as well as by employment of SC2-induced evasive strategies through the suppression of antiviral type I interferon responses in infected cells. In contrast, in the SC2 treatment group, the anti-viral immune response mounted following viral infection is highly effective presumably due to the inability of the virus to replicate.
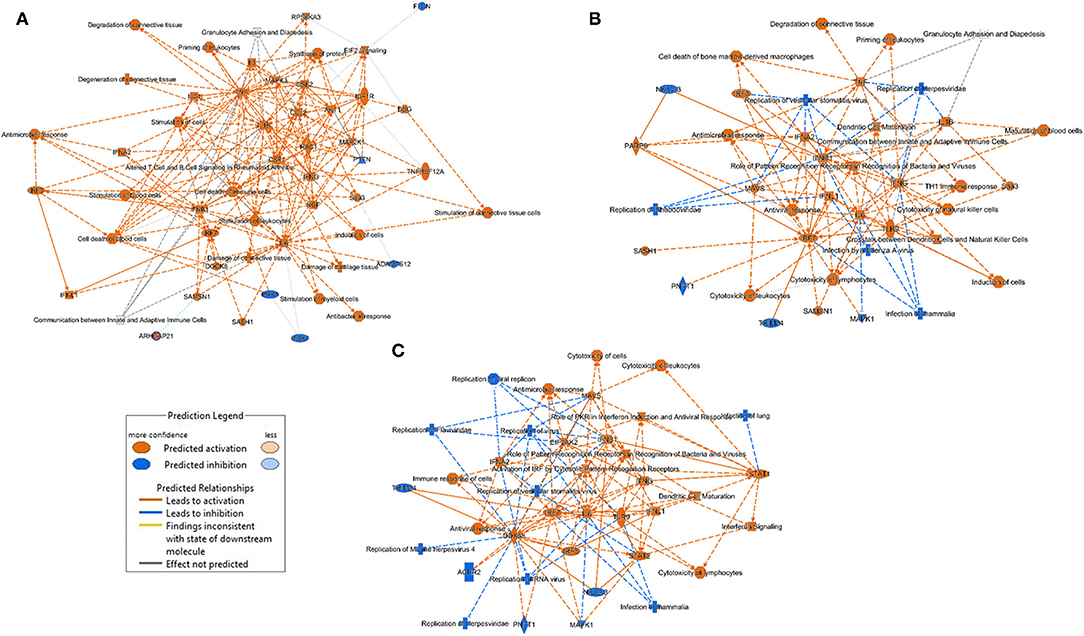
Figure 6. Graphical summary of the major biological processes predicted by the Ingenuity analysis. (A) LDR mice (B) LDR-SC2 mice (C) SC2 mice.
LDR-SC2 Unique Differential Expressed Genes
Further characterization of the distinct SARS-CoV-2 related-disease which develops following sensitization with low doses of ricin, was achieved by analyses of a Venn diagram, depicting the overlapping of the DEGs [FDR (p-adjusted) ≤ 0.01 and fold change (FC) ≥ 1.5 or ≤ 0.66] identified in the different treatment groups (Figures 7A,B). Overall, 388 upregulated and 198 downregulated DEGs were found to be common to all three treatment groups examined. Conversely, 770 upregulated and 840 downregulated DEGs were found to be unique for the LDR-SC2 treated mice. The biological interactions of the DEGs unique to the LDR-SC2 treatment group were examined by the Ingenuity Pathway Analysis (IPA) and their significant canonical pathways [–log (P-value) ≥ 2 threshold] were ranked along with the ratios between the number of molecules from the dataset mapping to the pathway and the total number of molecules that map to the canonical pathway according to the IPA database (Figure 7C). The pathway found to be most pronounced in the LDR-SC2 treatment group is related to interactions between dendritic cells and natural killer (NK) cells. Cooperative interactions between DCs and NK cells play a key role in triggering immune responses against pathogens and results in reciprocal activation of these cells. Thus, mature DCs release cytokines that promote NK cell activation, while IFN-γ, released by the activated NK cells, promotes Th1 polarization and DC maturation (26). NK cells are known to provide an efficient protective shield against virus infections, presumably due to the fact that NK cells do not need prior antigen sensitization and therefore can serve as immediate responders against pathogens. Indeed, NK cells are able to lyse “non-self” cellular targets while sparing normal cells that express adequate levels of “self” major histocompatibility complex of class I (MHC-I) molecules (27, 28). Various data support the fact that NK cell counts are lowered remarkably during SC2 infection, predominantly in critically ill patients (29–31). However, it is yet unclear if this decrease is due to NK cell redistribution in infected sites and sequestration in target organs such as the lungs or to cell death.
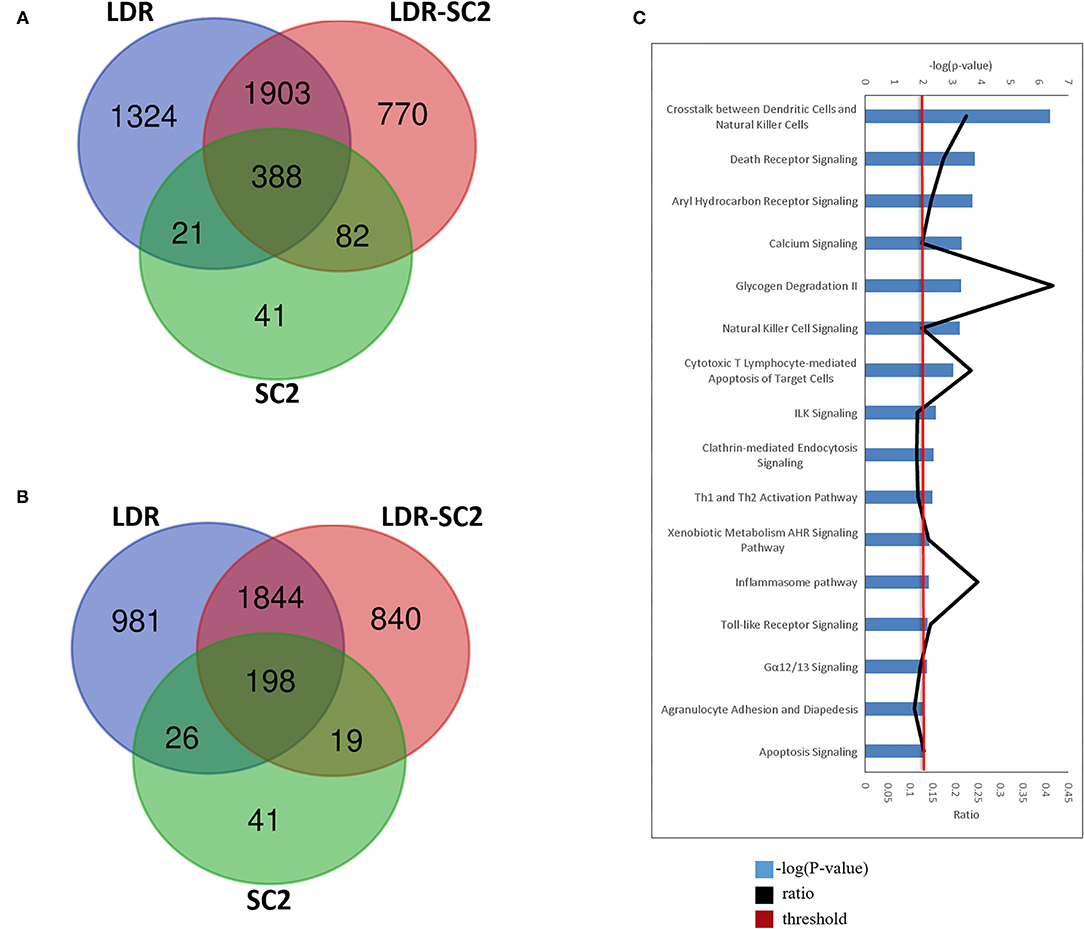
Figure 7. LDR-SC2 unique DEGs and Canonical pathways. (A,B) Venn diagram showing the distribution of differentially-expressed genes that are unique or common among the three treatments. (A) upregulated DEGs. (B) downregulated DEGs. (C) Top canonical pathways derived from Ingenuity pathway analysis. The canonical pathways are analyzed with both up and down-regulated genes (p ≤ 0.01) and ranked according to their –log (P-value) (blue bars). “Threshold” (red line) indicates the minimum significance level (scored as –log [P-value] set here at 2.5). “Ratio” (black curve) indicates the number of molecules from the data set that map to the pathway listed divided by the total number of molecules that map to the canonical pathway from within the IPA database.
The death receptor signaling canonical pathway, which was also activated solely in the LDR-SC2 treatment group, triggers death receptors that in response to their cognate ligand binding, stimulate an apoptotic signaling pathway characterized by direct activation of intracellular cysteine proteases (caspases). The induction of apoptosis is a hallmark of SC2 infection. Increased expression of death receptor signaling pathway in response to the virus infection is correlated with the fact that SC2 ORF3a was found to induce apoptosis in cells (32) by activation/cleavage of caspase-8 (extrinsic apoptotic pathway) without effect on Bcl-2 expression levels (intrinsic apoptosis pathway) (33).
Another identified uniquely activated canonical pathway, the Aryl Hydrocarbon (AHR) signaling pathway, was proven previously by RNA-seq analysis of lung epithelial cells to occur following infection with SC2 (34). AHR signaling has been shown to play a physiological role in the regulation of the host anti-viral response (35). Type I IFN (IFN-I), the central regulator of the anti-viral response, induces AHR expression, and as part of a negative feedback loop, AHR can suppress the expression of IFN-I (36, 37). Previous studies using AHR antagonists and gene knockdown have shown that AHR inactivation reduces Influenza A, Zika and Dengue virus replication (35). These findings led to the hypothesis that AHR is a pro-viral host factor targeted by multiple viruses to limit IFN-I/NF-κB-driven host anti-viral immunity and thus promotes virus replication. Indeed, in mice infected with Influenza A virus, AHR antagonism increased IFN-β levels, reduced BALF viral titers and increased survival (38).
An additional canonical pathway found to be upregulated is the calcium signaling pathway. Calcium is necessary for viral entry into host cells, viral gene expression, processing of viral proteins, and viral maturation and release (39–44). To meet their need for calcium, many pathogenic viruses induce increased influx of this ion across cell membranes (39, 40, 42). Such influxes of calcium are often mediated by viral-encoded calcium channels termed viroporins. Vaporins facilitate calcium influx to the cytoplasm from across the cell membrane or the membrane of the endoplasmic reticulum, which acts as a store for intracellular ionic calcium (45). In other host–virus systems, viruses use host encoded cellular calcium channels to increase calcium entry into the cytoplasm (43). In COVID-19, hypocalcemia is highly prominent, being reported in 60% or more of patients upon hospital admission. It is associated with hospitalization itself as the most prominent of 9 risk factors reported in longer hospitalizations, ventilation, ICU admission and mortality (46–48).
Canonical pathways involving T cell activation were also uniquely upregulated the LDR-SC2 treatment group. The expression of different cytotoxic molecules in T cell subpopulations is an important hallmark of virus control (49). Additionally, IPA analysis revealed activation of Th1 and Th2 cells. The Th-1 cell phenotype is pivotal in mediating virus-specific adaptive immunity which together with sufficient anti-viral interferons, promotes the phagocytic activity of macrophages and stimulates the proliferation and activation of cytotoxic T lymphocytes (CTLs) to allow effective and specific viral clearance (50). SARS-CoV-2 infection is associated with a reduction in CD8+ and CD4+ T cells (51, 52). One prominent cause of this lymphopenia may be an enhanced migration of T cells into infected compartments (53, 54). Despite the lymphopenia, expanded virus-specific CD8+ and CD4+ T cells can be detected in COVID-19 patients (55, 56).
The “clathrin-mediated endocytosis signaling” and “inflammasome” pathways were also found to be triggered uniquely in the LDR-SC2 treatment group. Clathrin-mediated endocytosis was recently found to be the major endocytic mechanism employed by the SARS-CoV-2 virus and this mode of entry was shown to be critical for infectivity (57). The inflammasome pathway includes activation of the NLRP3 inflammasome multimeric protein complex, a molecular platform that promotes inflammation via cleavage and activation of key inflammatory molecules including active caspase-1 (Casp1p20), IL-1β, and IL-18 (58). The NLRP3 inflammasome was shown to be activated in response to SARS-CoV-2 infection and is active in COVID-19 patients. The presence of inflammasome-derived products such as Casp1p20 and IL-18 in the sera was found to correlate with established markers of COVID-19 severity and poor clinical outcome such as IL-6, LDH, IL-18 and Casp1p20 (59). Taken together, the arising pathology in LDR-SC2 treated mice is characterized by intense, rapid stimulation of the (NLRP3) inflammasome pathway and release of its products including the proinflammatory cytokines. These findings seem to suggest that the severe tissue injury is a result of dysregulated hyperinflammation in response to viral infection, rather than of viral replication itself.
Upstream analyses of DEGs detected exclusively in the LDR-SC2 treatment group, identified 29 activated and 12 inhibited regulators (Table 1, P < 0.01). In the cytokine segment, major activation of the two subtypes of IFN cell signaling pathways, Type I IFN (including IFNα and IFNβ) and Type II IFN (IFNγ) were observed. Potential activation of upstream regulators responsible for the proliferation and activation of T and NK lymphocytes (IL2, IL15 and IL21) and for the stimulation of the initial inflammatory response (OSM and IL-18) were also determined. In the transcription factors segment we found transcription factors that positively regulate type I interferon gene induction downstream of pattern recognition receptors (IRF7, IRF3), TH1 immune response (IRF1, NFATC2), interferon-stimulating gene transcription (STAT1), activation of apoptosis cascade (TP53) and lymphocyte development and function (RELB). Finally, upstream analyses in the transmembrane receptor segment revealed potential activation of Toll-like receptors (TLR2, TLR3 and TLR4), as well as interferon-α/β, NK cells cytotoxic (KLRK1), T-cell costimulatory (CD28) and antigen-presenting cell (CD40, CD86) receptors. Potential inhibition of the cell surface receptor for IL10, a cytokine that mediates anti-inflammatory processes, was identified as well.
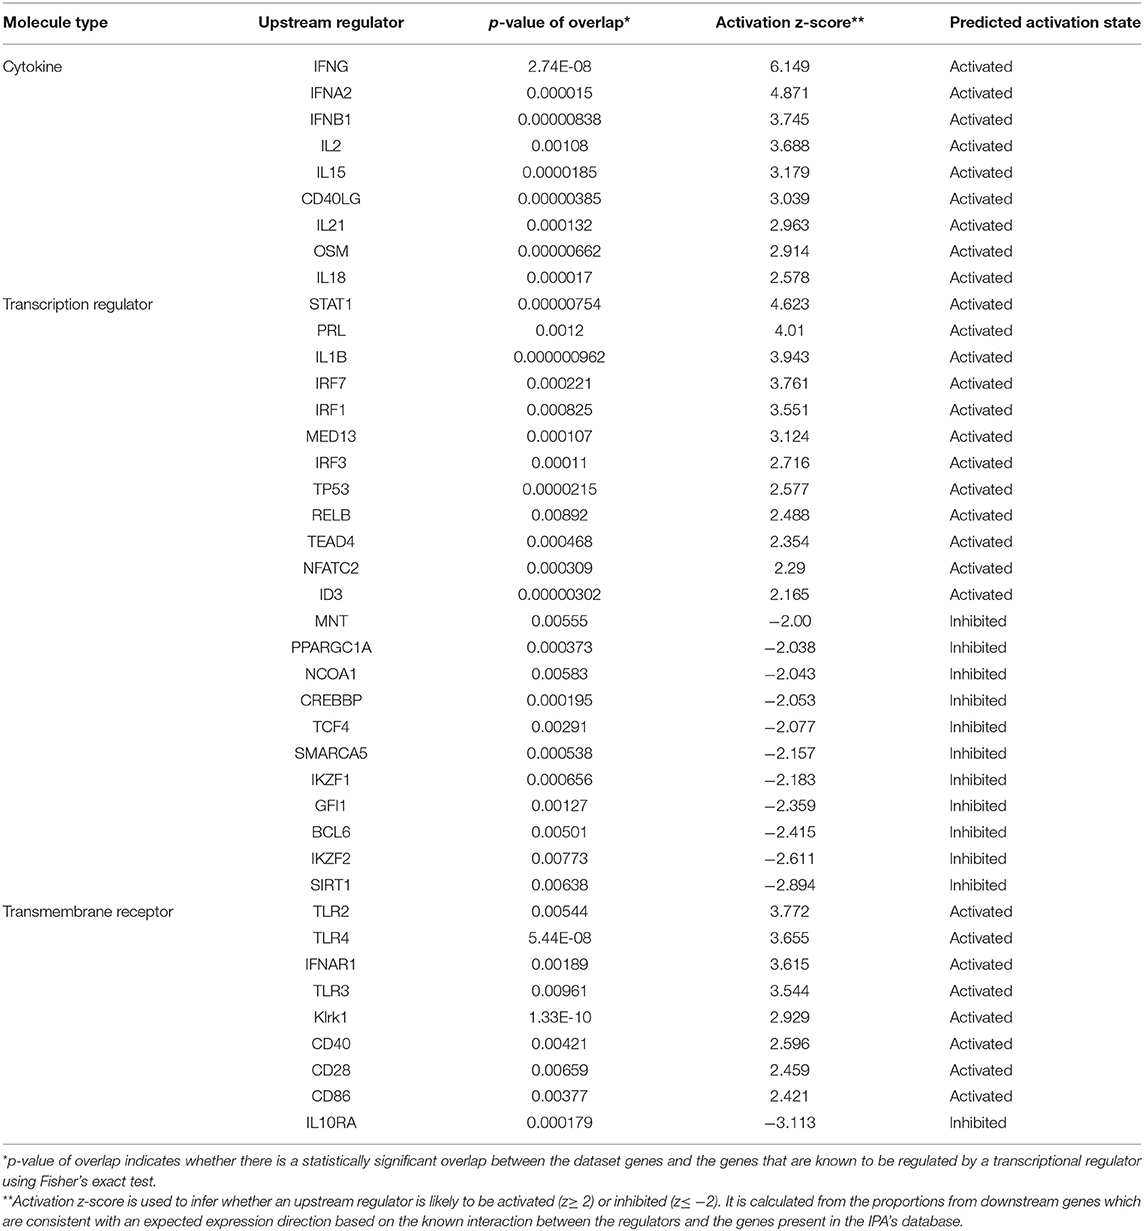
Table 1. Upstream analysis of LDR-SC2 unique DEGs.
A cytokine storm is a physiological reaction in which the innate immune system elicits an uncontrolled and excessive production of soluble pro-inflammatory factors which, in turn, sustain an aberrant and highly deleterious systemic inflammatory response. The main components involved in the development of cytokine storms are interferons, interleukins, chemokines, colony-stimulating factors and TNF-alpha (60). In line with our observations indicating systemic immune over-activation due to SARS-CoV-2 infection over a low-dose-ricin induced pulmonary disorder background, and with evidence from current studies that show that cytokine storming is an important component in COVID-19 progression (61, 62), we determined the gene expression levels of the chemokine and cytokines that were found to be significantly upregulated in lungs of LDR-SC2 treated mice, as compared to LDR and SC2 treatment groups (Figure 8). High levels of Interferon γ, IL-6, CXCL10 and CCL2, all of which are overexpressed in LDR-SC2 treated mice, are associated with pulmonary inflammation and increased levels of these factors were consistently found in blood samples of COVID-19 patients. High levels of other pro-inflammatory cytokines (IFNβ, IFNγ, IL-1β, IL-6, IL-12, IL-15, IL-27, TNFα) and chemokines (CXCL11, CXCL13, CXCL16, CCL3, CCL5) were detected as well. These pro-inflammatory factors have been shown to precipitate and sustain aberrant systemic inflammatory responses (63–66). Amplified expression of the colony-stimulating factor (CSF) cytokine family and selectin-adhesion molecules was revealed as well. These cytokine families are associated with inflammatory conditions in which CSF proteins are components of an amplification cascade which lead to increased cytokine production by macrophages (67), while selectin molecules mediate the initial attachment of leukocytes to venular endothelial cells, allowing their firm adhesion and subsequent diapedesis (68).
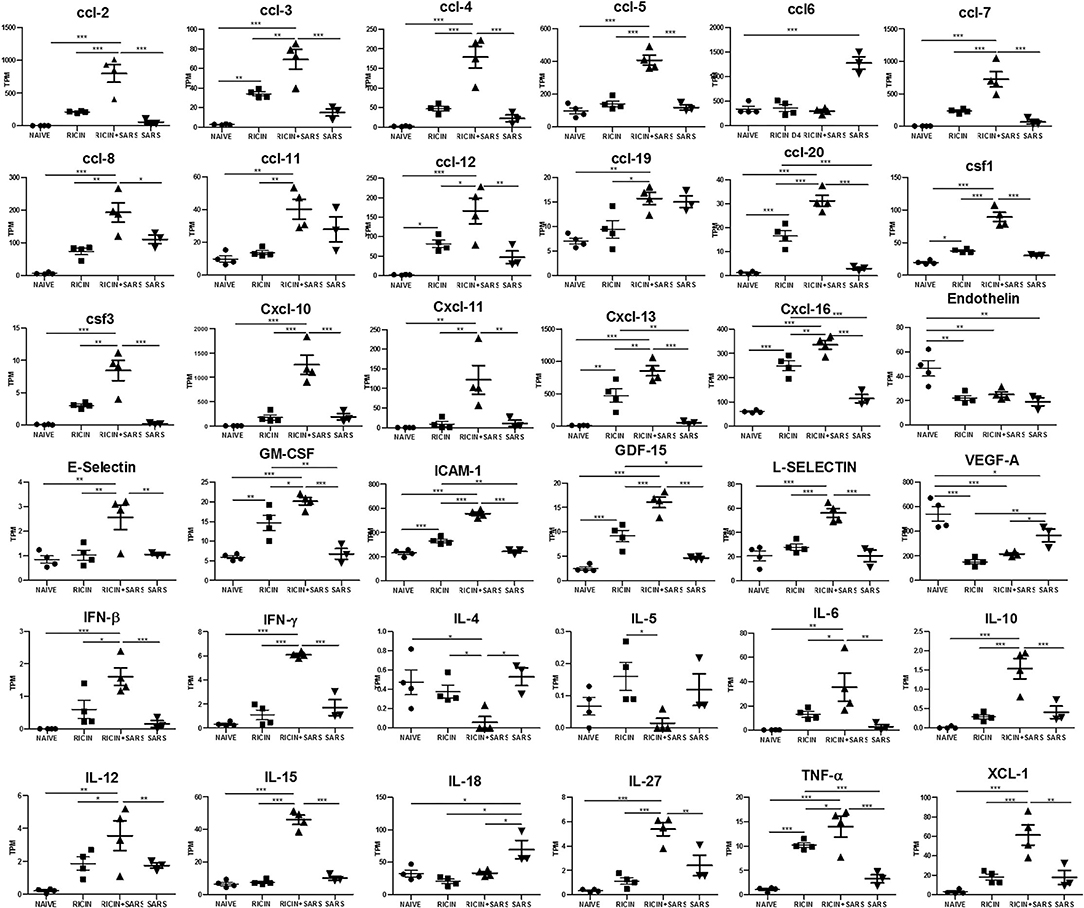
Figure 8. LDR-SC2 significant cytokine and chemokine gene expression in lungs compared to naïve or LDR or or SC2 mice. Normalized gene expressed levels (transcripts per million, TPM) of 23 indicated cytokines and chemokines determined from RNAseq data. Data are presented as average ± SEM (n = 3–4 per group) analyzed using unpaired t-test. *p < 0.05, **p < 0.01, ***p < 0.001.
Interferon Response in BAL Fluid
Since RNA-seq analysis detected major involvement of the interferon response in all areas examined, we quantified and compared the levels of interferon proteins in the lungs of mice treated with low-dose ricin, SC2 and or both, to that of naïve mice. To this end. IFN- α, IFN-β and IFN-γ levels were determined in the BAL fluid sampled at days 4 and 7 after low-dose ricin application and or days 2 and 5 after viral infection (Figure 9A).
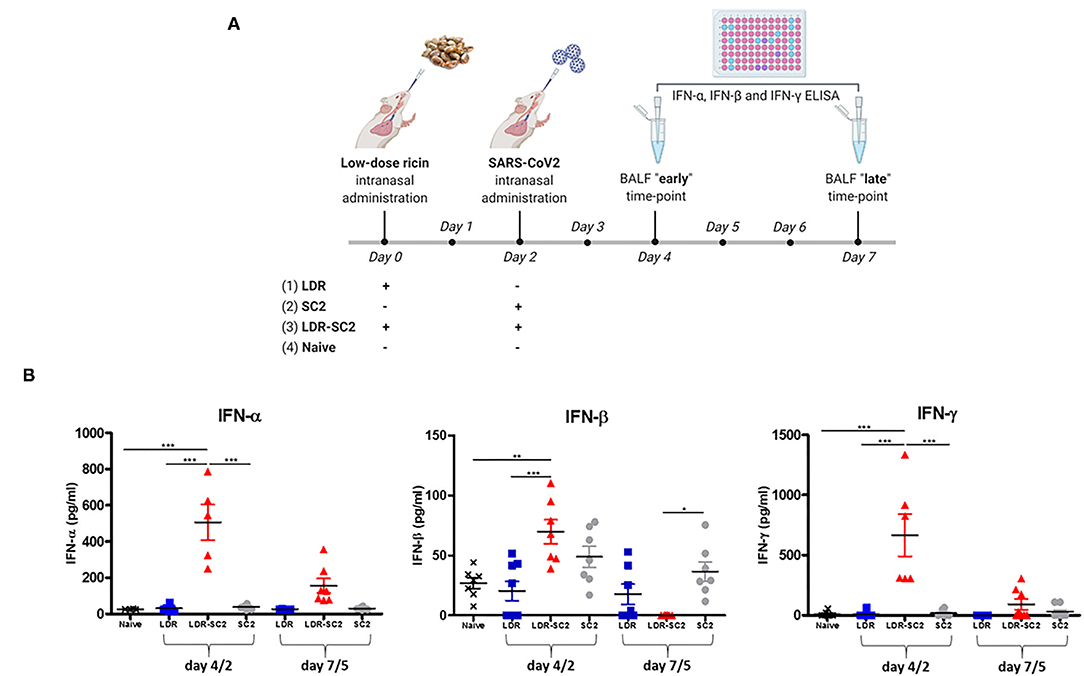
Figure 9. (A) Time-table for treatment and BAL fluid collection for interferon protein quantification in the differently treated mice groups. The scheme was created with BioRender.com. (B) Interferon proteins expression in BAL fluid of mice. Concentration of Interferon- α (IFN-α) or Interferon-β (IFN-β) or Interferon- γ (IFN-γ) in BAL fluid of mice treated intranasally with low dose ricin (R, day 4 or 7 post exposure) or SC2 (S, day 2 or 5 post exposure) or low dose ricin and SC2 (RS, day 4/2 and day 7/5) compared to naïve mice (N). Data presented as mean ± SEM, analyzed using 1-way ANO-VA followed by Bonferroni's posttests. *p < 0.05, **p < 0.01, ***p < 0.001, n = 4–8 per group.
As demonstrated in Figure 9B, at the earlier time-point (4 and 2 days respectively, after low-dose ricin application and/or viral infection, denoted as 4/2) IFN- α and IFN-γ are significantly elevated in mice subjected to the combined treatment with both low-dose ricin and virus (LDR-SC2) as compared to the naïve, LDR and SC2 groups. This observed elevation of IFN- α and IFN-γ proteins in the LDR-SC2 group is however of a transient nature, as expression levels of these proteins almost completely diminished at the later time-point (7 and 5 days, respectively after low-dose ricin application and/or viral infection, denoted as 7/5). IFN-β protein exhibited a similar trend yet its elevation in the LDR-SC2 group at the early time-point was relatively moderate and not significantly different from the LDR and SC2 groups, while at the late time-point IFN-β levels in the LDR-SC2 group were below threshold of detection, and in fact significantly lower than the corresponding values determined in the naïve and SC2 groups. Induction of an interferon response early after exposure to SC2 and its subsequent suppression has been reported recently in COVID-19 critically ill patients (66). Researchers have found that an IFN-I deficiency, manifested by an absence of measureable IFN-β and low IFN-α production and activity, is a hallmark of severe and critical COVID-19 (69, 70). It was reported that type I IFN responses were restricted in postmortem lung tissues from lethal cases of COVID-19 (71), while another study reported that type I IFN responses were highly impaired in the peripheral blood of patients with severe or critical COVID-19, as indicated by low levels of type I IFNs and ISGs, despite increased levels of TNF-α, IL-6 and NFκB -driven inflammatory responses (72). Moreover, it was shown that higher IFN-λ concentrations during ICU entry were associated with lower SC2 viral load in the respiratory tract and faster viral clearance (73).
A recent study which characterized viral proteins of SARS-CoV-2, reported that the viral ORF6, ORF8 and nucleocapsid proteins were potential inhibitors of the type I interferon signaling pathway and mainly of IFN-β (interferon beta). This inhibition may have a crucial negative impact on the host anti-viral response, since treatment with IFN-β was shown to effectively block SC2 replication (74). A finely tuned antiviral response, orchestrated by IFN-λ (type III IFN) and type I IFN (IFN- α, IFN-β) is critical for steering host immunity toward optimal protection and minimal SC2-induced damage (75–77) while an unbalanced anti-viral response can unleash an acute cytokine storm with severely detrimental consequences for human health. SC2 evolves with numerous structural and non-structural proteins that act as antagonists which disturb interferon signaling at various levels by: (1) prevention of pattern recognition receptor (PPR)-dependent recognition of viral RNA, (2) inhibition of type I interferon protein synthesis via abolishment of toll-like receptor-1 (TLR-1) and retinoic acid-inducible gene I (RIG-I) signaling, (3) reduction of STAT-1 signaling and initiation of host mRNA degradation and interruption of host translation machinery (78).
Conclusion
Exposure of mice to SARS-CoV-2 virus over a mildly injured tissue background caused by low-dose ricin amplified the inflammatory response, as manifested by a significant upregulation of pro-inflammatory cytokines and chemokines and massive activation of the interferon reaction. Transcriptomic analyses of this mice lungs identified key components of the host response to SARS-CoV-2 infection, including essential immunity genes and biological pathways involved in the activation of interferon and natural-killer responses, cell death receptors, cytotoxic T-cells, Toll-like receptor signaling and the NLRP3 inflammasome pathway. Though CD-1 mice that were not sensitized with an acute-lung-injury (ALI) stimulant compound such as low-dose ricin are refractive to SARS-CoV-2 infection, their exposure to this virus induced marked changes in their transcriptome, most prominently, upregulation of interferon-stimulated genes, albeit, without leading to clinical morbidity. Most importantly, analyzing the unique DEGs of mice that were treated with low-dose ricin and then subjected to SARS-CoV-2 viral infection, predicted clinical manifestations and inflammatory factors that are consistent with severe COVID-19 in humans. This fact underscores the suitability of this mice model, in which mice are exposed to the virus on a background of pulmonary injury, as an appropriate model of severe COVID-19 disease.
Data Availability Statement
The datasets presented in this study can be found in online repositories. The names of the repository/repositories and accession number(s) can be found in the article.
Ethics Statement
The animal study was approved and conducted according to the guidelines of Animal Care and Use Committee of Israel Institute for Biological Research (protocol code: M-46-20).
Author Contributions
IC-G, CK, and RF designed this study. YE, DS, MA, DG, OI, TS, CK, and RF conducted the experiments. IC-G, AT, IO, and RF analyzed the data. IC-G, AS, IO, CK, and RF prepared the main body of this manuscript. OI, AT, AZ, and TS revised the manuscript. All authors have read and agreed to the published version of the manuscript.
Funding
This study was supported by the Israel Institute for Biological Research.
Conflict of Interest
The authors declare that the research was conducted in the absence of any commercial or financial relationships that could be construed as a potential conflict of interest.
Publisher's Note
All claims expressed in this article are solely those of the authors and do not necessarily represent those of their affiliated organizations, or those of the publisher, the editors and the reviewers. Any product that may be evaluated in this article, or claim that may be made by its manufacturer, is not guaranteed or endorsed by the publisher.
Supplementary Material
The Supplementary Material for this article can be found online at: https://www.frontiersin.org/articles/10.3389/fviro.2022.848465/full#supplementary-material
References
1. Cui J, Li F, Shi Z-L. Origin and evolution of pathogenic coronaviruses. Nat Rev Microbiol. (2019) 17:181–92. doi: 10.1038/s41579-018-0118-9
2. Fung TS, Liu DX. Human coronavirus: host-pathogen interaction. Annu Rev Microbiol. (2019) 73:529–57. doi: 10.1146/annurev-micro-020518-115759
3. Greenberg SB. Update on human rhinovirus and coronavirus infections. Semin Respir Crit Care Med. (2016) 37:555–71. doi: 10.1055/s-0036-1584797
4. Kelley N, Jeltema D, Duan Y, He Y. The NLRP3 inflammasome: an overview of mechanisms of activation and regulation. Int J Mol Sci. (2019) 20:3328. doi: 10.3390/ijms20133328
5. Lazear HM, Schoggins JW, Diamond MS. Shared and distinct functions of type I and type III interferons. Immunity. (2019) 50:907–23. doi: 10.1016/j.immuni.2019.03.025
6. Crayne CB, Albeituni S, Nichols KE, Cron RQ. The immunology of macrophage activation syndrome. Front Immunol. (2019) 10:119. doi: 10.3389/fimmu.2019.00119
7. McGonagle D, Sharif K, O'Regan A, Bridgewood C. The role of cytokines including interleukin-6 in COVID-19 induced pneumonia and macrophage activation syndrome-like disease. Autoimmun Rev. (2020) 19:102537. doi: 10.1016/j.autrev.2020.102537
8. Kim Y-I, Kim S-G, Kim S-M, Kim E-H, Park S-J, Yu K-M, et al. Infection and rapid transmission of SARS-CoV-2 in ferrets. Cell Host Microbe. (2020) 27:704–9.e2. doi: 10.1016/j.chom.2020.03.023
9. Rockx B, Kuiken T, Herfst S, Bestebroer T, Lamers MM, Oude Munnink BB, et al. Comparative pathogenesis of COVID-19, MERS, and SARS in a nonhuman primate model. Science. (2020) 368:1012–5. doi: 10.1126/science.abb7314
10. Yahalom-Ronen Y, Tamir H, Melamed S, Politi B, Shifman O, Achdout H, et al. A single dose of recombinant VSV-Δ G-spike vaccine provides protection against SARS-CoV-2 challenge. Nat Commun. (2020) 11:1–13. doi: 10.1038/s41467-020-20228-7
11. Bao L, Deng W, Huang B, Gao H, Liu J, Ren L, et al. The pathogenicity of SARS-CoV-2 in hACE2 transgenic mice. Nature. (2020) 583:830–3. doi: 10.1038/s41586-020-2312-y
12. Hassan AO, Case JB, Winkler ES, Thackray LB, Kafai NM, Bailey AL, et al. A SARS-CoV-2 infection model in mice demonstrates protection by neutralizing antibodies. Cell. (2020) 182:744–53.e4. doi: 10.1016/j.cell.2020.06.011
13. Winkler ES, Bailey AL, Kafai NM, Nair S, McCune BT, Yu J, et al. SARS-CoV-2 infection of human ACE2-transgenic mice causes severe lung inflammation and impaired function. Nat Immunol. (2020) 21:1327–35. doi: 10.1038/s41590-020-0778-2
14. Falach R, Bar-On Bar-On L, Lazar S, Kadar T, Mazor O, Aftalion M, et al. Mice with induced pulmonary morbidities display severe lung inflammation and mortality following exposure to SARS-CoV-2. JCI Insight. (2021) 6 e145916. doi: 10.1172/jci.insight.145916
15. Gal Y, Mazor O, Alcalay R, Seliger N, Aftalion M, Sapoznikov A, et al. Antibody/doxycycline combined therapy for pulmonary ricinosis: attenuation of inflammation improves survival of ricin-intoxicated mice. Toxicol Rep. (2014) 1:496–504. doi: 10.1016/j.toxrep.2014.07.013
16. Bray NL, Pimentel H, Melsted P, Pachter L. Near-optimal probabilistic RNA-seq quantification. Nat Biotechnol. (2016) 34:525–7. doi: 10.1038/nbt.3519
17. Love MI, Huber W, Anders S. Moderated estimation of fold change and dispersion for RNA-seq data with DESeq2. Genome Biol. (2014) 15:1–21. doi: 10.1186/s13059-014-0550-8
18. Calvano SE, Xiao W, Richards DR, Felciano RM, Baker HV, Cho RJ, et al. A network-based analysis of systemic inflammation in humans. Nature. (2005) 437:1032–7. doi: 10.1038/nature03985
19. Thomas S, Bonchev D. A survey of current software for network analysis in molecular biology. Hum Genomics. (2010) 4:1–8. doi: 10.1186/1479-7364-4-5-353
20. Grandvaux N, Servant MJ, Hiscott J. The interferon antiviral response: from viral invasion to evasion. Curr Opin Infect Dis. (2002) 15:259–67. doi: 10.1097/00001432-200206000-00008
21. Zhu L, Yang P, Zhao Y, Zhuang Z, Wang Z, Song R, et al. Single-cell sequencing of peripheral mononuclear cells reveals distinct immune response landscapes of COVID-19 and influenza patients. Immunity. (2020) 53:685–96.e3. doi: 10.1016/j.immuni.2020.07.009
22. Zhou Z, Ren L, Zhang L, Zhong J, Xiao Y, Jia Z, et al. Heightened innate immune responses in the respiratory tract of COVID-19 patients. Cell Host Microbe. (2020) 27:883–90.e2. doi: 10.1016/j.chom.2020.04.017
23. Hattori N, Sisson TH, Xu Y, Desai TJ, Simon RH. Participation of urokinase-type plasminogen activator receptor in the clearance of fibrin from the lung. Am J Physiol. (1999) 277:L573–9. doi: 10.1152/ajplung.1999.277.3.L573
24. Pardo A, Selman M. Matrix metalloproteases in aberrant fibrotic tissue remodeling. Proc Am Thorac Soc. (2006) 3:383–8. doi: 10.1513/pats.200601-012TK
25. Roe K, Gibot S, Verma S. Triggering receptor expressed on myeloid cells-1 (TREM-1): a new player in antiviral immunity? Front Microbiol. (2014) 5:627. doi: 10.3389/fmicb.2014.00627
26. Ferlazzo G, Morandi B. Cross-talks between natural killer cells and distinct subsets of dendritic cells. Front Immunol. (2014) 5:159. doi: 10.3389/fimmu.2014.00159
27. Lugli E, Marcenaro E, Mavilio D. NK cell subset redistribution during the course of viral infections. Front Immunol. (2014) 5:390. doi: 10.3389/fimmu.2014.00390
28. Muntasell A, Costa-Garcia M, Vera A, Marina-Garcia N, Kirschning CJ, López-Botet M. Priming of NK cell anti-viral effector mechanisms by direct recognition of human cytomegalovirus. Front Immunol. (2013) 4:40. doi: 10.3389/fimmu.2013.00040
29. Giamarellos-Bourboulis EJ, Netea MG, Rovina N, Akinosoglou K, Antoniadou A, Antonakos N, et al. Complex immune dysregulation in COVID-19 patients with severe respiratory failure. Cell Host Microbe. (2020) 27:992–1000.e3. doi: 10.1016/j.chom.2020.04.009
30. Wen W, Su W, Tang H, Le W, Zhang X, Zheng Y, et al. Immune cell profiling of COVID-19 patients in the recovery stage by single-cell sequencing. Cell Discov. (2020) 6:1–18. doi: 10.1038/s41421-020-00187-5
31. Zheng M, Gao Y, Wang G, Song G, Liu S, Sun D, et al. Functional exhaustion of antiviral lymphocytes in COVID-19 patients. Cell Mol Immunol. (2020) 17:533–5. doi: 10.1038/s41423-020-0402-2
32. Ren Y, Shu T, Wu D, Mu J, Wang C, Huang M, et al. The ORF3a protein of SARS-CoV-2 induces apoptosis in cells. Cell Mol Immunol. (2020) 17:881–3. doi: 10.1038/s41423-020-0485-9
33. Donia A, Bokhari H. Apoptosis induced by SARS-CoV-2: can we target it? Apoptosis. (2021) 26:7–8. doi: 10.1007/s10495-021-01656-2
34. Giovannoni F, Li Z, Garcia CC, Quintana FJ. A potential role for AHR in SARS-CoV-2 pathology. Research Sq. (2020). doi: 10.21203/rs.3.rs-25639/v1
35. Giovannoni F, Bosch I, Polonio CM, Torti MF, Wheeler MA, Li Z, et al. AHR is a Zika virus host factor and a candidate target for antiviral therapy. Nat Neurosci. (2020) 23:939–51. doi: 10.1038/s41593-020-0664-0
36. Gutiérrez-Vázquez C, Quintana FJ. Regulation of the immune response by the aryl hydrocarbon receptor. Immunity. (2018) 48:19–33. doi: 10.1016/j.immuni.2017.12.012
37. Rothhammer V, Mascanfroni ID, Bunse L, Takenaka MC, Kenison JE, Mayo L, et al. Type I interferons and microbial metabolites of tryptophan modulate astrocyte activity and central nervous system inflammation via the aryl hydrocarbon receptor. Nat Med. (2016) 22:586–97. doi: 10.1038/nm.4106
38. Giovannoni F, Quintana FJ. SARS-CoV-2-induced lung pathology: AHR as a candidate therapeutic target. Cell Res. (2021) 31:1–2. doi: 10.1038/s41422-020-00447-9
39. Bai D, Fang L, Xia S, Ke W, Wang J, Wu X, et al. Porcine deltacoronavirus (PDCoV) modulates calcium influx to favor viral replication. Virology. (2020) 539:38–48. doi: 10.1016/j.virol.2019.10.011
40. Doñate-Macián P, Jungfleisch J, Pérez-Vilaró G, Rubio-Moscardo F, Perálvarez-Marín A, Diez J, et al. The TRPV4 channel links calcium influx to DDX3X activity and viral infectivity. Nat Commun. (2018) 9:1–13. doi: 10.1038/s41467-018-04776-7
41. Scherbik SV, Brinton MA. Virus-induced Ca2+ influx extends survival of west nile virus-infected cells. J Virol. (2010) 84:8721–31. doi: 10.1128/JVI.00144-10
42. Ueda M, Daidoji T, Du A, Yang C-S, Ibrahim MS, Ikuta K, et al. Highly pathogenic H5N1 avian influenza virus induces extracellular Ca2+ influx, leading to apoptosis in avian cells. J Virol. (2010) 84:3068–78. doi: 10.1128/JVI.01923-09
43. Zhou Y, Frey TK, Yang JJ. Viral calciomics: interplays between Ca2+ and virus. Cell Calcium. (2009) 46:1–17. doi: 10.1016/j.ceca.2009.05.005
44. Zhou Y, Xue S, Yang JJ. Calcium and Viruses. In: Kretsinger RH, Uversky VN, Permyakov EA, editors. Encyclopedia of Metalloproteins. New York, NY: Springer New York (2013).
45. Hyser JM, Estes MK. Pathophysiological consequences of calcium-conducting viroporins. Annu Rev Virol. (2015) 2:473–96. doi: 10.1146/annurev-virology-100114-054846
46. Di Filippo L, Formenti AM, Rovere-Querini P, Carlucci M, Conte C, Ciceri F, et al. Hypocalcemia is highly prevalent and predicts hospitalization in patients with COVID-19. Endocrine. (2020) 68:475–8. doi: 10.1007/s12020-020-02383-5
47. Liu J, Han P, Wu J, Gong J, Tian D. Prevalence and predictive value of hypocalcemia in severe COVID-19 patients. J Infect Public Health. (2020) 13:1224–8. doi: 10.1016/j.jiph.2020.05.029
48. Wu Y, Hou B, Liu J, Chen Y, Zhong P. Risk factors associated with long-term hospitalization in patients with COVID-19: a single-centered, retrospective study. Front Med. (2020) 7:315. doi: 10.3389/fmed.2020.00315
49. Westmeier J, Paniskaki K, Karaköse Z, Werner T, Sutter K, Dolff S, et al. Impaired cytotoxic CD8+ T cell response in elderly COVID-19 patients. MBio. (2020) 11:e02243–20. doi: 10.1128/mBio.02243-20
50. Wong C, Lam C, Wu A, Ip W, Lee N, Chan I, et al. Plasma inflammatory cytokines and chemokines in severe acute respiratory syndrome. Clin Exp Immunol. (2004) 136:95–103. doi: 10.1111/j.1365-2249.2004.02415.x
51. Guan W, Ni Z, Hu Y, Liang W, Ou C, He J, et al. Clinical characteristics of coronavirus disease 2019 in China, New Eng J Med. (2020). doi: 10.1056/NEJMoa2002032
52. Wang D, Hu B, Hu C, Zhu F, Liu X, Zhang J, et al. Clinical characteristics of 138 hospitalized patients with 2019 novel coronavirus–infected pneumonia in Wuhan, China. JAMA. (2020) 323:1061–9. doi: 10.1001/jama.2020.1585
53. Wu JT, Leung K, Leung GM. Nowcasting and forecasting the potential domestic and international spread of the 2019-nCoV outbreak originating in Wuhan, China: a modelling study. Lancet. (2020) 395:689–97. doi: 10.1016/S0140-6736(20)30260-9
54. Xiao K, Zhai J, Feng Y, Zhou N, Zhang X, Zou J-J, et al. Isolation of SARS-CoV-2-related coronavirus from Malayan pangolins. Nature. (2020) 583:286–9. doi: 10.1038/s41586-020-2313-x
55. Ruan Q, Yang K, Wang W, Jiang L, Song J. Clinical predictors of mortality due to COVID-19 based on an analysis of data of 150 patients from Wuhan, China. Intensive Care Med. (2020) 46:846–8. doi: 10.1007/s00134-020-05991-x
56. Wu Z, McGoogan JM. Characteristics of and important lessons from the coronavirus disease 2019 (COVID-19) outbreak in China: summary of a report of 72 314 cases from the Chinese Center for Disease Control and Prevention. JAMA. (2020) 323:1239–42. doi: 10.1001/jama.2020.2648
57. Bayati A, Kumar R, Francis V, McPherson PS. SARS-CoV-2 infects cells after viral entry via clathrin-mediated endocytosis. J Biol Chem. (2021) 296:100306. doi: 10.1016/j.jbc.2021.100306
58. Broz P, Dixit VM. Inflammasomes: mechanism of assembly, regulation and signalling. Nat Rev Immunol. (2016) 16:407–20. doi: 10.1038/nri.2016.58
59. Rodrigues TS, de Sá KS, Ishimoto AY, Becerra A, Oliveira S, Almeida L, et al. Inflammasomes are activated in response to SARS-CoV-2 infection and are associated with COVID-19 severity in patients. J Exp Med. (2021) 218:e20201707. doi: 10.1084/jem.20201707
60. Chen R, Lan Z, Ye J, Pang L, Liu Y, Wu W, et al. Cytokine storm: the primary determinant for the pathophysiological evolution of COVID-19 deterioration. Front Immunol. (2021) 12:1409. doi: 10.3389/fimmu.2021.589095
61. Hojyo S, Uchida M, Tanaka K, Hasebe R, Tanaka Y, Murakami M, et al. How COVID-19 induces cytokine storm with high mortality. Inflamm Regen. (2020) 40:1–7. doi: 10.1186/s41232-020-00146-3
62. Song P, Li W, Xie J, Hou Y, You C. Cytokine storm induced by SARS-CoV-2. Clinica Chimica Acta. (2020) 509:280–7. doi: 10.1016/j.cca.2020.06.017
63. Cameron MJ, Bermejo-Martin JF, Danesh A, Muller MP, Kelvin DJ. Human immunopathogenesis of severe acute respiratory syndrome (SARS). Virus Res. (2008) 133:13–9. doi: 10.1016/j.virusres.2007.02.014
64. Channappanavar R, Perlman S. Pathogenic human coronavirus infections: causes and consequences of cytokine storm and immunopathology. Semin Immunopathol. (2017) 39:529–39. doi: 10.1007/s00281-017-0629-x
65. Huang C, Wang Y, Li X, Ren L, Zhao J, Hu Y, et al. Clinical features of patients infected with 2019 novel coronavirus in Wuhan, China. Lancet. (2020) 395:497–506. doi: 10.1016/S0140-6736(20)30183-5
66. Williams AE, Chambers RC. The mercurial nature of neutrophils: still an enigma in ARDS? Am J Physiol Lung Cell Mol Physiol. (2014) 306:L217–30. doi: 10.1152/ajplung.00311.2013
67. Kudlak K, DeMuro JP, Hanna AF, Brem H. Acute lung injury following the use of granulocyte-macrophage colony-stimulating factor. Int J Crit Illn Inj Sci. (2013) 3:279. doi: 10.4103/2229-5151.124168
68. Bock D, Aydt EM, Kuebler WM, Wolff G. The role of selectins during lung inflammation and their potential impact for innovative therapeutic strategies. Curr Respir Med Rev. (2006) 2:339–54. doi: 10.2174/157339806778018953
69. Hadjadj J, Yatim N, Barnabei L, Corneau A, Boussier J, Smith N, et al. Impaired type I interferon activity and inflammatory responses in severe COVID-19 patients. Science. (2020) 369:718–24. doi: 10.1126/science.abc6027
70. Trouillet-Assant S, Viel S, Gaymard A, Pons S, Richard J-C, Perret M, et al. Type I IFN immunoprofiling in COVID-19 patients. J Allergy Clin Immunol. (2020) 146:206–8.e2. doi: 10.1016/j.jaci.2020.04.029
71. Blanco-Melo D, Nilsson-Payant BE, Liu W-C, Uhl S, Hoagland D, Møller R, et al. Imbalanced host response to SARS-CoV-2 drives development of COVID-19. Cell. (2020) 181:1036–45.e9. doi: 10.1016/j.cell.2020.04.026
72. Kim Y-M, Shin E-C. Type I and III interferon responses in SARS-CoV-2 infection. Exp Mol Med. (2021) 53:750–60. doi: 10.1038/s12276-021-00592-0
73. Galani I-E, Rovina N, Lampropoulou V, Triantafyllia V, Manioudaki M, Pavlos E, et al. Untuned antiviral immunity in COVID-19 revealed by temporal type I/III interferon patterns and flu comparison. Nat Immunol. (2021) 22:32–40. doi: 10.1038/s41590-020-00840-x
74. Li J-Y, Liao C-H, Wang Q, Tan Y-J, Luo R, Qiu Y, et al. The ORF6, ORF8 and nucleocapsid proteins of SARS-CoV-2 inhibit type I interferon signaling pathway. Virus Res. (2020) 286:198074. doi: 10.1016/j.virusres.2020.198074
75. Andreakos E, Zanoni I, Galani IE. Lambda interferons come to light: dual function cytokines mediating antiviral immunity and damage control. Curr Opin Immunol. (2019) 56:67–75. doi: 10.1016/j.coi.2018.10.007
76. Davidson S, Crotta S, McCabe TM, Wack A. Pathogenic potential of interferon αβ in acute influenza infection. Nat Commun. (2014) 5:1–15. doi: 10.1038/ncomms4864
77. Galani IE, Triantafyllia V, Eleminiadou E-E, Koltsida O, Stavropoulos A, Manioudaki M, et al. Interferon-λ mediates non-redundant front-line antiviral protection against influenza virus infection without compromising host fitness. Immunity. (2017) 46:875–90.e6. doi: 10.1016/j.immuni.2017.04.025
Keywords: SARS-CoV-2, ricin, interferon, cytokines, differentially expressed genes
Citation: Cohen-Gihon I, Israeli O, Tidhar A, Sapoznikov A, Evgy Y, Stein D, Aftalion M, Gur D, Orr I, Zvi A, Sabo T, Kronman C and Falach R (2022) Transcriptome Analysis of Lungs in a Mouse Model of Severe COVID-19. Front. Virol. 2:848465. doi: 10.3389/fviro.2022.848465
Received: 04 January 2022; Accepted: 23 February 2022;
Published: 21 March 2022.
Edited by:
Jesus Rodriguez-Diaz, University of Valencia, SpainReviewed by:
Marta L. De Diego, Spanish National Research Council (CSIC), SpainJuan C. De La Torre, The Scripps Research Institute, United States
Copyright © 2022 Cohen-Gihon, Israeli, Tidhar, Sapoznikov, Evgy, Stein, Aftalion, Gur, Orr, Zvi, Sabo, Kronman and Falach. This is an open-access article distributed under the terms of the Creative Commons Attribution License (CC BY). The use, distribution or reproduction in other forums is permitted, provided the original author(s) and the copyright owner(s) are credited and that the original publication in this journal is cited, in accordance with accepted academic practice. No use, distribution or reproduction is permitted which does not comply with these terms.
*Correspondence: Reut Falach, cmV1dGZAaWlici5nb3YuaWw=