 Mahan Ghafari
 Qihan Liu
 Arushi Dhillon
 Aris Katzourakis1*
- 1Department of Biology, University of Oxford, Oxford, United Kingdom
- 2Department of Physics, Emory University, Atlanta, GA, United States
A Corrigendum on
Investigating the evolutionary origins of the first three SARS-CoV-2 variants of concern
by Ghafari M, Liu Q, Dhillon A, Katzourakis A and Weissman DB (2022) Front. Virol. 2:942555. doi: 10.3389/fviro.2022.942555
In the published article, there was an error in the legend of Figure 3B. as published. The words "1.2% and 3.8%" should be "9.1% and 2.9%" respectively.
The corrected legend appears below.
"FIGURE 3 Evolution between hosts on a single-mutation landscape (K = 1) rarely reproduces the observed VOC dynamics, even with extreme overdispersion. (A) Total number of established VOC lineages (M) measured under varied levels of overdispersion, k, such that IFR=1.5%, μ=0.87x10⁻⁵, K=1, and s=0.4. The inset shows M with respect to the waiting time for the establishment of the first VOC lineage since the start of the pandemic, T0. The region corresponding to the waiting time for the emergence of the first three SARS-CoV-2 VOC is highlighted in red. Under low levels of overdispersion (blue, k=0.2), too many VOC lineages are produced very early on in the pandemic. On the other hand, as we increase overdispersion (orange and green), fewer VOCs can establish in the population. It also takes them much longer to establish and reach high frequencies in the population. (B) Evaluating the temporal clustering of the first three VOC lineages. For each simulation run, represented by a point on the graph, we measure T0 and the time difference between the establishment of the first and third successful VOC lineages. The red dashed rectangle shows the region corresponding to the emergence of the first three SARS-CoV-2 VOCs with the cross sign (“X”) representing the mean value. We see that as the level of overdispersion increases, the emergence time of VOCs are more scattered and rarely exhibit temporal clustering in late 2020 – Only 9.1% and 2.9% of the evolutionary dynamics corresponding to overdispersion k=0.005 and k=0.001 fall inside the enclosed area, respectively. The inset shows that 33.2% and 79.2% of the runs for k=0.005 and k=0.001 scenarios produce fewer than three successful VOC lineages by the end of the simulation period. Each run stops once the frequency of the VOC population reaches 75%. See also Supplementary Figure 1."
In the published article, there was an error in the legend of Figure 5A. as published. The words "K=4 (magenta)" should be "K=5 (magenta)".
The corrected legend appears below.
"FIGURE 5 Between-host evolution on an additive fitness landscape can match the observed VOC dynamics, but only by having intermediate mutants reach unrealistically high frequencies. (A) Total number of established VOC lineages (M) for different number of mutations, K, involved in the production of a VOC. For the K=2 scenario (blue), IFR=1.5%, μ=0.87x10⁻⁵, k=0.05, and s=0.3. For the K=3 scenario (orange), IFR=0.5%, μ=0.87x10⁻⁵, k=0.05, and s=0.5. For both the K=4 (green) and K=5 (magenta) scenarios, IFR=0.2%, μ=2x10⁻⁵, k=0.2, and s=1.0. The inset shows M with respect to the waiting time for the establishment of the first VOC lineage since the start of the pandemic, T0. Under K=2 and 3, a very large number of successful VOC lineages are produced by late 2020, with the K=2 scenario producing, on average, more than 20 VOC lineages that establish in the population. On the other hand, for the K=5 scenario, on average, fewer than three lineages are produced. It also takes much longer for them to establish in the population. (B) Evaluating the temporal clustering of the first three VOC lineages. For each simulation run, represented by a point on the graph, we measure the time that it takes for a single adaptive mutation to establish in the population and the time difference between the establishment of the first and third successful VOC lineage. The red dashed rectangle shows the region of the parameter space corresponding to the emergence of the first three SARS-CoV-2 VOCs with the cross sign (“X”) representing the mean value. We see a noticeable overlap between the K=2 and 4 scenarios and the red rectangle suggesting that a larger fraction of the simulation runs exhibit temporal clustering dynamics for VOC emergence. The inset shows that 10.3% of the runs for the K=4 scenario produce fewer than three successful VOC lineages by the end of the simulation period. Each run stops once the frequency of the VOC population reaches 75%. (C) A typical evolutionary trajectory corresponding to the K=4 scenario highlighted with a bold green circle in panel (B). The graph shows the background population in gray and the i-mutant populations (1<i≤K) in different shades of green from light (fewer mutations) to dark (more mutations). Note that for the K=4 scenario, there are four single-mutant, six double-mutant, four triple-mutant, and one quadruple-mutant genotypes. The dashed lines show the dynamics of all the established VOC lineages over time. Red vertical arrows show the establishment time of the first three VOCs. We can see that some of the intermediate mutant genotypes reach close to fixation before giving rise to the VOC population. See also Supplementary Figure 3."
In the published article, there was an error with Figure 8A. The incorrect figure was used. A correction has been made to the section Figure 8A and the correct figure can be seen below.
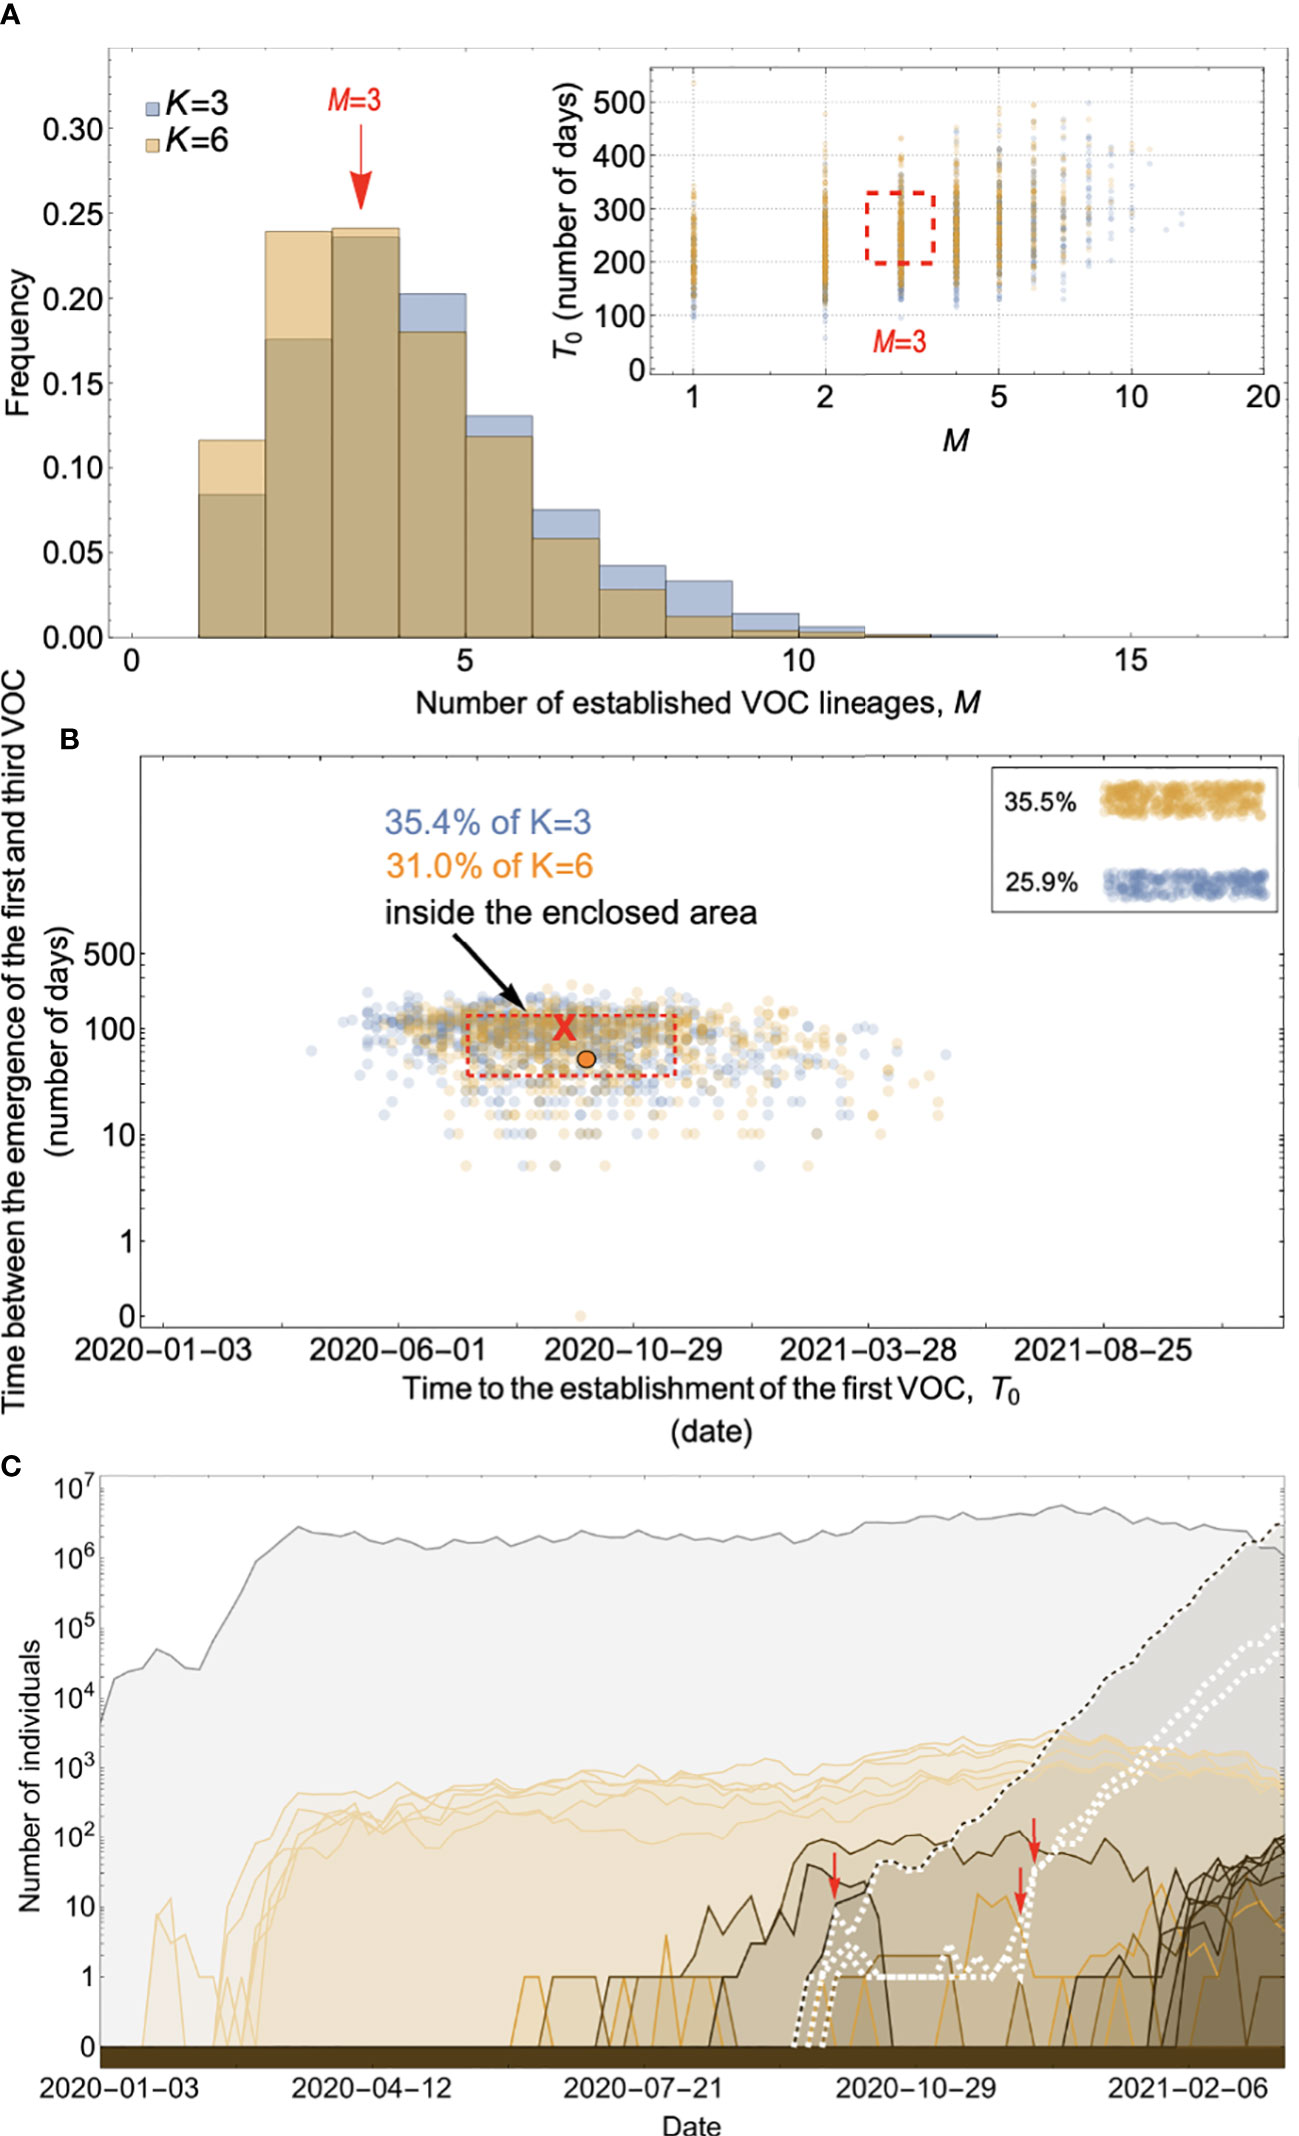
Figure 8 Within-host evolution on a fitness plateau can match the observed VOC dynamics for a large range of plateau widths. (A) Total number of established VOC lineages (M for different number of mutations, K, involved in the production of a VOC. For K=3 (blue), the within-host parameters are Pf=2x10⁻⁸, and μC=0.1. For K=6 (orange), Pf=4.5x10⁻⁸, and μC=0.25. In both scenarios, the between-host parameters μ=1x10⁻⁵, IFR=0.5%, k=0.1, and s=0.7 are the same. The inset shows M with respect to the waiting time for the establishment of the first VOC lineage since the start of the pandemic, T0. The region corresponding to the waiting time for the emergence of the first three SARS-CoV-2 VOC is highlighted in red. Both scenarios produce roughly the same of number of VOC lineages. However, on average, T0 is slightly longer for the K=6 scenario. (B) Evaluating the temporal clustering of the first three VOC lineages. For each simulation run, represented by a point on the graph, we measure the time that it takes for a single adaptive mutation to establish in the population and the time difference between the establishment of the first and third successful VOC lineage. The red dashed rectangle shows the region of the parameter space corresponding to the emergence of the first three SARS-CoV-2 VOCs with the cross sign (“X”) representing the mean value. We can see that a noticeable fraction of simulation runs for both scenarios yield a temporal clustering that matches the emergence of the first three VOCs in late 2020 (i.e., they fall inside the enclosed area). The inset shows that 35.5% and 25.9% of the runs for K=3 and 6 scenarios produce fewer than three successful VOC lineages by the end of the simulation period, respectively. Each run stops once the frequency of the VOC population reaches 75%. (C) A typical evolutionary trajectory corresponding to the K=6 scenario highlighted with a bold orange circle in panel (B). The graph shows the background population in gray and the i-mutant populations (1<i≤K) in different shades of orange from light (fewer mutations) to dark (more mutations). The dashed lines show the dynamics of all the established VOC lineages over time. Red vertical arrows show the establishment time of the first three VOCs. We can see that the single-mutant genotypes (lines in light orange) are produced via the between-host pathway from very early on in the pandemic but are at very low prevalence before the emergence of the VOCs (white dashed lines). See also Supplementary Figure 6.
The authors apologize for this error and state that this does not change the scientific conclusions of the article in any way. The original article has been updated.
Publisher’s note
All claims expressed in this article are solely those of the authors and do not necessarily represent those of their affiliated organizations, or those of the publisher, the editors and the reviewers. Any product that may be evaluated in this article, or claim that may be made by its manufacturer, is not guaranteed or endorsed by the publisher.
Keywords: SARS – CoV – 2, evolution, fitness landscape, mutation, variants of concern (VOCs), chronic infection
Citation: Ghafari M, Liu Q, Dhillon A, Katzourakis A and Weissman DB (2022) Corrigendum: Investigating the evolutionary origins of the first three SARS-CoV-2 variants of concern. Front. Virol. 2:1047852. doi: 10.3389/fviro.2022.1047852
Received: 18 September 2022; Accepted: 26 September 2022;
Published: 07 October 2022.
Edited and Reviewed by:
Anne Kupczok, Wageningen University and Research, NetherlandsCopyright © 2022 Ghafari, Liu, Dhillon, Katzourakis and Weissman. This is an open-access article distributed under the terms of the Creative Commons Attribution License (CC BY). The use, distribution or reproduction in other forums is permitted, provided the original author(s) and the copyright owner(s) are credited and that the original publication in this journal is cited, in accordance with accepted academic practice. No use, distribution or reproduction is permitted which does not comply with these terms.
*Correspondence: Daniel B. Weissman, ZGFuaWVsLndlaXNzbWFuQGVtb3J5LmVkdQ==; Aris Katzourakis, YXJpcy5rYXR6b3VyYWtpc0BiaW9sb2d5Lm94LmFjLnVr