 Simon Bourassi1*
 Shawn McKenna1Greg Keefe1Emily John1
 John VanLeeuwen1
 Emilia Bourassi2
 J. Trenton McClure1
- 1Department of Health Management, Atlantic Veterinary College, University of Prince Edward Island, Charlottetown, PE, Canada
- 2Department of Companion Animals, Atlantic Veterinary College, University of Prince Edward Island, Charlottetown, PE, Canada
Introduction: Bovine Leukemia Virus (BLV) prevalence remains high in dairy cattle in North America. Quantifying the proviral load (PVL) in BLV-positive cows can be used to control this disease in herds where BLV is prevalent by focusing culling of high PVL animals to reduce the risk of transmission. The impact of high BLV PVL on dairy cows’ performance is not well established. The objective of this study was to assess the effect of high PVL status on milk production, occurrence of subclinical ketosis or mastitis, or fertility in BLV-infected cows.
Methods: Twenty-five herds from the three Maritime provinces in Atlantic Canada were enrolled in this study. BLV infected cows were first identified by individual milk or serum testing. A validated quantitative qPCR was used to quantify the PVL in cows with positive BLV antibody results. Parity, 305-day milk production, annual geometric average somatic cell count, fat-to-protein ratio in milk on the first test post-calving, days in milk at first service, and calving-to-conception interval were collected from DairyComp305 software. Two-level mixed multivariable regression models were used to assess the relationship between BLV PVL and milk production, subclinical mastitis and ketosis and reproduction performance.
Results: High PVL was strongly associated with reduced milk production (387 kg and 431 kg) and reproduction performance (calving-to-conception interval lengthened by 50 days and 49 days), and higher odds of subclinical mastitis (Odds ratio = 2.38 and 2.48), when compared to BLVpositive cows with a low PVL and BLV-negative cows, respectively.
Conclusion: These results support implementing a control program to prioritize culling high PVL cows.
Introduction
Bovine Leukemia Virus (BLV) is a lymphotropic deltaretrovirus responsible for Enzootic Bovine Leukosis (1, 2). It integrates primarily into B lymphocytes, where it creates a provirus, causing a lifelong persistent infection (3). Most BLV-infected cows appear clinically asymptomatic while 30% develop a persistent lymphocytosis and less than 5% develop B-cell lymphoma (4, 5).
Although eradicated in most countries in Europe, BLV prevalence in dairy cattle in North America and other parts of the world remains high, with prevalences in North America averaging 90 and 40% for herd-level and within-herd prevalences, respectively (6). Given that there is no treatment for this disease, and there is no commercially available and validated vaccine, preventing transmission is paramount to controlling the spread of the virus (7, 8). The high prevalence warrants new management strategies to control this disease, as detecting and culling all BLV-infected cattle is not economically feasible (9). Recent research has focused on proviral load (PVL). Proviral load is the number of copies of viral genome integrated into the host genome in B-lymphocytes and is measured using quantitative PCR (10, 11). It appears that cows with low PVL are unlikely to be a source of infection for BLV-negative cows, which means that culling only cows with high PVL could be a reasonable control strategy in herds with high BLV prevalence (9, 12). This strategy is corroborated by a recent study showing that transmission rates in BLV-infected cows with persistent lymphocytosis, which has been shown to correlate with high proviral loads, are approximately 70 times higher than in aleukemic BLV infected cows (13).
There is controversy concerning the impact that BLV has in the dairy industry, with some studies demonstrating negative effects of BLV on production, longevity and other parameters, while others could not find a significant association (14–16). It has been found that BLV infection can lead to significant economic losses through reduction in milk production, fertility, and lifespan, impairment of the immune system, as well as negative impacts on international trade and carcass condemnation (17–20). The overall annual economic loss in the dairy industry in the United States was estimated to be around $285 million for producers and $525 million for the entire industry (21). A recent study in Canada showed an estimated loss of herd-based partial net revenue of $92, 587 per year in a herd of 146 animals (18).
Although reasons for these inconsistent findings on productivity and economic impact are probably multifactorial, differences in the prevalence of cows with a high proviral load could contribute to these discrepancies. There are only a few studies looking at the role of BLV PVL in production losses, with a recent study showing a negative impact on milk production (22).
No study has looked at both milk production and reproduction parameters, as well as subclinical diseases on a same population. If negative associations between cows with a high BLV PVL are found with milk and other production measures compared to cows that are BLV positive but with a low PVL, this could be an additional incentive for producers to measure PVL to determine which BLV-positive cows to cull, in herds with high prevalence.
The objective of this study was to evaluate if there is an association between BLV PVL status (high vs. low) and milk production, fertility, and occurrence of subclinical mastitis and subclinical ketosis.
Materials and methods
Study design
This was a cross-sectional study.
Herd selection
Dairy producers from the three Canadian Maritime provinces (New Brunswick, Nova Scotia and Prince Edward Island) volunteered to enroll their herds in this study. Due to research budget constraints, enrollment was limited to 30 herds. Inclusion criteria included the following: (1) willingness to participate during the entire study period; (2) herd registered in Dairy Herd Improvement (DHI) monthly milk quality monitoring; and (3) implementation of good management practices to prevent transmission of BLV, including use of one single-use needle per animal, one rectal sleeve per animal and a farm method of fly control. Enrolled herds consented for the Maritime Quality Milk (MQM) laboratory to use milk collected for routine milk testing by DHI technicians, as well as collection of blood samples via venipuncture by their herd veterinarian. They also consented to provide researchers access to their herd and individual cows records through DairyComp305 software (DC305) (Valley Agricultural Software, Tulare, California, USA) during the study period. This study was approved by the Animal Care and Use Committee of the University of Prince Edward Island (File #6008434).
Sampling and laboratory analysis
All sampling and testing were performed between February and March 2021 in two stages.
Stage 1: Anti-BLV antibody ELISA testing
Approximately 30 mL of milk were collected in standard milk sample cups from each lactating cow and transferred from the DHI laboratory to the MQM laboratory. Samples were collected by the DHI technician, preserved with one BROTAB milk preservative tablet (Sierra Court, CA, USA), and transported in a cooler at 4°C. These samples were also kept at 4°C at the DHI milk testing laboratory until transfer to the MQM laboratory where they were also refrigerated until ELISA testing for BLV antibodies was performed, typically within one week from the time of collection.
Blood samples from dry cows and pregnant heifers were collected by herd veterinarians, transported on ice, and separated into serum by spinning at 3000 g for 15 min. The serum was frozen and stored at −20°C until analysis at the MQM laboratory.
An antibody ELISA test (Bovicheck BLV ELISA kit TRM-506, Biovet inc., St Hyacinthe, QC, Canada) for anti-gp51 antibodies to BLV was performed on serum and milk samples following the manufacturer’s instructions. Individuals were classified as BLV-positive (BLV+), BLV-negative (BLV−) or BLV-suspect according to the manufacturer’s cutoffs (inhibition percentage > 30% and > 45% for milk and serum, respectively, for BLV+, < 20% and < 35% for milk and serum, respectively, for BLV−; with values in between considered BLV-suspect). All BLV-suspects were retested with the ELISA test on serum 4 weeks after the first testing. All BLV-suspect animals were BLV-positive when retested.
Stage 2: qPCR BLV PVL quantification
Whole blood was collected in an EDTA vacutainer from all BLV+ cattle by the herd veterinarian and shipped to the MQM laboratory. DNA was extracted using the Qiagen DNEasy blood and tissue kit (Qiagen Inc. Montreal, Quebec, Canada), as described in a previous study (23). Briefly, 219 μL of buffer AL (lysis buffer) and 40 μL of proteinase K were added to 0.2 mL of serum in a 1.5 mL Eppendorf tube and pulse vortexed 10 times. After incubation of the tubes at 56°C for 15 min, 219 μL of pure ethanol was added to each tube and pulse vortexed 10 times before being centrifuged at 8000 g for 5 min. The collection tubes were replaced and 0.5 mL of solution AW1 (washer buffer) was added to each tube and centrifuged again at 8000 g for 5 min. The same process was repeated with 0.5 mL of solution AW2 (washer buffer) with a centrifugation at 16300 g for 10 min. The spin columns were then moved to new 1.5 mL Eppendorf tubes. Forty μL of solution AE (elution buffer) was added to each membrane and centrifuged at 8000 g for one minute. Extracted DNA concentration was determined using the NanoDrop™ 2000 Spectrophotometer (ThermoFisher Scientific™, Mississauga, Ontario) to ensure that the concentration was consistently >30 ng/μL. The samples were kept at −80°C until qPCR analysis.
BLV proviral load (PVL) was quantified for the extracted DNA samples using the BLV SS1 qPCR assay (CentralStar Cooperative Inc., East Lansing, MI), as described previously (23, 24). This assay is a multiplex probe-based quantitative PCR targeting the BLV polymerase and the bovine ß-Actin genes and containing a spike-in control to allow quantification of PVL. PCR components were 3 μL of DNA sample, 7.25 μL nuclease-free water, 12.5 μL 2XPrimeTime gene Expression Master Mix, 1.25 μL of 20X Primer Master Mix (BLV SS1 primer), and 1 μL of spike-in positive amplification control. All qPCR was performed on CFX96 BioRad touch Real-time PCR System (BioRad, Mississauga, Ontario) under the following conditions: 95°C for 3 min, 40 cycles of 95°C for 15 s and 60°C for 1 min, before a final 1 min at 60°C. Copy numbers of BLV and ß-Actin were calculated using standard curves. Proviral load was estimated by first dividing the copies of Bos actin by 2 (each cell with a nucleus contains 2 copies of the gene) to estimate the number of white blood cell (WBC) genomes amplified and then the number of BLV copies was divided by the estimated number of WBCs.
Data collection
Herd level variables
Herd-level variables were retrieved from a questionnaire given to producers and included housing type (free-stall, tie-stall, other), herd size, herd predominant breed(s) and type of milking system (milk line, parlor, or robot).
Cow level variables
The cow-level variables retrieved from DC305 were as follow: (1) Parity at the time of testing, modeled as a categorical variable of 4 levels (1, 2, 3 and ≥ 4); (2) 305-day milk production (305D - MP), fat yield (305D-fat) and protein yield (305D-protein); (3) Somatic cell count (SCC): the annual geometric average of SCC was used in this statistical analysis, with a cutoff of ≥250,000 cells/mL indicating subclinical mastitis (25); (4) fat-to-protein ratio (FPR) in milk on the first test post-calving, with a cutoff of ≥1.5 used to indicate subclinical ketosis (26); and (5) variables reflecting reproduction performance: number of days in milk at first service (DIM-FS) and calving-to-conception interval (days open) (CCI). Cows that remained open for the lactation were removed from the analysis.
Only cows with complete data available for a period of at least one year post-testing were included in the data analysis.
Statistical analysis
Hierarchical structure diagram and causal diagram
A simplified 2-level hierarchical causal diagram was constructed to illustrate the hypothesized relationships between the explanatory and outcome variables. The explanatory variable of interest was PVL status. We had one potential confounder which was parity (Figure 1).
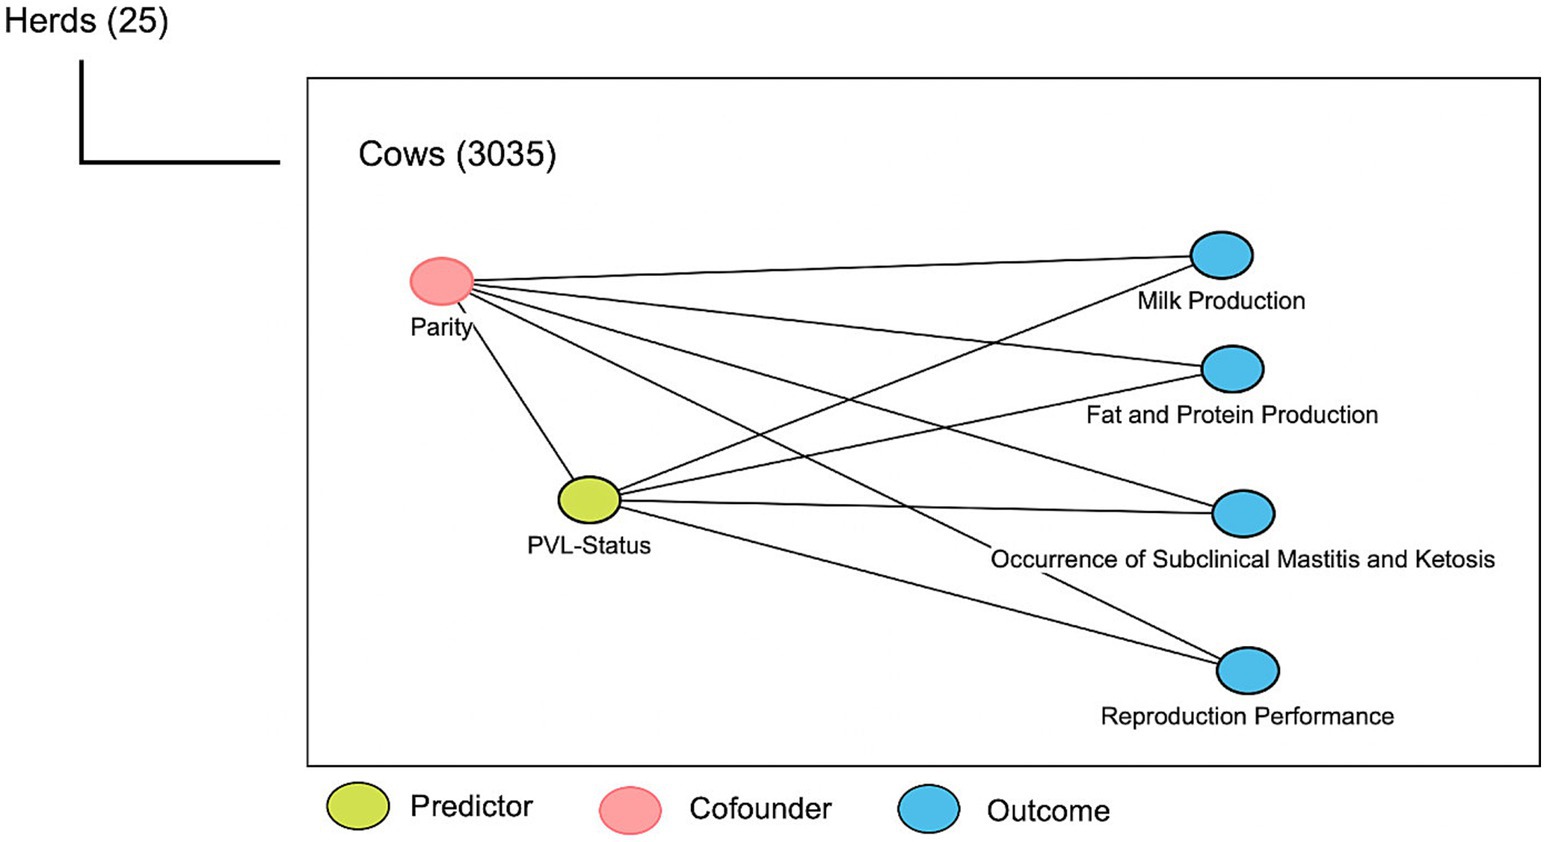
Figure 1. Causal diagram for the effect of proviral load (PVL) on production and reproduction parameters, as well as occurrence of subclinical diseases in 25 dairy herds. Two-level hierarchy affects the outcomes of interest.
Association between PVL and cow production, reproduction performance or occurrence of subclinical diseases
Given the hierarchical structure of the collected data with cow nested in herd (Figure 1), a two-level linear mixed-effect regression model was used for continuous response variables to estimate the association between cow production indices (305D - MP, 305D-fat, 305D-protein, DIM-FS, and CCI) as outcomes of interest (continuous variables) and PVL as a main predictor.
PVL was categorized as a binary variable, as either high (≥1 copy /WBC) or low (<1 copy/WBC). This PVL cutoff value was being used in a voluntary BLV control program in the Canadian Maritime provinces and has also been shown to be the best PVL cutoff to correlate with lymphocytosis in our population (23). The population of interest was high PVL and the reference population was low PVL. Similarly, a two-level mixed effect logistic regression was used for categorical response variables to assess whether the occurrence of subclinical diseases, namely subclinical mastitis and subclinical ketosis, were associated with PVL status. Explanatory variables (PVL status, parity, subclinical mastitis and subclinical ketosis for the milk production model; PVL status, parity and subclinical ketosis for the subclinical mastitis model; and PVL status, parity and subclinical mastitis for the ketosis model) were initially assessed for unconditional association with each outcome of interest using linear regression or logistic regression for continuous and categorical variables, respectively. Only the variables with p ≤ 0.2 were selected for a mixed effect multivariable model regression analysis. Model building that utilized the full model and removed the least associated variable (backward elimination) was used to retain significant variables (p ≤ 0.05). Two-way interaction terms were assessed between PVL status and parity, as well as between PVL status and occurrence of subclinical mastitis and between PVL status and occurrence of subclinical ketosis. Interaction terms were not retained in the final model if not significant (Wald’s test >0.05) and if they did not change the coefficient of the main predictor by more than 20% when included in the model. Confounding variables were only retained in the model if removing them from the model changed the coefficient of the main exposure variable by more than 20%. All models included parity, as it was a consistent confounder and province as fixed effects and herd as a random effect. For each predictor, a Wald test was used to determine the overall P- value to assess its significance.
All above modeling analyses were repeated with BLV− versus BLV+ with low PVL status, and again with BLV− versus BLV+ with high PVL status.
All linear mixed model assumptions of normality, linearity and equal variance were assessed graphically. Model diagnostics were assessed in each model, which permitted to rule out the presence of any outliers or influential observations.
For goodness of fit of the mixed models, the R-squared and the intraclass correlation coefficients (ICC) were calculated and assessed. Finally, a contextual effect of the main predictor recorded at the cow level (PVL status) was assessed by including the herd proportions of high PVL cows in the model to identify if there was any contextual effect [whether or not the estimated effect is related to the group (herd), or context, to which the cow belongs to Dohoo et al. (27)]. The absence of any significant effect of this added herd PVL variable can be interpreted as indicating an effect of PVL that is purely at the cow level (28).
All statistical analyses were carried out in Stata 17 (StataCorp, College Station, TX. USA).
Results
Twenty-five dairy herds, four from Prince Edward Island (PEI), twelve from Nova Scotia (NS) and nine from New Brunswick (NB), were enrolled in this study, with a median herd size of 106 lactating cows [interquartile range (IQR), 71–168]. In total, 3,035 dairy cows were tested for BLV, with 1868 BLV− and 1,167 BLV+. The overall prevalence was 38.4%. The within-herd prevalence ranged from 6 to 89%. The PVL levels measured with qPCR revealed that 624 (53%) positive cows were classified as high PVL and 543 (47%) were classified as low PVL. The median parity was 3 (IQR, 2–4). The distribution of positive cows in the parity categories was 22, 26, 21, and 31% for first, second, third and fourth or more, respectively. The mean cow’s 305d milk production was 10,221 kg (95% CI: 9878–10,565). The herd average 305-d milk production ranged from 9,321 to 11,283 kg per cow, and a trend was observed where herds with higher BLV prevalence had a lower herd average 305-d milk production per cow than herds with lower prevalence, as shown in Figure 2. There were 276 BLV+ cows and 252 BLV− cows with subclinical mastitis; and 290 BLV+ cows and 507 BLV− cows with subclinical ketosis. The proportion of high PVL status amongst BLV+ cows at the herd level varied from 2 to 47% (Figure 3). Descriptive statistics are presented in Table 1.
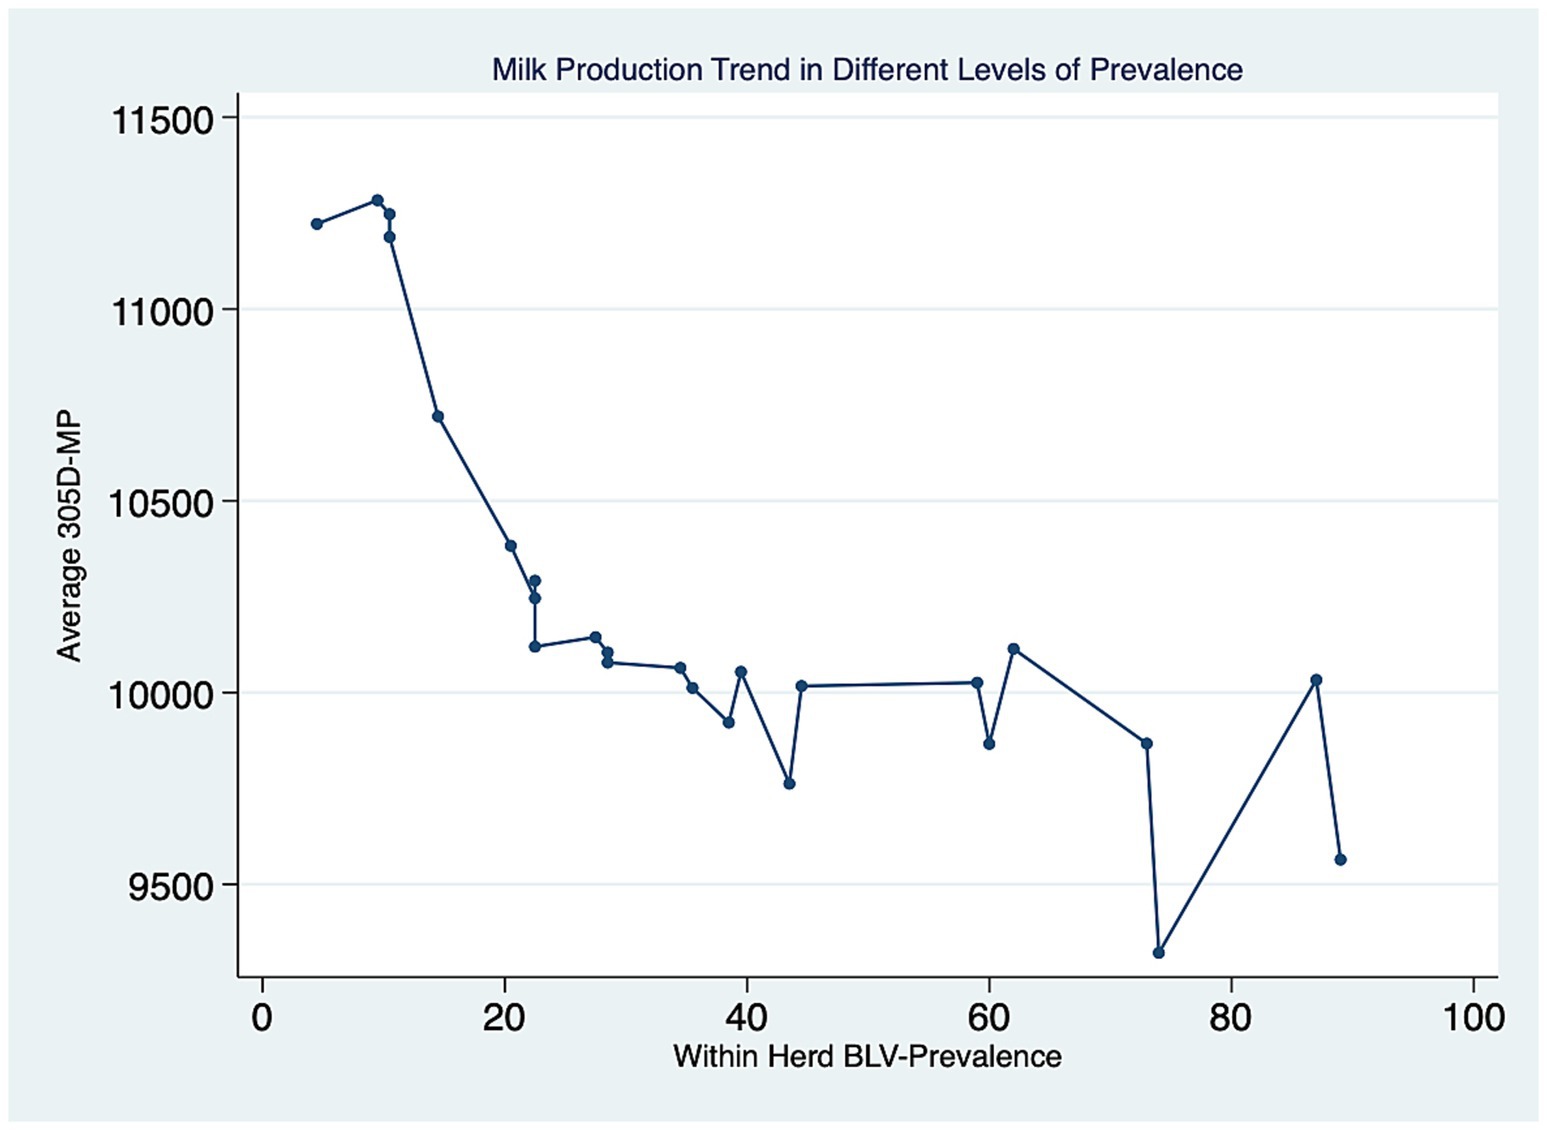
Figure 2. Average 305d milk production (305-MP – in kg) at the herd level for different levels of within-herd BLV prevalence (%).
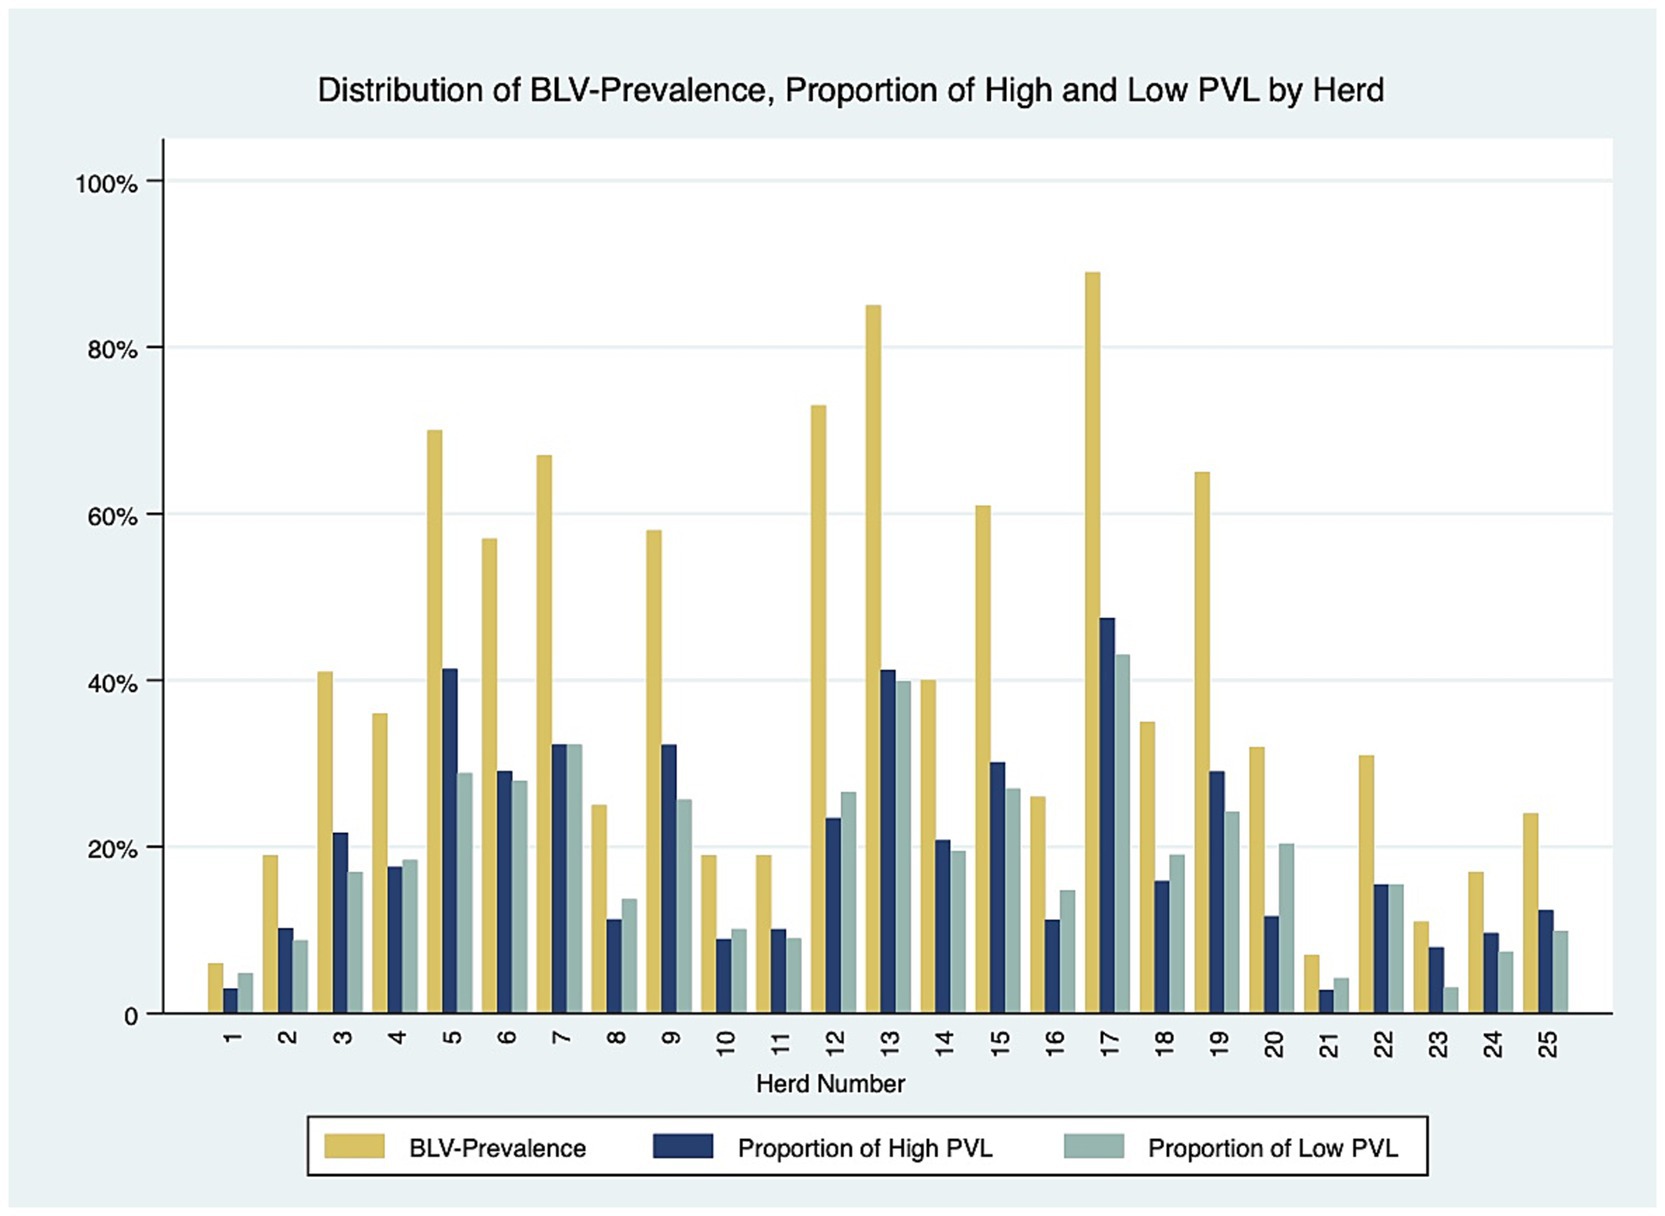
Figure 3. Distribution of BLV prevalence and proportion of high and low proviral load cows by herd.
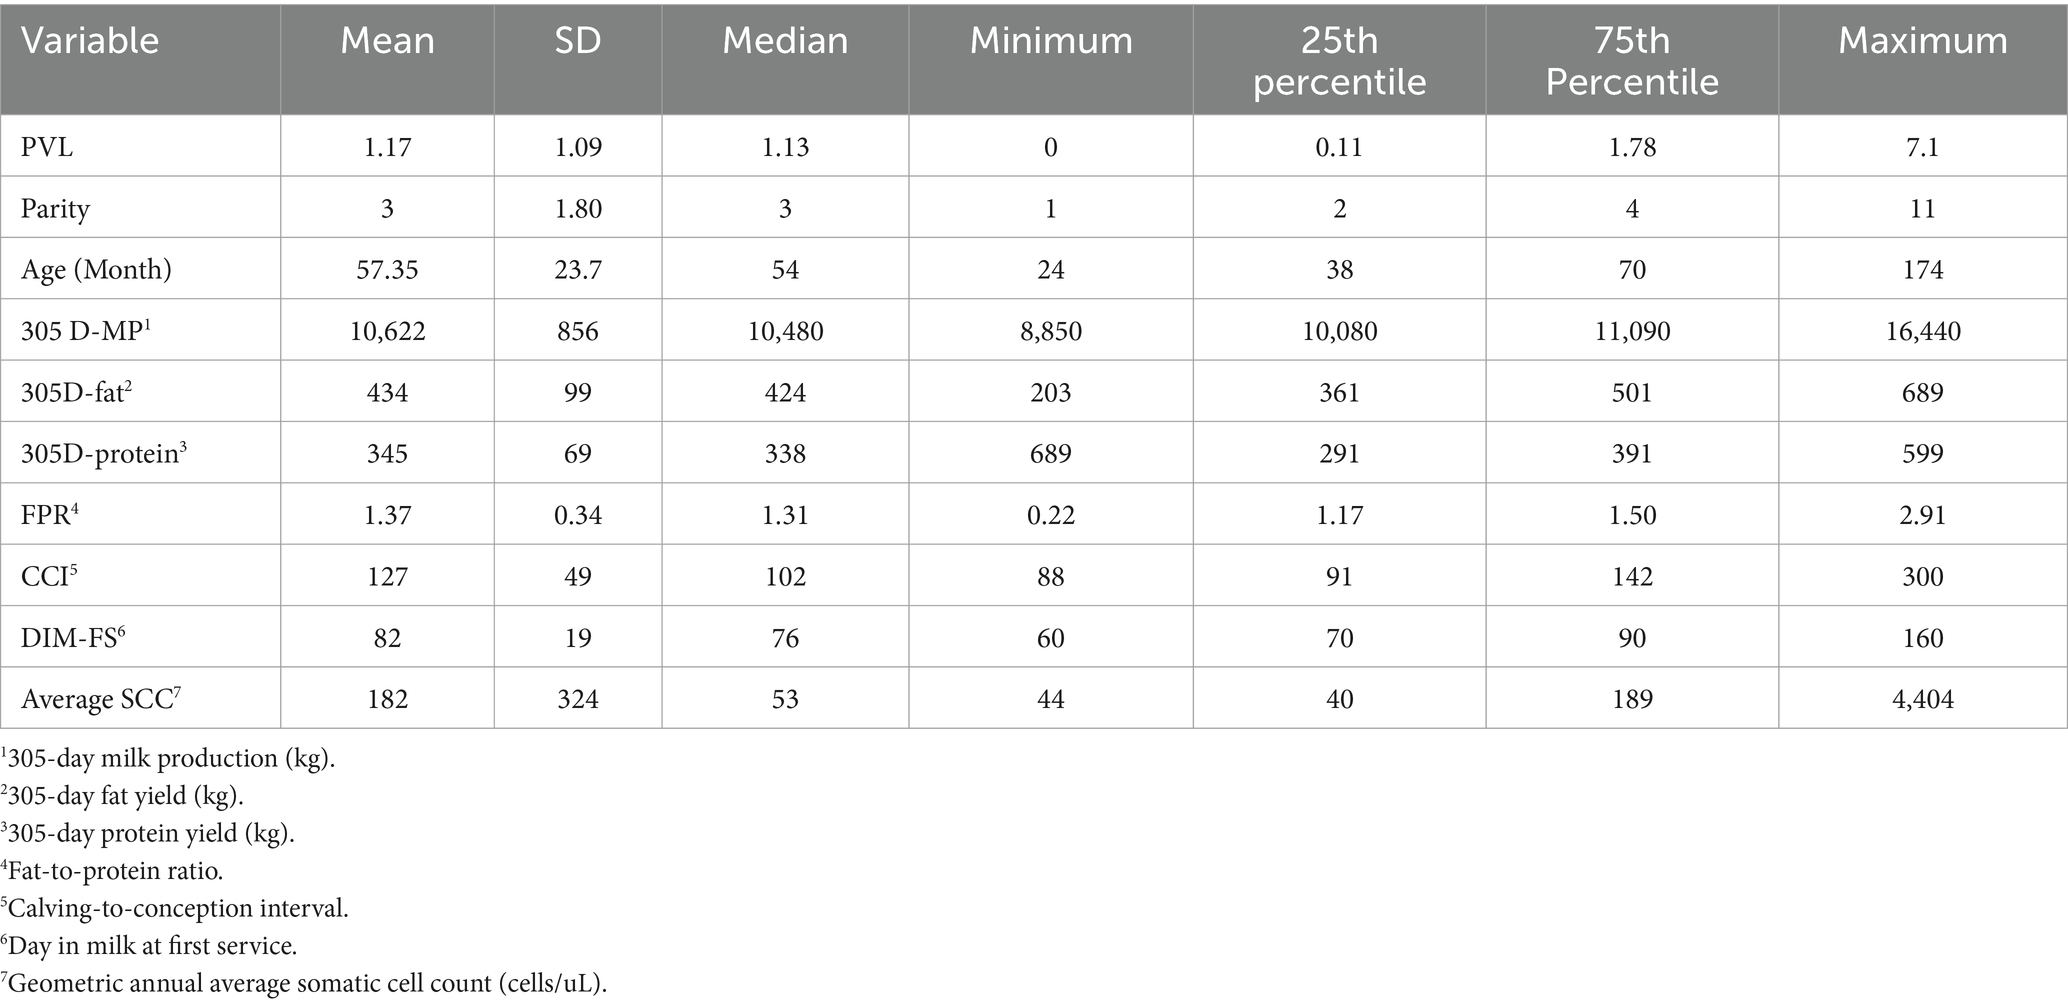
Table 1. Descriptive statistics of variables used to assess the impact of PVL on production parameters and subclinical diseases.
Relationship between PVL and milk production
PVL-status, parity and province (p < 0.20) were included into all models. Subclinical mastitis and subclinical ketosis were forced into the mixed multivariable linear regression model for further analysis. Inclusion of the interaction terms of PVL status with parity, occurrence of subclinical mastitis and occurrence of subclinical ketosis did not show any significance (p > 0.05) and did not result in different coefficients when compared to the model without interaction terms. Only parity showed a confounding effect and therefore was retained in the final models. Subclinical mastitis and subclinical ketosis did not show a confounding effect; however, they were forced in the final models because these variables often correlated with the outcome variables.
After adjusting for parity, subclinical mastitis, subclinical ketosis and herd random effects, there was a significant negative association (p < 0.001) between PVL status and 305D-Milk Production, 305D-fat yield, and 305D-protein yield. BLV+ cows with high PVL had an approximately 387 kg reduction (−4%) in 305D-Milk Production compared to BLV+ cows with a low PVL (p < 0.001) (Table 2). The ICC was 0.19 (95% CI 0.11–0.25). Similarly, a BLV+ cow with a high PVL had a 30 kg reduction in 305D-fat yield, and 11 kg reduction in 305D-protein yield in a lactation compared to BLV+ cows with low PVL.
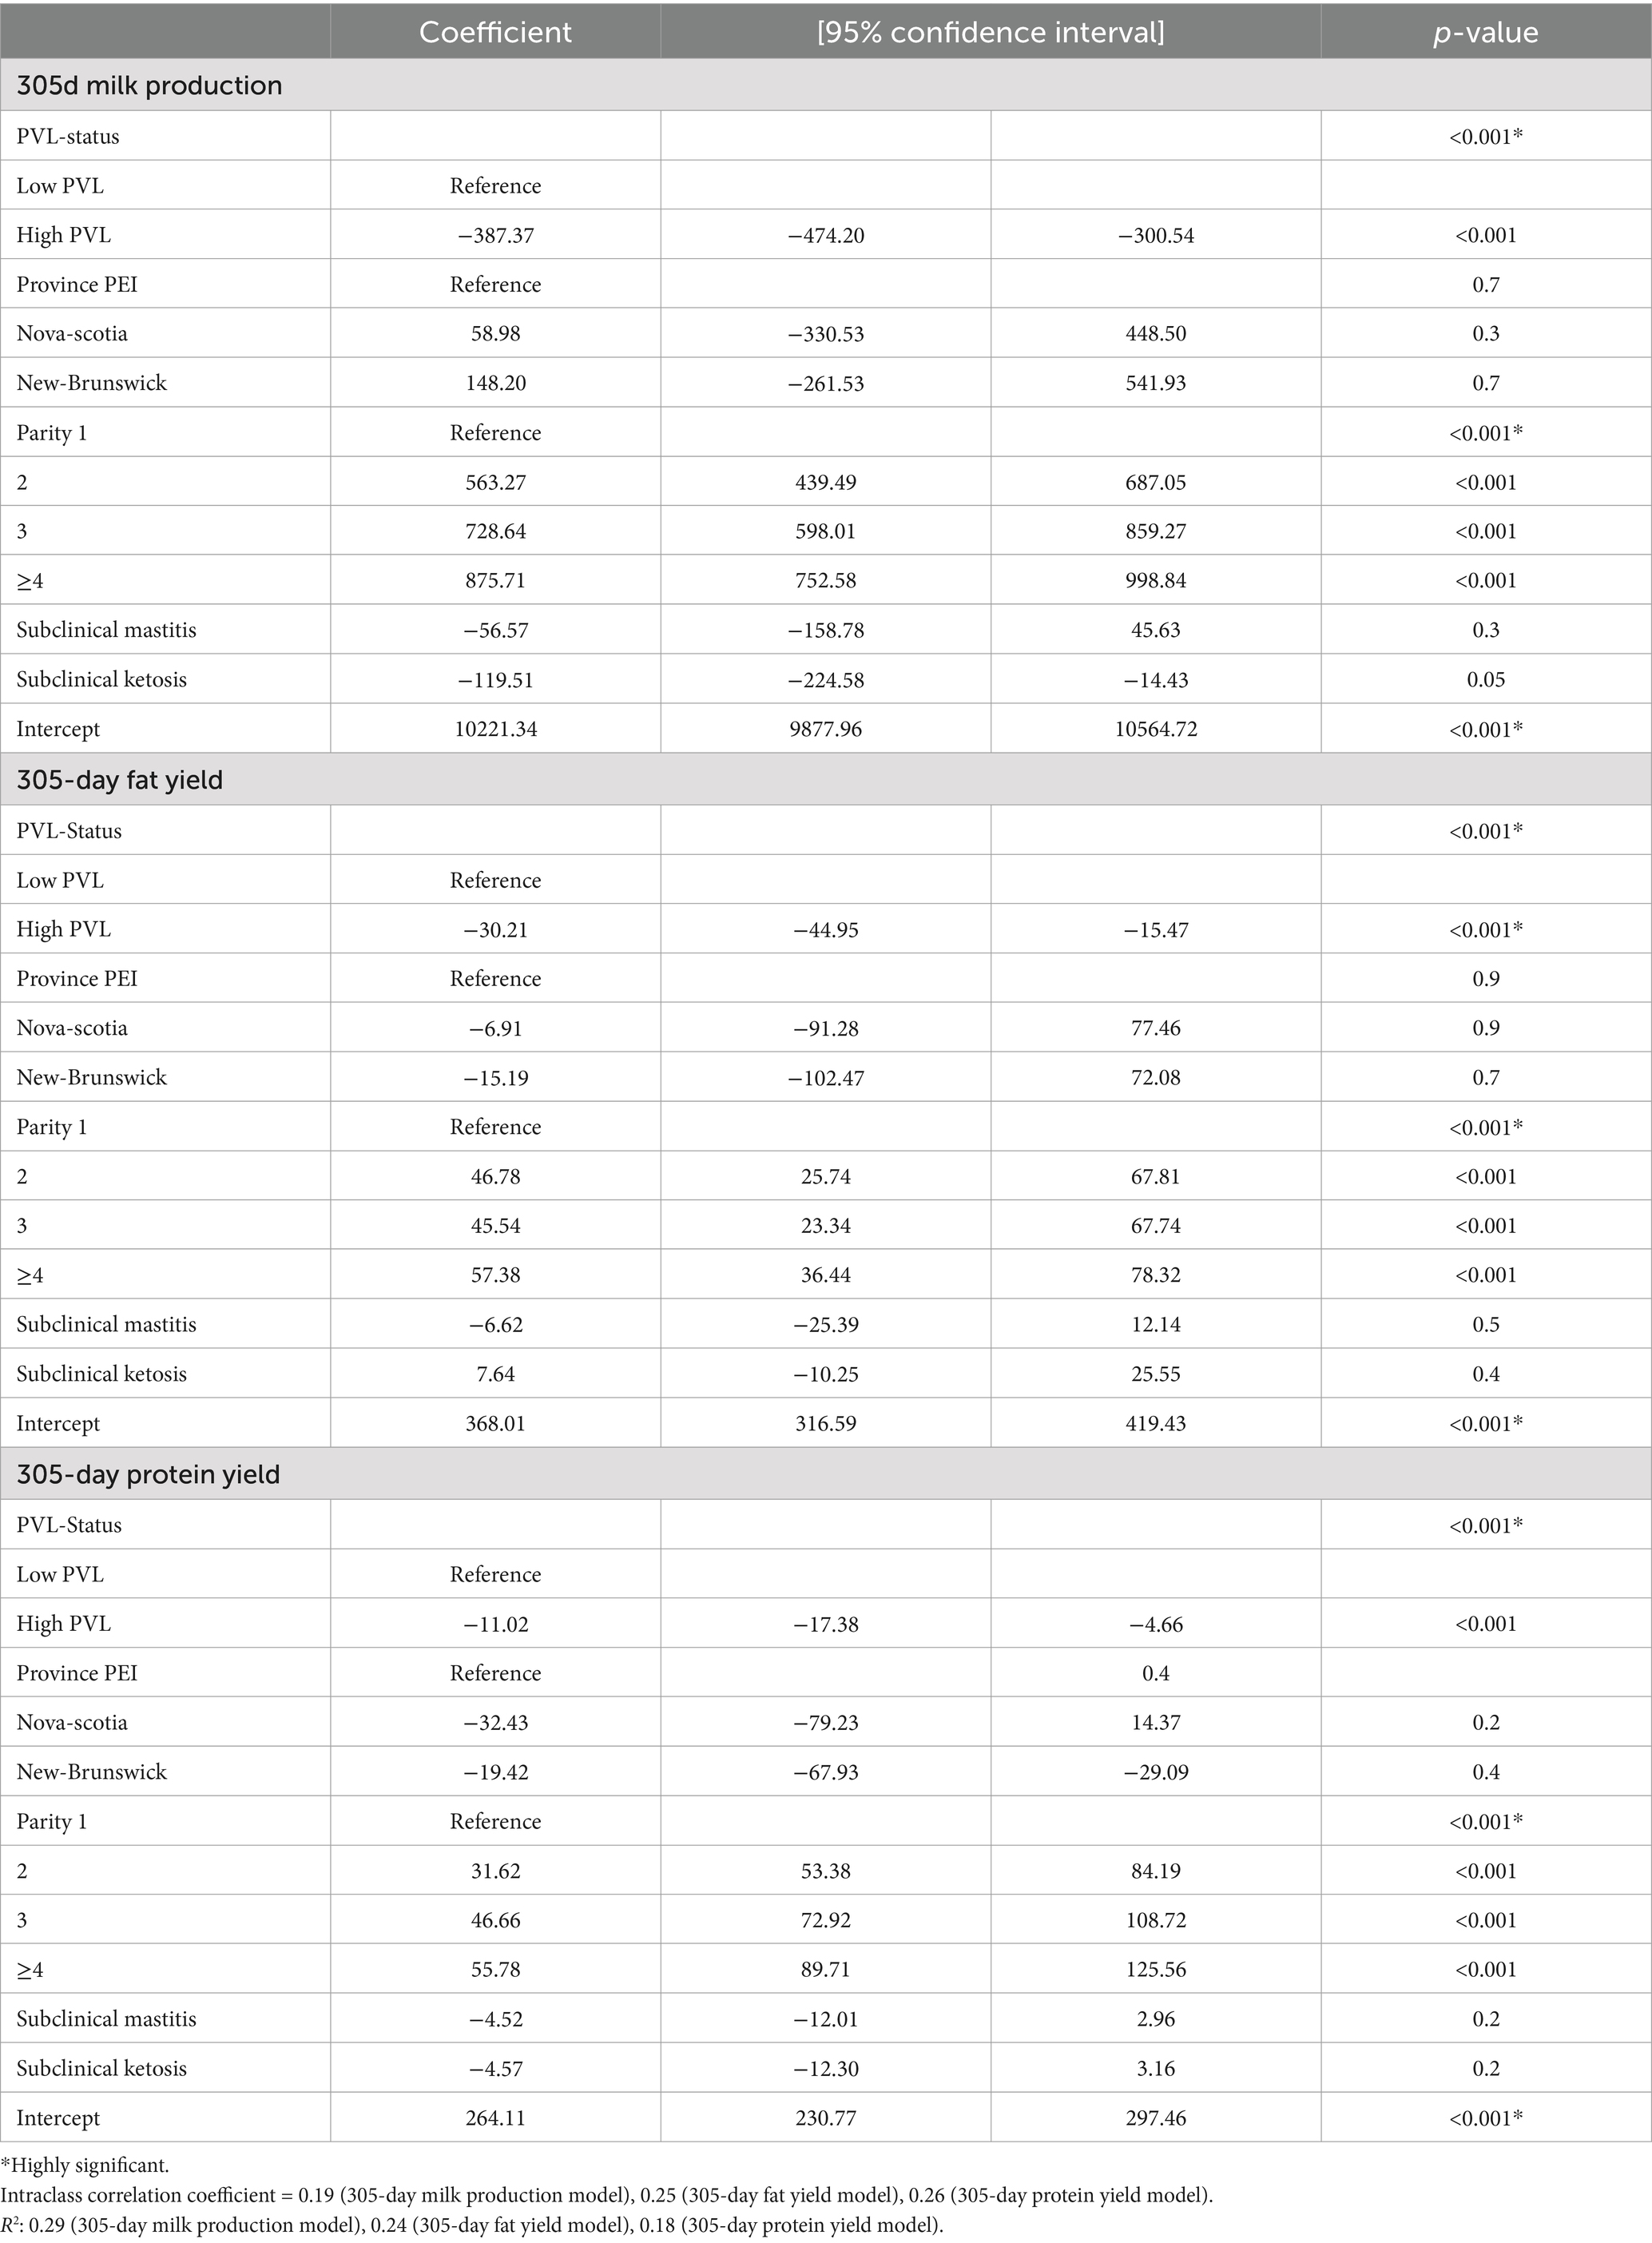
Table 2. Mixed linear regression model for 305-day milk production, 305-day fat yield and 305-d protein yield and low vs. high PVL status in BLV-positive cows.
Relationship between PVL and reproduction indices
Two reproduction parameters, calving-to-conception interval (CCI) and days in milk to first service (DIM-FS), were modeled independently with PVL-status (low vs. high), parity and province based on univariable analysis (p < 0.2). Adding the interaction term PVL-status and parity did not improve the model (p > 0.05) and was not retained in both models. Parity showed a confounding effect in both models. Both reproductive parameters were highly associated with PVL status. The DIM-FS was 13 days longer and the CCI was prolonged by 50 days in cows with high PVL in comparison to cows with low PVL status (p < 0.001) (Table 3).
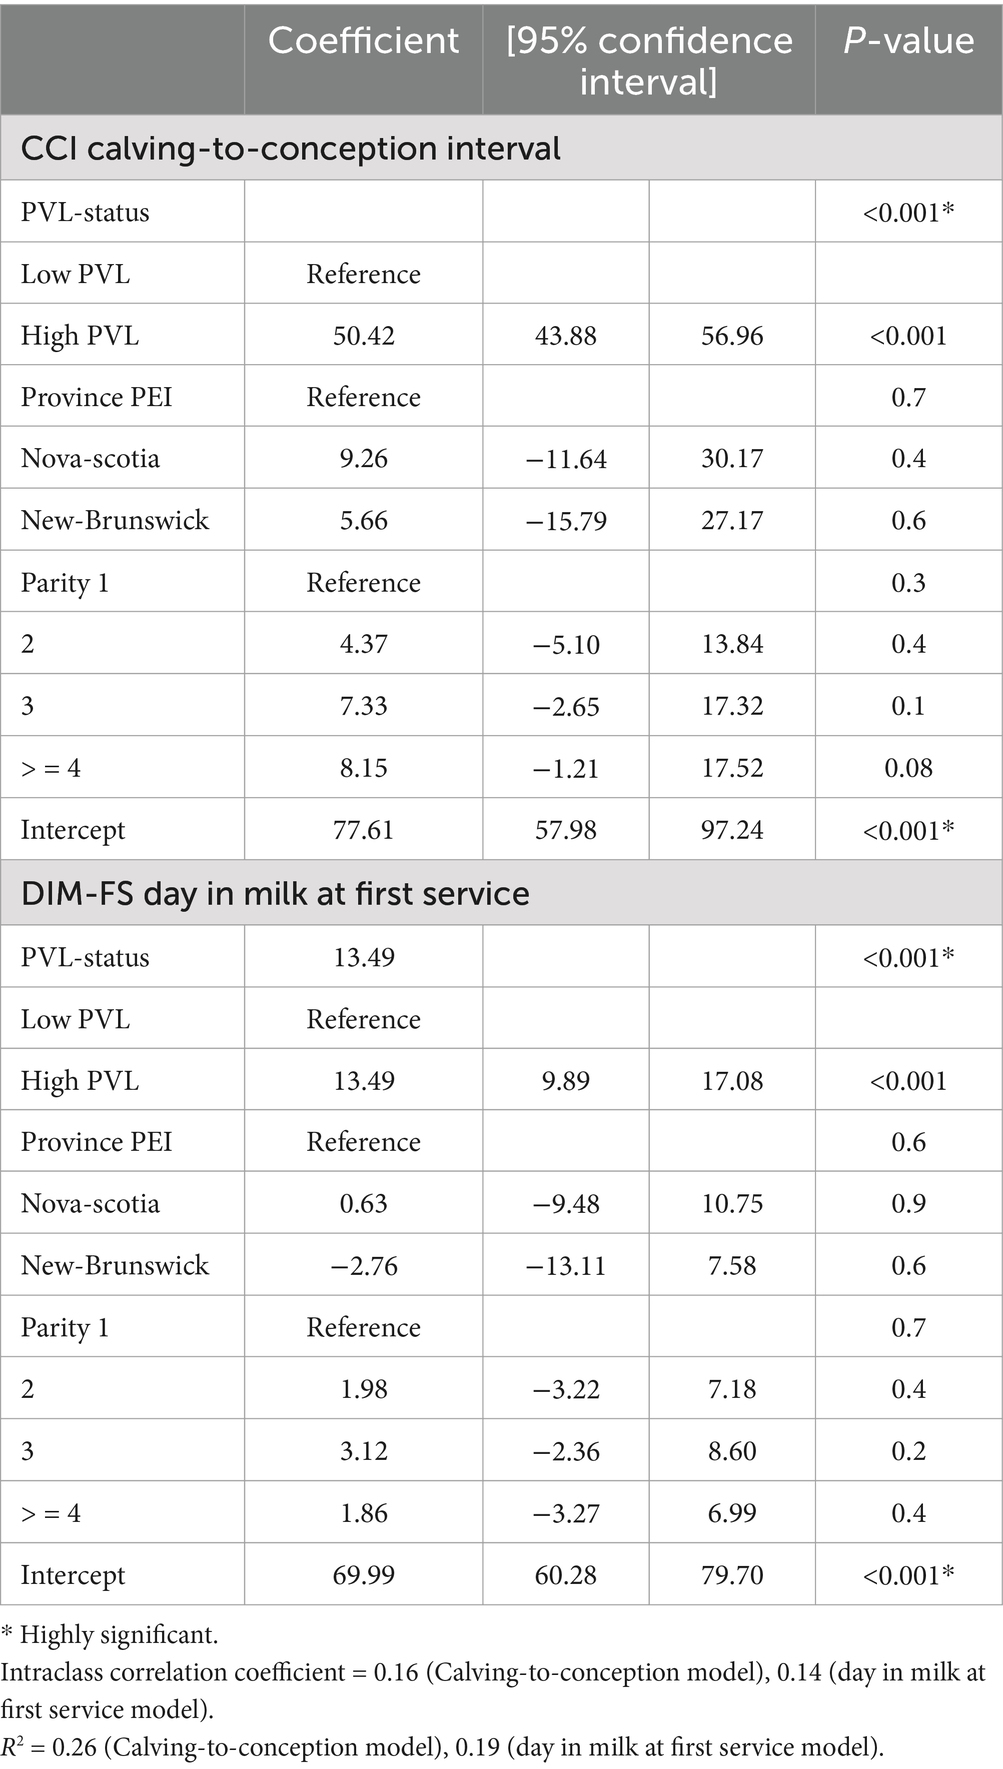
Table 3. Mixed linear regression model for the reproduction indices, calving conception interval (CCI) and days in milk to first service (DIM-FS), and PVL status.
Relationship between PVL and occurrence of subclinical disease
A mixed effect logistic regression model was used to assess the relationship between low and high PVL in BLV+ cows and occurrence of two subclinical diseases. Parity and province (p < 0.20) were included into both models. Parity, subclinical ketosis and subclinical mastitis were assessed for confounding effects and only parity showed a confounding effect in both models. Adding the interaction term PVL-status and parity (both models), PVL-status and subclinical ketosis (for the subclinical mastitis model), and PVL-status and subclinical mastitis (for the subclinical ketosis model) did not improve both models (p > 0.05) and were not retained in both models. One model demonstrated that the PVL level was strongly associated with the occurrence of subclinical mastitis (p < 0.001) with an odds ratio estimate of 2.38 (Table 4). The occurrence of subclinical ketosis did not differ significantly between high PVL and low PVL cows (p = 0.3) (Table 4).
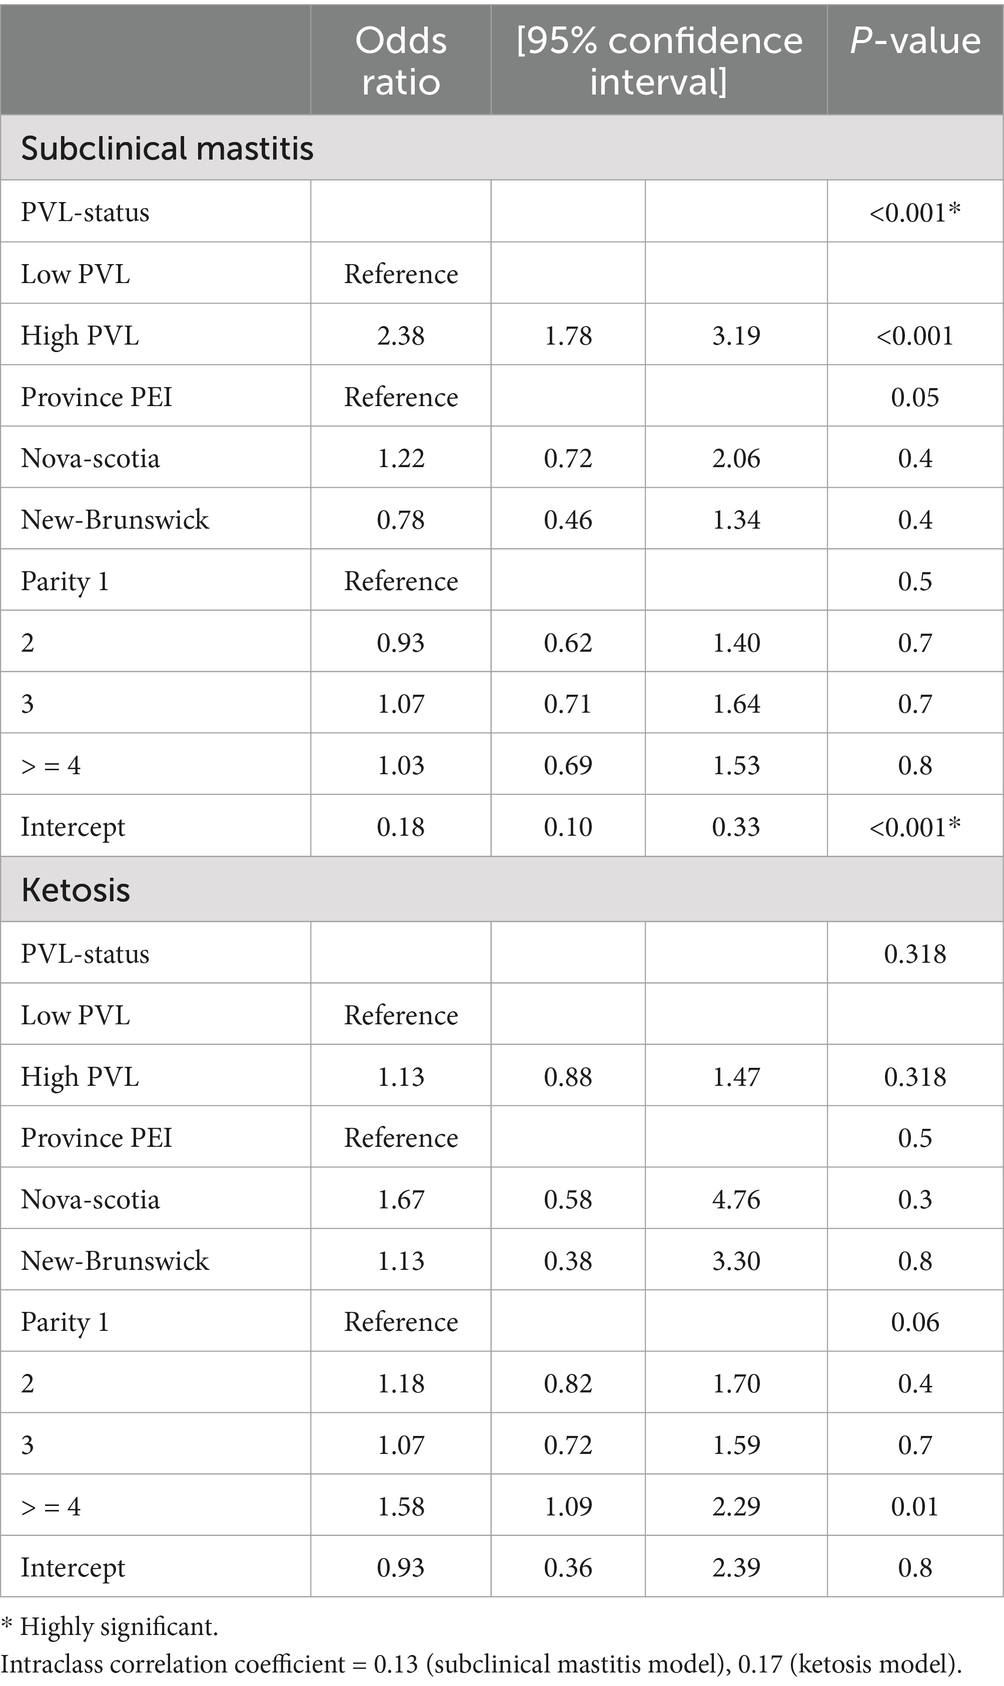
Table 4. Mixed effect logistic regression model for subclinical mastitis/subclinical ketosis and PVL status (low vs. high) of BLV+ cows.
The contextual effect of PVL on each production parameter was not significant. Therefore, the estimated effect of the PVL on cow’s performance parameters was not due to the between-herd management differences and there was no need to adjust the coefficient interpretation.
Comparison between BLV- cows and BLV+ cows with either high or low PVL
When comparing BLV− cows and BLV+ cows with high PVL, there was a significant reduction in milk, fat and protein yields (p < 0.006), as well as a significant increase in reproduction parameters DIM-FS and CCI (p < 0.0001) and increased occurrence of subclinical mastitis (p < 0.0001) in high PVL status cows compared to BLV− cows. There was, however, no significant difference concerning the occurrence of subclinical ketosis. (Table 5).
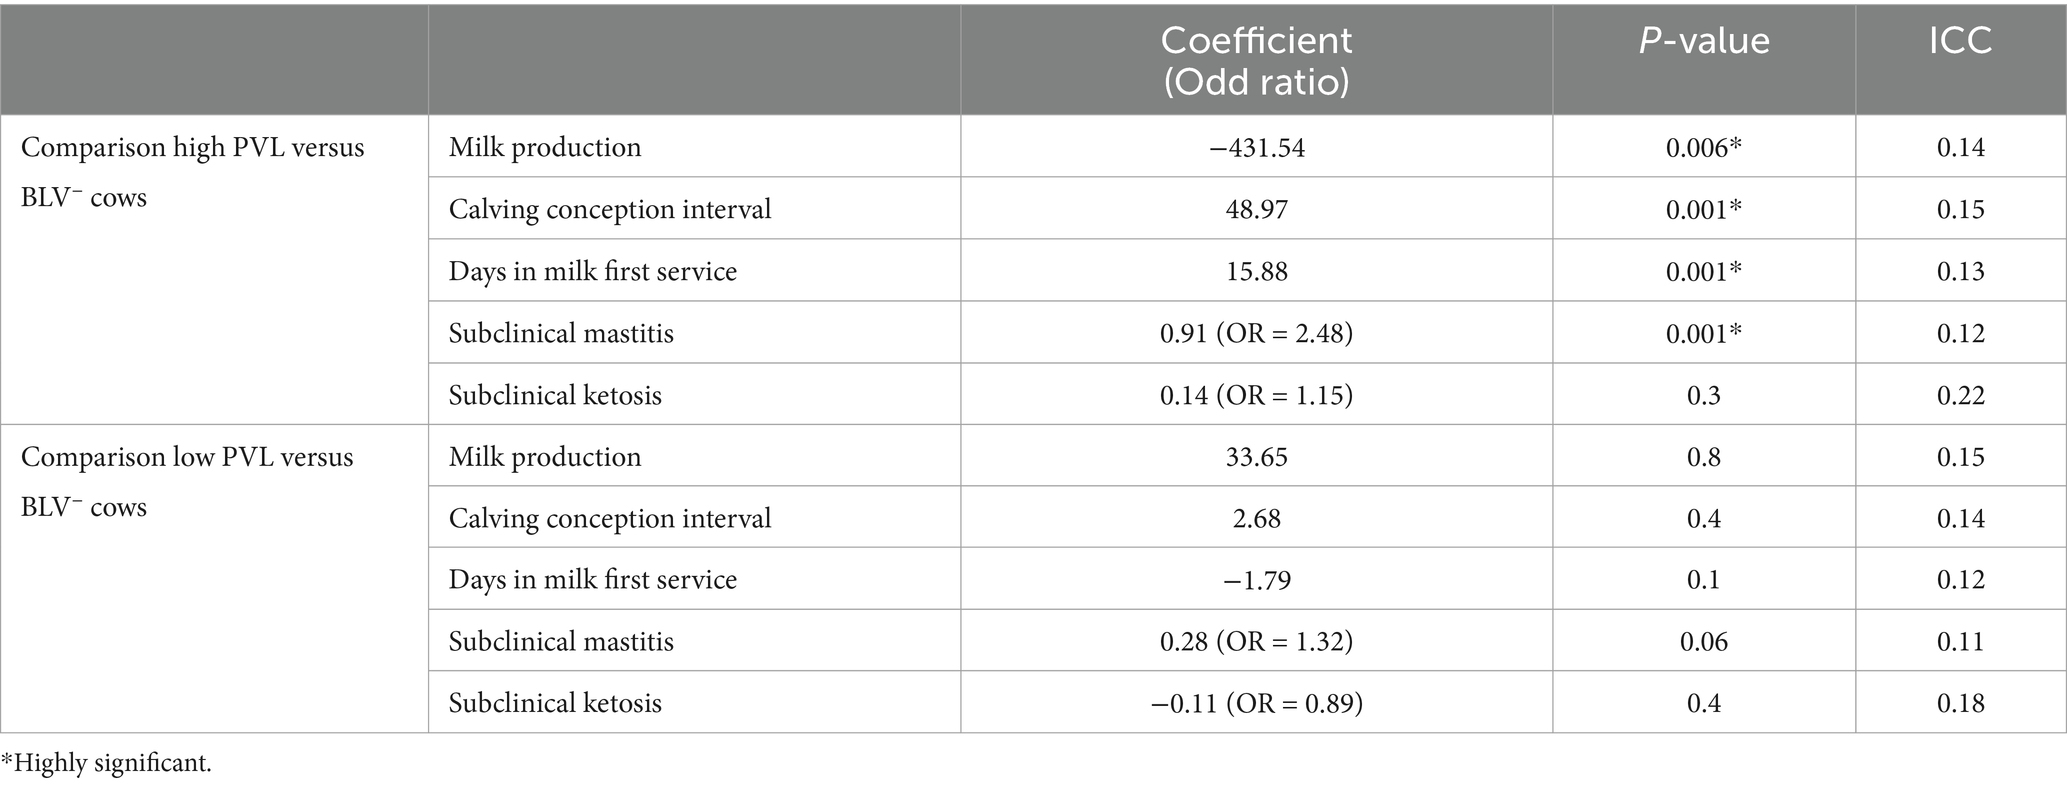
Table 5. Summarized results of mixed-effect multivariable linear regression models and mixed effect multivariable logistic regression models for measuring associations between each PVL-status and BLV-negative cows and milk production, reproduction indices and occurrence of subclinical mastitis and ketosis.
When comparing BLV− cows to BLV+ cows with low PVL, no difference was found for all the parameters. (Table 5).
Discussion
This study evaluated the association of BLV PVL status with milk production and reproduction parameters, as well as the occurrence of common subclinical diseases, mastitis and ketosis, in the dairy industry.
Multiple studies have investigated the impact of BLV status on milk production. A negative association between seropositivity and milk production has been shown at the herd level in several studies (2, 29, 30). These results are in agreement with our study that showed a trend where increased BLV prevalence within a herd had decreased milk production at the herd level.
There have been contradictory results at the individual cow level, with some studies finding no association between BLV seropositivity and milk production (15, 16, 30, 31), while others did find that BLV+ cows have decreased milk production in comparison to BLV− cows (14, 32, 33). This current study determined that there was a significant difference in milk production parameters (305-d milk yield, 305-d fat yield, and 305-d protein yield) between BLV+ cows with a high PVL versus BLV+ cows with a low PVL and versus BLV− cows but not between BLV+ cows with a low PVL and BVL negative cows. This result is in agreement with a similar study performed in a smaller population with 9 herds in Alberta (22), although in our study, the estimated difference in milk yield was ~431 kg reduction vs. 294 kg in the Alberta study, when high PVL cows were compared to BLV− cows. This difference could be due to the lower cutoff they used to distinguish high versus low PVL cows (0.5 vs. 1.0 in our study) or their smaller sample size. Our results were also in agreement with previous studies looking at associations between milk production and persistent lymphocytosis (34) or high BLV ELISA optical density values (32), both of which have been shown to correlate with high proviral loads (23, 35–37). The PVL status of a BLV+ cow may explain, in part, the discrepancy between previous studies looking at the impact of BLV seropositivity on milk production at the cow level, as they did not account for PVL status. Studies that had few high PVL cows in their BLV+ cohort would be less likely to show a change in milk production parameters.
This study used two common indices to assess reproduction performance, namely days in milk at first service (DIM-FS) and calving-to-conception interval (CCI). Our results showed that PVL status was associated with reproduction performance. This result is in contrast to a recent study that reported no evidence of an association between BLV status or high PVL and fertility in Kansas beef herds (38). However, different reproductive indices were used in that study since it was conducted in beef cattle and the high PVL cutoff was slightly lower in that study (≥ 0.9 proviral copies/host DNA) than in our study. Only a few studies found reduced reproductive efficiency (39–42) associated with BLV seropositivity, which were limited to a subset of cows with lymphocytosis or lymphosarcoma, and both of these conditions are associated with a high PVL.
Disruption of the immune function of polymorphonuclear neutrophils, as well as inflammation of the mammary gland, have been shown to occur in BLV seropositive cows and are associated with higher PVL levels (20, 43–45), which is an explanation for the increased susceptibility of high PVL cows to subclinical mastitis found in our study. Increasing PVL levels have been associated with the risk and severity of clinical mastitis (46). One study did not find any significant association between PVL status and occurrence of clinical mastitis, but this lack of an association could be due to selection bias where only cases with clinical mastitis severe enough to warrant treatment were included, or due to the low power to find an association with this small population (n = 97) (47).
This current study focused on subclinical mastitis, as this can also have an impact on milk production and is of relevance for dairy producers. A recent study showed a hazard ratio for subclinical mastitis in high PVL BLV+ cows to be 2.61 times higher than BLV− cows, with no significant difference between BLV+ cows with a low PVL and BLV− cows (48), which is consistent with the findings in this study. Factors at the herd level, such as hygiene measures, types of milking procedures, stall type and size, and lactation stage, can also affect the prevalence of subclinical mastitis (49–51) and were accounted for in our herd clustering effect model. In addition, we used the annual geometric average of the SCC to account for the seasonal effect.
This study is the first one to assess the effect of BLV and PVL status on occurrence of subclinical ketosis in the first month after calving. We did not find any significant association between BLV PVL status and subclinical ketosis. However, we used the inline milk fat-to- protein ratio with a cutoff value of 1.5 to categorize cows with subclinical ketosis. Although this method is a practical way for screening for subclinical ketosis at the herd level, it has limited accuracy to diagnose subclinical ketosis in individual cows, with a high false discovery rate (26). Further studies with measurement of betahydroxybutyrate concentrations in the blood or milk are warranted (52).
Multiple cutoff values with different units have been used to define high PVL cows, which makes it difficult to compare studies. Examples of cutoff values include 100,000 copies/μg of DNA (35), 500 proviral copies/50 ng of genomic DNA (53), 100,000 copies/105 cells (12), and 0.5 copies/beta-actin copies (54).
There is no consensus on the most appropriate cutoff value to define high PVL BLV+ cows. In our study, we used a cutoff of 1.0 viral genome amplified per WBC, which is the same as 100,000 copies/105cells and 0.5 copies/beta-actin copies, both used in previous publications. A previous study from our institution elaborated a statistical model to predict high proviral load using lymphocyte counts since lymphocytosis correlates with increasing PVL. In that study, it was determined that the best reliability of the model was obtained with the cutoff of 1 copy of provirus per white blood cell (23). We also used the cutoff of 1 copy per WBC for PVL in a voluntary BLV control program in the Canadian Maritime provinces. For these reasons, a cutoff value of 1 copy per WBC or greater was chosen for high PVL in this study. This cutoff seems much higher than the cutoff used in a recent study conducted in Alberta, Canada (1.0 vs. 0.25 per WBC) yet similar results were found (22). However, in that study, they calculated the PVL by dividing the number of BLV copies by the number of beta-actin copies but interpreted this ratio as copies per white blood cell which is incorrect, as the number of beta-actin copies must be first divided by 2, to account for the fact that each cell contains 2 copies of the gene (23, 55). Therefore, their cutoff of 0.25 is not per white blood cell and corresponds to a cutoff of 0.5 of copies per WBC. Similarly, another study used a cutoff of 0.5 copies per beta-actin copies, which corresponds to the cutoff used in this study of 1.0 copies per WBC (54). This equivalency illustrates the importance of having standardization in defining high PVL to be able to better compare studies’ results in the future.
Our study had some limitations inherent to milk production data collection. Selection bias might have happened, with cows with very low production possibly removed early in lactation by producers and therefore not included in the analyzed data. Survivor bias was also possible; however, we limited this bias by using data collected before the implementation of target culling of high PVL cows as part of the BLV management program. PVL is dynamic; therefore, there could have been misclassification of some cows’ status in one direction, from BLV- to BLV+ and from low PVL to high PVL. As such, the associations identified in our study could be underestimated and potentially biased toward the null. Although survival analysis can be useful for CCI (time to event outcome) in some contexts, other methods such as linear regression have been used successfully to assess CCI in dairy cattle (56). In our analysis we used CCI as a continuous variable in a mixed multiple linear regression model to assess the effect of PVL on this interval because the assumption of normal distribution of error was met and because of easier interpretation of the coefficient than survival analysis. In addition, this was a cross-sectional study with one point in time assessment of PVL and therefore, using a survival analysis that is focused on time to conception would likely be inappropriate since we do not really know when the starting point for their high PVL status began. We excluded only a few open cows because occasionally a farmer chose not to breed a cow or a cow was bred unsuccessfully during the study period. Excluding these cows in the analysis may have led to underestimating the effect and therefore bias toward the null. Finally, the test used to determine subclinical ketosis might have led to a high false discovery rate, which could have impacted our results. Further studies with measurement of beta-hydroxybutyrate concentrations in the blood would be warranted to confirm our results.
In conclusion, high BLV proviral load was associated with decreased milk production and fat and protein yields, compared to BLV+ cattle with a low PVL. In addition, BLV high PVL status decreased reproductive efficiency, as well as increased the risk of subclinical mastitis. This reduction in performance parameters, in addition to the higher risk of transmission of BLV from high PLV cows to naïve cows, supports the importance of identifying and culling high PVL cows in herds. This targeted culling is especially important in herds with a high BLV prevalence, where culling of all seropositive cows is not feasible.
Data availability statement
The raw data supporting the conclusions of this article will be made available by the authors, without undue reservation.
Ethics statement
The animal study was approved by the Animal Care and Use Committee of the University of Prince Edward Island (File #6008434). The study was conducted in accordance with the local legislation and institutional requirements.
Author contributions
SB: Conceptualization, Data curation, Formal analysis, Investigation, Methodology, Software, Validation, Writing – original draft, Writing – review & editing. SM: Methodology, Supervision, Writing – review & editing. GK: Methodology, Writing – review & editing. EJ: Writing – review & editing. JV: Methodology, Writing – review & editing. EB: Writing – review & editing, Writing – original draft. JM: Conceptualization, Data curation, Funding acquisition, Investigation, Methodology, Project administration, Supervision, Writing – review & editing.
Funding
The author(s) declare that financial support was received for the research, authorship, and/or publication of this article. Funding for this research was provided by the Canadian Agricultural Partnership Program, Dairy Farmers of New Brunswick, Dairy Farmers of Nova Scotia and Dairy Farmers of Prince Edward Island.
Acknowledgments
The authors are grateful to all dairy producers and herd veterinarians for their participation in this study. We also extend our gratitude to the personnel at the MQM laboratory (Charlottetown, PE), for their help with processing the samples.
Conflict of interest
The authors declare that the research was conducted in the absence of any commercial or financial relationships that could be construed as a potential conflict of interest.
Generative AI statement
The authors declare that no Generative AI was used in the creation of this manuscript.
Publisher’s note
All claims expressed in this article are solely those of the authors and do not necessarily represent those of their affiliated organizations, or those of the publisher, the editors and the reviewers. Any product that may be evaluated in this article, or claim that may be made by its manufacturer, is not guaranteed or endorsed by the publisher.
References
1. Aida, Y, Murakami, H, Takahashi, M, and Takeshima, SN. Mechanisms of pathogenesis induced by bovine leukemia virus as a model for human T-cell leukemia virus. Front Microbiol. (2013) 4:328. doi: 10.3389/fmicb.2013.00328
2. Bartlett, PC, Norby, B, Byrem, TM, Parmelee, A, Ledergerber, JT, and Erskine, RJ. Bovine leukemia virus and cow longevity in Michigan dairy herds. J Dairy Sci. (2013) 96:1591–7. doi: 10.3168/jds.2012-5930
3. Goff, SP. Retroviridae: the retroviruses and their replication. In: D Knipe and P Howley, editors. Fields Virology. sixth ed. Philadelphia, PA: Lippincott Williams & Wilkins (2012). 1424–73.
5. Kohara, J, Konnai, S, and Onuma, MS. Experimental transmission of bovine leukemia virus in cattle via rectal palpation. Jpn J Vet Res. (2006) 54:25–30. doi: 10.14943/jjvr.54.1.25
6. Kuczewski, A, Adams, C, Lashewicz, B, and Van Der, MF. Alberta dairy farmers’ and veterinarians’ opinion about bovine leukemia virus control measures. Prev Vet Med. (2022) 200:105590. doi: 10.1016/j.prevetmed.2022.105590
7. Rodríguez, SM, Florins, A, Gillet, N, de Brogniez, A, Sánchez-Alcaraz, MT, Boxus, M, et al. Preventive and therapeutic strategies for Bovine Leukemia virus: lessons for HTLV. Viruses. (2011) 3:1210–48. doi: 10.3390/v3071210
8. Suárez Archilla, G, Gutiérrez, G, Camussone, C, Calvinho, L, Abdala, A, Alvarez, I, et al. A safe and effective vaccine against bovine leukemia virus. Front Immunol. (2022) 13:980514. doi: 10.3389/fimmu.2022.980514
9. Juliarena, MA, Barrios, CN, Ceriani, MC, and Esteban, EN. Hot topic: bovine leukemia virus (BLV)-infected cows with low proviral load are not a source of infection for BLV-free cattle. J Dairy Sci. (2016) 99:4586–9. doi: 10.3168/jds.2015-10480
10. Jimba, M, Takeshima, SN, Murakami, H, Kohara, J, Kobayashi, N, Matsuhashi, T, et al. BLV-CoCoMo-qPCR: a useful tool for evaluating bovine leukemia virus infection status. BMC Vet Res. (2012) 8:167. doi: 10.1186/1746-6148-8-167
11. Ohno, A, Takeshima, SN, Kikuya, M, Matsumoto, Y, and Aida, Y. Epidemiological features of BLV infection in Japan from 2012 to 2013. Retrovirology. (2015) 12:41. doi: 10.1186/1742-4690-12-S1-P41
12. Ruggiero, VJ, Norby, B, Benitez, OJ, Hutchinson, H, Sporer, KRB, Droscha, C, et al. Controlling bovine leukemia virus in dairy herds by identifying and removing cows with the highest proviral load and lymphocyte counts. J Dairy Sci. (2019) 102:9165–75. doi: 10.3168/jds.2018-16186
13. Benavides, B, and Monti, G. Bovine leukemia virus transmission rates in persistent lymphocytotic infected dairy cows. Front Vet Sci. (2024) 11:1367810. doi: 10.3389/fvets.2024.1367810
14. Nekouei, O, VanLeeuwen, J, Stryhn, H, Kelton, D, and Keefe, G. Lifetime effects of infection with bovine leukemia virus on longevity and milk production of dairy cows. Prev Vet Med. (2016) 133:1–9. doi: 10.1016/j.prevetmed.2016.09.011
15. Jacobs, RM, Heeney, JL, Godkin, MA, Leslie, KE, Taylor, JA, Davies, C, et al. Production and related variables in bovine leukaemia virus-infected cows. Vet Res Commun. (1991) 15:463–74. doi: 10.1007/BF00346546
16. Kale, M, Bulut, O, Yapkic, O, Gulay, MS, Pehlivanoglu, F, Ata, A, et al. Effects of subclinical bovine leukemia virus infection on some production parameters in a dairy farm in southern Turkey. J S Afr Vet Assoc. (2007) 78:130–2. doi: 10.4102/jsava.v78i3.303
17. Chi, J, VanLeeuwen, JA, Weersink, A, and Keefe, GP. Direct production losses and treatment costs from bovine viral diarrhoea virus, bovine leukosis virus, Mycobacterium avium subspecies paratuberculosis, and Neospora caninum. Prev Vet Med. (2002) 55:137–53. doi: 10.1016/s0167-5877(02)00094-6
18. Kuczewski, A, Hogeveen, H, Orsel, K, Wolf, R, Thompson, J, Spackman, E, et al. Economic evaluation of 4 bovine leukemia virus control strategies for Alberta dairy farms. J Dairy Sci. (2019) 102:2578–92. doi: 10.3168/jds.2018-15341
19. Kuczewski, A, Orsel, K, Barkema, HW, Mason, S, Erskine, R, and van der Meer, F. Invited review: bovine leukemia virus-transmission, control, and eradication. J Dairy Sci. (2021) 104:6358–75. doi: 10.3168/jds.2020-18925
20. Lv, G, Wang, H, Wang, J, Lian, S, and Wu, R. Effect of BLV infection on the immune function of Polymorphonuclear neutrophil in dairy cows. Front Vet Sci. (2021) 8:737608. doi: 10.3389/fvets.2021.737608
21. Ott, SL, Johnson, R, and Wells, SJ. Association between bovine-leukosis virus seroprevalence and herd-level productivity on US dairy farms. Prev Vet Med. (2003) 61:249–62. doi: 10.1016/j.prevetmed.2003.08.003
22. Shrestha, S, Orsel, K, Barkema, HW, Martins, L, Shrestha, S, and van der Meer, F. Effects of bovine leukemia virus seropositivity and proviral load on milk, fat, and protein production of dairy cows. J Dairy Sci. (2024) 107:530–9. doi: 10.3168/jds.2023-23695
23. John, EE, Droscha, C, Cameron, M, Stryhn, H, Keefe, G, and McClure, JT. Development of a predictive model for bovine leukemia virus proviral load. J Vet Intern Med. (2022) 36:1827–36. doi: 10.1111/jvim.16506
24. Pavliscak, LA, Nirmala, J, Singh, VK, Sporer, KRB, Taxis, TM, Kumar, P, et al. Tracing viral transmission and evolution of bovine leukemia virus through long read Oxford Nanopore sequencing of the Proviral genome. Pathogens. (2021) 10:1191. doi: 10.3390/pathogens10091191
25. Pang, M, Xie, X, Bao, H, Sun, L, He, T, Zhao, H, et al. Insights into the bovine Milk microbiota in dairy farms with different incidence rates of subclinical mastitis. Front Microbiol. (2018) 9:2379. doi: 10.3389/fmicb.2018.02379
26. Jenkins, NT, Peña, G, Risco, C, Barbosa, CC, Vieira-Neto, A, and Galvão, KN. Utility of inline milk fat and protein ratio to diagnose subclinical ketosis and to assign propylene glycol treatment in lactating dairy cows. Can Vet J. (2015) 56:850–4.
27. Dohoo, IR, Martin, SW, and Stryhn, H. Veterinary epidemiologic research. 2nd ed. Charlottetown, PEI, Canada: VER Inc (2009). 865 p.
28. Stryhn, H, De Vliegher, S, and Barkema, H. Contextual multilevel models: effects and correlations at multiple levels. In: Proceedings of the International Symposium on Veterinary Epidemiology and Economics. (2006). 46. Available at https://sciquest.org.nz/browse/publications/article/64121 (Accessed September 5, 2024).
29. Sargeant, JM, Kelton, DF, Martin, SW, and Mann, ED. Associations between farm management practices, productivity, and bovine leukemia virus infection in Ontario dairy herds. Prev Vet Med. (1997) 31:211–21. doi: 10.1016/s0167-5877(96)01140-3
30. Tiwari, A, Vanleeuwen, JA, Dohoo, IR, Keefe, GP, Haddad, JP, Tremblay, R, et al. Production effects of pathogens causing bovine leukosis, bovine viral diarrhea, paratuberculosis, and neosporosis. J Dairy Sci. (2007) 90:659–69. doi: 10.3168/jds.S0022-0302(07)71548-5
31. Sorge, US, Lissemore, K, Cantin, R, and Kelton, DF. Short communication: Milk ELISA status for bovine leukosis virus infection is not associated with milk production in dairy cows. J Dairy Sci. (2011) 94:5062–4. doi: 10.3168/jds.2011-4339
32. Norby, B, Bartlett, PC, Byrem, TM, and Erskine, RJ. Effect of infection with bovine leukemia virus on milk production in Michigan dairy cows. J Dairy Sci. (2016) 99:2043–52. doi: 10.3168/jds.2015-10089
33. Yang, Y, Fan, W, Mao, Y, Yang, Z, Lu, G, Zhang, R, et al. Bovine leukemia virus infection in cattle of China: association with reduced milk production and increased somatic cell score. J Dairy Sci. (2016) 99:3688–97. doi: 10.3168/jds.2015-10580
34. Da, Y, Shanks, RD, Stewart, JA, and Lewin, HA. Milk and fat yields decline in bovine leukemia virus-infected Holstein cattle with persistent lymphocytosis. Proc Natl Acad Sci USA. (1993) 90:6538–41. doi: 10.1073/pnas.90.14.6538
35. Juliarena, MA, Gutierrez, SE, and Ceriani, C. Determination of proviral load in bovine leukemia virus-infected cattle with and without lymphocytosis. Am J Vet Res. (2007) 68:1220–5. doi: 10.2460/ajvr.68.11.1220
36. Esteban, EN, Poli, M, Poiesz, B, Ceriani, C, Dube, S, Gutierrez, S, et al. Bovine leukemia virus (BLV), proposed control and eradication programs by marker assisted breeding of genetically resistant cattle In: LJ Rechi, editor. Animal genetics. Hauppauge, NY: Nova Science Publishers Inc. (2009). 107–30.
37. Jimba, M, Takeshima, SN, Matoba, K, Endoh, D, and Aida, Y. BLV-CoCoMo-qPCR: quantitation of bovine leukemia virus proviral load using the CoCoMo algorithm. Retrovirology. (2010) 7:91. doi: 10.1186/1742-4690-7-91
38. Larson, RL, Huser, SM, Amrine, DE, White, BJ, Taxis, TM, Almaraz, JM, et al. No evidence for a negative association between bovine leukemia virus status and fertility in Kansas beef herds: a cross-sectional study. Am J Vet Res. (2023) 84:1–6. doi: 10.2460/ajvr.22.09.0157
39. Brenner, J, Van-Haam, M, Savir, D, and Trainin, Z. The implication of BLV infection in the productivity, reproductive capacity and survival rate of a dairy cow. Vet Immunol Immunopathol. (1989) 22:299–305. doi: 10.1016/0165-2427(89)90017-2
40. Emanuelson, U, Scherling, K, and Pettersson, H. Relationships between herd bovine leukemia virus infection status and reproduction, disease incidence, and productivity in Swedish dairy herds. Prev Vet Med. (1992) 12:12, 121–131. doi: 10.1016/0167-5877(92)90075-Q
41. Pollari, FL, Wangsuphachart, VL, DiGiacomo, RF, and Evermann, JF. Effects of bovine leukemia virus infection on production and reproduction in dairy cattle. Can J Vet Res. (1992) 56:289–95.
42. D'Angelino, JL, Garcia, M, and Birgel, EH. productive and reproductive performance in cattle infected with bovine leukosis virus. J Dairy Res. (1998) 65:693–5. doi: 10.1017/s0022029998003124
43. Kakinuma, S, Maeda, Y, Ohtsuka, H, Konnai, S, and Oikawa, MA. Bovine leukemia virus titer and leukocyte population associated with mastitis in periparturient dairy cows. Int J Appl Res Vet Med. (2014) 12:239–44.
44. Frie, MC, and Coussens, PM. Bovine leukemia virus: a major silent threat to proper immune responses in cattle. Vet Immunol Immunopathol. (2015) 163:103–14. doi: 10.1016/j.vetimm.2014.11.014
45. Della Libera, AM, de Souza, FN, Batista, CF, Santos, BP, de Azevedo, LF, Sanchez, EM, et al. Effects of bovine leukemia virus infection on milk neutrophil function and the milk lymphocyte profile. Vet Res. (2015) 46:2. doi: 10.1186/s13567-014-0125-4
46. Watanabe, A, Murakami, H, Kakinuma, S, Murao, K, Oomae, K, Akamatsu, H, et al. Predicting an increased risk of severe clinical mastitis and economic loss using a threshold value of bovine leukemia virus proviral load. Am J Vet Res. (2023) 85:1–9. doi: 10.2460/ajvr.23.09.0198
47. Taxis, M, Harbowy, RM, Niles, D, Sporer, KR, and Bartlett, PC. Controlling bovine leukemia virus in a large dairy herd by selective culling based on diagnostic testing. Appl Anim Sci. (2023) 39:40–3. doi: 10.15232/aas.2022-02347
48. Nakada, S, Fujimoto, Y, Kohara, J, and Makita, K. Economic losses associated with mastitis due to bovine leukemia virus infection. J Dairy Sci. (2023) 106:576–88. doi: 10.3168/jds.2021-21722
49. Martin, P, Barkema, HW, Brito, LF, Narayana, SG, and Miglior, F. Symposium review: novel strategies to genetically improve mastitis resistance in dairy cattle. J Dairy Sci. (2018) 101:2724–36. doi: 10.3168/jds.2017-13554
50. Miyama, T, Byaruhanga, J, Okamura, I, Nagahata, H, Murata, R, Mwebembezi, W, et al. Prevalence of sub-clinical mastitis and its association with milking practices in an intensive dairy production region of Uganda. J Vet Med Sci. (2020) 82:488–93. doi: 10.1292/jvms.19-0588
51. Khasanah, H, Setyawan, HB, Yulianto, R, and Widianingrum, DC. Subclinical mastitis: prevalence and risk factors in dairy cows in East Java. Indonesia Vet World. (2021) 14:2102–8. doi: 10.14202/vetworld.2021.2102-2108
52. Duffield, TF, Lissemore, KD, McBride, BW, and Leslie, KE. Impact of hyperketonemia in early lactation dairy cows on health and production. J Dairy Sci. (2009) 92:571–80. doi: 10.3168/jds.2008-1507
53. Mekata, H, Yamamoto, M, Hayashi, T, Kirino, Y, Sekiguchi, S, Konnai, S, et al. Cattle with a low bovine leukemia virus proviral load are rarely an infectious source. Jpn J Vet Res. (2018) 66:157–63. doi: 10.14943/jjvr.66.3.157
54. Taxis, TM, DeJong, TN, Swenson, CL, Sporer, KRB, Droscha, C, Niles, D, et al. Reducing bovine leukemia virus prevalence on a large midwestern dairy farm by using lymphocyte counts, ELISA antibody testing, and proviral load. Bov Pract. (2020) 54:136–44. doi: 10.21423/bovine-vol54no2p136-144
55. Shrestha, S. Exploring the impact of bovine leukemia virus proviral load on production, and its potential use for control. [dissertation]. Calgary, Canada: University of Calgary (2024).
Keywords: BLV, proviral load, dairy cows, bovine leukosis, milk production, mastitis, reproduction
Citation: Bourassi S, McKenna S, Keefe G, John E, VanLeeuwen J, Bourassi E and McClure JT (2025) Impact of high proviral load on milk production, reproduction and subclinical diseases in dairy cows infected with bovine leukemia virus. Front. Vet. Sci. 12:1522089. doi: 10.3389/fvets.2025.1522089
Edited by:
Sharif Shafik Aly, University of California, Davis, United StatesReviewed by:
Gustavo Monti, Wageningen University and Research, NetherlandsWaseem Shaukat, University of Calgary, Canada
Copyright © 2025 Bourassi, McKenna, Keefe, John, VanLeeuwen, Bourassi and McClure. This is an open-access article distributed under the terms of the Creative Commons Attribution License (CC BY). The use, distribution or reproduction in other forums is permitted, provided the original author(s) and the copyright owner(s) are credited and that the original publication in this journal is cited, in accordance with accepted academic practice. No use, distribution or reproduction is permitted which does not comply with these terms.
*Correspondence: Simon Bourassi, c2ltb24uYm91cmFzc2lAZ21haWwuY29t