
95% of researchers rate our articles as excellent or good
Learn more about the work of our research integrity team to safeguard the quality of each article we publish.
Find out more
ORIGINAL RESEARCH article
Front. Vet. Sci. , 28 January 2025
Sec. Animal Reproduction - Theriogenology
Volume 12 - 2025 | https://doi.org/10.3389/fvets.2025.1498703
 Jiuru Yan1,2,3
 Yuxin Fu1,2,3
 Lan Lan4Huizhu Zhang1,2,3Ling Huang2,3Yaying Wang2,3
 Xianrong Xiong1,2,3Shi Yin1,2,3Jian Li1,2,3
 Honghong He1,2,3*
Introduction: In this study, we investigated the metabolic profiles of yak (Bos grunniens) follicles during the development period from the perspective of metabolomics, aiming to screen out the differential metabolites of yak follicles in different sizes and potential pathways during yak follicle development and to provide a basis for the study of follicle development and developmental mechanisms in the further stage of development.
Methods: A total of 20 four-year-old female yaks were selected, and follicles of different sizes were collected after slaughter and divided into d < 3 mm, 3–6 mm and d > 6 mm. The follicular fluid was collected, 6 replicates per group and subjected to LC–MS assay, combined with multidimensional and unidimensional statistical analyses to screen the differential metabolites between follicles of different sizes. Differential metabolites enriched KEGG pathways to screen the pathways that might be related to follicle development.
Results: We found that most of the metabolites were mainly enriched in amino acid metabolism pathways, energy metabolism pathways and other pathways of cofactor synthesis, and that during the development of the small follicle to the large follicle, 2-Lysophosphatidylcholine, PC (17:0/0:0), PC (16:0/0:0), and LysoPC (18:0/0:0) were down-regulated; Dioctyl succinate, P-Coumaraldehyde, ISOPRENE, L-Isoleucine, Dioctyl succinate up-regulated.
Conclusion: These results suggest that amino acid metabolism, the production of steroid hormones and their metabolites, and the metabolic activity of granulosa cells play important roles in follicle development. The results provide a theoretical basis for further exploration of follicular development in yak.
The yak is the traditional livestock of the Chinese highlands. However, the reproductive efficiency of yaks is low, usually one or two births every 2 years or two births every 3 years. The important reason that affects reproductive efficiency is the number of follicles ovulated in the ovary. Differentiate and release mature oocytes for fertilization and the successful continuation of the species (1). There are numerous follicles in the ovary, the follicle is the functional unit of the ovary, consisting of an oocyte that is surrounded by granulosa cells and theca cells (2), granulosa cell metabolism is essential for the maintenance of normal fertility, and metabolic changes can regulate follicular and oocyte development by modulating granulosa cell energy metabolism, proliferation, autophagy, and the production of steroid hormones and their metabolites (3). Whereas the glycolytic pathway is the main source of energy for follicular granulosa cells as well as for oocytes, which have a limited capacity to utilize glucose, pyruvate and lactate are the main sources of energy metabolism for granulosa cells, and thus lipid metabolism in granulosa cells is critical during oocyte maturation (4). And oocyte growth depends on the function of follicular cells such as granulosa and theca cells (5). The follicular fluid is an essential microenvironment for oocyte survival, which contains cytokines, hormones and other mediators associated with oocyte maturation and ovarian function. The composition and the levels of these mediators are associated with oocyte fertilization and follicle maturation (6, 7). Not only that, but also the regulatory mechanism of follicle formation, activation and growth is closely related to the complex interaction between local paracrine/autocrine factors and follicular endocrine hormones (8). Folliculogenesis begins with the activation of primordial follicles and their transition to primary follicles, during each estrous cycle or interovulatory interval (IOI). Ovulation occurs from wave 2 in the two-wave IOI and wave 3 in the three-wave IOI (9). A adominant follicle develops during each wave through a process of diameter deviation and selection (10). Only a few dominant follicles can mature to ovulation, while most follicles eventually undergo follicular atresia.
The metabolic factors in the follicular fluid also play a crucial role in the process of follicular development and atresia, metabolites are building blocks of cellular function. Many of the dynamic processes that occur during oocyte growth and maturation require energy, oocytes and follicles can use multisubstances to support their energetic and anabolic needs. These species are involved in enzyme catalyzed chemical reactions and are essential for cellular function (11). Such as NADH/NAD+ ratio, which has a significant impact on energy. NADH is naturally autofluorescent, and previous studies have established that fluorescence measurements of free and bound forms of NADH can be utilized to deduce cellular metabolism production, cell survival, proliferation, longevity, and aging (12–14). These studies suggest that these factors also play a very important role in the process of follicular development.
Metabolites are the result of both biological and environmental factors providing great potential to connect knowledge of genotype and phenotype (15). In order to detect metabolites in cells and reflect the true functional state of biological systems, Nicholson first proposed the concept of metabolomics in 1999. With the development of metabolomics, detection technology has been improved to detect more and more metabolites accurately. Metabolomics has a variety of separation and detection techniques including liquid chromatography (LC), gas chromatography (GC), capillary electrophoresis (CE), mass spectrometry (MS) and nuclear magnetic resonance (NMR). One of the most commonly used detection techniques is liquid chromatography-mass spectrometry (LC–MS). The small molecule metabolites in specific biological samples are quantitatively and qualitatively analyzed using a variety of analytical methods. It can dynamically monitor the changes of metabolites in the body caused by internal and external factors. Metabolomics is a downstream complement to genomics, transcriptomics and proteomics and is the gold standard for analysing metabolic differences (16), and comprehensively and systematically study the metabolic characteristics of organisms (17). In this study, yak follicles were classified according to their diameter. Different sizes of metabolites within the follicles were detected by LC–MS to explore the differences of metabolites in varying sizes of yak follicles, and to find the potential pathway of follicle development, providing a theoretical basis for improving the reproductive performance.
All experimental animals were obtained, retained and slaughtered in accordance with local laws and regulations in Sichuan Province, China. Thirty healthy 4-year-old yaks in oestrus were randomly selected for slaughter. Ovaries were isolated, and the fat and connective tissue around the ovaries were cut off with sterile scissors. A total of 60 ovaries were collected and carefully washed with saline to prevent follicle rupture. Ovaries were placed in 37°C saline with penicillin and streptomycin added and transported back to the laboratory within 6 h. Ovaries were washed again with saline at 37°C and processed on an ultraclean table. On average, there were 7 follicles per ovary. Follicles of different sizes were measured and categorized into d < 3 mm, 3–6 mm and d > 6 mm in diameter, with six replicates in each group, and the follicular fluid was extracted with a syringe and placed in freezing tubes and preserved in liquid nitrogen to prepare for subsequent metabolomics assays.
Taken 150 μL sample to 1.5 mL and add 600 μL extract [methanol/acetonitrile = 1:1:Acetonitrile =1:1 (v:v)], including four internal standards [L-2-chlorophenylalanine (0.02 mg/mL), etc.], vortex mix for 30 s, sonicate at low temperature for 30 min (5°C, 40 HZ) and leave the sample at −20°C for 30 min. Centrifuge for 15 min (13,000 g, 4°C), remove the supernatant and dry with nitrogen; add 120 μL complex solution (acetonitrile: water = 1: 1) to redissolve; vortex mixing for 30 s, low temperature ultrasonic extraction for 5 min (5°C, 40 KHz); centrifuge for 10 min (13,000 g, 4°C), remove the supernatant into the injection vial with internal intubation for machine analysis; in addition, each sample was removed and mixed with 20 μL of supernatant for quality control.
Quality control (QC) samples were prepared by mixing the extraction liquid of all samples in equal volume, the body of each QC is the same as the sample, treated and detected in the same way as the analytical sample, in the course of instrumental analysis, every 5–15 analyses a QC sample is inserted into the sample to examine the stability of the entire testing process.
The instrument platform for this LC–MS analysis is the Thermo Feld Ultra High Performance Liquid Chromatography-Tandem Fourier Transform Mass Spectrometry UHPLC-Exploris 240 system.
Chromatographic conditions: The chromatographic column was an ACQUITY UPLC HSS T3 (100 mm × 2.1 mm i.d., 1.8 μm, Waters, Milford, USA); mobile phase A is 95% water +5% acetonitrile (containing 0.1% formic acid), and mobile phase B is 47.5% acetonitrile +47.5% isopropyl alcohol +5% water (containing 0.1% formic acid). The sample size was 3 μL, and the column temperature was 40°C.
Mass spectrometry conditions: Samples were ionized by electrospray, and mass spectrum signals were collected by positive and negative ion scanning modes, respectively. Specific parameters are listed in Table 1.
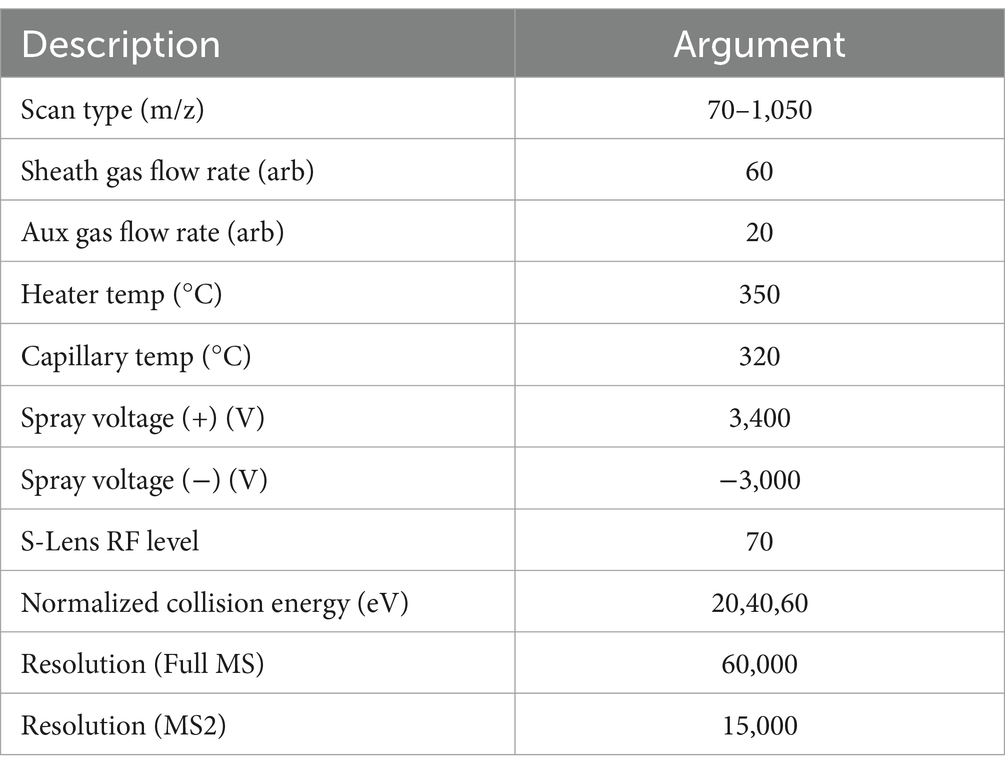
Table 1. Mass spectrum parameter.
The original data were imported into the metabolomics processing software Progenesis QI (Waters Corporation, Milford, USA). Line filtering, peak identification, integration, retention time correction, peak alignment and so on, and finally the retention time, mass charge ratio and peak intensity are obtained. Data matrix of information. Then the software was used to identify the characteristic peak database, and the MS and MS/MS mass spectrum information was combined with the metabolite number. The MS mass error was set to <10 ppm, and the metabolites were identified according to the secondary mass spectrometry matching score. The main database for http://www.hmdb.ca/, https://metlin.scripps.edu/, and other mainstream public databases and self-created databases.
By plotting the relative standard deviation (RSD) of positive and negative ions in QC samples, it can be seen from Figures 1A,B that the RSD of positive and negative ions mode is <30%, and the cumulative proportion of peaks is >70%, indicating that the overall data is qualified, and the test results can be used for further analysis.
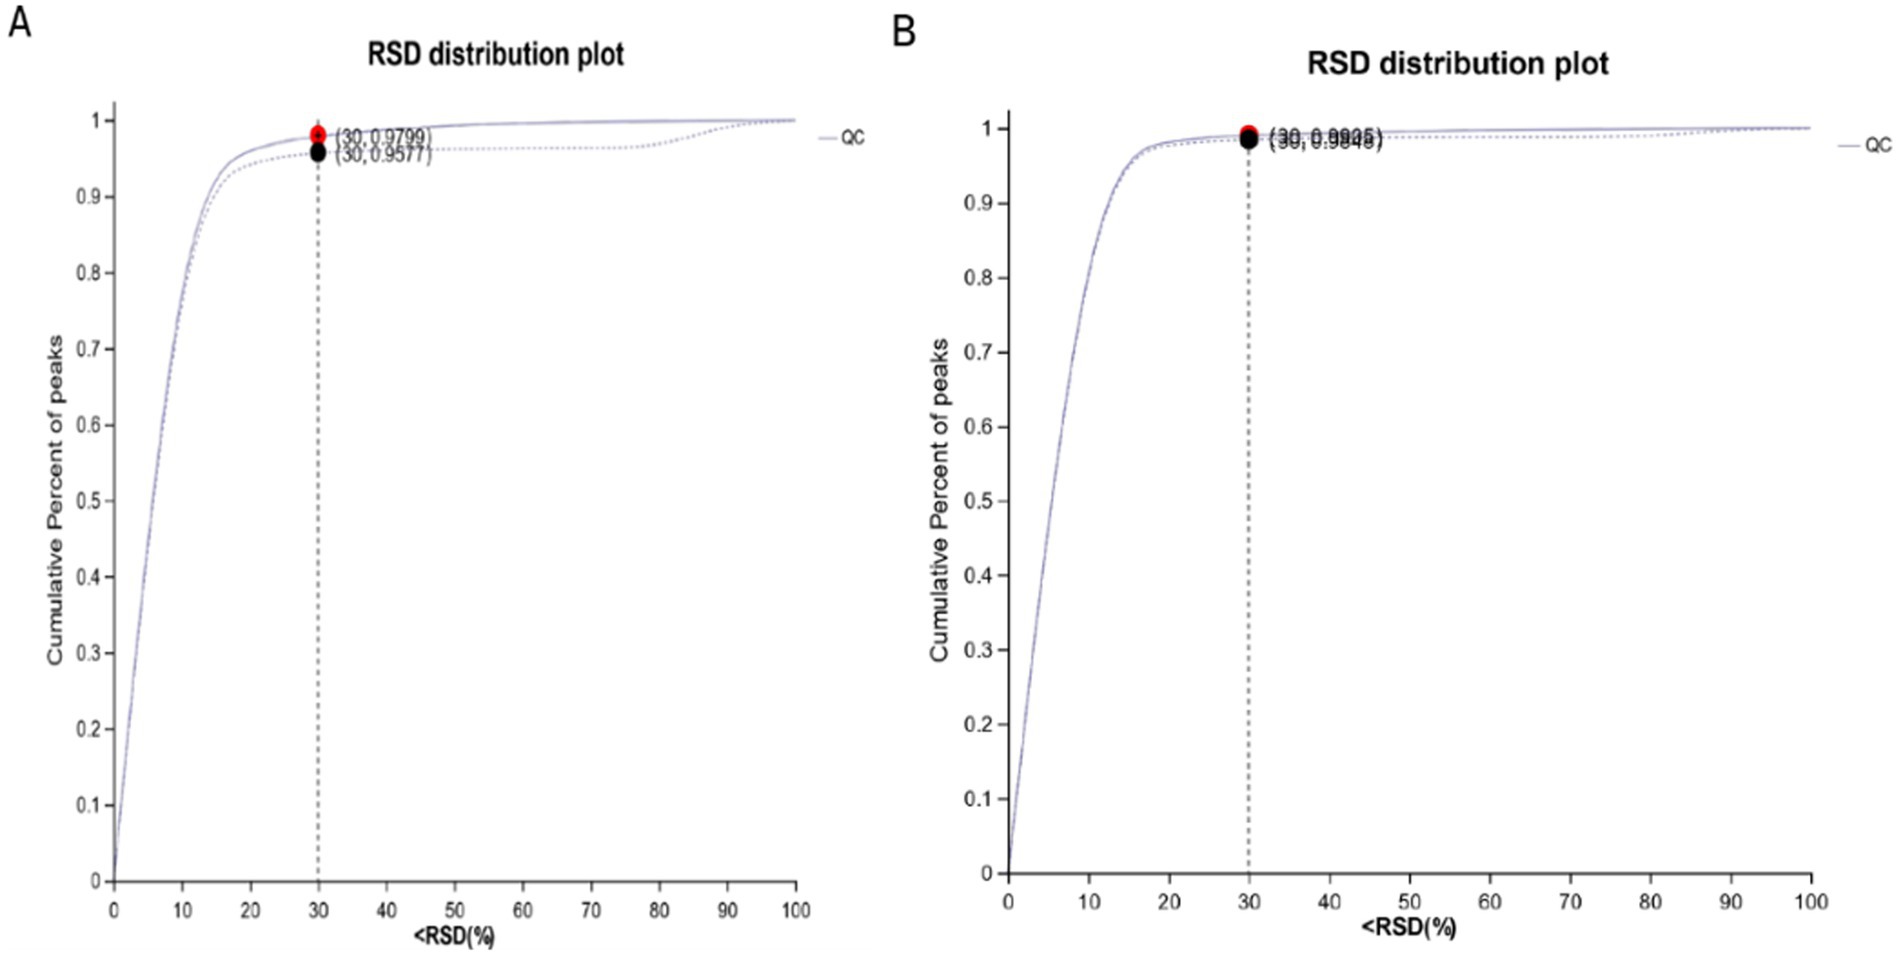
Figure 1. RSD diagram of QC sample. (A) RSD diagram of QC sample in cationic mode; (B) RSD diagram of QC sample in anionic mode.
PCA analysis can observe the trend of inter-group separation in the experimental model and whether there are any anomalies, and reflect the inter-group and intra-group variability of the original data. As shown in the Figure 2, in the positive ion mode (A) and the negative ion mode (B), R2X (the explanation of the difference in the X variable of the model) is 0.383 and 0.449, respectively. All QC samples are closely clustered, and all samples are within the 95% confidence interval, which proves that the repeatability of this experiment is good, the operation of the instrument and the analysis system are stable, and the data are reliable (Table 2).
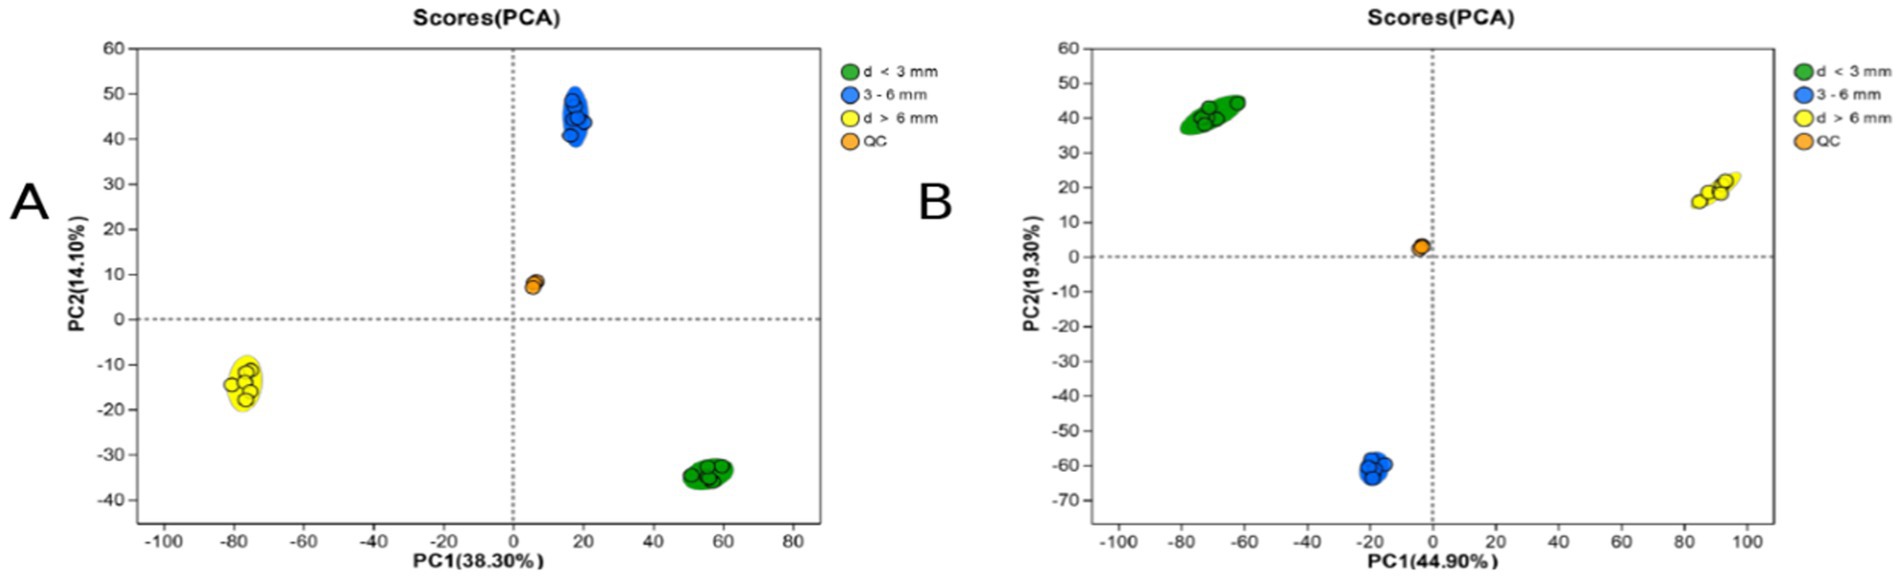
Figure 2. PCA scores for each subgroup. (A) PCA scores for each subgroup and the QC sample in ESI (+) mode; (B) PCA scores for each subgroup and the QC sample in ESI (−) mode.
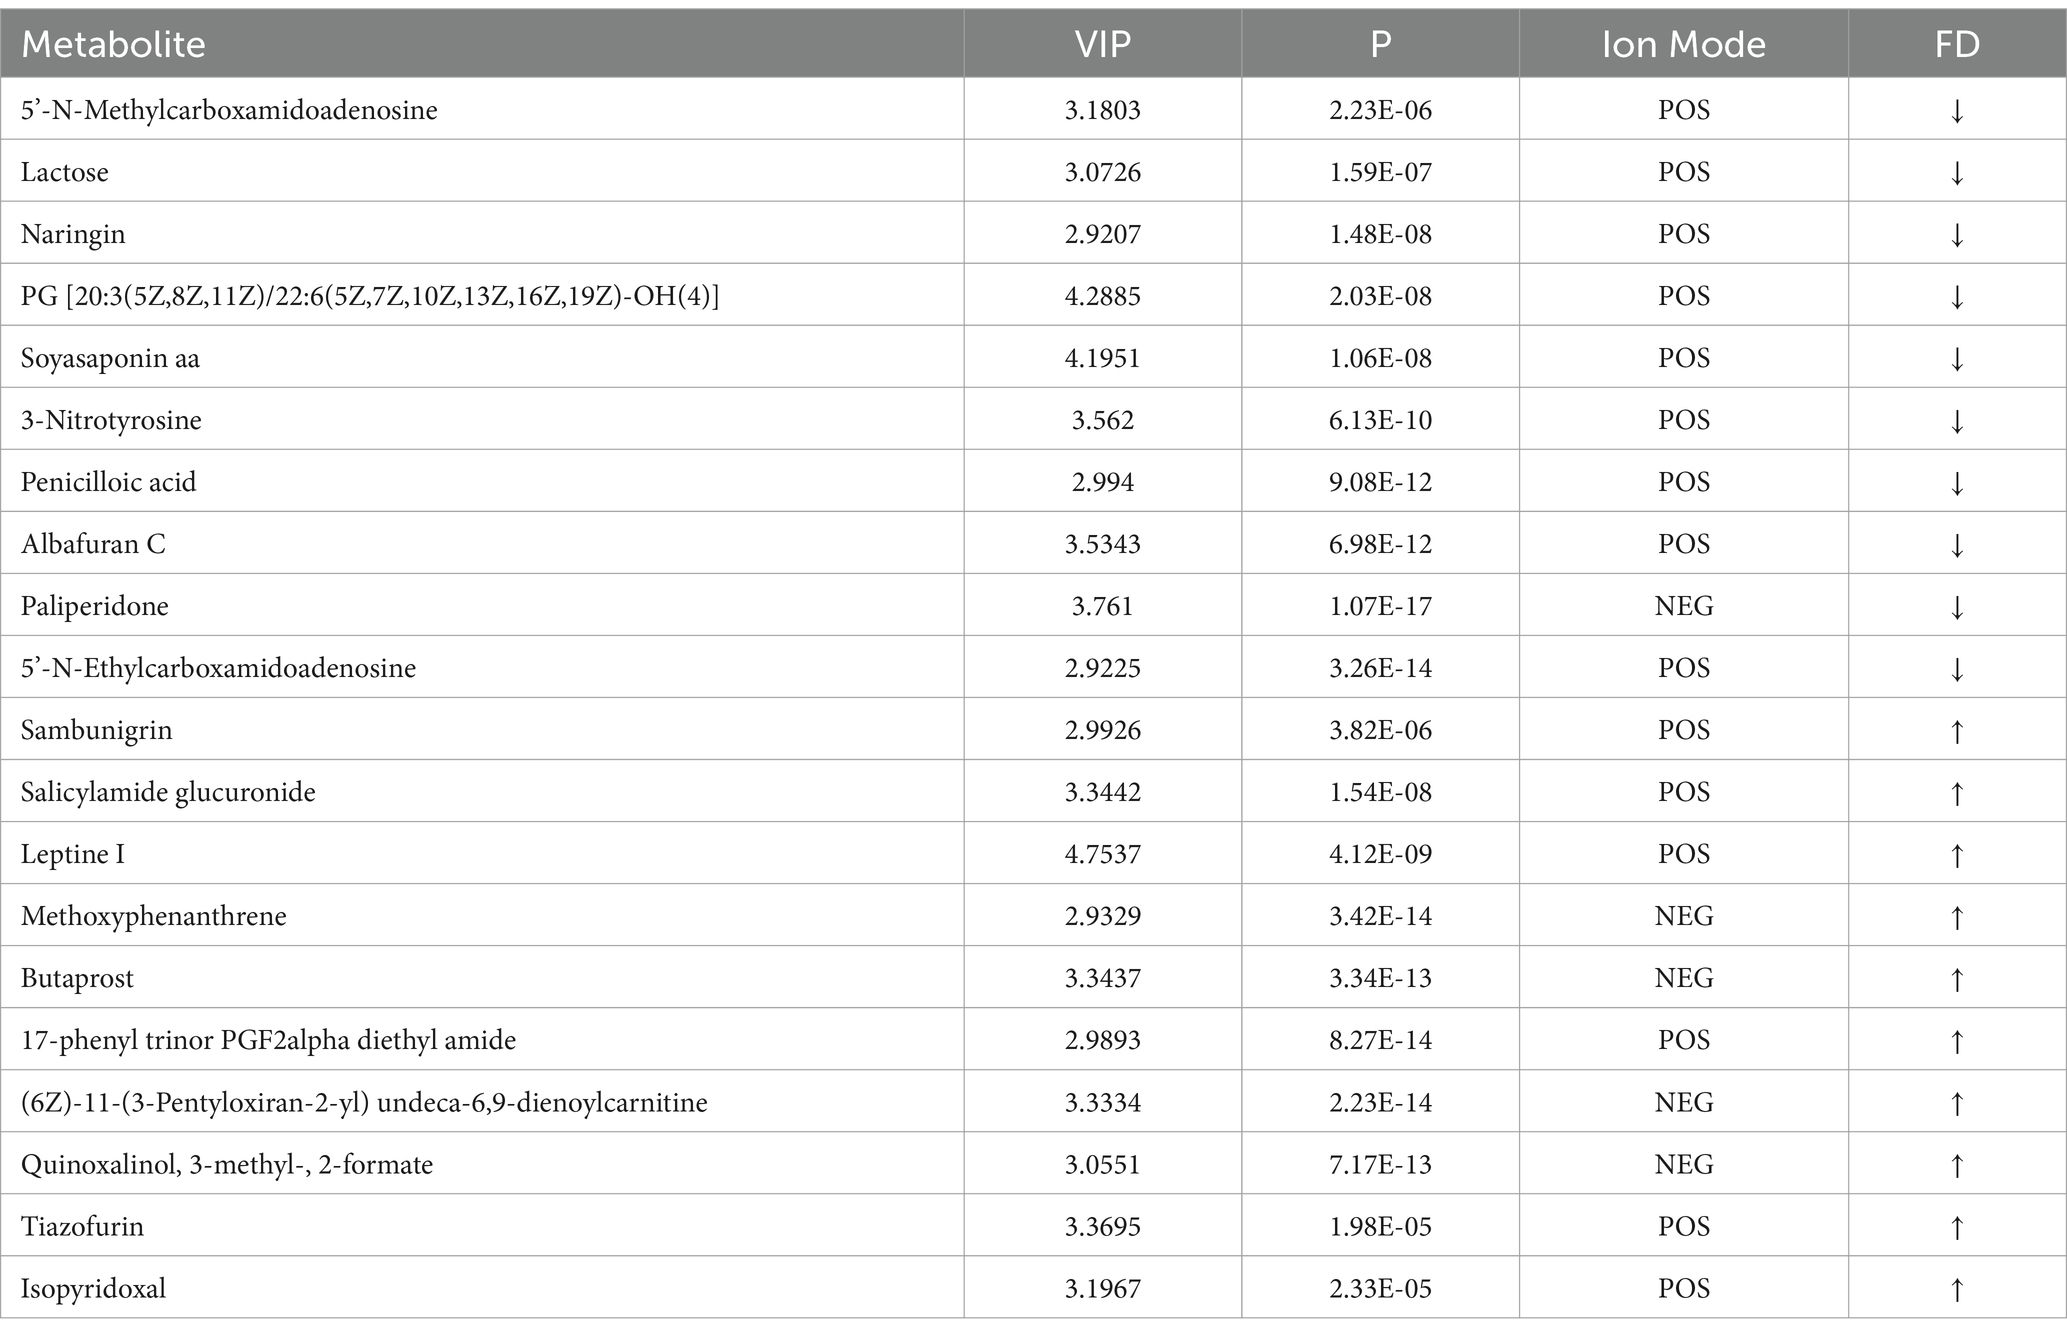
Table 2. Top 20 differential metabolites in d < 3 mm vs. 3–6 mm.
PLS-DA score is partial least square discriminant analysis, which is a discriminant analysis method in multivariate data analysis technology. The PLS-DA score map is commonly used to visually show the classification effect of the model, which can eliminate irrelevant systematic errors and improve the difference between the two groups. The greater the degree of separation of the two groups of samples in the differential metabolite map, the more significant the classification effect. As can be seen from the Figure 3, the degree of separation of the samples was >50%, indicating that the classification of the follicles was accurate, similar within the same group, and highly reproducible (Table 3).
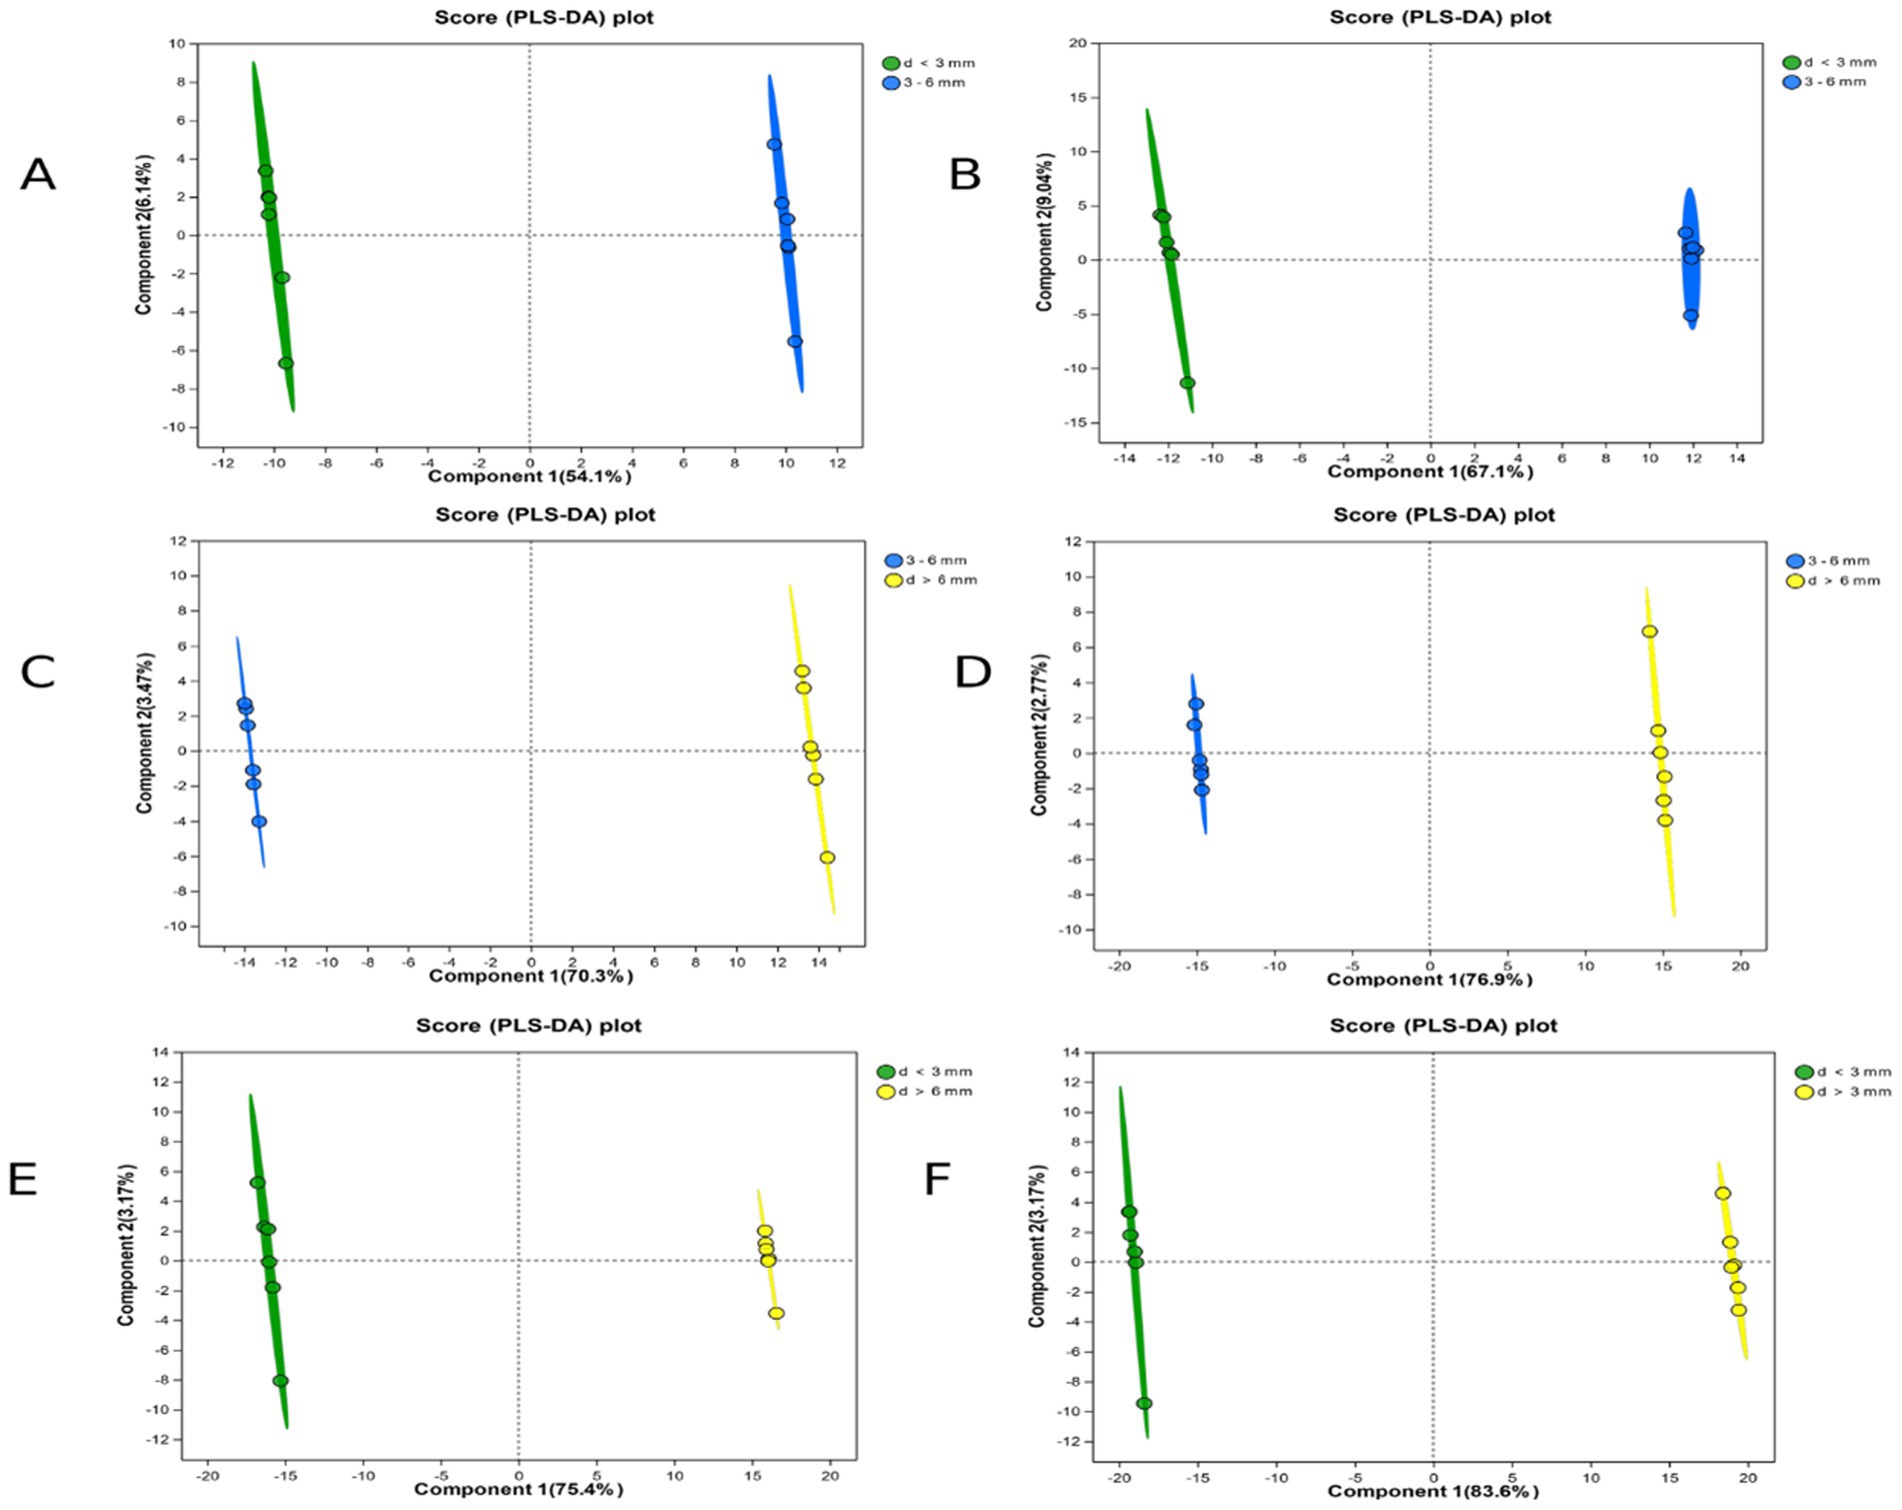
Figure 3. PLS-DA scores for each group in ESI(+) and ESI(−) mode. (A) d < 3 mm and 3–6 mm PLS-DA scores in ESI(+) mode; (B) d < 3 mm and 3–6 mm PLS-DA scores in ESI(−) mode; (C) 3–6 mm and d > 6 mm PLS-DA scores in ESI(+) mode; (D) 3–6 mm and d > 6 mm PLS-DA scores in ESI(−) mode; (E) d < 3 mm and d > 6 mm PLS-DA scores in ESI(+) mode; (F) d < 3 mm and d > 6 mm PLS-DA scores in ESI(−) mode.
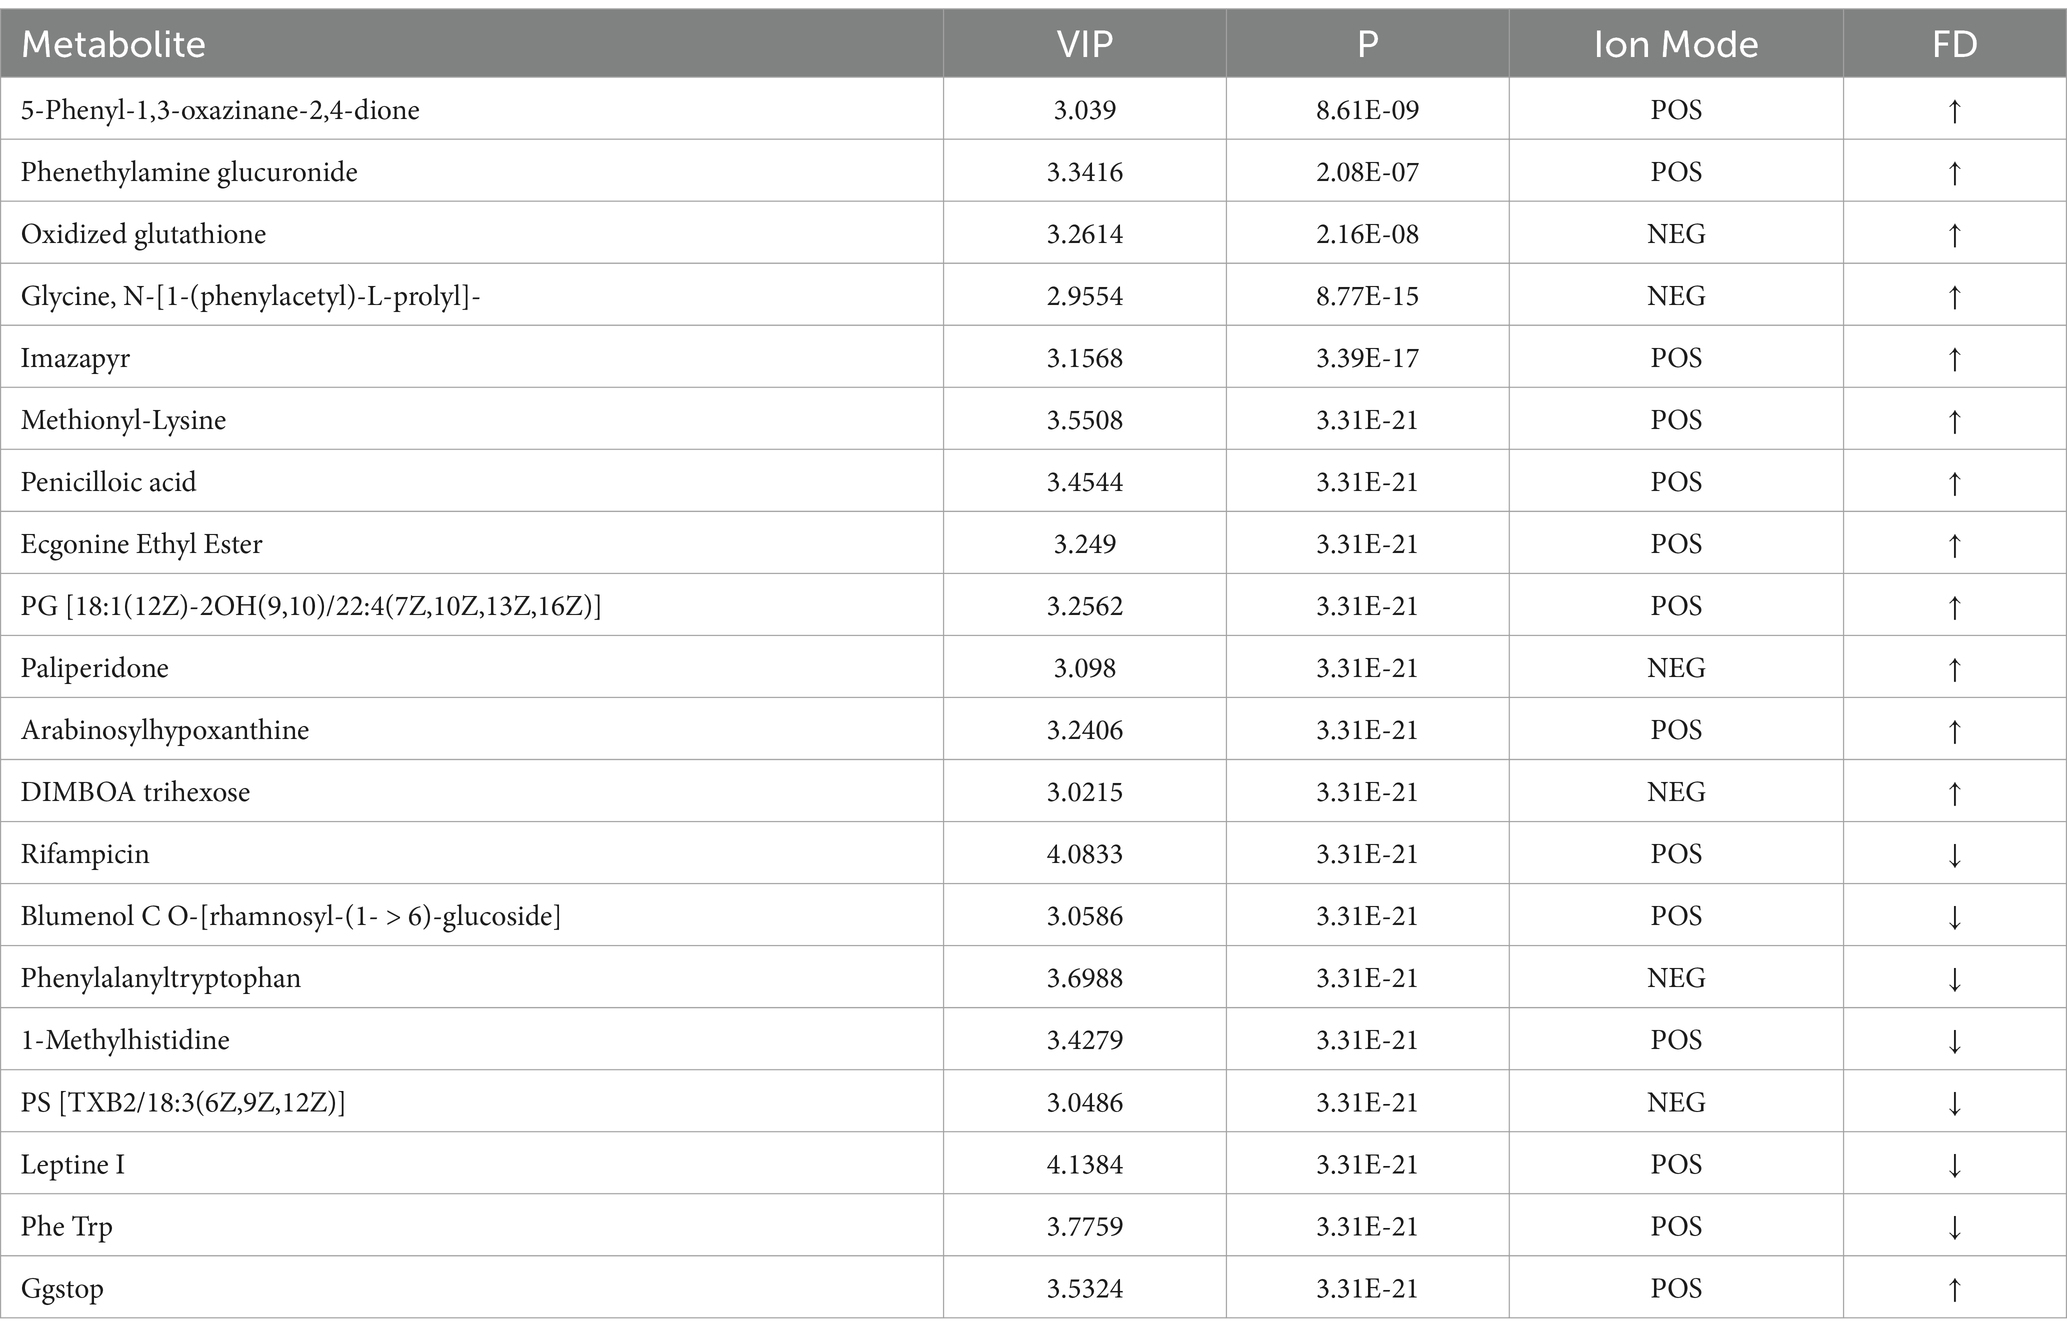
Table 3. Top 20 differential metabolites in 3–6 mm vs. d > 6 mm.
In this experiment, the PLS-DA model was used to calculate the projected importance of variables (VIP) and the T-test was used to screen the differential metabolites. By setting VIP > 1, p < 0.05, in Figure 4A, a total of 361 differential metabolites were screened in d < 3 mm and 3–6 mm under ESI (+) mode. Compared to 3–6 mm, 184 metabolites were up-regulated and 177 metabolites were down-regulated in d < 3 mm. In Figure 4B, a total of 386 different metabolites were screened in ESI (−) mode, of which 161 metabolites were up-regulated and 225 metabolites were down-regulated in the 3–6 mm range, d < 3 mm.
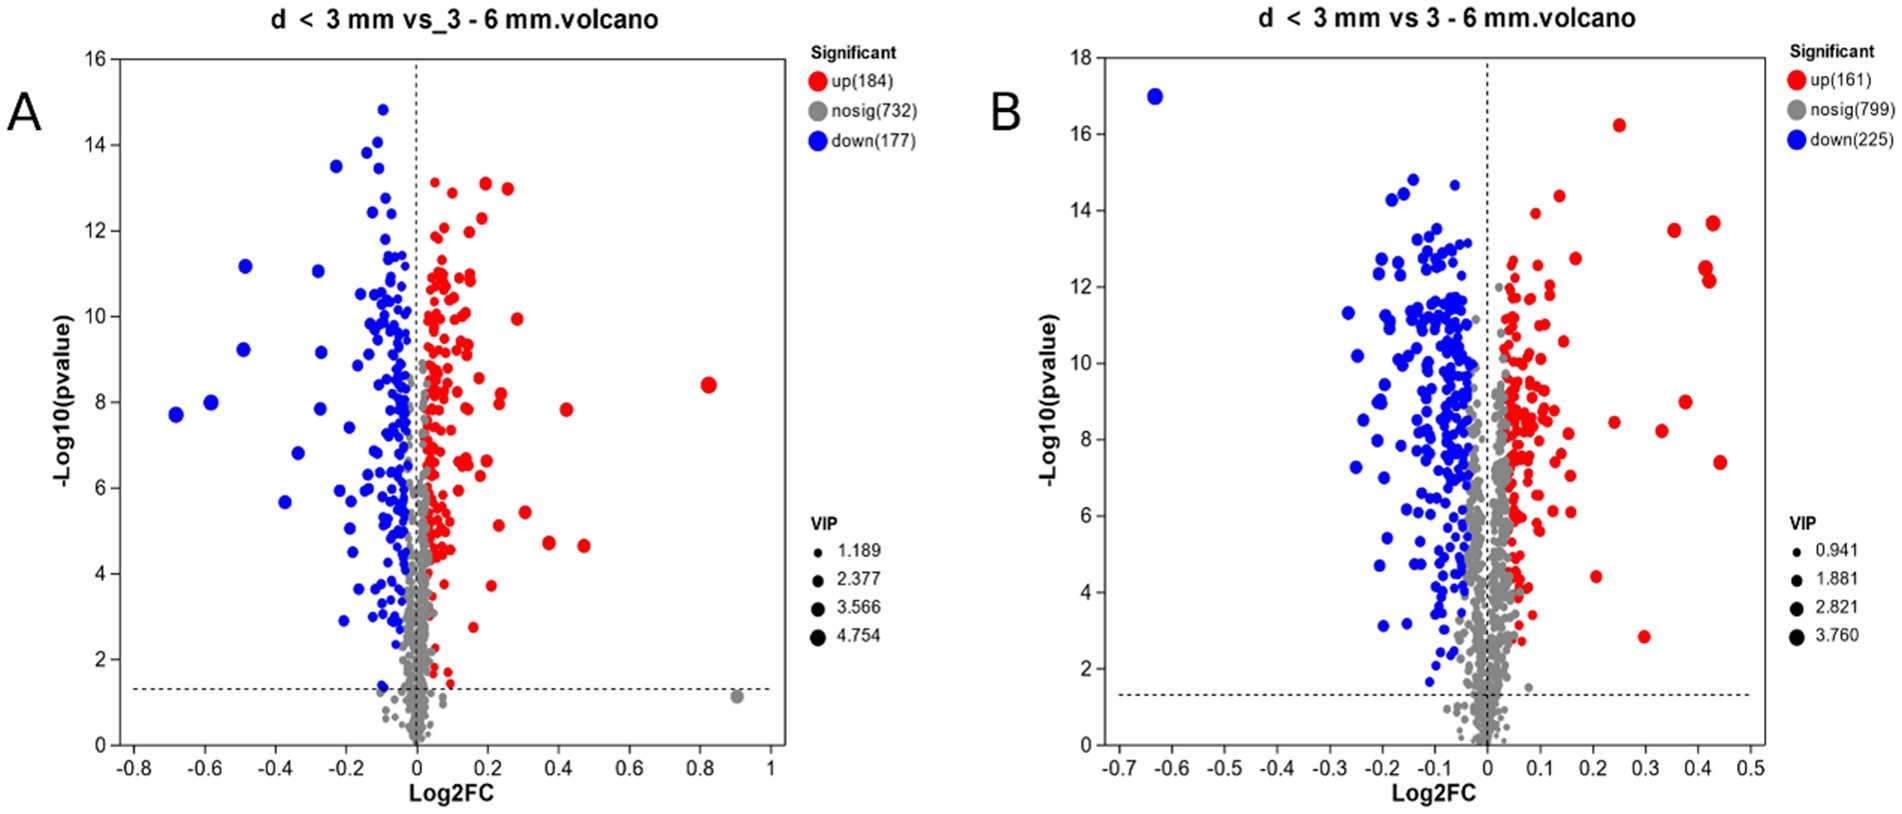
Figure 4. d < 3 mm vs. 3–6 mm metabolic sets in ESI(+) and ESI(−) mode. (A) d < 3 mm vs. 3–6 mm metabolic sets in ESI(+) mode; (B) d < 3 mm vs. 3–6 mm metabolic sets in ESI(−) mode.
In ESI (+) mode, in Figure 5A, a total of 427 different metabolites were screened in 3–6 mm and d > 6 mm, compared to d > 6 mm, in 3–6 mm, 324 metabolites were up-regulated and 103 metabolites were down-regulated. In Figure 5B, a total of 454 different metabolites were screened in ESI (−) mode, of which 306 metabolites were up-regulated and 148 metabolites were down-regulated in 3–6 mm compared to d > 6 mm.
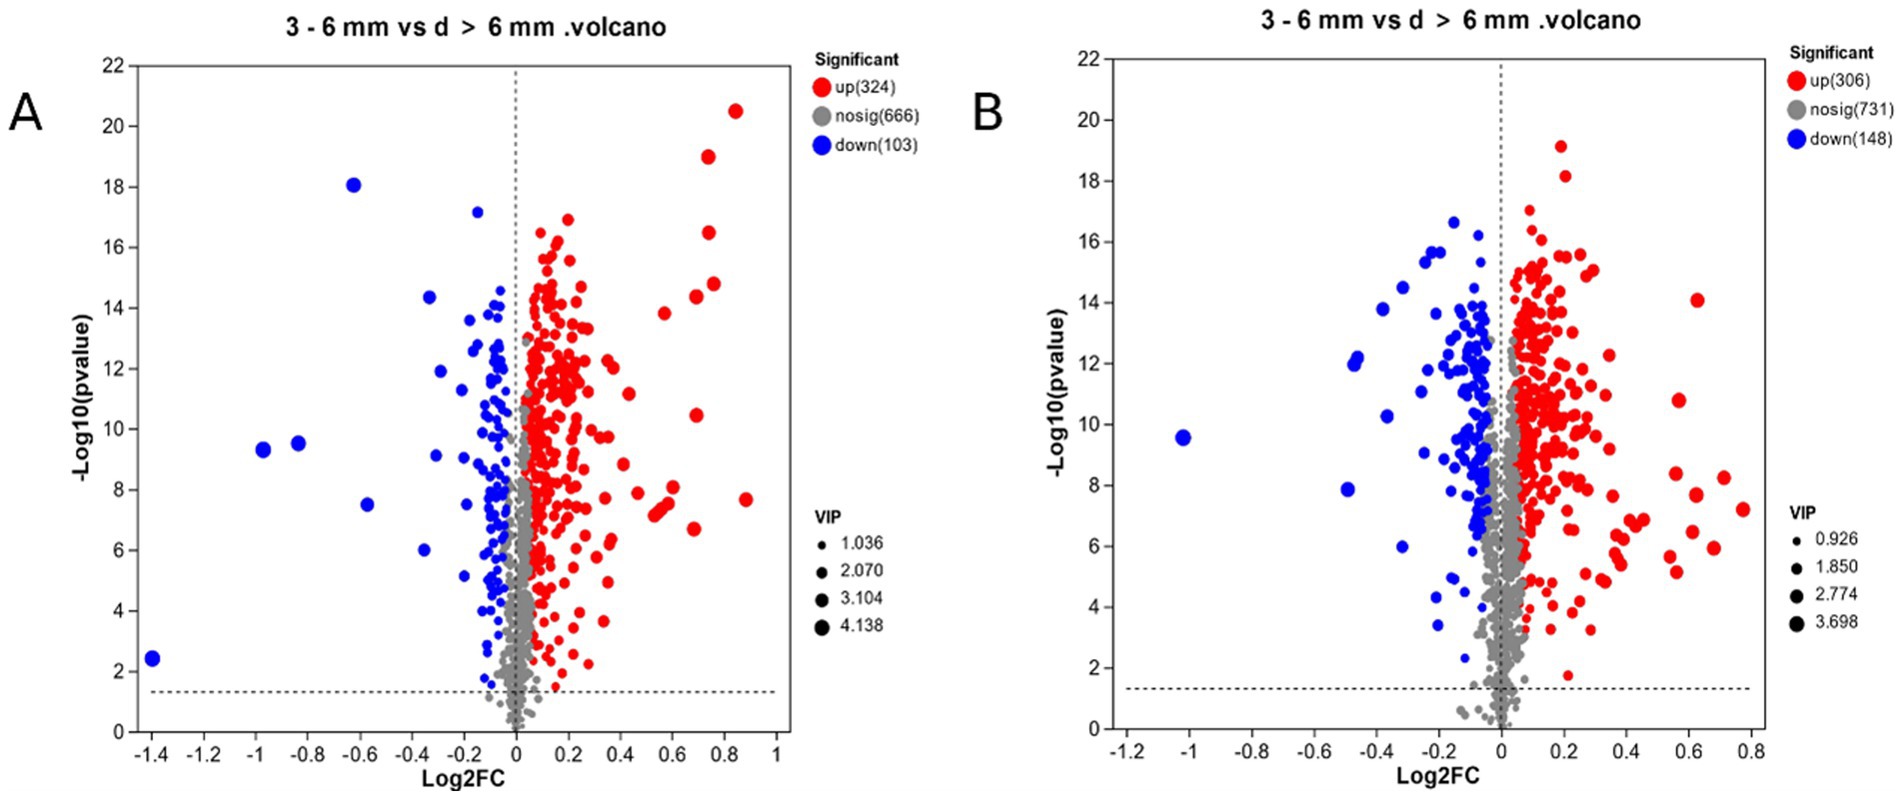
Figure 5. 3–6 mm vs. d > 6 mm metabolic sets in ESI(+) and ESI(−) mode. (A) 3–6 mm vs. d > 6 mm metabolic sets in ESI(+) mode; (B) 3–6 mm vs. d > 6 mm metabolic sets in ESI(−) mode.
In Tables 2, 3, by setting VIP > 1 and p < 0.05, the top 20 differential metabolites in d < 3 mm vs. 3–6 mm and 3–6 mm vs. d > 6 mm were screened.
The different metabolites in the two comparison groups were collected and combined, and a Venn diagram (Figure 6) was constructed for the metabolic set to show the common and unique metabolites of each metabolic set. The overlapping part represented the number of metabolites shared by multiple metabolic sets, while the non-overlapping part represented the number of metabolites unique to the metabolic set, and the number represented the corresponding metabolite number. The bar graph shows the number of metabolites contained in each metabolic set. In Figure 6, a total of 747 differential metabolites were found in d < 3 mm and 3–6 mm, and a total of 881 differential metabolites were found in 3–6 mm and d > 6 mm, and by comparing these two groups of differential metabolites, 428 differential metabolites were found together.
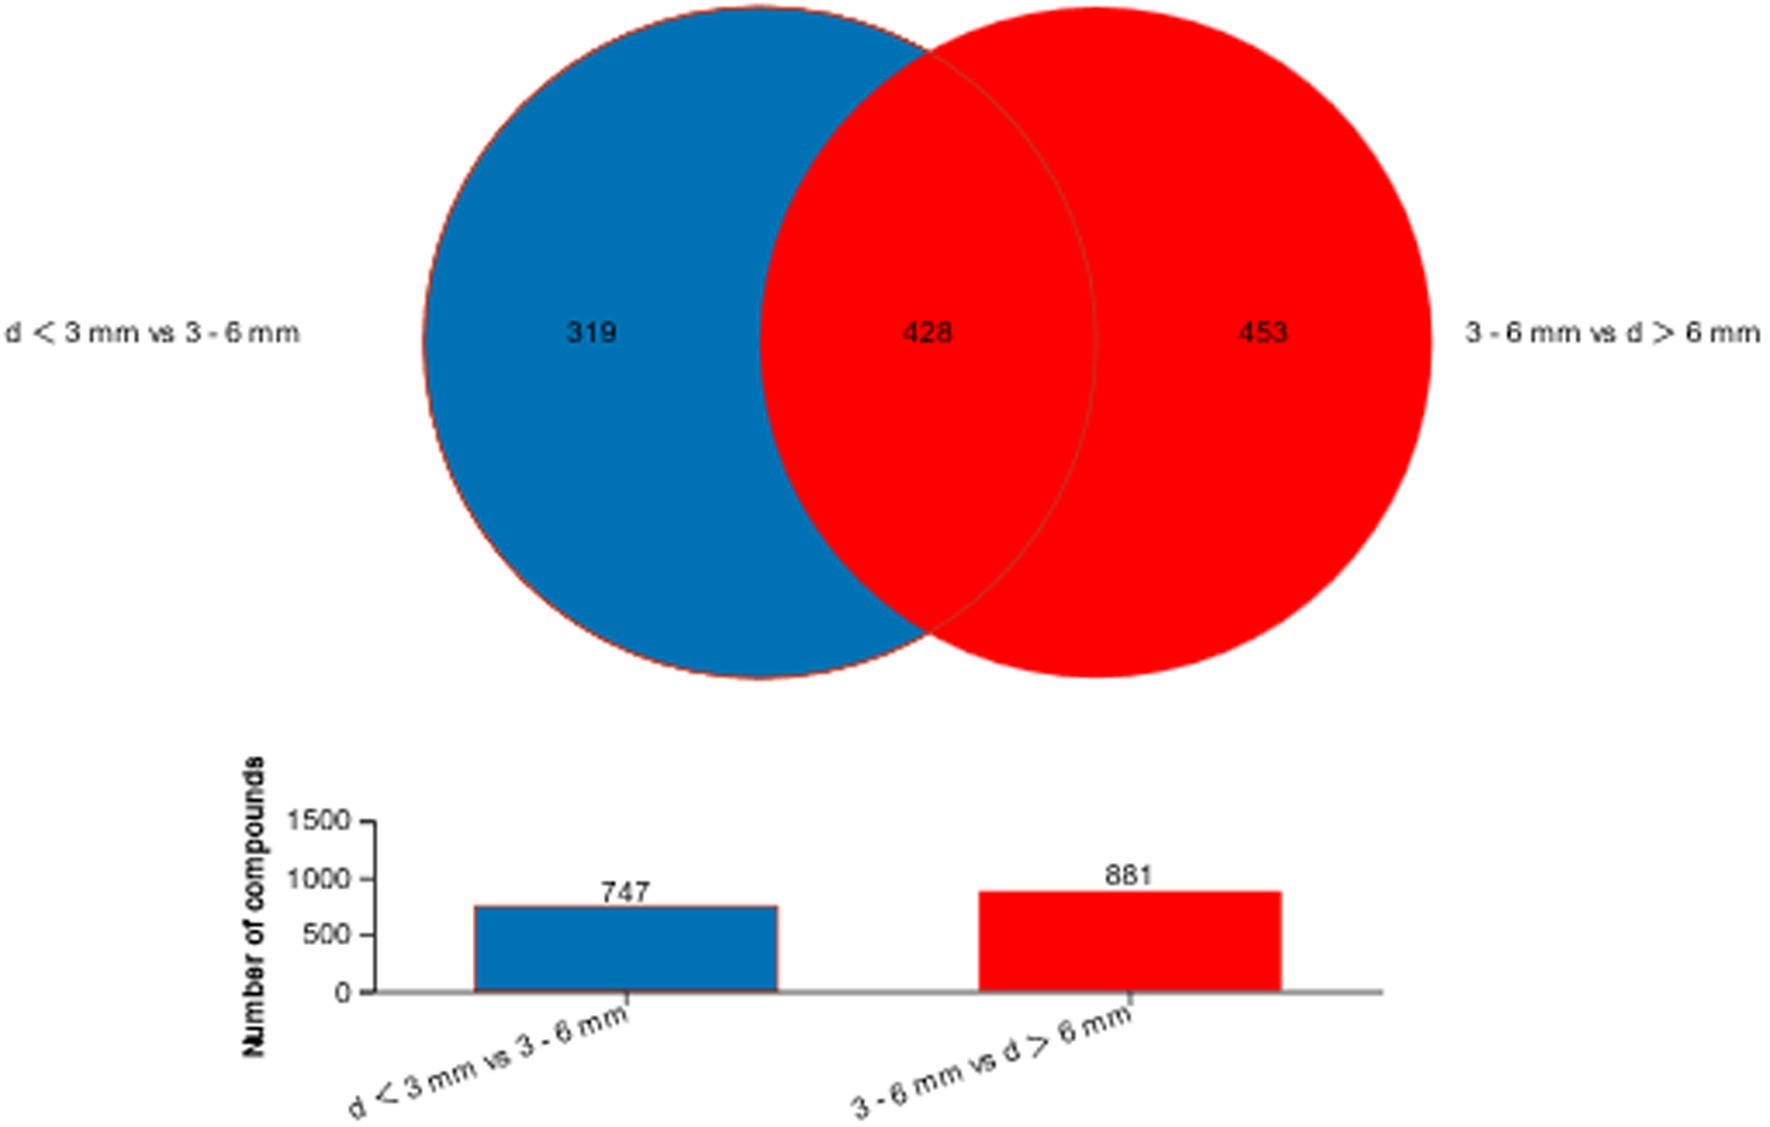
Figure 6. Venn diagram of d < 3 mm vs. 3–6 mm metabolic set vs. d > 6 mm vs. 3–6 mm metabolic set.
In Figure 7, through the cluster analysis of differential metabolites, the expression of different metabolites in different samples can be intuitively expressed, as shown in the figure. It can be seen from the figure that all samples can be separated, and the differential metabolites in the same group have similar expression patterns, indicating that the classification of follicles is accurate and there is no difference. As follicle diameter increased, 2-Lysophosphatidylcholine, PC (17:0/0:0), PC (16:0/0:0), and LysoPC (18:0/0:0) were down-regulated; Dioctyl succinate, P-Coumaraldehyde, ISOPRENE, L-Isoleucine, Dioctyl succinate up-regulated.
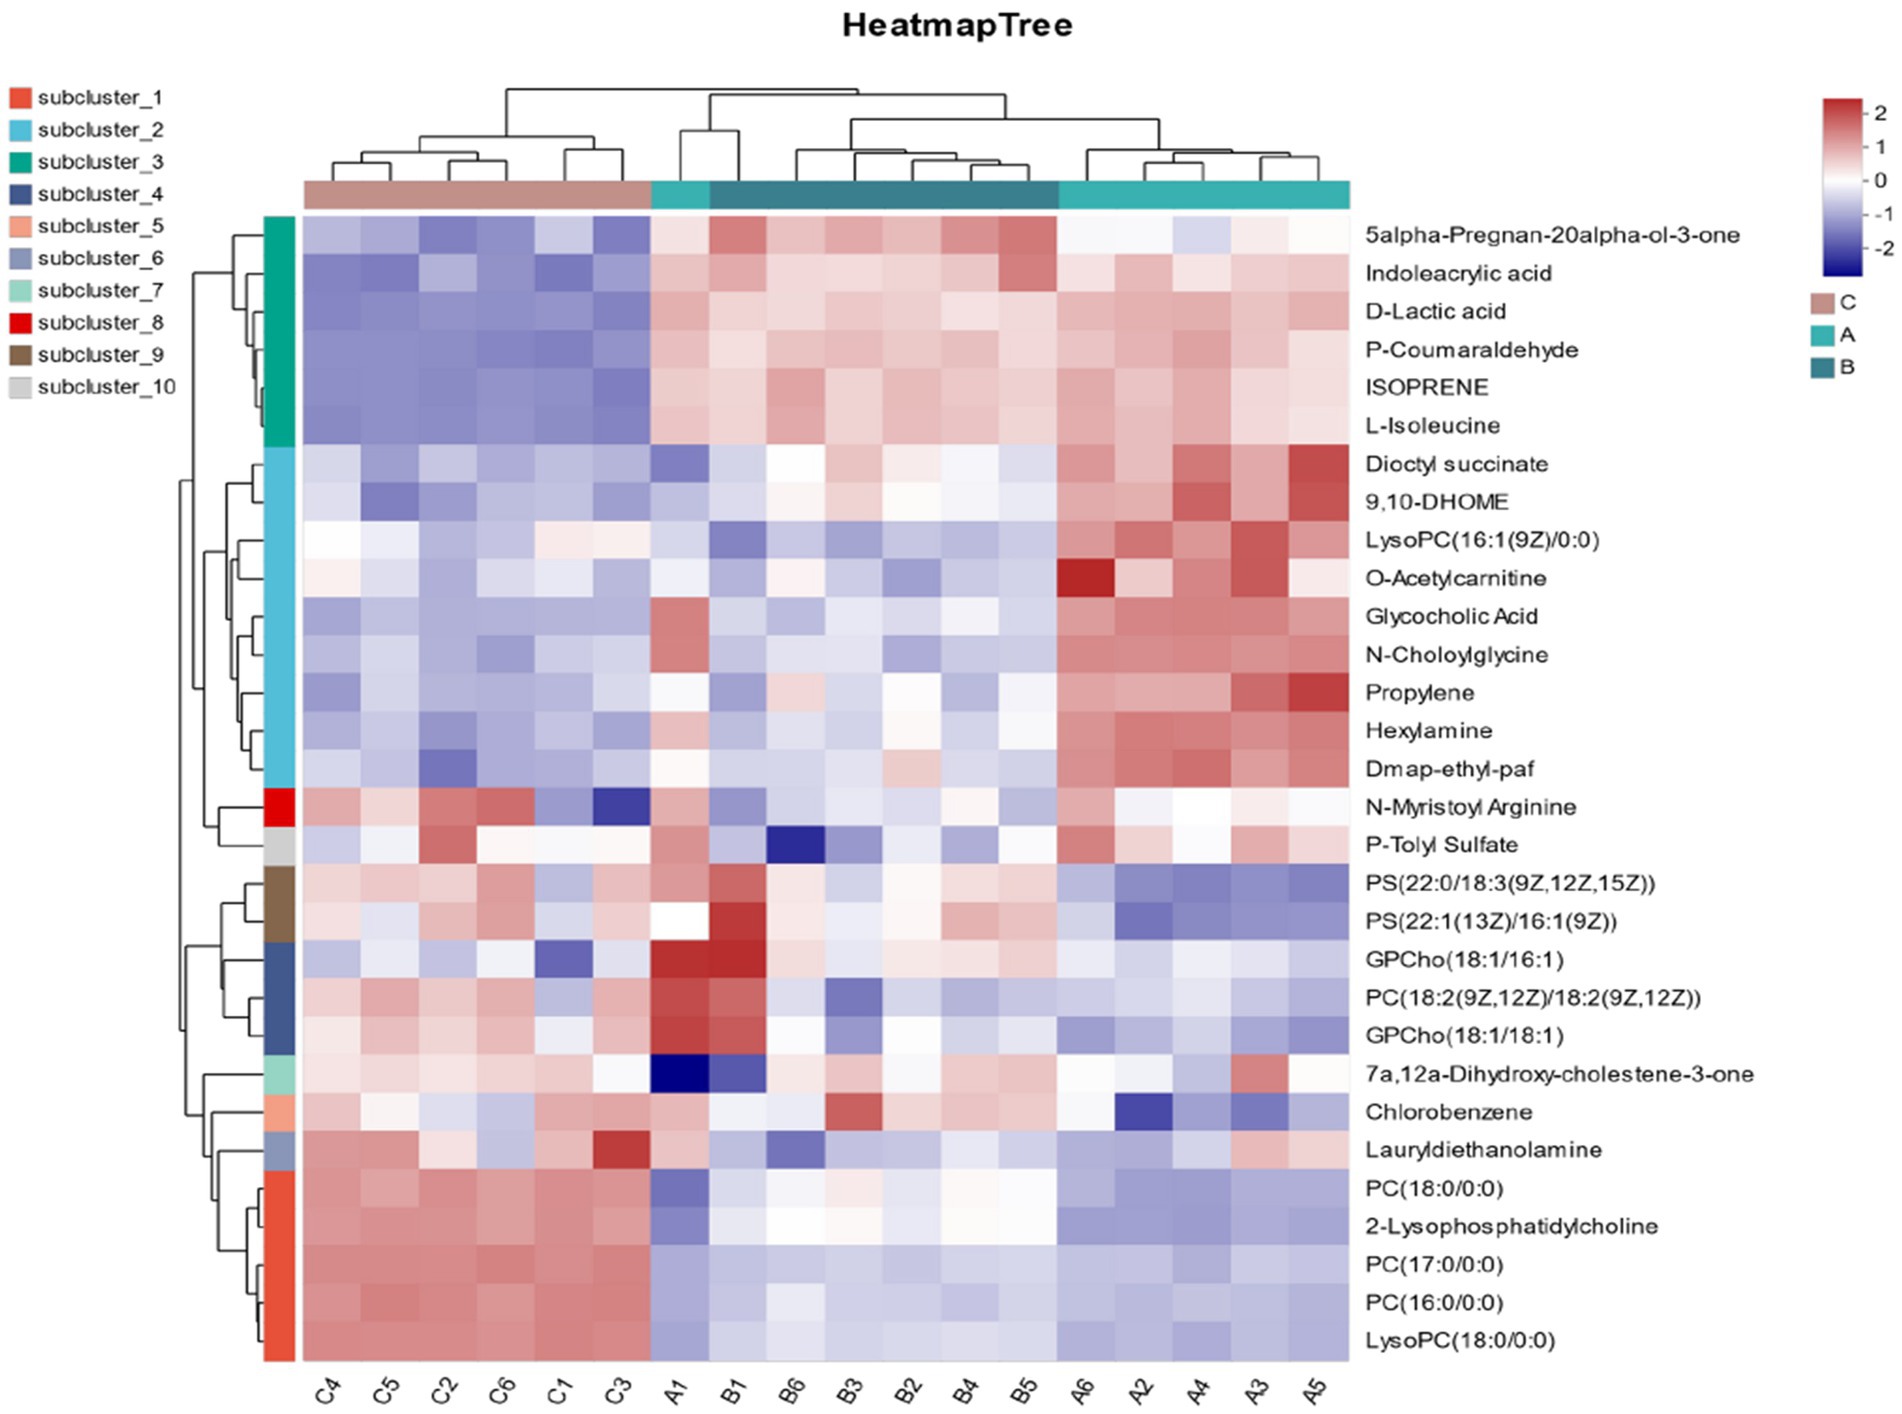
Figure 7. Metabolite cluster analysis. A represents follicle d < 3 mm. B represents 3–6 mm, C represents d > 6 mm.
Enrichment analysis of the differential metabolites of d < 3 mm and 3–6 mm and 3–6 mm and d > 6 mm was performed. The hypergeometric distribution algorithm was used to obtain the path of significant enrichment of metabolites in the metabolic concentration. The BH method was used to correct the p-value. Screening for significant enrichment pathways. In Figure 8A, it was found that the different metabolites in follicles with d < 3 mm and 3–6 mm were mainly enriched in vitamin B6 metabolism, glycerol-phospholipid metabolism, cofactor biosynthesis, choline metabolism, amino acid metabolism and nucleotide metabolism. In Figure 8B, different metabolites in follicles of 3–6 mm and d > 6 mm were mainly concentrated in taurine metabolism, amino acid metabolism, nucleotide metabolism, choline metabolism, vitamin digestion and absorption, bile secretion and ABC transporter. In Figure 8C, different metabolites in follicles with d < 3 mm and d > 6 mm were mainly concentrated in amino acid metabolism, nucleotide metabolism, choline metabolism, ABC transporter and adipocyte lipolysis.
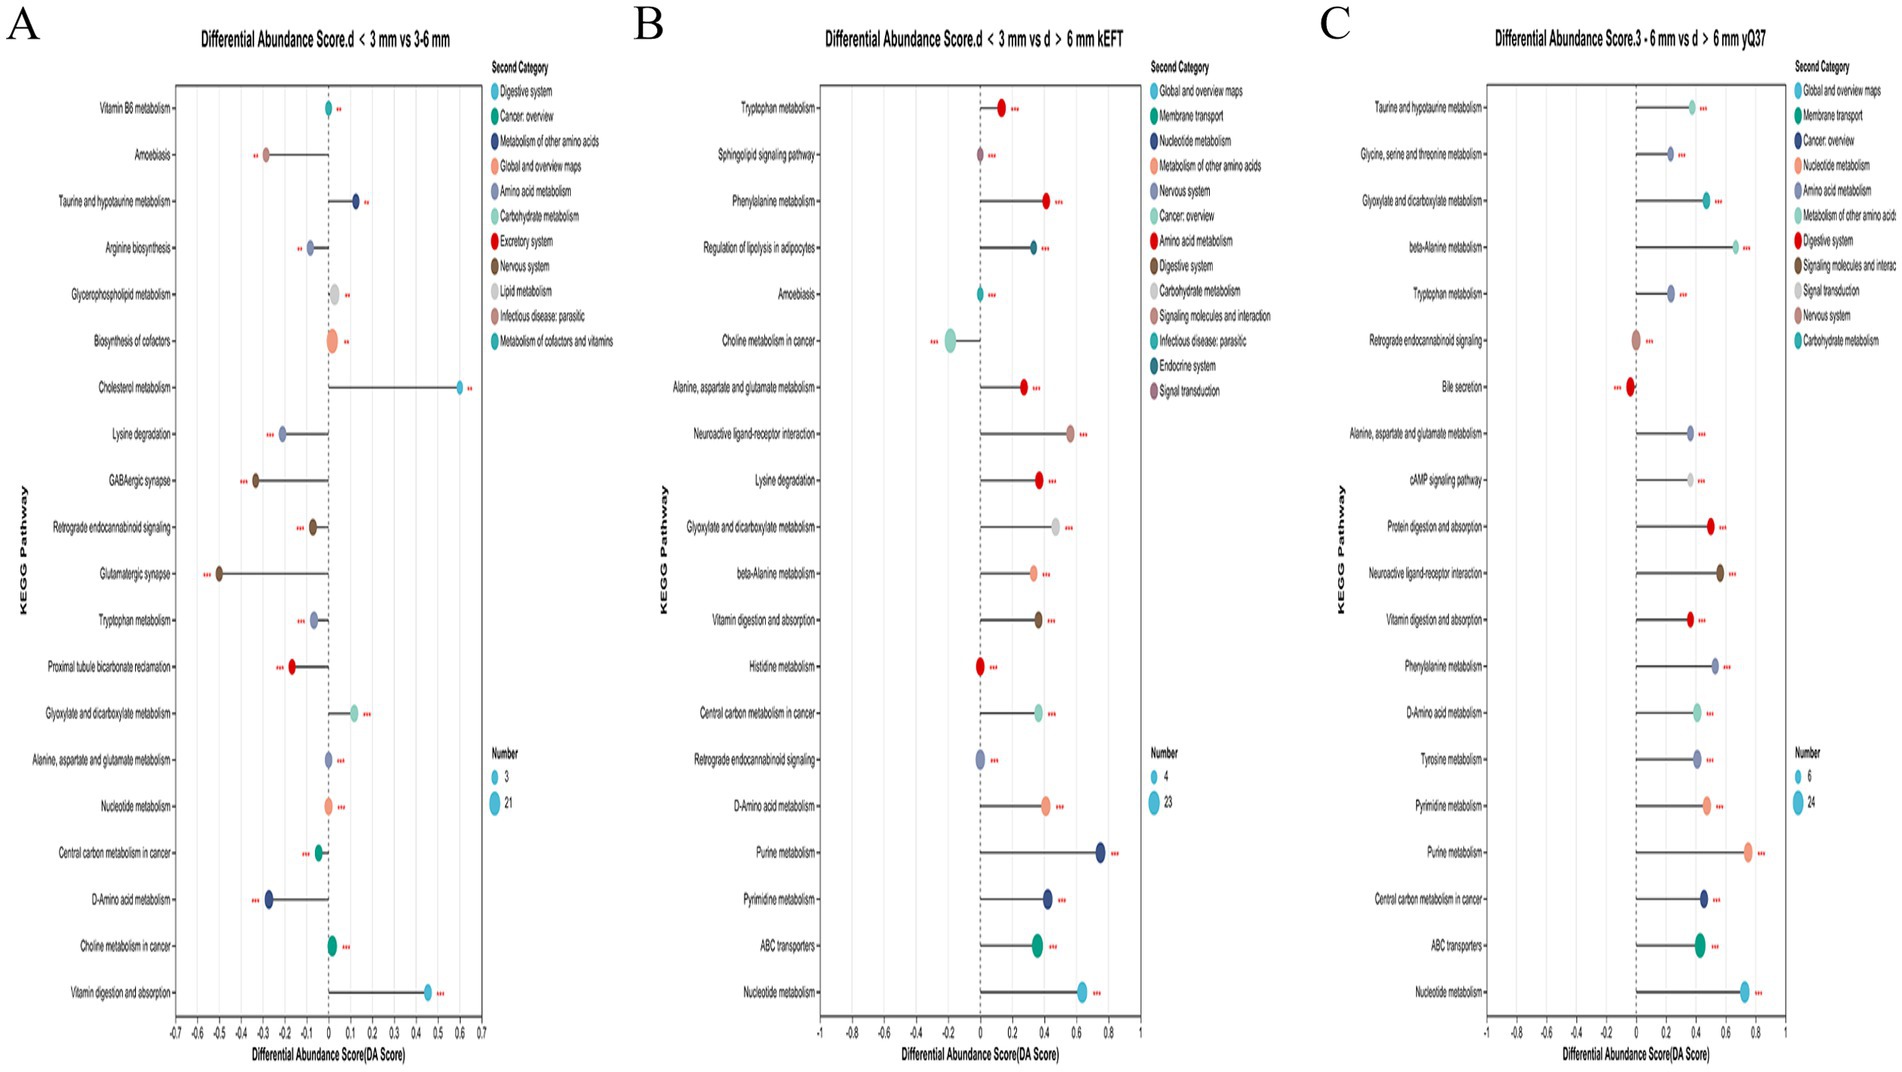
Figure 8. Enrichment of KEGG pathway of different metabolites in follicles. (A) Enrichment of KEGG pathway of different metabolites in follicles with d < 3 mm and 3–6 mm; (B) KEGG pathway enrichment diagram of 3–6 mm and d > 6 mm differences; (C) KEGG pathway enrichment diagram of different metabolites with d < 3 mm and d > 6 mm.
By KEGG classification of compounds in the follicular fluid, as shown in Figure 9A, the highest percentage of compounds in d < 3 mm vs. 3–6 mm were Phospholipids, Carboxylic acids and Amino acids, whereas in Figures 9B,C, the highest percentage of compounds in 3–6 mm vs. d > 6 mm as well as in d < 3 mm and d > 6 mm were all Phospholipids.
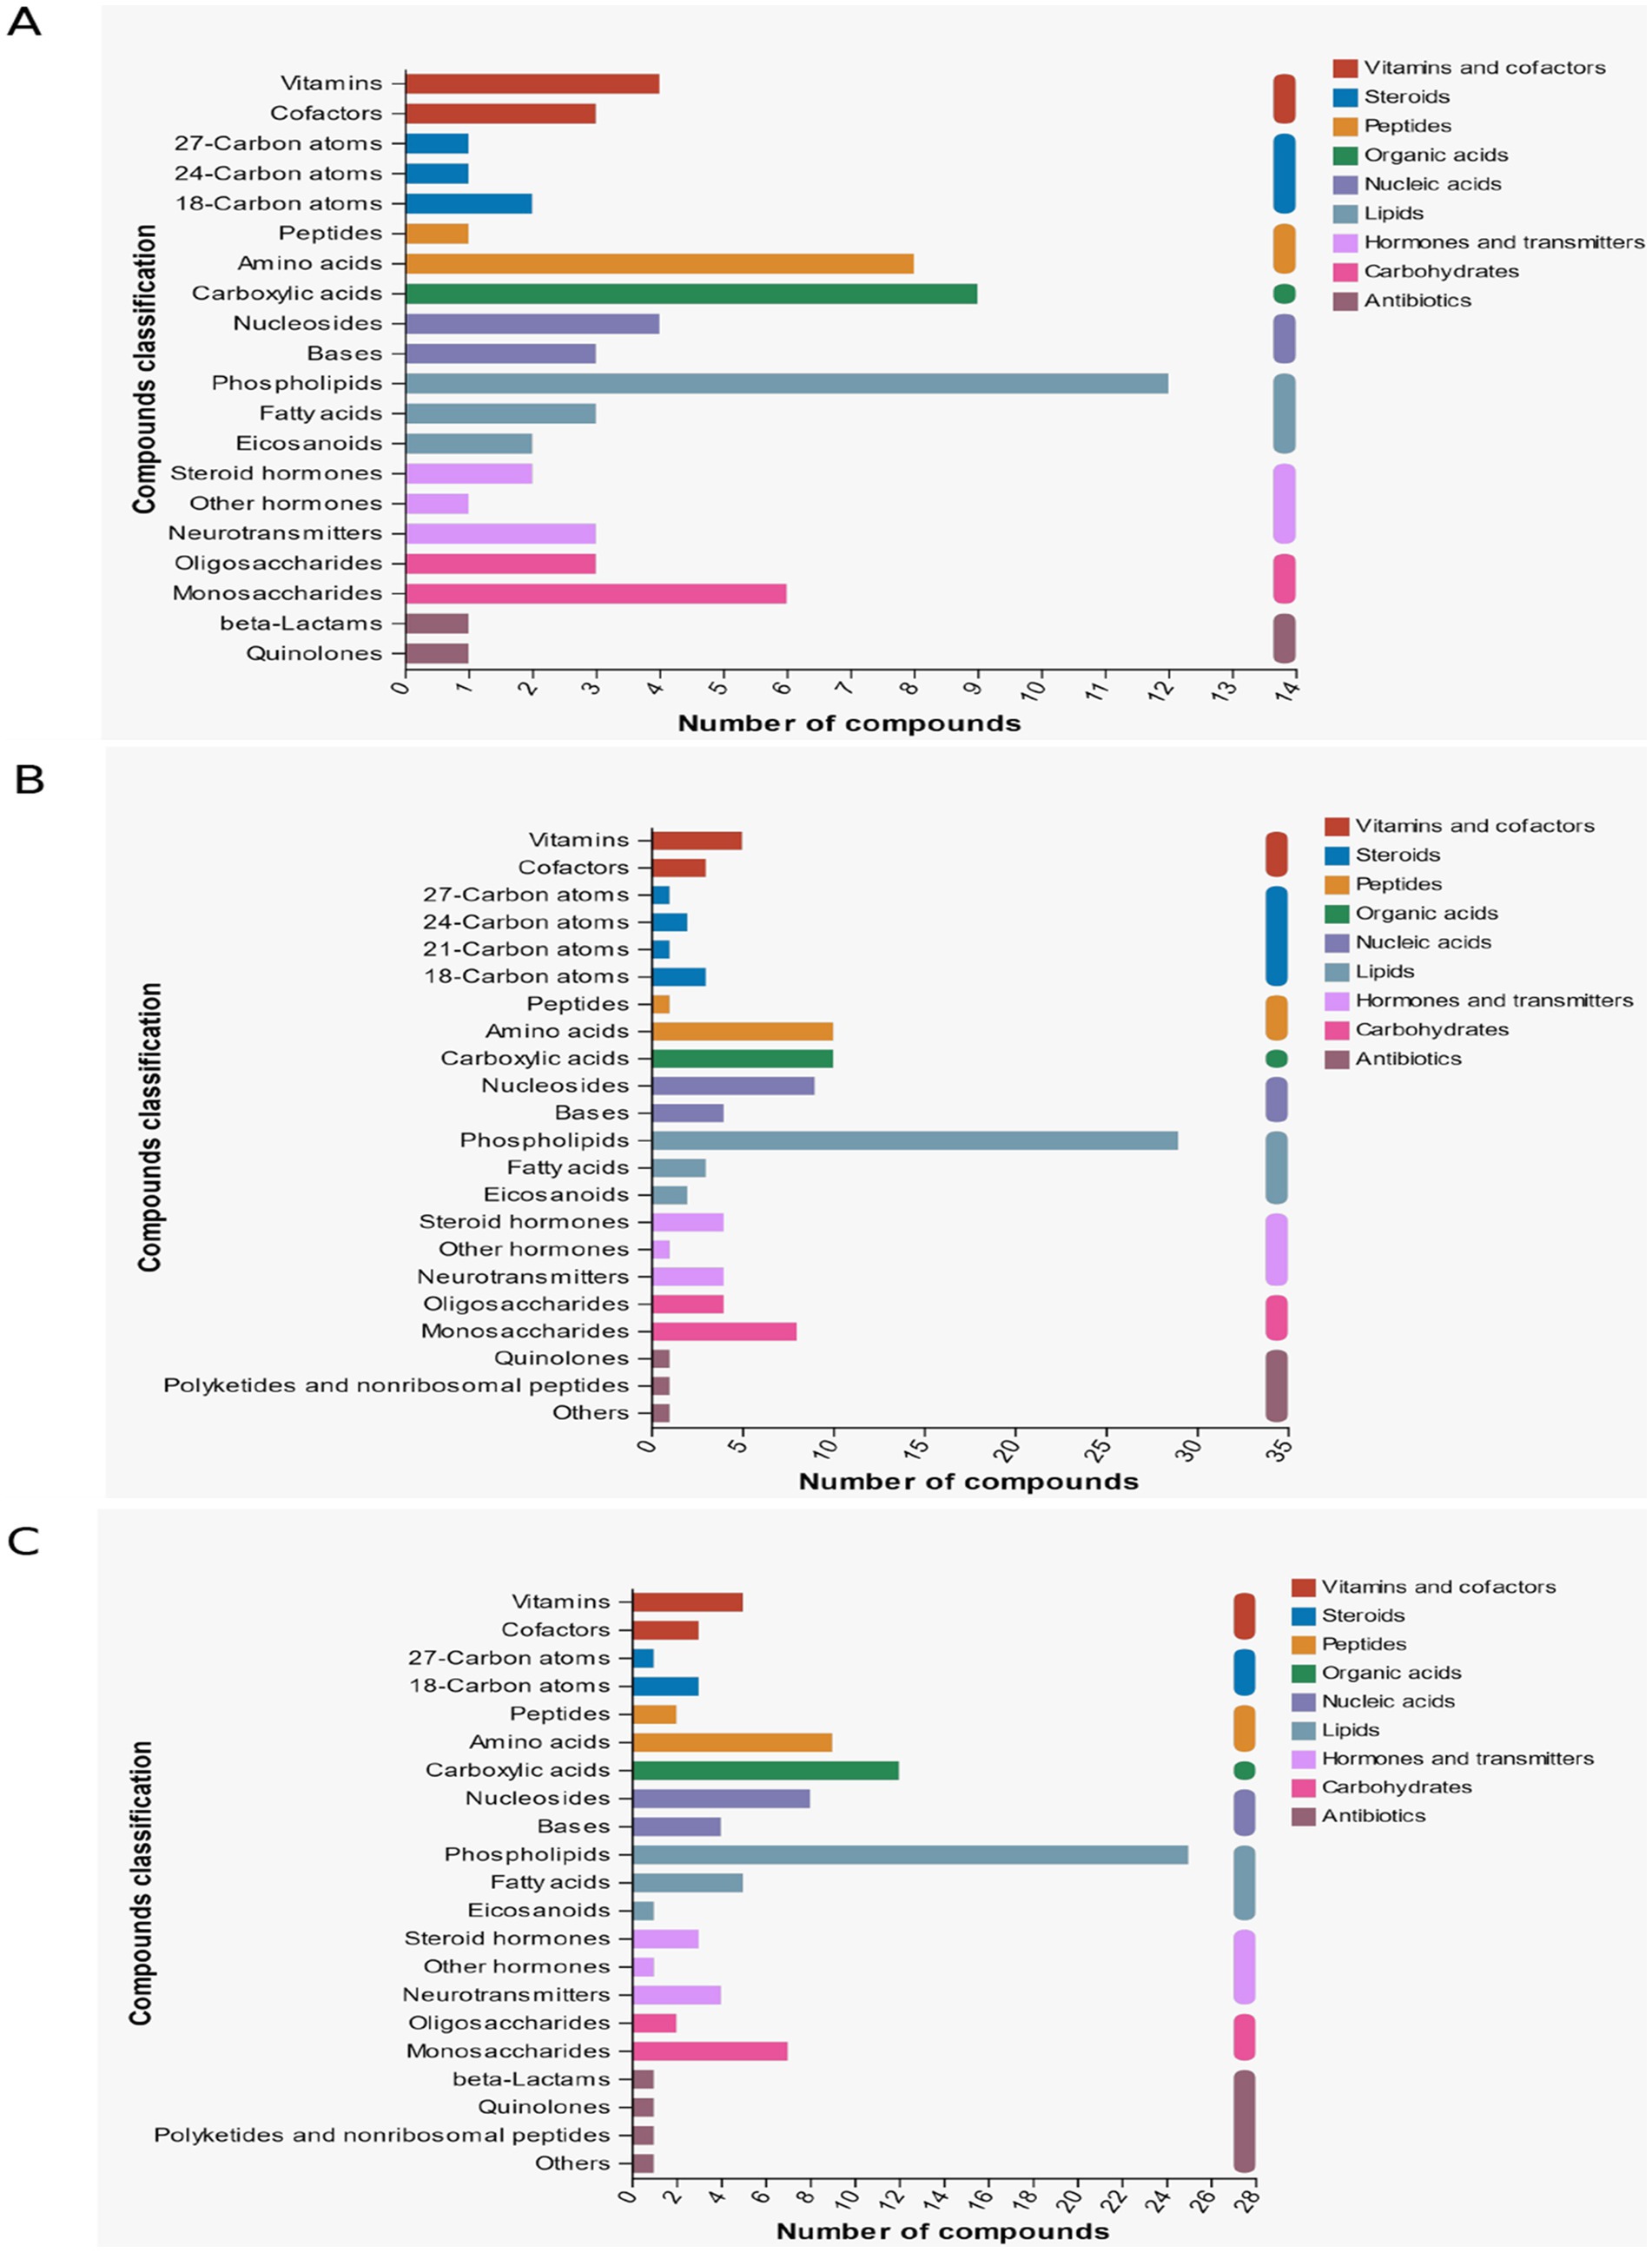
Figure 9. KEGG compound classification. (A) d < 3 mm vs. 3–6 mm KEGG compound classification. (B) 3–6 mm vs. d > 6 mm KEGG compound classification. (C) d < 3 mm vs. d > 6 mm KEGG compound classification.
The name of the selected HMDB tier (Superclass, Class, or Subclass) and the percentage of metabolites accounted for are shown in descending order according to the number of metabolites. Different colors in each pie chart in the figure represent different HMDB classifications, and their area indicates the relative percentage of metabolites in that classification. In Figure 10A, in d < 3 mm and 3–6 mm, the highest percentage was Lipid and Lipid-like molecules at 25.25%, the second was Organic acids and derivatives at 23.97% and the third was Organopheterocyclic compounds at 18.69%. In Figure 10B, among 3–6 mm and d > 6 mm, the highest percentage was Organic acids and derivatives at 26.14%, the second was Lipid and Lipid-like molecules at 25.18%, and the third was Organpheterocyclic componds at 16.87%. In Figure 10C, among the d < 3 mm and d > 6 mm, the highest percentage was Organic acids and derivatives at 25.42%, the second was Lipid and Lipid-like molecules with 24.58%, and the third was Organpheterocyclic componds with 18.55%.
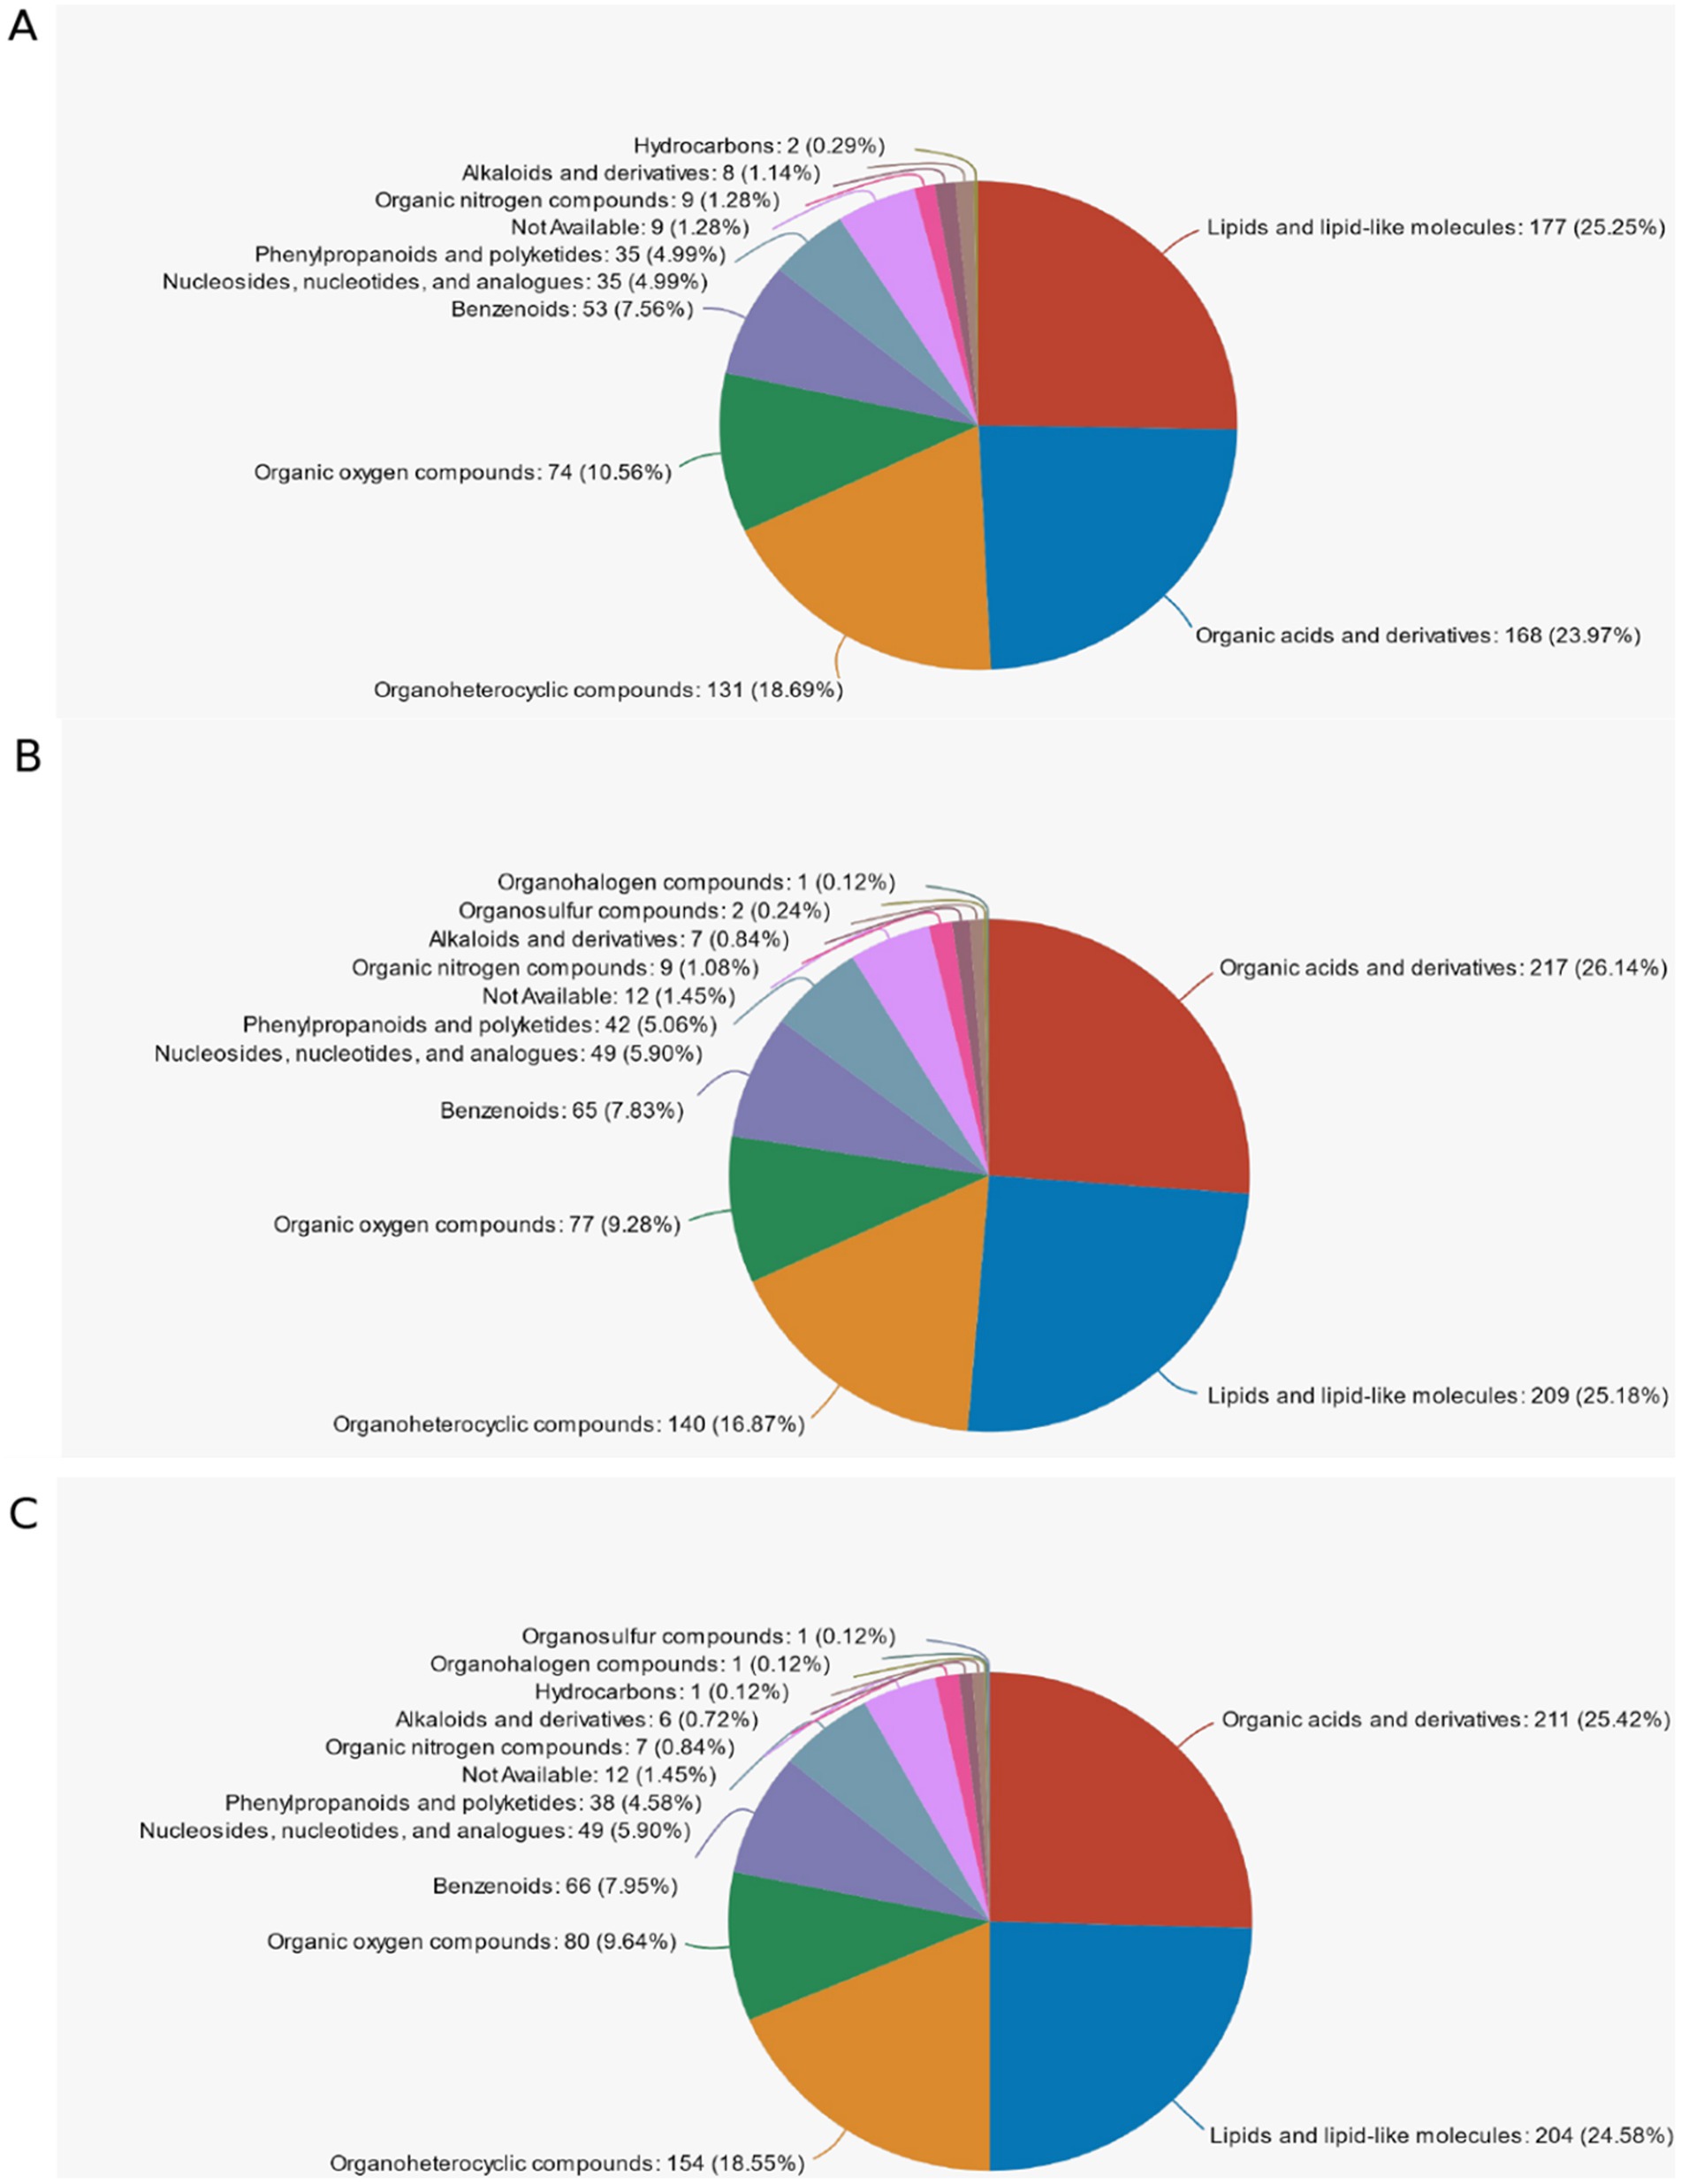
Figure 10. Classification of HMDB compounds. (A) d < 3 mm vs. 3–6 mm classification of HMDB compounds; (B) 3–6 mm vs. d > 6 mm classification of HMDB compounds; (C) d < 3 mm vs. d > 6 mm classification of HMDB compounds.
As shown in Figure 11, with the increase of follicle diameter, metabolites related to purine metabolism in follicular fluid are down-regulated.
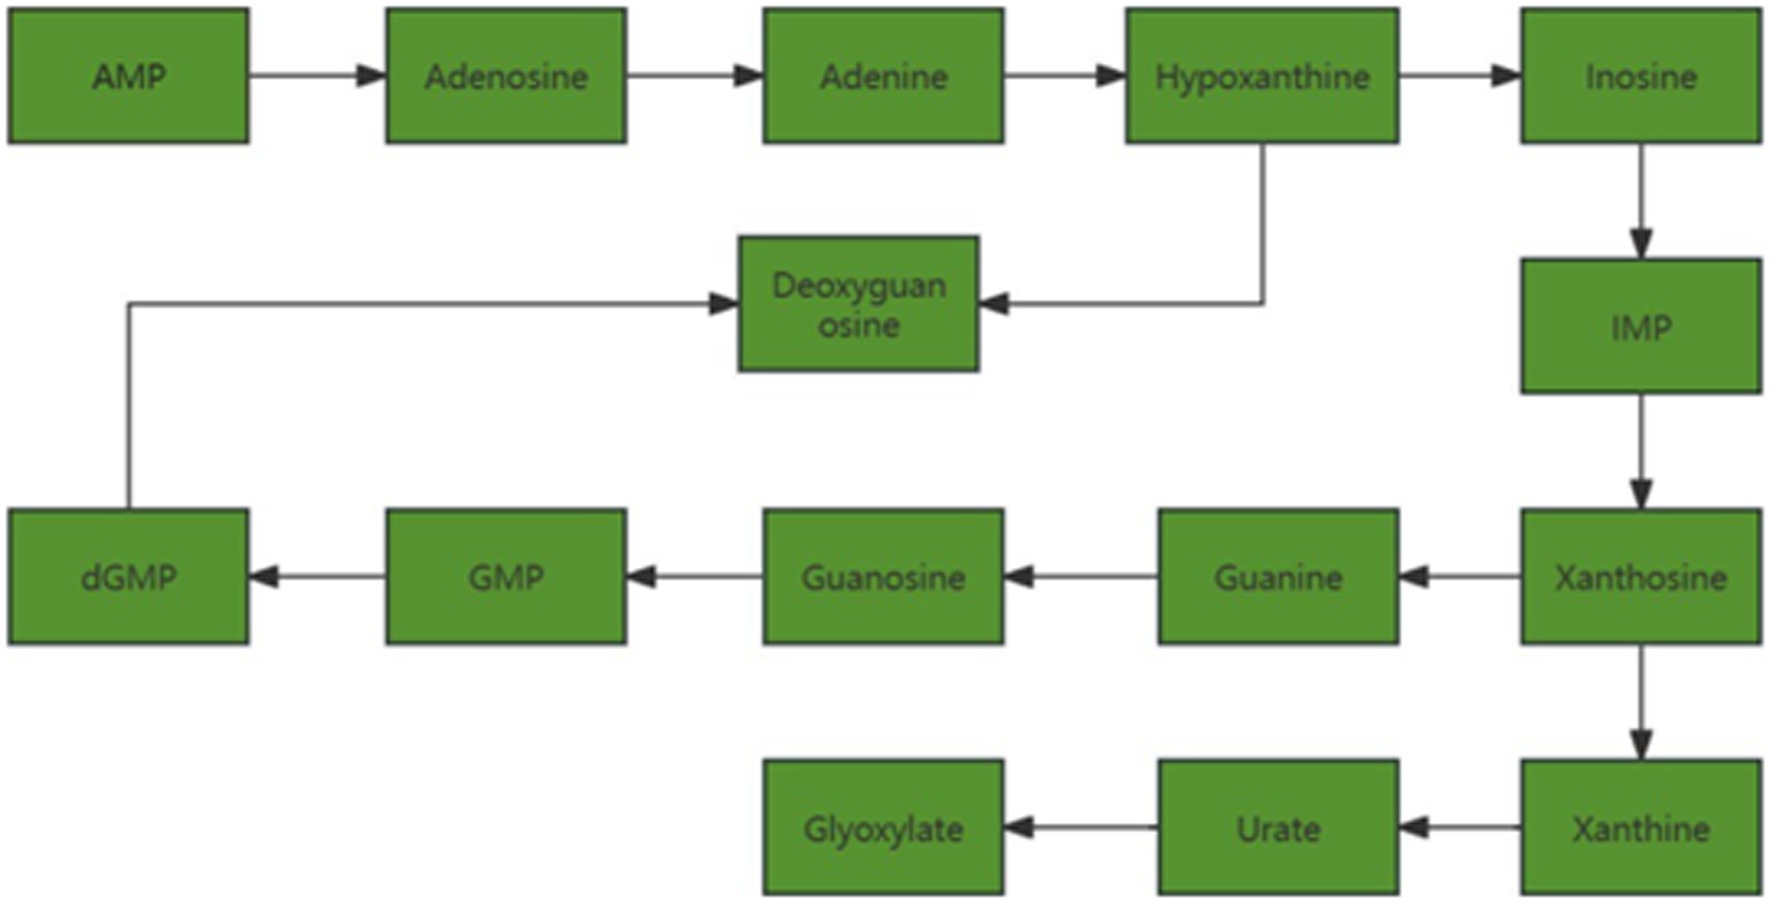
Figure 11. Changes in pathways related to purine metabolism.
By examining the metabolites in follicles of different sizes and comparing them to the pyrimidine metabolism-related pathway, it was found that most of the metabolites in the pyrimidine metabolism-related pathway appeared to be down-regulated, and some of the metabolites remained unchanged, whereas there was both up-regulation as well as down-regulation of Doxycytidine in the pyrimidine metabolism pathway as illustrated in Figure 12.
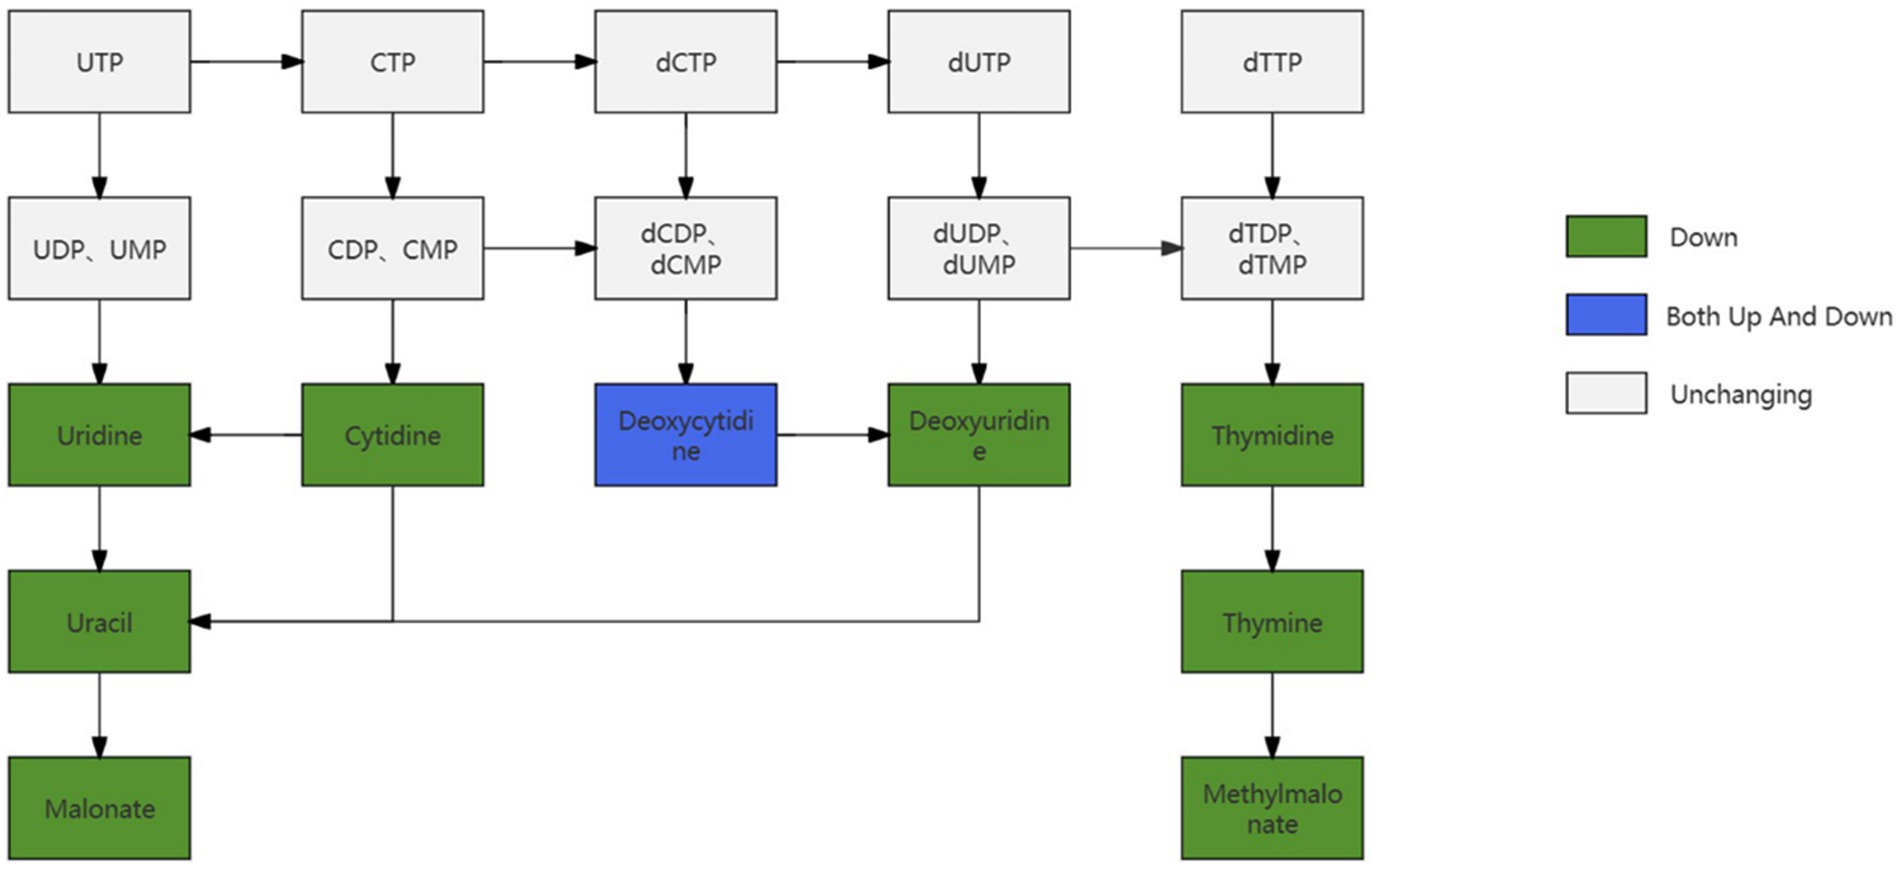
Figure 12. Changes in pathways related to pyrimidine metabolism.
In this experiment, using LC–MS detection of follicular fluid of different sizes from yaks, it was found that the differential metabolites in follicular fluid of d < 3 mm and 3–6 mm and in follicular fluid of 3–6 mm and d > 6 mm were mainly concentrated in amino acid metabolism, this is also consistent with previous literature (18). Studies have shown amino acids can be converted into a variety of nitrogenous physiologically active substances such as purines, pyrimidines and catecholamines, while the excess amino acids were used for dechomination to provide energy. In the process of amino acid metabolism, amino acids were first dehydrogenated, which were then hydrolysed to α-ketoacids and NH3. In addition, amino acids transfer the amino group of one amino acid to another amino acid under the action of aminotransferase; expect lysine, proline and hydroxyproline, most amino acids participate in transamination (19). Although transamination is common in the body, the majority of amino acid deamination in the body is through a combined transamination transfer of amino acid to α-ketoglutaric acid to produce α-ketoic acid and L-glutamic acid, by oxidative deamination to produce ammonia and α-ketoglutaric acid, these were metabolized by amino acids to produce alpha-ketoacids which can be further converted to sugars and lipids (20–22). Glutamate has a very important role in follicular development, glutamate is the main neurotransmitter that stimulates neuroendocrine activity during mammalian reproduction, GnRH release is stimulated by glutamate, and, glutamate activity is regulated by intrafollicular oestradiol and progesterone, resulting in the regulation of follicular development (23). In addition, aromatic amino acids convert phenylalanine to tyrosine, which can be converted to dopamine and then to norepinephrine, epinephrine, thyroid hormone, melanin, and so on. Tryptophan was broken down into pyruvate and acetoacetic acid and was used in the synthesis of niacin and vitamin B5 (24, 25). Previous studies have also shown that folic acid can improve the ovarian environment, preventing oxidative stress and increasing cell viability in ovarian cells (26, 27). Folic acid administered intramuscularly can affect energy efficiency and promote the development of dominant follicles, but it is not known whether folic acid acts directly on follicles and the hypothalamic–pituitary-ovarian axis (28). Among the sulphur-containing amino acids, cysteine was involved in the synthesis of glutathione to play an antioxidant role, while methionine was an important methyl supplier in the body, involved in the synthesis of adrenaline, choline, carnitine, and so on. In addition to this, additional reports have found that leucine and isoleucine in the follicle show a positive correlation on the development and implantation capacity of the oocyte at the completion of follicular development and at later stages of the oocyte’s development (29), this is also consistent with our screening of isoleucine as a key up-regulated metabolite. Moreover, leucine and isoleucine are branched-chain amino acids that can be broken down by mitochondria in the follicle to provide ATP (30). Whereas the metabolism of these amino acids plays a crucial role in the quality of the subsequent oocyte as well as the embryo (31), glycine and alanine are important indicators of post-fertilization oocytes (32). Amino acids play a variety of key roles in follicular development, includes synthesis of proteins required for follicular development, energy requirements, regulation of follicular osmolality and functioning as a cellular buffer (33).
In addition to this, the development of oocytes within the follicle is regulated by other factors, during in vivo maturation, granulosa cells, cumulus cells and other somatic cells secreted various metabolites to modulate oocyte maturation (34, 35). Granulosa cells were the major somatic cells in the follicle. In mammalian ovaries, granulosa cells proliferated first, and when the number of proliferations reached a certain level, oocytes began to develop. Oocytes were the regulatory object of granulosa cells; importantly, however, granulosa cells can be regulated by oocytes. The majority of several currently understood paracrine signaling molecules were secreted by oocytes, the most important being growth differentiation factors (GDF9) and bone morphogenetic proteins (BMPs) (36). BMP15 and GDF9 had many functions, not only regulating oocyte development, but also regulating intercellular communication, resisting granulosa cell apoptosis, hormone secretion and protein expression (37–39). Our KEGG pathway enrichment results identified a number of pathways that may be relevant to follicular development and oocyte maturation, including the cAMP pathway, which is important for the ability of oocytes to undergo normal meiosis. During oocyte development, oocytes were regulated by gap junction transport substances. Granular cells can supply and transport small molecules of nutrients, vitamins, calcium ions, metabolic precursors and signaling molecules needed by oocytes through gap junctions. In the process of meiosis, oocytes have to be blocked in the middle of meiosis II and wait for fertilization. Granulosa cells can release large amounts of cAMP, reduce the activity of cell cycle-dependent enzymes (CDKs) and arrest meiosis (40, 41). During preovulation, oocytes were regulated by high levels of LH, which can activate the EGFR pathway, reduce cGMP levels, activate (PDE) 3A to hydrolyse cAMP and restore oocyte meiosis (42).
Our study identified the presence of ABC transporter proteins in ovarian follicles, which is also consistent with the literature that ABC transporter proteins were first detected in goat ovarian follicles in 2018 (43). And that the main role of these transporter proteins is to transport molecules such as sugars, amino acids, nucleotides, and lipids across the biofilm using the energy generated by the hydrolysis of ATP, and that the expression of ABC transporter proteins in granulosa cells may be associated with an increase in steroids. Granulosa cells produce pyruvate and lactic acid by glycolysis. In addition to this, our study revealed that many energy acquisition pathways are enriched in follicular fluid. Granulosa cells obtain energy mainly through glycolysis, whereas oocytes rely mainly on mitochondrial oxidative phosphorylation for energy. Granulosa cells produce pyruvate and lactic acid by glycolysis. These accumulated lactic acid and pyruvate enter the oocyte through the intercellular space and become raw materials for oxidative phosphorylation of oocyte mitochondria (44, 45). The ATP produced by mitochondrial oxidative phosphorylation and TCA in one cycle is approximately 18 times than glycolysis, which can provide sufficient energy for oocyte growth (46). Furthermore, this process is also regulated by FSH, which can promote glycolysis through the AMPK-SIRT1 pathway and enable granulosa cells to take up glucose (47). FSH and LH are the major protein hormones that regulate follicular growth and development. When they bind to receptors, they activate cAMP-dependent physiological processes and promote the activity of steroid hormone-producing enzymes in granulocytes and parietal cells (48). LH and FSH can also regulate follicle growth by regulating these receptors. In addition to steroid hormones, follicles can also synthesize relaxin, inhibin, oxytocin, activin, etc. There are many regulatory factors in the follicles,but most of the factors have an inhibitory effect on follicle growth. These factors can be secreted by dominant follicles and inhibit the development of other follicles.
For the key metabolites we screened for down-regulation, lysophosphatidylcholine can be converted to lysophosphatidic acid by lysophospholipase D (LysoPLD), which is involved in several metabolic pathways as a biologically active lipid mediator (49). Its main functions include induction of platelet aggregation, smooth muscle contraction, stimulation of cell proliferation and chemotaxis (50). As the small follicle develops into a large follicle, the granulosa cells within the follicle need to proliferate and secrete oestradiol, which plays a role in promoting the development of the follicle as well as the maturation of the oocyte. Interestingly, in our study, we found that 2-Lysophosphatidylcholine, PC (17:0/0:0), PC (16:0/0:0), and LysoPC (18:0/0:0) were down-regulated, which may suggest that during follicular development, granulosa cell proliferation occurs mainly during small to medium-sized follicles. In the large follicles, the proliferating granulosa cells mainly secrete oestradiol and progesterone, which is consistent with previous studies that the levels of oestradiol and progesterone are higher in the large follicles than in the small follicles (32). As for the key metabolites we screened for up-regulation, of which leucine has already been described in the previous section, isoprene belongs to the terpenoid group and is a component of steroid hormones, which is constantly used to synthesize oestradiol during the development of small follicles into large follicles to stimulate the maturation of the oocyte (51). There is no literature on the role of dioctyl succinate, P-Coumaraldehyde, in animal reproduction and follicular development. However, follicle development is regulated by a variety of metabolic pathways as well as metabolites, and more information on the mechanisms by which metabolites regulate follicle development needs to be explored further.
In summary, our study showed that d < 3 mm and 3–6 mm, metabolites were mainly enriched in cofactor biosynthesis, glycine and dicarboxylic acid metabolism, vitamin digestion and absorption, taurine metabolism, nucleotide metabolism, alanine, aspartate, and glutamate metabolism. At 3–6 mm and d > 6 mm, metabolites were mainly enriched in the pathways of nucleotide metabolism, ABC transporter proteins, cAMP signaling pathway, vitamin digestion and absorption, taurine metabolism, alanine, aspartic acid, glutamate metabolism, and purine metabolism. And as follicle diameter increased, the pathways of taurine metabolism, vitamin digestion and absorption, alanine, aspartic acid, and glycine metabolism were all up-regulated.
The original contributions presented in the study are included in the article/supplementary material, further inquiries can be directed to the corresponding author.
The animal study was approved by the Southwest Minzu University’s Institutional Animal Care and Use Committee. The study was conducted in accordance with the local legislation and institutional requirements.
JY: Conceptualization, Data curation, Formal analysis, Investigation, Methodology, Writing – original draft. YF: Conceptualization, Formal analysis, Methodology, Writing – original draft. LL: Funding acquisition, Writing – original draft. HZ: Conceptualization, Methodology, Project administration, Writing – original draft. LH: Formal analysis, Writing – original draft. YW: Investigation, Resources, Writing – original draft. XX: Resources, Writing – original draft. SY: Visualization, Writing – original draft. JL: Funding acquisition, Project administration, Resources, Writing – original draft. HH: Writing – review & editing, Data curation, Funding acquisition, Methodology, Project administration.
The author(s) declare that financial support was received for the research, authorship, and/or publication of this article. The study was supported by the National Key Research and Development Program (2023YFD1801305), Special Project of Sichuan Beef Cattle Innovation Team of National Agricultural Industrial Technology System (SCCXTD-2022-13), and the Project of Qinghai-Tibetan Plateau Research in Southwest Minzu University (2024CXTD05).
The authors declare that the research was conducted in the absence of any commercial or financial relationships that could be construed as a potential conflict of interest.
All claims expressed in this article are solely those of the authors and do not necessarily represent those of their affiliated organizations, or those of the publisher, the editors and the reviewers. Any product that may be evaluated in this article, or claim that may be made by its manufacturer, is not guaranteed or endorsed by the publisher.
1. Liu, K. Stem cell factor (SCF)-kit mediated phosphatidylinositol 3 (PI3) kinase signaling during mammalian oocyte growth and early follicular development. Front Biosci. (2006) 11:126–35. doi: 10.2741/1785
2. Edson, MA, Nagaraja, AK, and Matzuk, MM. The mammalian ovary from genesis to revelation. Endocr Rev. (2009) 30:624–712. doi: 10.1210/er.2009-0012
3. Gao, S, Gan, X, He, H, Hu, S, Deng, Y, Chen, X, et al. Dynamic characteristics of lipid metabolism in cultured granulosa cells from geese follicles at different developmental stages. Biosci Rep. (2019) 39:2188. doi: 10.1042/BSR20192188
4. Harris, SE, Leese, HJ, Gosden, RG, and Picton, HM. Pyruvate and oxygen consumption throughout the growth and development of murine oocytes. Mol Reprod Dev. (2009) 76:231–8. doi: 10.1002/mrd.20945
5. Shimizu, T. Molecular and cellular mechanisms for the regulation of ovarian follicular function in cows. J Reprod Dev. (2016) 62:323–9. doi: 10.1262/jrd.2016-044
6. Ferrazza, RA, Garcia, HDM, Schmidt, E, Mihm Carmichael, M, Souza, FFD, Burchmore, R, et al. Quantitative proteomic profiling of bovine follicular fluid during follicle development. Biol Reprod. (2017) 97:835–49. doi: 10.1093/biolre/iox148
7. Dumesic, DA, Meldrum, DR, Katz-Jaffe, MG, Krisher, RL, and Schoolcraft, WB. Oocyte environment: follicular fluid and cumulus cells are critical for oocyte health. Fertil Steril. (2015) 103:303–16. doi: 10.1016/j.fertnstert.2014.11.015
8. Hayashi, KG, Ushizawa, K, Hosoe, M, and Takahashi, T. Differential genome-wide gene expression profiling of bovine largest and second-largest follicles: identification of genes associated with growth of dominant follicles. Reprod Biol Endocrinol. (2010) 8:11. doi: 10.1186/1477-7827-8-11
9. Kulick, LJ, Bergfelt, DR, Kot, K, and Ginther, OJ. Follicle selection in cattle: follicle deviation and codominance within sequential waves. Biol Reprod. (2001) 65:839–46. doi: 10.1095/biolreprod65.3.839
10. Ginther, OJ. The theory of follicle selection in cattle. Domest Anim Endocrinol. (2016) 57:85–99. doi: 10.1016/j.domaniend.2016.06.002
11. Schrimpe-Rutledge, AC, Codreanu, SG, Sherrod, SD, and McLean, JA. Untargeted metabolomics strategies-challenges and emerging directions. J Am Soc Mass Spectrom. (2016) 27:1897–905. doi: 10.1007/s13361-016-1469-y
12. Mayevsky, A, and Rogatsky, GG. Mitochondrial function in vivo evaluated by NADH fluorescence: from animal models to human studies. Am J Physiol Cell Physiol. (2007) 292:C615–40. doi: 10.1152/ajpcell.00249.2006
13. Bird, DK, Yan, L, Vrotsos, KM, Eliceiri, KW, Vaughan, EM, Keely, PJ, et al. Metabolic mapping of MCF10A human breast cells via multiphoton fluorescence lifetime imaging of the coenzyme NADH. Cancer Res. (2005) 65:8766–73. doi: 10.1158/0008-5472.CAN-04-3922
14. Kasischke, KA, Vishwasrao, HD, Fisher, PJ, Zipfel, WR, and Webb, WW. Neural activity triggers neuronal oxidative metabolism followed by astrocytic glycolysis. Science. (2004) 305:99–103. doi: 10.1126/science.1096485
15. Cui, L, Lu, H, and Lee, YH. Challenges and emergent solutions for LC-MS/MS based untargeted metabolomics in diseases. Mass Spectrom Rev. (2018) 37:772–92. doi: 10.1002/mas.21562
16. Rajska, A, Buszewska-Forajta, M, Rachoń, D, and Markuszewski, MJ. Metabolomic insight into polycystic ovary syndrome-an overview. Int J Mol Sci. (2020) 21:4853. doi: 10.3390/ijms21144853
17. Kim, YM, and Heyman, HM. Mass spectrometry-based metabolomics. Methods Mol Biol. (2018) 1775:107–18. doi: 10.1007/978-1-4939-7804-5_10
18. Wei, Y, Zhang, Z, Zhang, Y, Li, J, Ruan, X, Wan, Q, et al. Nontargeted metabolomics analysis of follicular fluid in patients with endometriosis provides a new direction for the study of oocyte quality. MedComm. (2023) 4:e302. doi: 10.1002/mco2.302
19. Commandeur, JN, Andreadou, I, Rooseboom, M, Out, M, de Leur, LJ, Groot, E, et al. Bioactivation of selenocysteine se-conjugates by a highly purified rat renal cysteine conjugate beta-lyase/glutamine transaminase K. J Pharmacol Exp Ther. (2000) 294:753–61.
20. Drabkova, P, Sanderova, J, Kovarik, J, and Kandar, R. An assay of selected serum amino acids in patients with type 2 diabetes mellitus. Adv Clin Exp Med. (2015) 24:447–51. doi: 10.17219/acem/29223
21. Kamaura, M, Nishijima, K, Takahashi, M, Ando, T, Mizushima, S, and Tochikubo, O. Lifestyle modification in metabolic syndrome and associated changes in plasma amino acid profiles. Circ J. (2010) 74:2434–40. doi: 10.1253/circj.CJ-10-0150
22. Mook-Kanamori, DO, De Mutsert, R, Rensen, PC, Prehn, C, Adamski, J, Den Heijer, M, et al. Type 2 diabetes is associated with postprandial amino acid measures. Arch Biochem Biophys. (2016) 589:138–44. doi: 10.1016/j.abb.2015.08.003
23. Porter, DT, Goodman, RL, Hileman, SM, and Lehman, MN. Evidence that synaptic plasticity of glutamatergic inputs onto KNDy neurones during the ovine follicular phase is dependent on increasing levels of oestradiol. J Neuroendocrinol. (2021) 33:e12945. doi: 10.1111/jne.12945
24. Chen, SJ, Wu, YJ, Chen, CC, Wu, YW, Liou, JM, Wu, MS, et al. Plasma metabolites of aromatic amino acids associate with clinical severity and gut microbiota of Parkinson's disease. NPJ Parkinsons Dis. (2023) 9:165. doi: 10.1038/s41531-023-00612-y
25. Kiyohara, Y, Shirasawa, K, Shin, M, Sano, K, and Umezawa, C. Tryptophan metabolism by the isolated rat liver cells--effects of leucine and its metabolites. Int J Vitam Nutr Res. (1989) 59:85–92.
26. Celar Sturm, D, and Virant-Klun, I. Negative effects of endocrine disruptor bisphenol a on ovarian granulosa cells and the protective role of folic acid. Reproduction. (2023) 165:R117–34. doi: 10.1530/REP-22-0257
27. Twigt, JM, Hammiche, F, Sinclair, KD, Beckers, NG, Visser, JA, Lindemans, J, et al. Preconception folic acid use modulates estradiol and follicular responses to ovarian stimulation. J Clin Endocrinol Metab. (2011) 96:E322–9. doi: 10.1210/jc.2010-1282
28. Gagnon, A, Khan, DR, Sirard, MA, Girard, CL, Laforest, JP, and Richard, FJ. Effects of intramuscular administration of folic acid and vitamin B12 on granulosa cells gene expression in postpartum dairy cows. J Dairy Sci. (2015) 98:7797–809. doi: 10.3168/jds.2015-9623
29. Wallace, M, Cottell, E, Gibney, MJ, McAuliffe, FM, Wingfield, M, and Brennan, L. An investigation into the relationship between the metabolic profile of follicular fluid, oocyte developmental potential, and implantation outcome. Fertil Steril. (2012) 97:1078–84. doi: 10.1016/j.fertnstert.2012.01.122
30. Li, Q, and Hoppe, T. Role of amino acid metabolism in mitochondrial homeostasis. Front Cell Dev Biol. (2023) 11:1127618. doi: 10.3389/fcell.2023.1127618
31. Sinclair, KD, Lunn, LA, Kwong, WY, Wonnacott, K, Linforth, RST, and Craigon, J. Amino acid and fatty acid composition of follicular fluid as predictors of in-vitro embryo development. Reprod Biomed Online. (2008) 16:859–68. doi: 10.1016/S1472-6483(10)60153-8
32. Hemmings, KE, Leese, HJ, and Picton, HM. Amino acid turnover by bovine oocytes provides an index of oocyte developmental competence in vitro. Biol Reprod. (2012) 86:165. doi: 10.1095/biolreprod.111.092585
33. Rose-Hellekant, TA, Libersky-Williamson, EA, and Bavister, BD. Energy substrates and amino acids provided during in vitro maturation of bovine oocytes alter acquisition of developmental competence. Zygote. (1998) 6:285–94. doi: 10.1017/S0967199498000239
34. Revelli, A, Delle Piane, L, Casano, S, Molinari, E, Massobrio, M, and Rinaudo, P. Follicular fluid content and oocyte quality: from single biochemical markers to metabolomics. Reprod Biol Endocrinol. (2009) 7:40. doi: 10.1186/1477-7827-7-40
35. Derkach, KV, Lebedev, IA, Morina, IY, Bakhtyukov, AA, Pechalnova, AS, Sorokoumov, VN, et al. Comparison of steroidogenic and ovulation-inducing effects of Orthosteric and allosteric agonists of luteinizing hormone/chorionic gonadotropin receptor in immature female rats. Int J Mol Sci. (2023) 24:618. doi: 10.3390/ijms242316618
36. Wu, JS, Gong, S, Zhang, M, Ma, RJ, Wang, HL, Luo, MJ, et al. Role and action mechanisms of miR-149 and miR-31 in regulating function of pig cumulus cells and oocytes. Theriogenology. (2024) 220:84–95. doi: 10.1016/j.theriogenology.2024.03.006
37. Orisaka, M, Jiang, JY, Orisaka, S, Kotsuji, F, and Tsang, BK. Growth differentiation factor 9 promotes rat preantral follicle growth by up-regulating follicular androgen biosynthesis. Endocrinology. (2009) 150:2740–8. doi: 10.1210/en.2008-1536
38. Hussein, TS, Froiland, DA, Amato, F, Thompson, JG, and Gilchrist, RB. Oocytes prevent cumulus cell apoptosis by maintaining a morphogenic paracrine gradient of bone morphogenetic proteins. J Cell Sci. (2005) 118:5257–68. doi: 10.1242/jcs.02644
39. Zheng, H, Choi, H, Oh, D, Kim, M, Cai, L, Jawad, A, et al. Supplementation with fibroblast growth factor 7 during in vitro maturation of porcine cumulus-oocyte complexes improves oocyte maturation and early embryonic development. Front Vet Sci. (2023) 10:1250551. doi: 10.3389/fvets.2023.1250551
40. Jaffe, LA, and Egbert, JR. Regulation of mammalian oocyte meiosis by intercellular communication within the ovarian follicle. Annu Rev Physiol. (2017) 79:237–60. doi: 10.1146/annurev-physiol-022516-034102
41. Wigglesworth, K, Lee, KB, O'brien, MJ, Peng, J, Matzuk, MM, Eppig, JJ, et al. Bidirectional communication between oocytes and ovarian follicular somatic cells is required for meiotic arrest of mammalian oocytes. Proc Natl Acad Sci USA. (2013) 110:E3723–9. doi: 10.1073/pnas.1314829110
42. Pei, Z, Deng, K, Xu, C, and Zhang, S. The molecular regulatory mechanisms of meiotic arrest and resumption in oocyte development and maturation. Reprod Biol Endocrinol. (2023) 21:90. doi: 10.1186/s12958-023-01143-0
43. Guerreiro, DD, de, L, Mbemya, GT, Maside, C, Miranda, A, Tavares, K, et al. ATP-binding cassette (ABC) transporters in caprine preantral follicles: gene and protein expression. Cell Tissue Res. (2018) 372:611–20. doi: 10.1007/s00441-018-2804-3
44. Xie, HL, Wang, YB, Jiao, GZ, Kong, DL, Li, Q, Li, H, et al. Effects of glucose metabolism during in vitro maturation on cytoplasmic maturation of mouse oocytes. Sci Rep. (2016) 6:20764. doi: 10.1038/srep20764
45. Wen, J, Wang, GL, Yuan, HJ, Zhang, J, Xie, HL, Gong, S, et al. Effects of glucose metabolism pathways on nuclear and cytoplasmic maturation of pig oocytes. Sci Rep. (2020) 10:2782. doi: 10.1038/s41598-020-59709-6
46. Purcell, SH, Chi, MM, Lanzendorf, S, and Moley, KH. Insulin-stimulated glucose uptake occurs in specialized cells within the cumulus oocyte complex. Endocrinology. (2012) 153:2444–54. doi: 10.1210/en.2011-1974
47. Wang, Q, Chi, MM, Schedl, T, and Moley, KH. An intercellular pathway for glucose transport into mouse oocytes. Am J Physiol Endocrinol Metab. (2012) 302:E1511–8. doi: 10.1152/ajpendo.00016.2012
48. Xiao-hong, H, Meng, W, Yang-yang, P, Jiang-feng, F, Jing-lei, W, Ling, Z, et al. Effect of follicle-stimulating hormone and luteinizing hormone on apoptosis, autophagy, and the release and reception of some steroid hormones in yak granulosa cells through miR-23a/ASK1 axis. Cell Signal. (2024) 115:111010. doi: 10.1016/j.cellsig.2023.111010
49. Umezu-Goto, M, Kishi, Y, Taira, A, Hama, K, Dohmae, N, Takio, K, et al. Autotaxin has lysophospholipase D activity leading to tumor cell growth and motility by lysophosphatidic acid production. J Cell Biol. (2002) 158:227–33. doi: 10.1083/jcb.200204026
50. Moolenaar, WH. Bioactive lysophospholipids and their G protein-coupled receptors. Exp Cell Res. (1999) 253:230–8. doi: 10.1006/excr.1999.4702
Keywords: follicular development, metabolomics, granulosa cells, ovary, Bos grunniens
Citation: Yan J, Fu Y, Lan L, Zhang H, Huang L, Wang Y, Xiong X, Yin S, Li J and He H (2025) Correlation between follicle diameter and pre-ovulatory metabolic profile in Bos grunniens. Front. Vet. Sci. 12:1498703. doi: 10.3389/fvets.2025.1498703
Edited by:
Yatta Linhares Boakari, Texas A&M University System, United StatesReviewed by:
Ma. Luisa Escobar, National Autonomous University of Mexico, MexicoCopyright © 2025 Yan, Fu, Lan, Zhang, Huang, Wang, Xiong, Yin, Li and He. This is an open-access article distributed under the terms of the Creative Commons Attribution License (CC BY). The use, distribution or reproduction in other forums is permitted, provided the original author(s) and the copyright owner(s) are credited and that the original publication in this journal is cited, in accordance with accepted academic practice. No use, distribution or reproduction is permitted which does not comply with these terms.
*Correspondence: Honghong He, aG9uZ2hvbmczaEAxMjYuY29t
Disclaimer: All claims expressed in this article are solely those of the authors and do not necessarily represent those of their affiliated organizations, or those of the publisher, the editors and the reviewers. Any product that may be evaluated in this article or claim that may be made by its manufacturer is not guaranteed or endorsed by the publisher.
Research integrity at Frontiers
Learn more about the work of our research integrity team to safeguard the quality of each article we publish.