 Jiale Chang1,2†
 Fanhua Meng1,2†Ru Zhang1,2†Juan Feng1,2Yujing Liu1,2Junjie Zhang1,2Zhaomin Liu1,2Jiayue Liang3Hongmei Xiao1,2*
- 1College of Life Sciences, Inner Mongolia Agricultural University, Hohhot, China
- 2Inner Mongolia Autonomous Region Key Laboratory of Biomanufacturing, Hohhot, China
- 3Institute of Microbiology, Chinese Academy of Sciences, Beijing, China
Background: The growth of secondary hair follicles (SHFs) in cashmere goats has periodic changes, including telogen, anagen, and catagen, during which proteins play important roles as the executor of life activities.
Results: In this study, the skin tissues of cashmere goats at three different growth stages of SHFs were collected for proteome sequencing and validation experiments. Through protein differential expression analysis and time series analysis, FKBP prolyl isomerase 10 (FKBP10) and fibrillin 2 (FBN2) were screened as the key proteins for SHF cycle growth of cashmere goats, and albumin (ALB), collagen type I alpha 1 chain (COL1A1) and elastin (ELN) were predicted to be their interacting proteins. The results of quantitative real-time PCR (qRT-PCR), western blot, and immunohistochemistry experiments showed that the mRNA and protein expression levels of FKBP10, FBN2, COL1A1, ELN and ALB were higher in anagen and lower in telogen. They were all highly expressed in the outer root sheath of SHFs in anagen.
Conclusion: FKBP10, FBN2, COL1A1, ELN, and ALB can promote the growth of SHFs in cashmere goats. This study lays the foundation for analyzing the growth cycle regulatory mechanism of SHFs in cashmere goats, and provides new ideas for further improving cashmere yield and quality.
1 Introduction
Cashmere goat (Capra hircus) is an important economic breed with the characteristics of drought resistance, strong disease resistance and tolerance to roughage (1, 2). Its cashmere is used as the preferred high-end textile raw material because of its soft texture, good thermal performance and air permeability, and enjoys the reputation of “soft gold” (3). In recent years, with the rapid development of the economy and the continuous reform and innovation of domestic cashmere products, it has become an inevitable trend to improve cashmere quality and yield (4). Cashmere goats have two different types of hair follicles. The primary hair follicles (PHFs) produce coarse hairs, which mainly provide mechanical protection for the animal bodies due to their thick and strong hair shaft. And SHFs produce cashmere, which have no medulla, are slender and soft and play a role in keeping animals warm (5, 6). SHF is a regenerative system with a complex developmental process, and its growth exhibits periodic changes with light intensity, which is divided into telogen, anagen, and catagen (7). Telogen is from February to March, anagen is from April to November, and catagen is from December to January of the following year (8). The structure of a hair follicle can be divided into five parts from bottom to top, including the hair bulb, keratin hyperplasia area, terminal sclerosis area, abscission area and funnel. The hair bulb surrounding the dermal papilla is the enlarged part of the end of the hair follicle (9). The hair papilla plays an important role in regulating the cyclical cycle of SHFs (10). In the early stage of hair follicle growth, dermal papilla cells proliferate and differentiate to form the inner root sheath and hair shaft. When hair follicles enter a vigorous growth period, their growth rate can reach the fastest. After anagen, all hair follicles enter catagen at similar times, and their activities gradually weaken over time (11). When hair follicles are ready to enter telogen from catagen, the inner root sheaths begin to undergo apoptosis. In telogen, the hair follicles are considered to be in a dormant state, and the hair shafts stop growing and begin to shed. Some studies have shown that telogen plays an important role in the hair follicle growth cycles, with its main function being to store energy, regulate and repair the skin microenvironment for hair follicle regeneration (12).
Proteome refers to the collection of all the corresponding proteins expressed in the genome, that is, the existence and activity of all proteins in cells, tissues, or organisms (13). Proteomics, which takes the proteome as the object, clarifies the expression and functional patterns of all proteins in organisms and has become a hot topic in life science in the post-genomic era. In order to explored the expression pattern of high mobility group nucleosome binding domain protein 1 (HMGN1) in hair follicles and whether the loss of HMGN1 can affect hair follicle development or cycle changes, Furusawa T. found that HMGN1 was expressed in the epidermal basal layer, outer root sheath and hair bulb in adult hair follicles, but not in the inner root sheath and hair shaft by proteomics technology. At the same time, he also found HMGN1 was expressed in some hair follicle stem cells (14). Yang et al. (15) screened for differentially expressed proteins in the skins of Yangtze River Delta white goats with type III and non type III wool, and identified four proteins. Among them, fibrinogen beta chain isoform 1 and ATP synthase beta subunit (ATB5B) were up-regulated in the skins with type III wool, while succinyl-CoA:3-ketoacid-coenzyme A transferase 1-mitochondrial-like and actin-cytoplasmic 1 (ACTB) were up-regulated in the skins with non type III wool, indicating that these four proteins play important roles in different aspects of hair follicle development. Through comprehensive analysis of cashmere goat skin transcriptome and proteome, Dai et al. (16) found that overexpression of thymosin beta 4 (Tβ4) in hair follicles could effectively increase cashmere yields. By the same method, Liu et al. (17) discovered that keratin (KRT) and collagen alpha families might play important roles in goat hair follicles and wool curvature development. Li et al. (18) confirmed that DSC2 gene is key to the woolly straight phenotype in goats through studying the differences of protein abundance in different fiber ranges from 18 sheep and goat wool samples. In the study on hair follicles in cashmere goats, Gao et al. (19) found that the expression levels of KRT1, KRT5, KRT25 and KRT71 were highest in anagen of hair follicles. In addition, studies have shown that KRTAP28-1, KRTAP27-1, KRTAP24-1, KRTAP11-1, KRTAP15-1 and KRTAP8-1 gene mutations are associated with cashmere fiber diameter (20–25), which has the value of molecular markers for improving cashmere diameter.
As a special biological resource, Albas white cashmere goats not only have delicious meat but are also recognized around the world for their unique cashmere. Many researchers try to understand the species at the molecular, cellular, and even individual levels, further improve its breeding, and expand the quantity and scale of breeding in order to improve cashmere yield and quality (26–29). Especially in recent years, many genes and proteins related to economic traits have been found through various omics analyses, which provide methods for the study on hair follicle growth and development in cashmere goats (30–33). However, research in the interactions between proteins regulating hair follicle growth and development, as well as the mechanisms related to hair follicle growth in cashmere goats, remains unresolved (34). In this study, skin samples of cashmere goats from three different periods were collected for proteome sequencing and validation experiments. Through sequencing data analysis, key proteins related to hair follicle growth of cashmere goats were screened, and their interacting proteins were predicted by bioinformatics methods. Meanwhile, the expression of key proteins and their interacting proteins was detected at the gene and protein levels by qRT-PCR, western blot, and immunohistochemistry technology. The purpose of this study was to lay the foundation for analyzing the regulation mechanism of SHF growth cycle of cashmere goats.
2 Methods
2.1 Animal and tissue collection
One centimeter square scapular skin samples of three 1.5-year-old Albas female cashmere goats with similar body weight and consistent feeding conditions according to standard cashmere goat husbandry practices were collected in anagen (September), catagen (December) and telogen (February) of SHFs. The skin samples from living body surface after hair removal and alcohol disinfection were collected by sterile surgical blades after the muscle tissue anesthetized with 1% pentobarbital sodium (Sinopharm Chemical Reagent Co., Ltd., China). Then Yunnan Baiyao powder (Yunnan Baiyao Group Co., Ltd., China) was applied to the wound sites to stop bleeding. The samples are divided into three parts, one part of them was placed in 4% paraformaldehyde (biosharp, Anhui, China) for paraffin section preparation, and the other two parts were placed in liquid nitrogen for sequencing and subsequent molecular experiments. All sample collections were conducted in accordance with the International Guiding Principles for Biomedical Research Involving Animals and with the approval of the Experimental Animal Welfare and Ethics Committee of Inner Mongolia Agricultural University.
2.2 Paraffin section embedding
The fixed skin tissues in paraformaldehyde were taken out, washed with PBS, then soaked in 50% alcohol for 30 min, 70% alcohol for 1 h, 80% alcohol for 1 h, and 95% alcohol for 1 h, and dehydrated with anhydrous ethanol I and II for 2 h, respectively. The samples were soaked in xylene and anhydrous ethanol (1:1) for 1 h and in xylene and paraffin (1:1) at 37°C overnight. After transparency with xylene, the samples soaked in soft wax and hard wax at 52°C and 56°C for 2 h, respectively, and embedded for tissue sections. One part was used for HE staining to observe the quality of sections, and the other part was used for immunohistochemical detection and microscopy photographing.
2.3 HE staining
Paraffin sections were deparaffinized in xylene for 10 min, twice. They were then hydrated through 95, 85, and 75% ethanol, followed by rinsing with deionized water. After stained with hematoxylin (LEAGENE, Anhui, China) for 10 min, the sections were rinsed with deionized water again, followed by differentiation in 1% acid alcohol (LEAGENE, Anhui, China), and another rinsed with deionized water. Eosin (LEAGENE, Anhui, China) staining was performed for 10 min. The sections were dehydrated through graded alcohols: 80, 85, 95%, and absolute ethanol, and in xylene twice for 10 min each time. Finally, neutral gum was applied to the sections, which were allowed to dry before being examined under a microscope (Eclipse Ti2-U, Nikon, Tokyo, Japan).
2.4 Protein extraction
Appropriate amount of frozen skin samples was taken and transferred into 1.5 mL centrifuge tubes. Samples were lysed by adding RIPA Lysis Buffer (Beyotime, Shanghai, China) and protease inhibitor PMSF (Beyotime, Shanghai, China) included to achieve a final concentration of 1 mM. Samples were subjected to ultrasonication on ice using a power setting of 80 W with cycles of 1 s on and off, for a total duration of 3 min. The lysates were centrifuged at room temperature at 12,000 × g for 10 min. The supernatant was carefully collected and subjected to a second centrifugation step under the same conditions. The protein concentration of supernatant was measured by BCA Protein Assay Kit (Solarbio, Beijing, China) and stored at −80°C after subpacking.
2.5 Proteome sequencing and data analysis
The different period total sample protein extracted by protein concentration and SDS-PAGE detection, were subjected to trypsin digestion and isobaric tag for relative absolute quantitation/tandem mass tags (iTRAQ/TMT) labeling. Then an equal amount of each labeled sample was mixed and separated by chromatography. Finally, the three group samples (anagen, catagen, and telogen) with 3 biological replicates in each group were analyzed by liquid chromatography-tandem mass spectrometry (LC-MS/MS). Chromatographic conditions: samples were uploaded at a flow rate of 400 nL/min to an analytical column Acclaim PepMap RSLC, 75 μm × 25 cm (RP-C18 ionopticks, Thermo Fisher) for separation. Mobile phase A phase: H2O-FA (99.9:0.1, v/v); mobile phase B phase: ACN-H2O-FA (80:19.9:0.1, v/v/v). Gradient elution conditions: 0–27 min, 2–21% B; 27–37 min, 21–42% B; 37–40 min, 42–95% B; 40–44 min, 95% B. Mass spectrometry conditions: capillary voltage of 1.5 kV, drying gas temperature of 180°C, flow rate of 3.0 L/min, primary MS scanning range of 100–1,700 m/z, ion mobility range of 0.6–1.6, collision energy range of 20–59 eV.
Based on the reliable proteins obtained by LC-MS/MS detection and database (Maxquant 1.6.17.0) search and compute, visualization of protein results after quality assessment and data normalization, the differential proteins were screened, and the screening conditions were set as Foldchange ≥2 (up-regulated protein expression was greater than or equal to 2 times, or down-regulated protein expression was less than or equal to 0.5 times) and p < 0.05. Correlation analysis, expression pattern clustering heat map, and Venn analysis were performed in R (Version 4.1.0). Various annotation information was extracted, and protein functions were mined from databases (UniProt, KEGG, GO, KOG/COG, etc.). At the same time, Gene Ontology (GO) analysis and Kyoto Encyclopedia of Genes and Genomes (KEGG) analysis1 of differential proteins obtained were performed. In the enrichment analysis, the Benjamini–Hochberg method was utilized for multiple test correction. The STRING (35)2 was used to upload the differentially expressed proteins in different periods to the String database for analysis. The visual protein–protein interaction (PPI) network was created by Cytoscape (Version 3.8.2), and the time series analysis of protein expression was performed by STEM (Version 1.3.13).
2.6 qRT-PCR validation
Total RNA was extracted from frozen cashmere goat skin samples using TRIzon Reagent (CWBIO, Jiangsu, China). The concentration and quality of the total RNA were assessed using NanoDrop 1000 (Thermo, Massachusetts, United States). The RNA extracted was reverse-transcribed into cDNA by the PrimeScript™ RT Master Mix kit (TAKARA, Dalian, China). The mRNA coding region sequences of the genes were retrieved from NCBI database,3 and the fluorescent quantitative specific primers of the genes were designed using Primer 5.0. The primer sequences are shown in Table 1. The relative expression levels of ALB, COL1A1, FKBP10, ELN, and FBN2 genes were verified by qRT-PCR, and GAPDH (glyceraldehyde-3-phosphate dehydrogenase) was used as the reference gene. The reaction mix: TB Green Premix Ex Taq II (Tli RNaseH Plus) (2X) 10 μL, forward primer 0.8 μL, reverse primer 0.8 μL, cDNA 2 μL, and ddH2O 6.4 μL. Programs: initial denaturation (95°C 30 s), quantification (95°C 5 s, Tm 30 s) for a total of 45 cycles, melting (95°C 5 s, Tm 60 s, 95°C), and cooling (50°C 30 s).
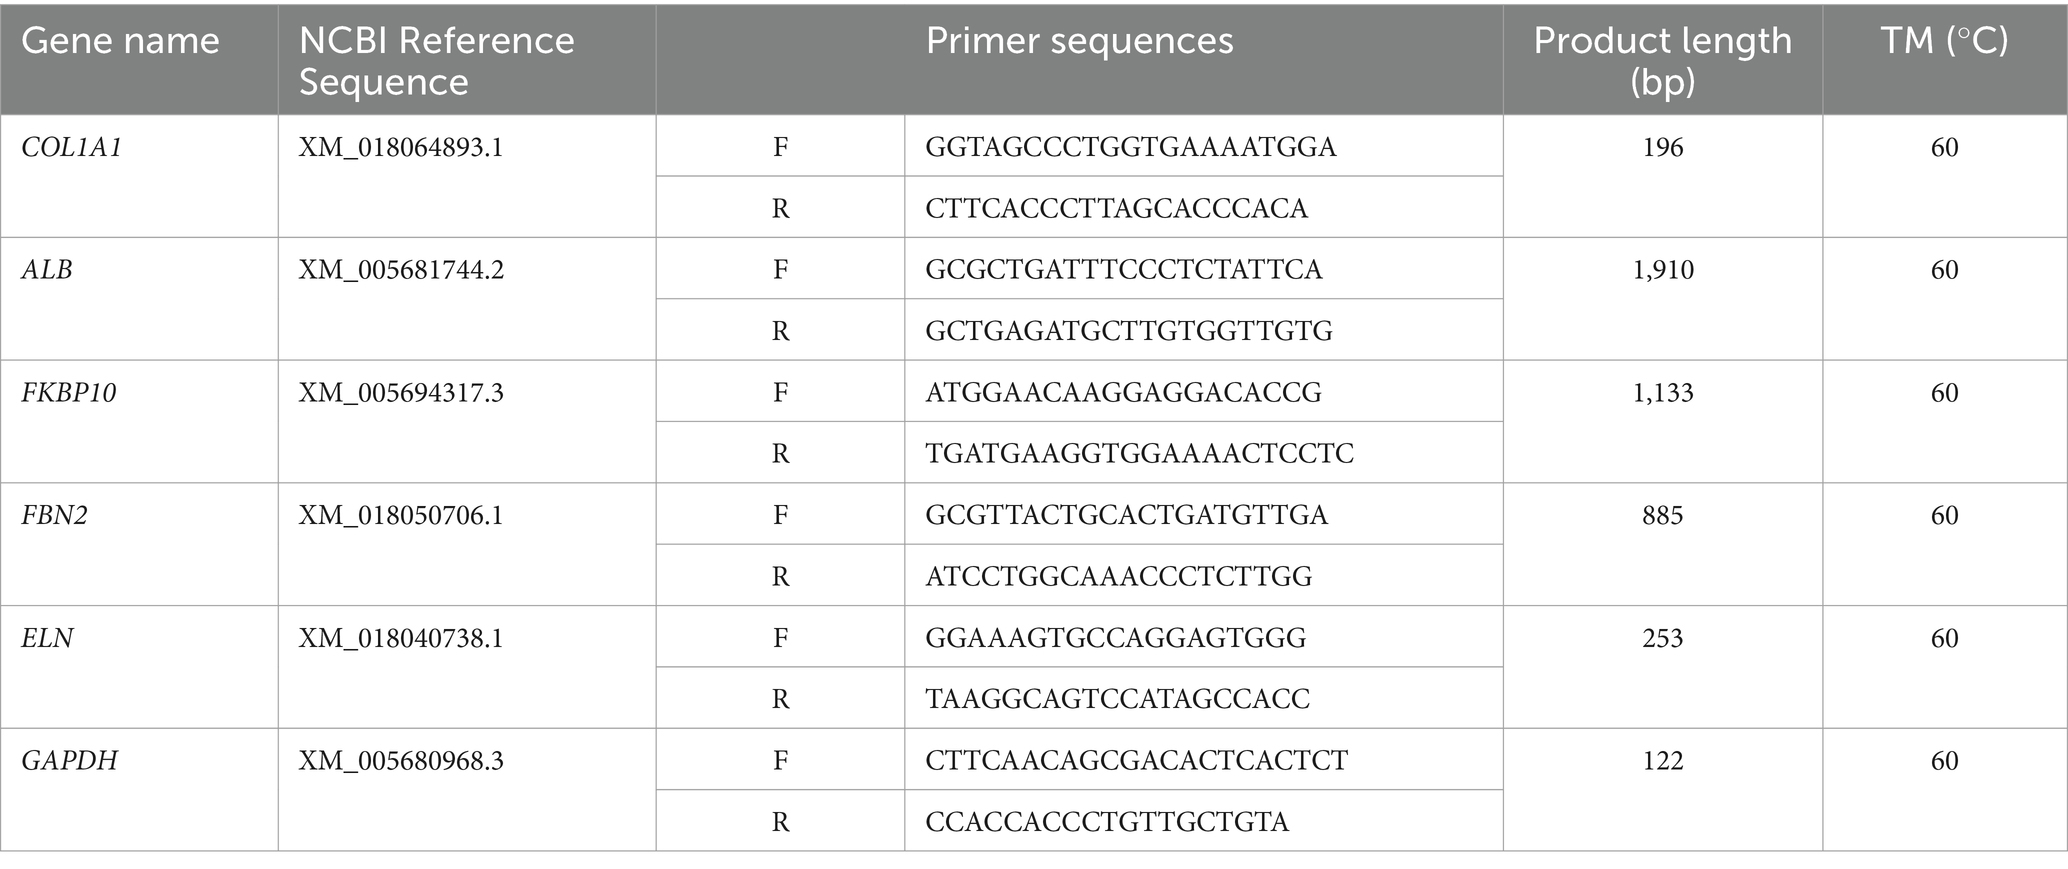
Table 1. Primer sequences of candidate and reference genes.
2.7 Western blot
The target protein separated by SDS-PAGE electrophoresis was transferred to a polyvinylidene fluoride (PVDF) membrane soaked in methanol, and the blocking solution was added for shaking 1 h on a shaker. Then the PVDF membrane was washed with TBST 3 times. ALB, COL1A1, FKBP10, ELN, FBN2, and GAPDH were incubated overnight with primary antibodies (Bioss, Beijing, China). After PVDF membrane was washed with TBST 3 times again, the secondary antibody (GeneTex, United States) was added and incubated for 2 h. Followed by washing the PVDF membrane with TBST, and ECL luminescent solution (Servicebio, Wuhan, China) was applied to the membrane and imaged in an imaging device (ImageQuant LAS 500, GE Healthcare, Piscataway, New Jersey, United States).
2.8 Immunohistochemistry
Paraffin sections were baked at 65°C and then deparaffinized in xylene. They were subsequently hydrated through a graded series of ethanol: absolute ethanol, 95, 85, and 75% ethanol, followed by immersion in distilled water. The sections were then immersed in citrate buffer and microwaved for 8 min, followed by cooling the sections to room temperature. After cooling, they were washed with PBS, treated with 3% hydrogen peroxide for 10 min, and rinsed with PBS. The sections were incubated with 5% sheep serum at room temperature for 20 min. Primary antibody (Bioss, Beijing, China) was added, and the sections were incubated overnight at 4°C. After incubation, the sections were incubated with secondary antibody (GeneTex, United States) at 37°C in the dark for 30 min and washed with PBS. DAB working solution (Solarbio, Beijing, China) was added for color development. Counterstaining was performed with hematoxylin for 1–3 min, followed by washing with distilled water, differentiation with acid alcohol, and washing with PBS. They were then dehydrated through a graded series of ethanol: 70, 80, 90, 95%, and absolute ethanol. Sections are dipped twice in xylene. Neutral gum was applied to the sections, which were allowed to dry before examination under a microscope.
2.9 Statistical analysis
The relative expression levels of ALB, COL1A1, FKBP10, ELN, and FBN2 genes were calculated using the 2−∆∆Ct method. Data were analyzed using one-way ANOVA with SPSS (Version 25), followed by multiple comparisons using the Duncan method, and graphs were generated using GraphPad Prism (Version 9.5). p < 0.05 was considered statistically significant.
3 Results
3.1 Quality of tissue sections
The skin sections of Inner Mongolian Cashmere goats at different growth stages prepared were stained with hematoxylin and eosin (Figure 1). The growth cycles of PHFs in cashmere goats is different from that of the SHFs. In anagen, SHFs were round and full, indicating the active growth stage of the follicles. Dermal papillae were present in SHFs. In catagen, SHFs exhibited signs of atrophy. In telogen, further contraction of SHFs was observed, with reduced growth activity. The distribution of SHFs with clear outlines at different stages was suitable on the slices, showing that the section quality was better to can be used for subsequent experiments.
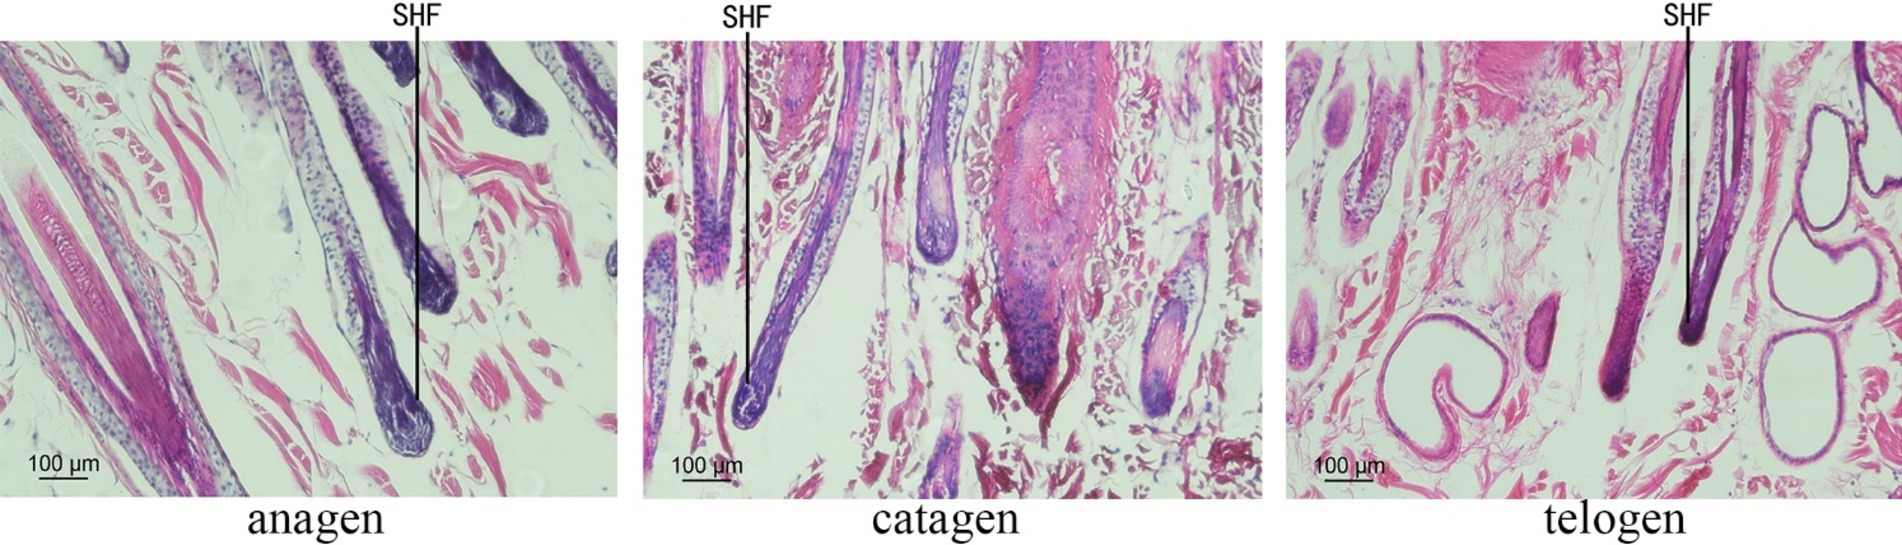
Figure 1. SHF morphological characteristics of cashmere goats.
3.2 Principal component analysis
The expression levels of reliable proteins obtained from raw data through database retrieval and screening were subjected to principal component analysis (PCA). The PCA analysis results were shown in Figure 2. The more points clustered, the higher similarity between the samples, and the more points discrete, the lower similarity between the samples. As shown in Figures 2A,B, the confidence zones of the anagen samples and the other two period samples overlap less, and there are large differences between them. In Figure 2C, although there are differences between the catagen and the telogen samples, the reason for the larger overlap between them comparing with the telogen and the anagen samples may be due to the short time interval between catagen and telogen. Figure 2D showed that the three samples in anagen and catagen were more concentrated, indicating that there is little difference within the group, and the samples showed better correlation and similar of protein composition. The three samples in telogen are relatively dispersed, which may be due to individual differences in telogen.
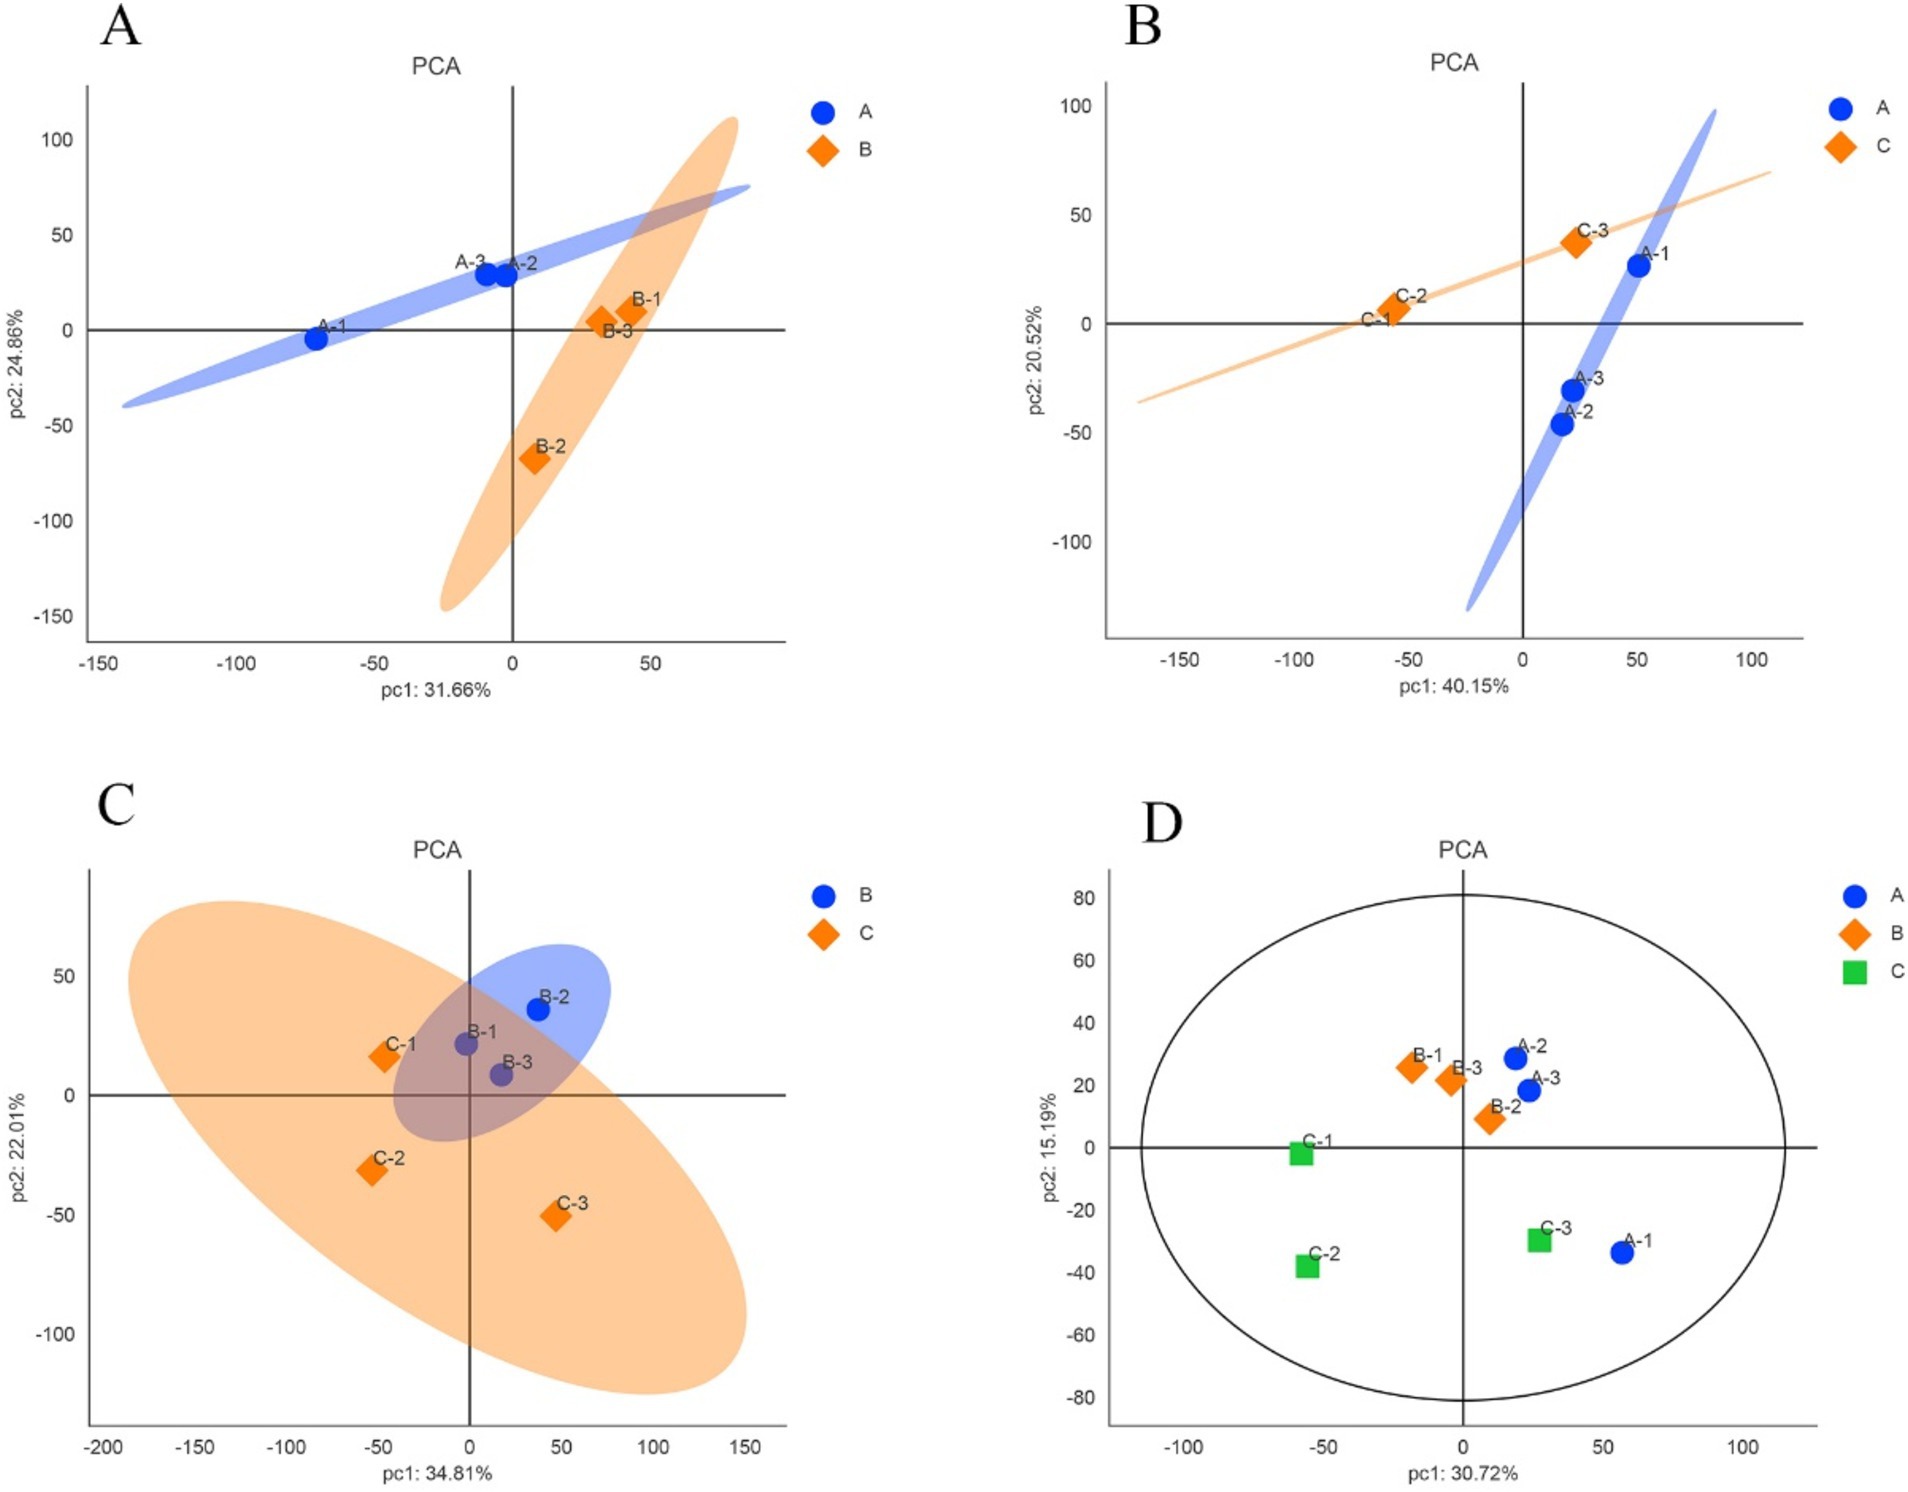
Figure 2. Principal component analysis of samples in different growth periods of SHFs in cashmere goats. (A) anagen and catagen (B) anagen and telogen (C) catagen and telogen (D) anagen, catagen and telogen. A, B, and C represent anagen, catagen, and telogen. In each figure, each point represents one replicate of an experimental group.
3.3 Differential protein screening and specificity analysis of cashmere goat SHFs at different growth stages
The proteins expressed in three different periods were screened separately. In anagen and catagen, there were 57 differentially expressed proteins, of which 24 were up-regulated proteins and 33 were down-regulated proteins. The significantly up-regulated proteins were KLK6, FBN2, GLYATL2, LOC102188300, CYP4X1, LOC102172669, etc., and the significantly down-regulated proteins were NAAA, QTRT1, A0A452G482, LGALS15, LOC102180520, BRAP, etc. (Figures 3A,D). In catagen and telogen, there were 31 differential proteins, of which 12 were up-regulated proteins and 19 were down-regulated proteins. The significantly up-regulated proteins were MBNL2, PLEKHF1, QTRT1, USP8, GTF2F1, ADD2, etc., and the significantly down-regulated proteins were NLGN2, TTC21B, GRM2, BRAP, GC, SYN1, etc. (Figures 3B,E). In anagen and telogen, there were 37 differentially expressed proteins, of which 19 were up-regulated proteins and 18 were down-regulated proteins. The significantly up-regulated proteins were LOC102172669, LOC108633164, KRT4, S100A7A, FBN2, CRNN, etc., and the significantly down-regulated proteins were A0A452FY47, LGALS15, TTC21B, POLR3GL, LGALS16, LOC102180520, etc. (Figures 3C,F).
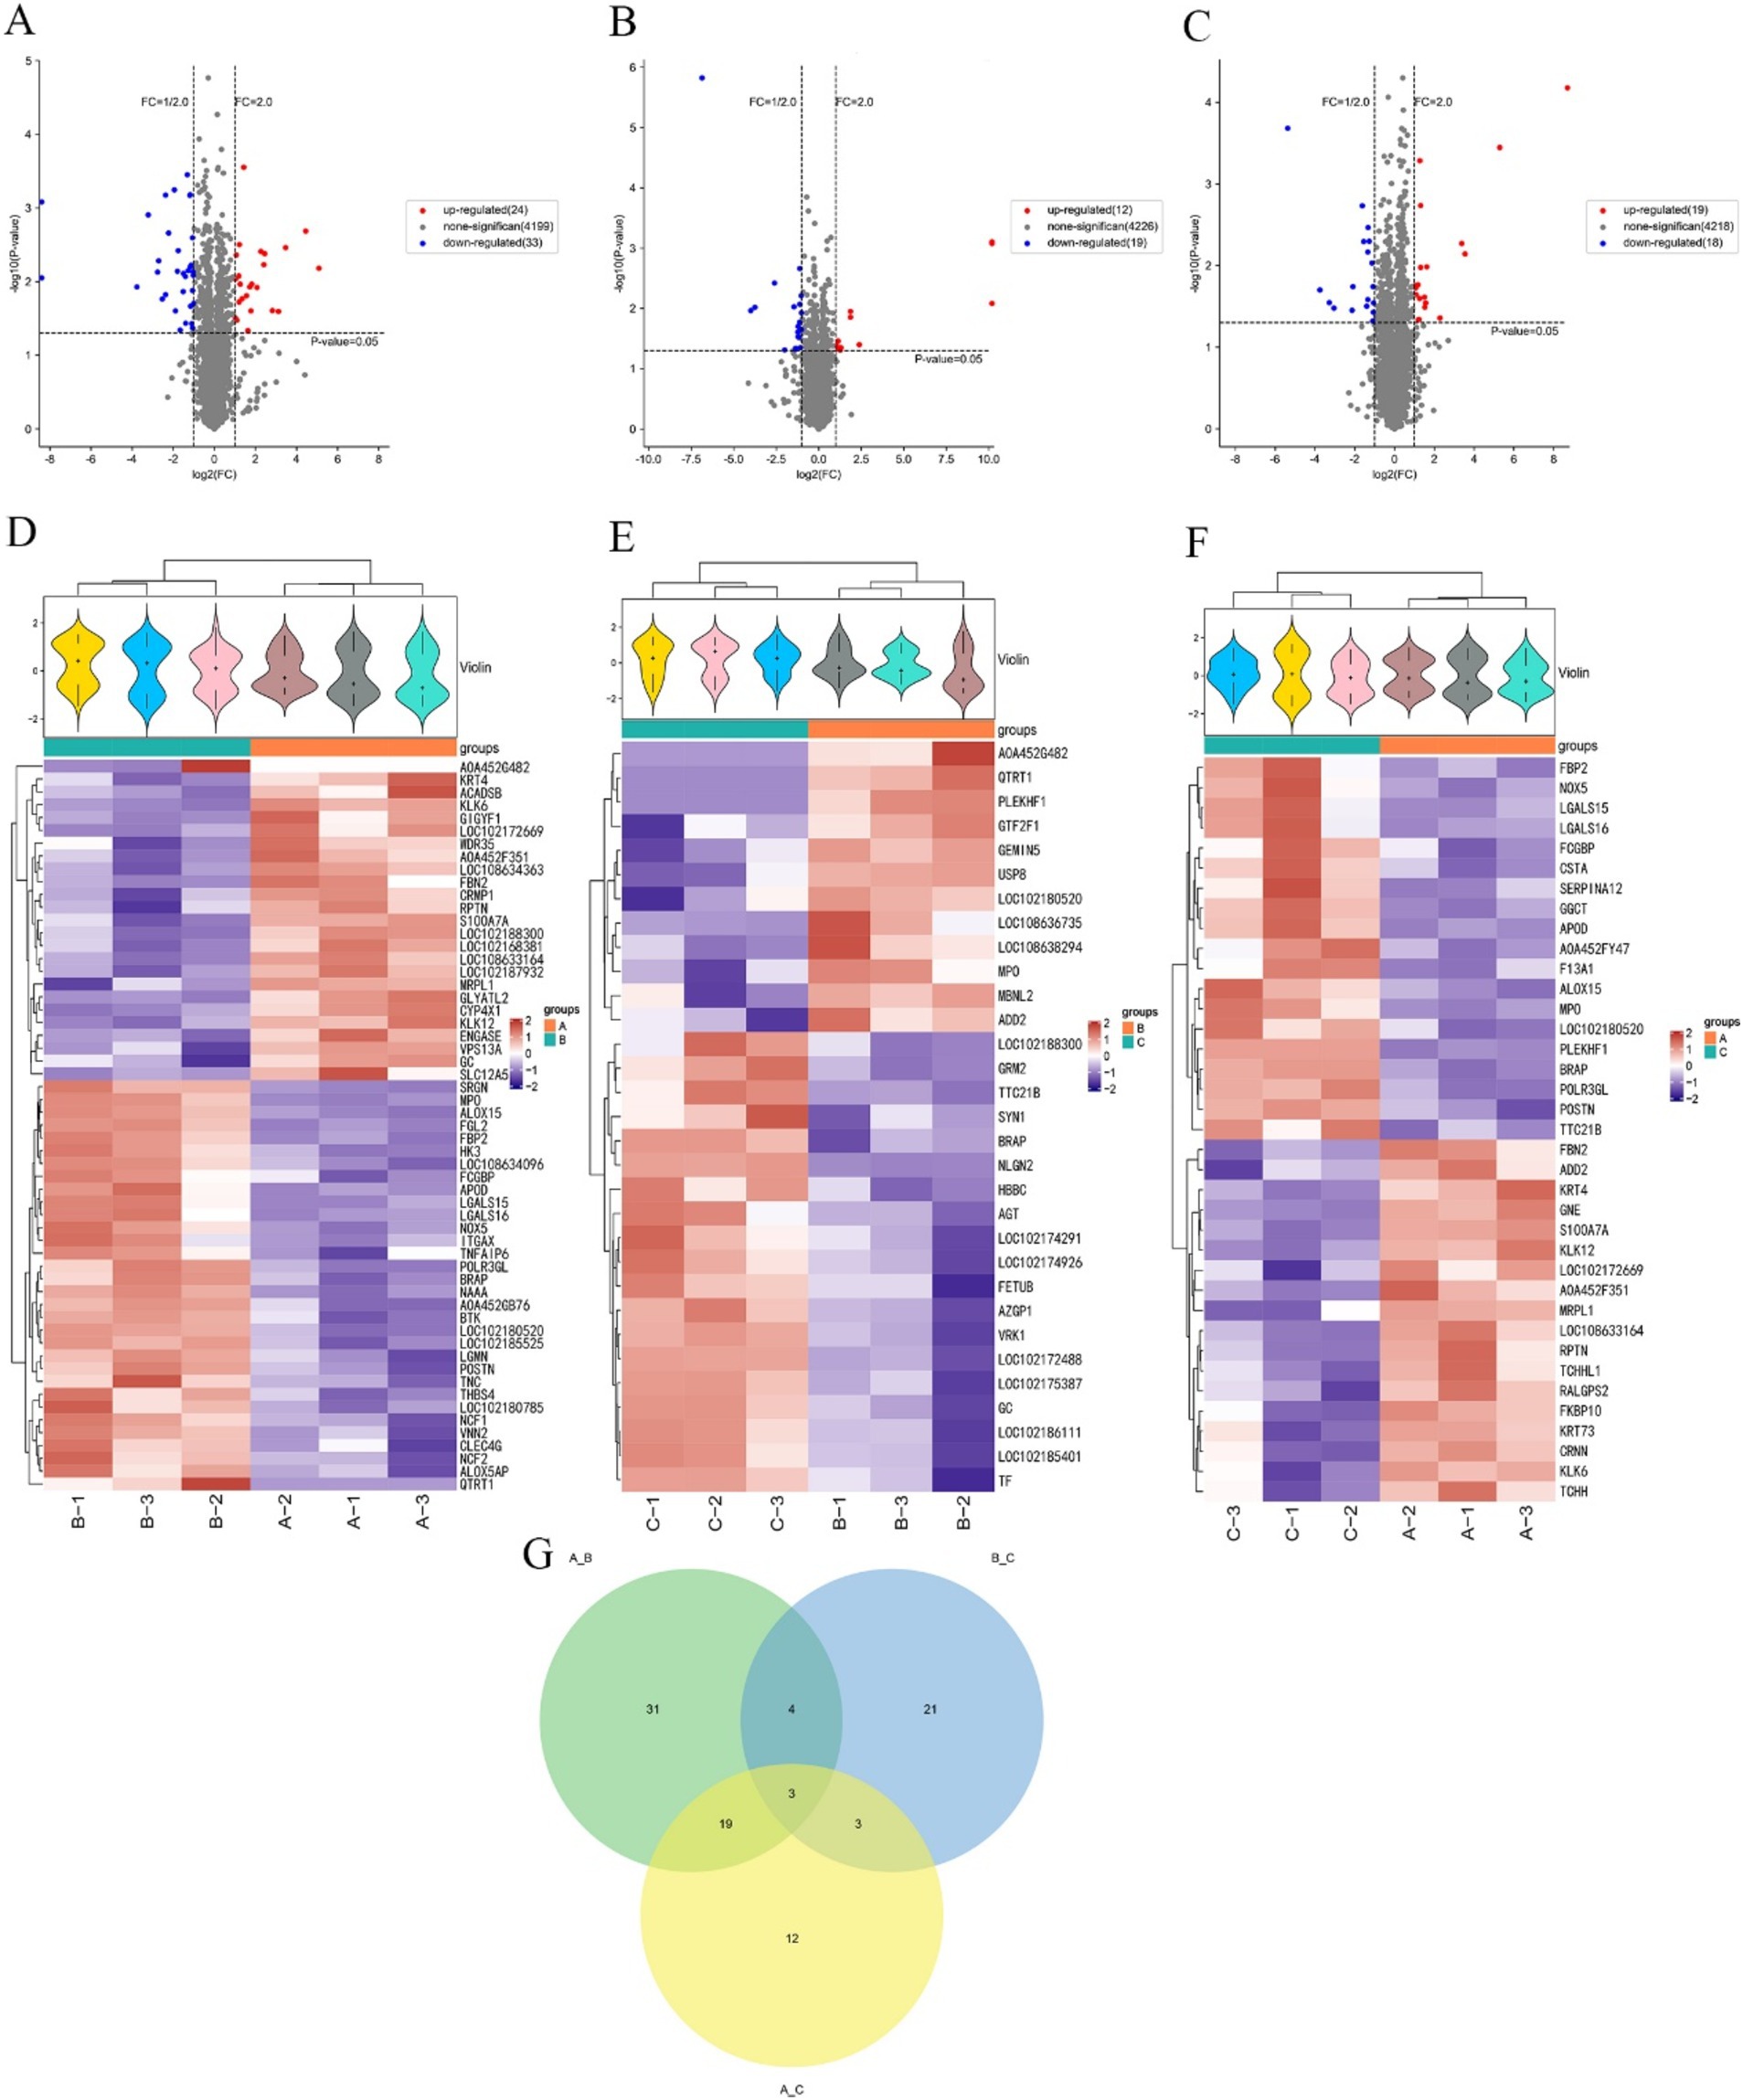
Figure 3. Screening of differential proteins in the skins of cashmere goats at different stages. (A) Volcano map of cashmere goat skins differential proteins in anagen and catagen. (B) Volcano map of cashmere goat skins differential proteins in catagen and telogen. (C) Volcano map of cashmere goat skins differential proteins in anagen and telogen. (D) Cashmere goat skins in anagen and catagen differential protein cluster analysis heat map. (E) Cashmere goat skins in catagen and telogen differential protein cluster analysis heat map. (F) Cashmere goat skins in anagen and telogen differential protein cluster analysis heat map. “+” represents the median. The vertical axis is the protein expression level, red indicates higher protein expression, and blue indicates lower protein expression. (G) Venn diagram of differential proteins. The numbers represent the number of differential proteins. A, B, and C represent anagen, catagen, and telogen.
The screened differentially expressed proteins in different periods were made into a Venn diagram (Figure 3G). Figure 3G shows that a total of 93 differential proteins were enriched in three periods. The largest number of differential proteins, 57, were found in anagen and catagen. The least number of differential proteins was found in catagen and telogen, with only 31. There were 31 differential proteins specific to anagen and catagen, 21 differential proteins specific to catagen and telogen, and only 12 differential proteins specific to anagen and telogen. Three differential proteins among anagen, catagen and telogen were screened, namely BRAP, MPO and LOC102180520.
3.4 Differential protein Gene Ontology and Kyoto Encyclopedia of Genes and Genomes analysis
In order to comprehensively and systematically describe the functions of differential proteins in cells and organisms, the GO entries corresponding to the number of differential proteins greater than 1 were screened through GO annotation. Analysis was performed according to biological process (BP), molecular function (MF), and cellular component (CC). GO terms were ranked from the largest to the smallest based on their-log10(p-value), and the top 10 terms within each category (biological process, molecular function, and cellular component) were selected. The differential proteins in growth phase and degenerative phase mainly involved in the biological process of cell adhesion; in the cellular component, they were enriched in the cytosol, extracellular region, and other components; in terms of molecular function, they mainly involved in calcium ion binding, carbohydrate binding, and transition metal ion binding (Figure 4A). The differentially expressed proteins in catagen and telogen mainly involved in four biological processes: endosome organization, positive regulation of canonical Wnt signaling pathway, positive regulation of transcription, and cell adhesion. In the cellular component, they mainly were enriched in the extracellular space; in terms of molecular function, they involved in metal ion binding and other functions (Figure 4B). The differential proteins in the growth phase and the resting phase mainly involved in the biological processes of peptide cross-linking and cell adhesion. In the cellular component, they mainly were enriched in extracellular region, cytosol, and other components; in terms of molecular function, they mainly involved in calcium ion binding, transition metal ion binding, etc. (Figure 4C). Through the analysis of the GO categories of differential proteins across three periods, it was discovered that these proteins were predominantly enriched in the functions related to cell adhesion, cytosol, extracellular region, calciumion binding and carbohydrate binding. Differential protein enrichment on cell adhesion indicates the importance of cell–cell interactions in the hair follicle growth cycles. Differential protein enrichment on the cytosol and extracellular region indicates the cytosol and extracellular region as crucial sites for signal transduction and material exchange during the hair follicle cycle transition. Differential protein enrichment on calciumion binding may shed light on the pivotal role of calcium signaling in regulating the hair follicle growth cycles. Furthermore, differential protein enrichment on carbohydrate binding suggests that carbohydrate may play a role in structural support and signal transduction in regulating the hair follicle growth cycles. This not only underscores the central role of these biological processes and functions in regulating the hair follicle growth cycles, but also hints at underlying mechanisms that persist throughout the lifespan of the hair follicle.
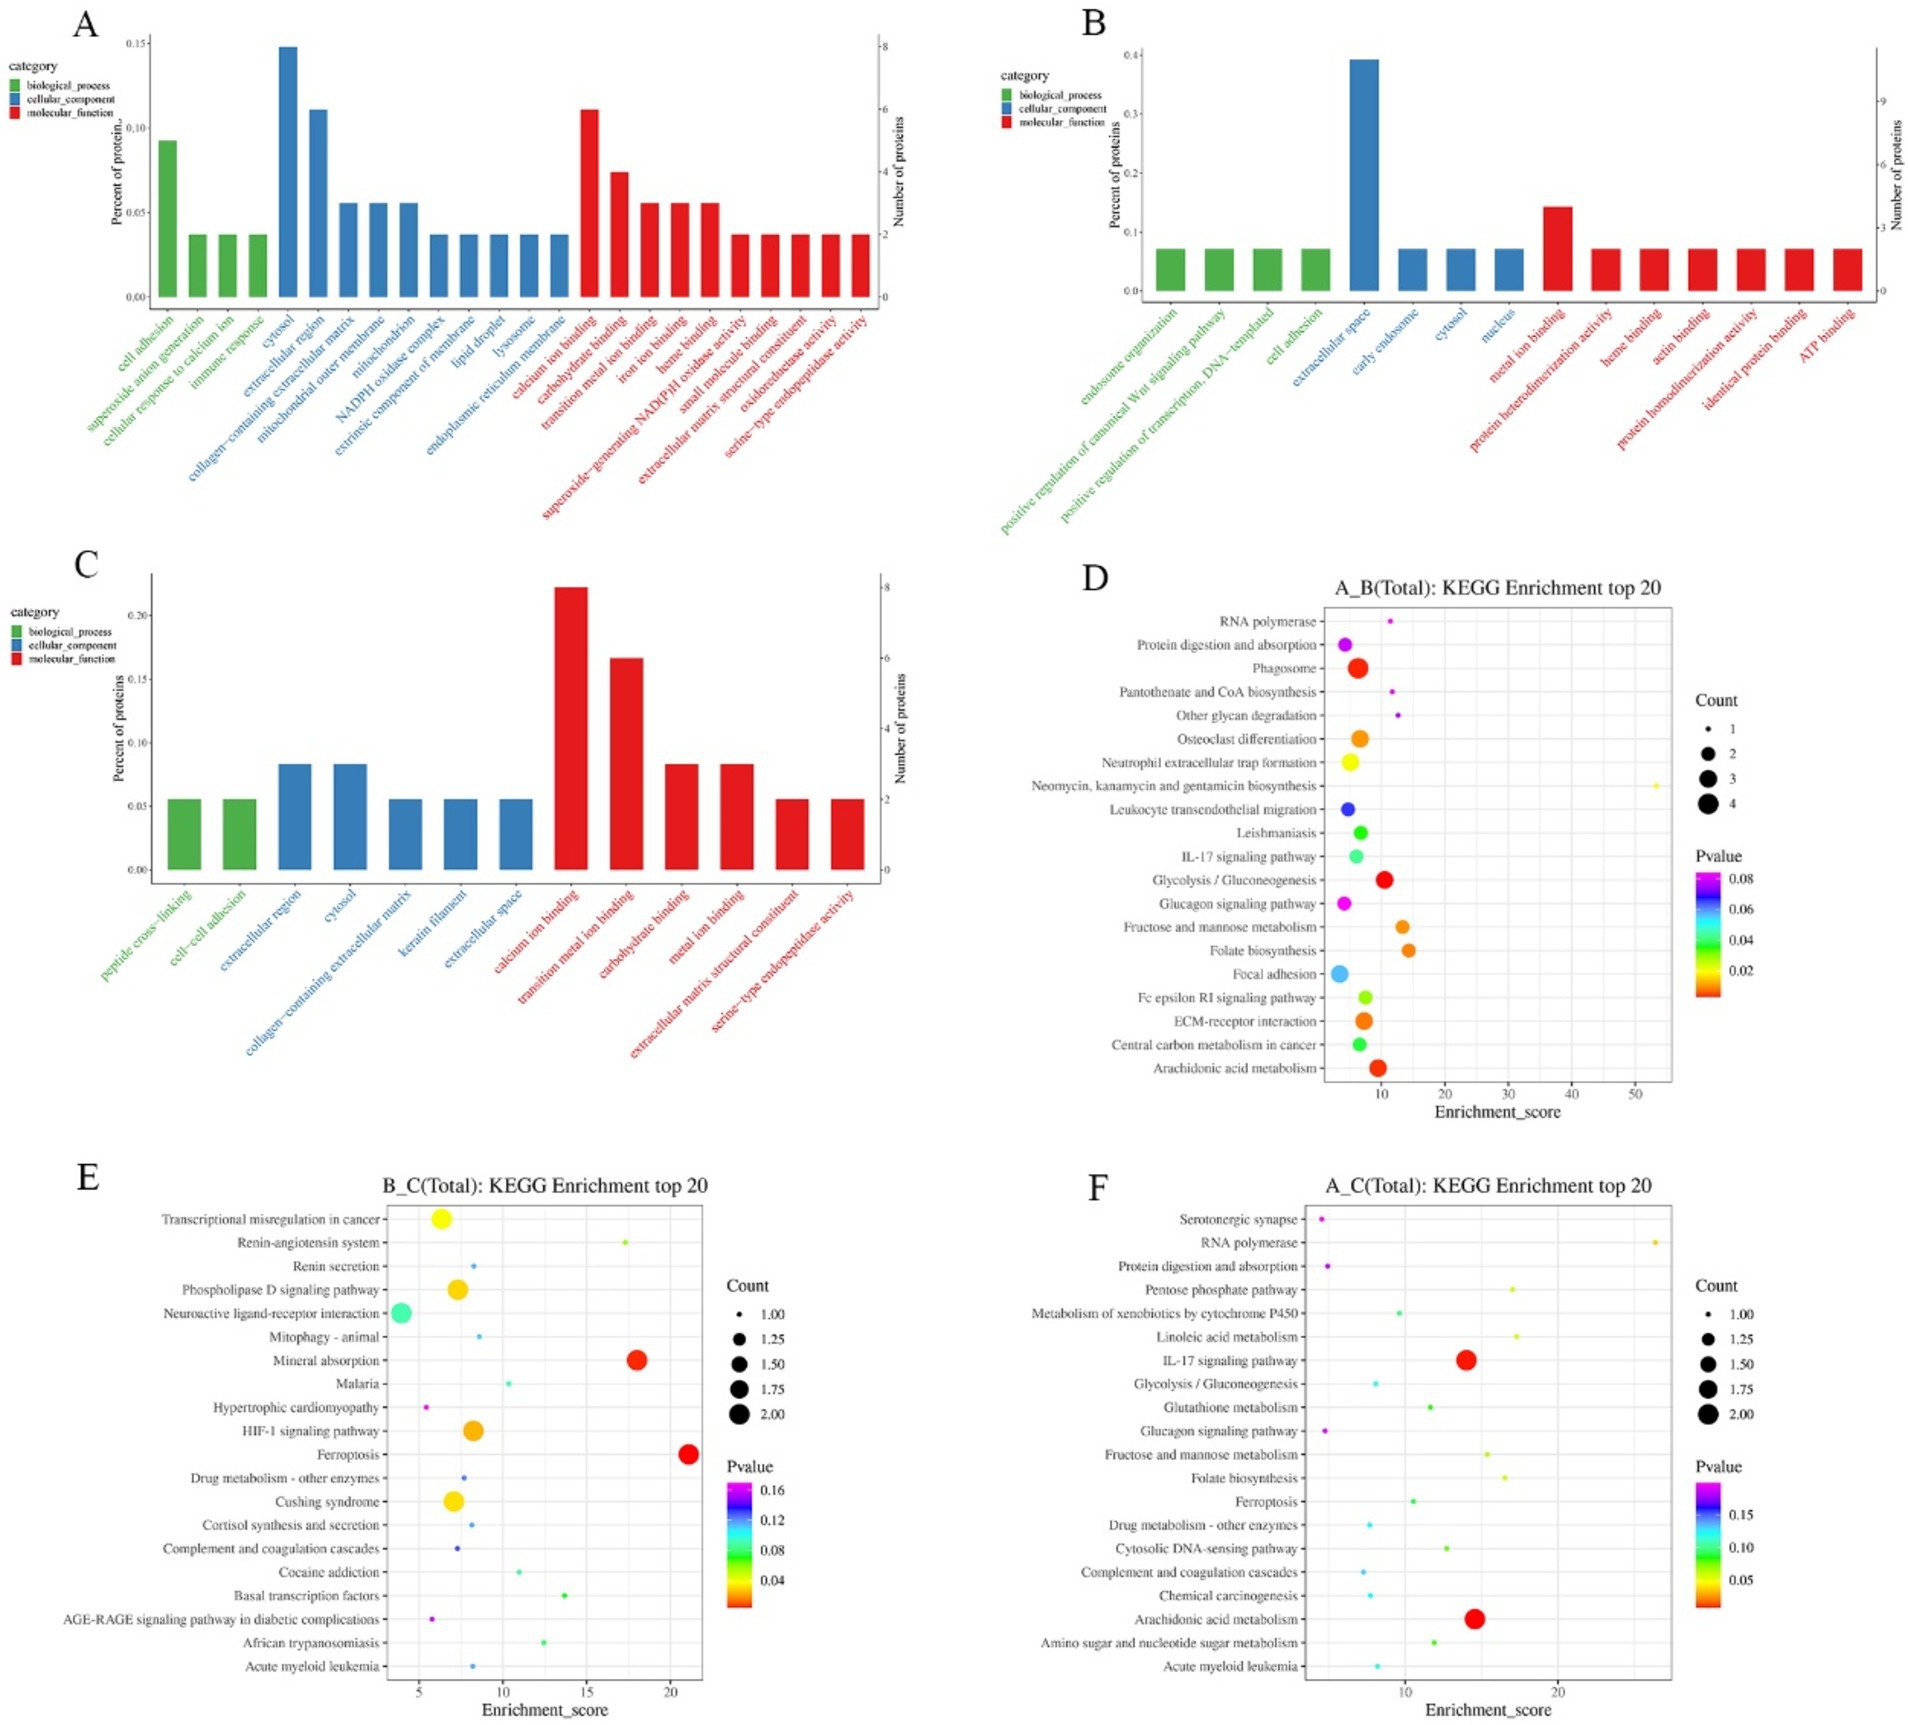
Figure 4. GO and KEGG enrichment analysis of differential proteins in different periods. (A) GO enrichment analysis in anagen and catagen. (B) GO enrichment analysis in catagen and telogen. (C) GO enrichment analysis in anagen and telogen. (D) KEGG enrichment analysis in anagen and catagen. (E) KEGG enrichment analysis in catagen and telogen. (F) KEGG enrichment analysis in anagen and telogen. The larger the bubble, the greater the number of differential proteins contained. The bubble color changes from red to green to blue-purple, and the smaller p-value, the greater the significance.
Pathway analysis of differential proteins was performed using the KEGG database, and the significance of differential protein enrichment in each pathway entry was calculated by hypergeometric distribution test. Pathways were ranked from the largest to the smallest based on their-log10(p-value), and the top 20 pathways were selected for analysis. In anagen and catagen, MPO, NCF1, THBS4, and NCF2 were enriched in the phagosome pathway. Proteins enriched in glycolysis/gluconeogenesis pathway were A0A452DP35, FBP2, and HK3; proteins enriched in the arachidonic acid metabolism pathway were ALOX15, LOC102172669, and LOC102187932 (Figure 4D). LOC102172488 and TF were enriched in the mineral absorption pathway in catagen and telogen; lOC102172488 and TF were enriched in the ferroptosis pathway. AGT and GRM2 were enriched in the phospholipase D signaling pathway. LOC102172488 and TF were enriched in the HIF-1 signaling pathway (Figure 4E). At the growing and resting stages, S100A7A and LOC108633164 were enriched by the IL-17 signaling pathway, and ALOX15 and LOC102172669 were enriched in the arachidonic acid metabolism pathway (Figure 4F).
3.5 Differential protein PPI and time series analysis
The differential proteins were analyzed in the STRING database to obtain the interaction relationship of the differential proteins. Then the interaction network visualization map of the top 25 node proteins with node connectivity was drawn by the Python software package “network.” There were 9 proteins up-regulated at the growth and regression stages, and they were LOC102172669, CYP4X1, ACADSB, A0A452F351, LOC102168381, KLK6, FBN2, RPTN, and CRMP1 according the interaction strength with other proteins. There were 16 down-regulated proteins, and the order of interaction with other proteins from strong to weak was NCF2, ALOX5AP, FGL2, NCF1, LOC102185525, ALOX15, SRGN, VNN2, BTK, LGMN, NOX5, FBP2, APOD, BRAP, FCGBP, and TNFAIP6 (Figure 5A). In telogen and catagen, 3 proteins up-regulated interacting with other proteins from strong to weak was QTRT1, ADD2, and USP8, and 11 proteins down-regulated interacting with other proteins from strong to weak were LOC102185401, FETUB, AGT, LOC102172488, TF, AZGP1, SYN1, NLGN2, GRM2, LOC102174926, and LOC102174291 (Figure 5B). At the growing and resting stages, 11 proteins up-regulated interacting with other proteins from strong to weak were CRNN, PPTN, TCHHL1, TCHH, KLK6, ADO2, FBN2, A0A452F351, KRT73, KLK12, and GNE. While 5 proteins were down-regulated, and the order of interaction with other proteins from strong to weak was APOD, GGCT, FBP2, CSTA, and FCG8P (Figure 5C).
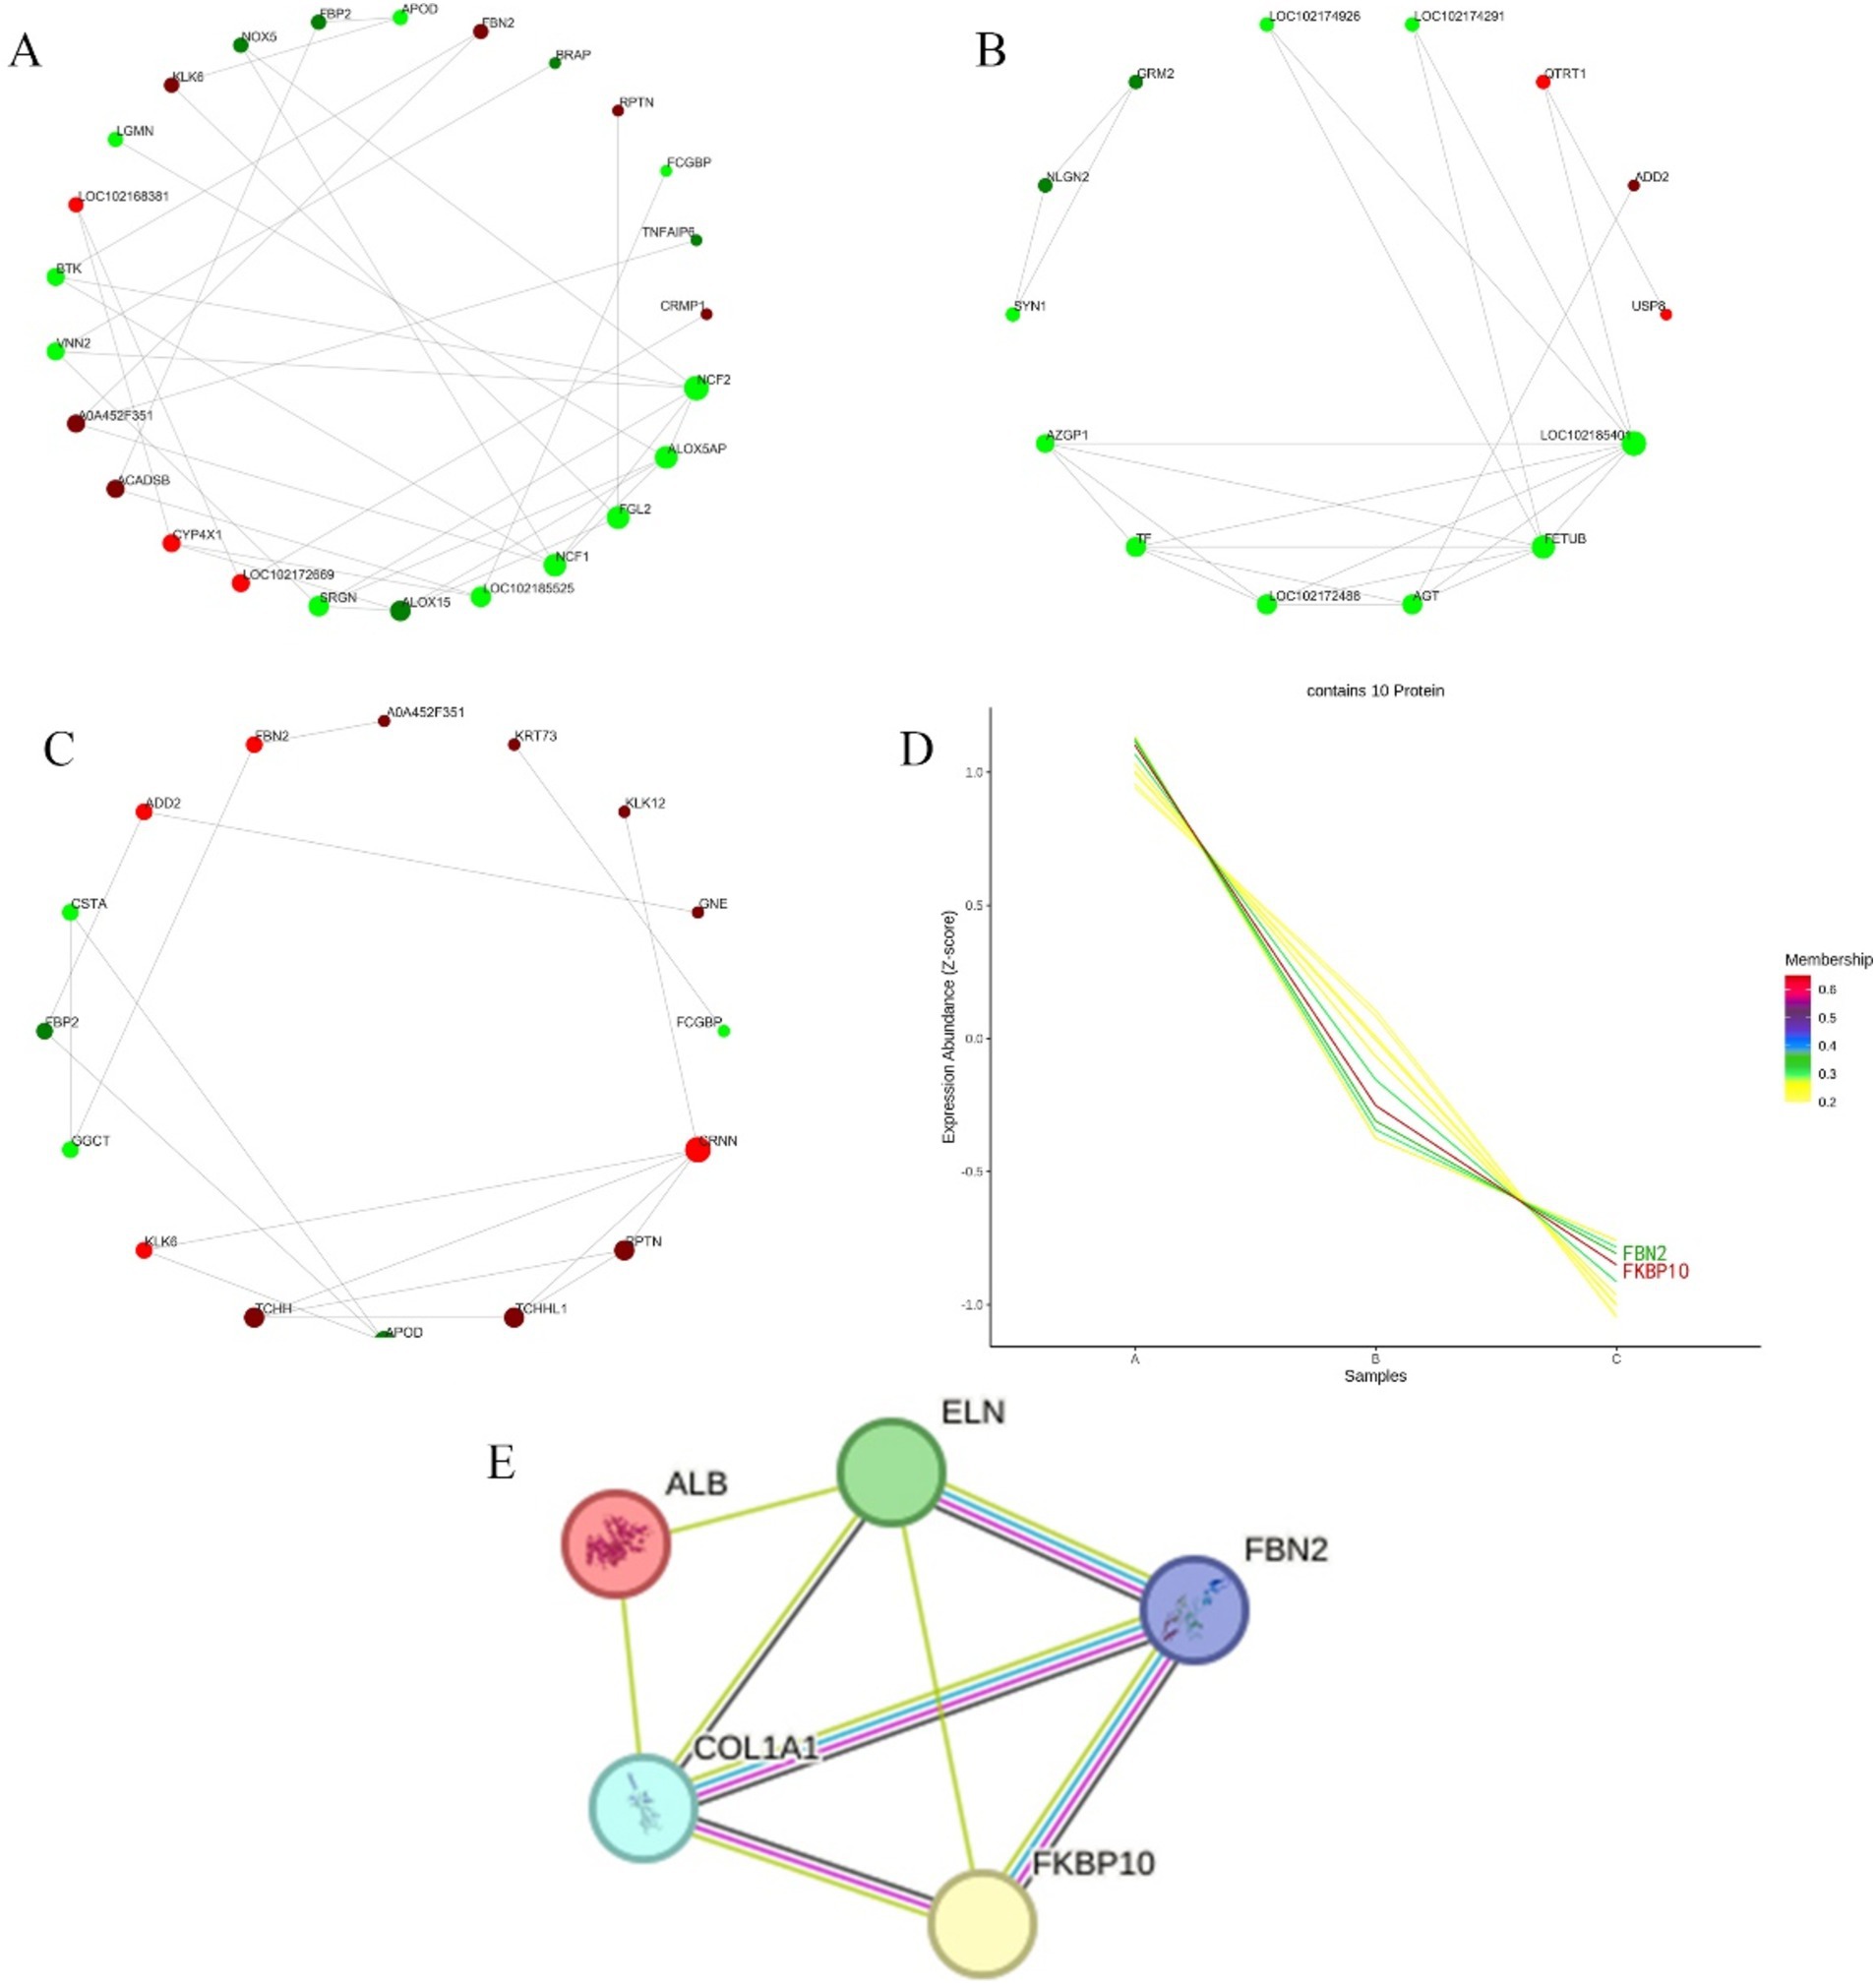
Figure 5. Differential protein interaction network and time sequence analysis. (A) Differential proteins interactions in anagen and catagen. (B) Differential protein interactions in catagen and telogen. (C) Differential protein interactions in anagen and telogen. In each figure, the red circle represents the up-regulated proteins; the green circle represents the down-regulated proteins; and the circle size represents the degree of connection. (D) Differential protein time series analysis. A, B, and C represent anagen, catagen, and telogen. Shades of color represent the degree of match. (E) Node proteins interaction network. Light blue and pink lines represent known interactions; blue comes from the selected database, and pink represents experimental determination; green, red, and dark blue lines represent predictive interactions; green represents gene neighborhoods; red represents gene fusion; and dark blue represents gene co-occurrence; the yellow line segment represents those mentioned in the literature; and the black line segment represents co-expression.
Using Short Time-series Expression Miner (STEM) software, the time series analysis of differential protein expression in anagen, catagen and telogen was carried out, and then the corresponding change trend model was constructed. Cluster that matched the trend of highest expression during anagen, followed by the catagen, and lowest in telogen were selected, as shown in Figure 5D. The number of lines in Figure 5D represents the final number of proteins matched to this cluster. The membership value represents the degree of each protein fitting into this cluster. The larger membership values, the better fit. Finally, 10 proteins were screened, including FKBP10, FBN2, GNE, TCHH, KRT4, RALGPS2, TCHHL1, CRNN, KRT73 and GTF2F1.
3.6 Prediction of interaction proteins for key proteins
PPI analysis was performed on FKBP10 and FBN2 screened by the STRING online protein database. The number of protein network nodes was 5, and the average number of nodes was 3.2. The results showed that the interaction proteins of FKBP10 and FBN2 were COL1A1 and ELN. There is an interaction between FKBP10 and FBN2, and their homologues are co-expressed and interact with each other in other organisms. COL1A1 and FKBP10 are co-expressed in other organisms. COL1A1 interacts with both ELN and ALB (Figure 5E).
3.7 Expression of key proteins, interacting proteins, and their genes in SHF growth cycles
The relative expression levels of COL1A1, ALB, FKBP10, FBN2, and ELN genes in different growth cycles of cashmere goat SHFs were significantly different (p < 0.05) (Figures 6A–E). They were expressed highest in the growing period, followed by the degenerative period, and lowest in telogen.
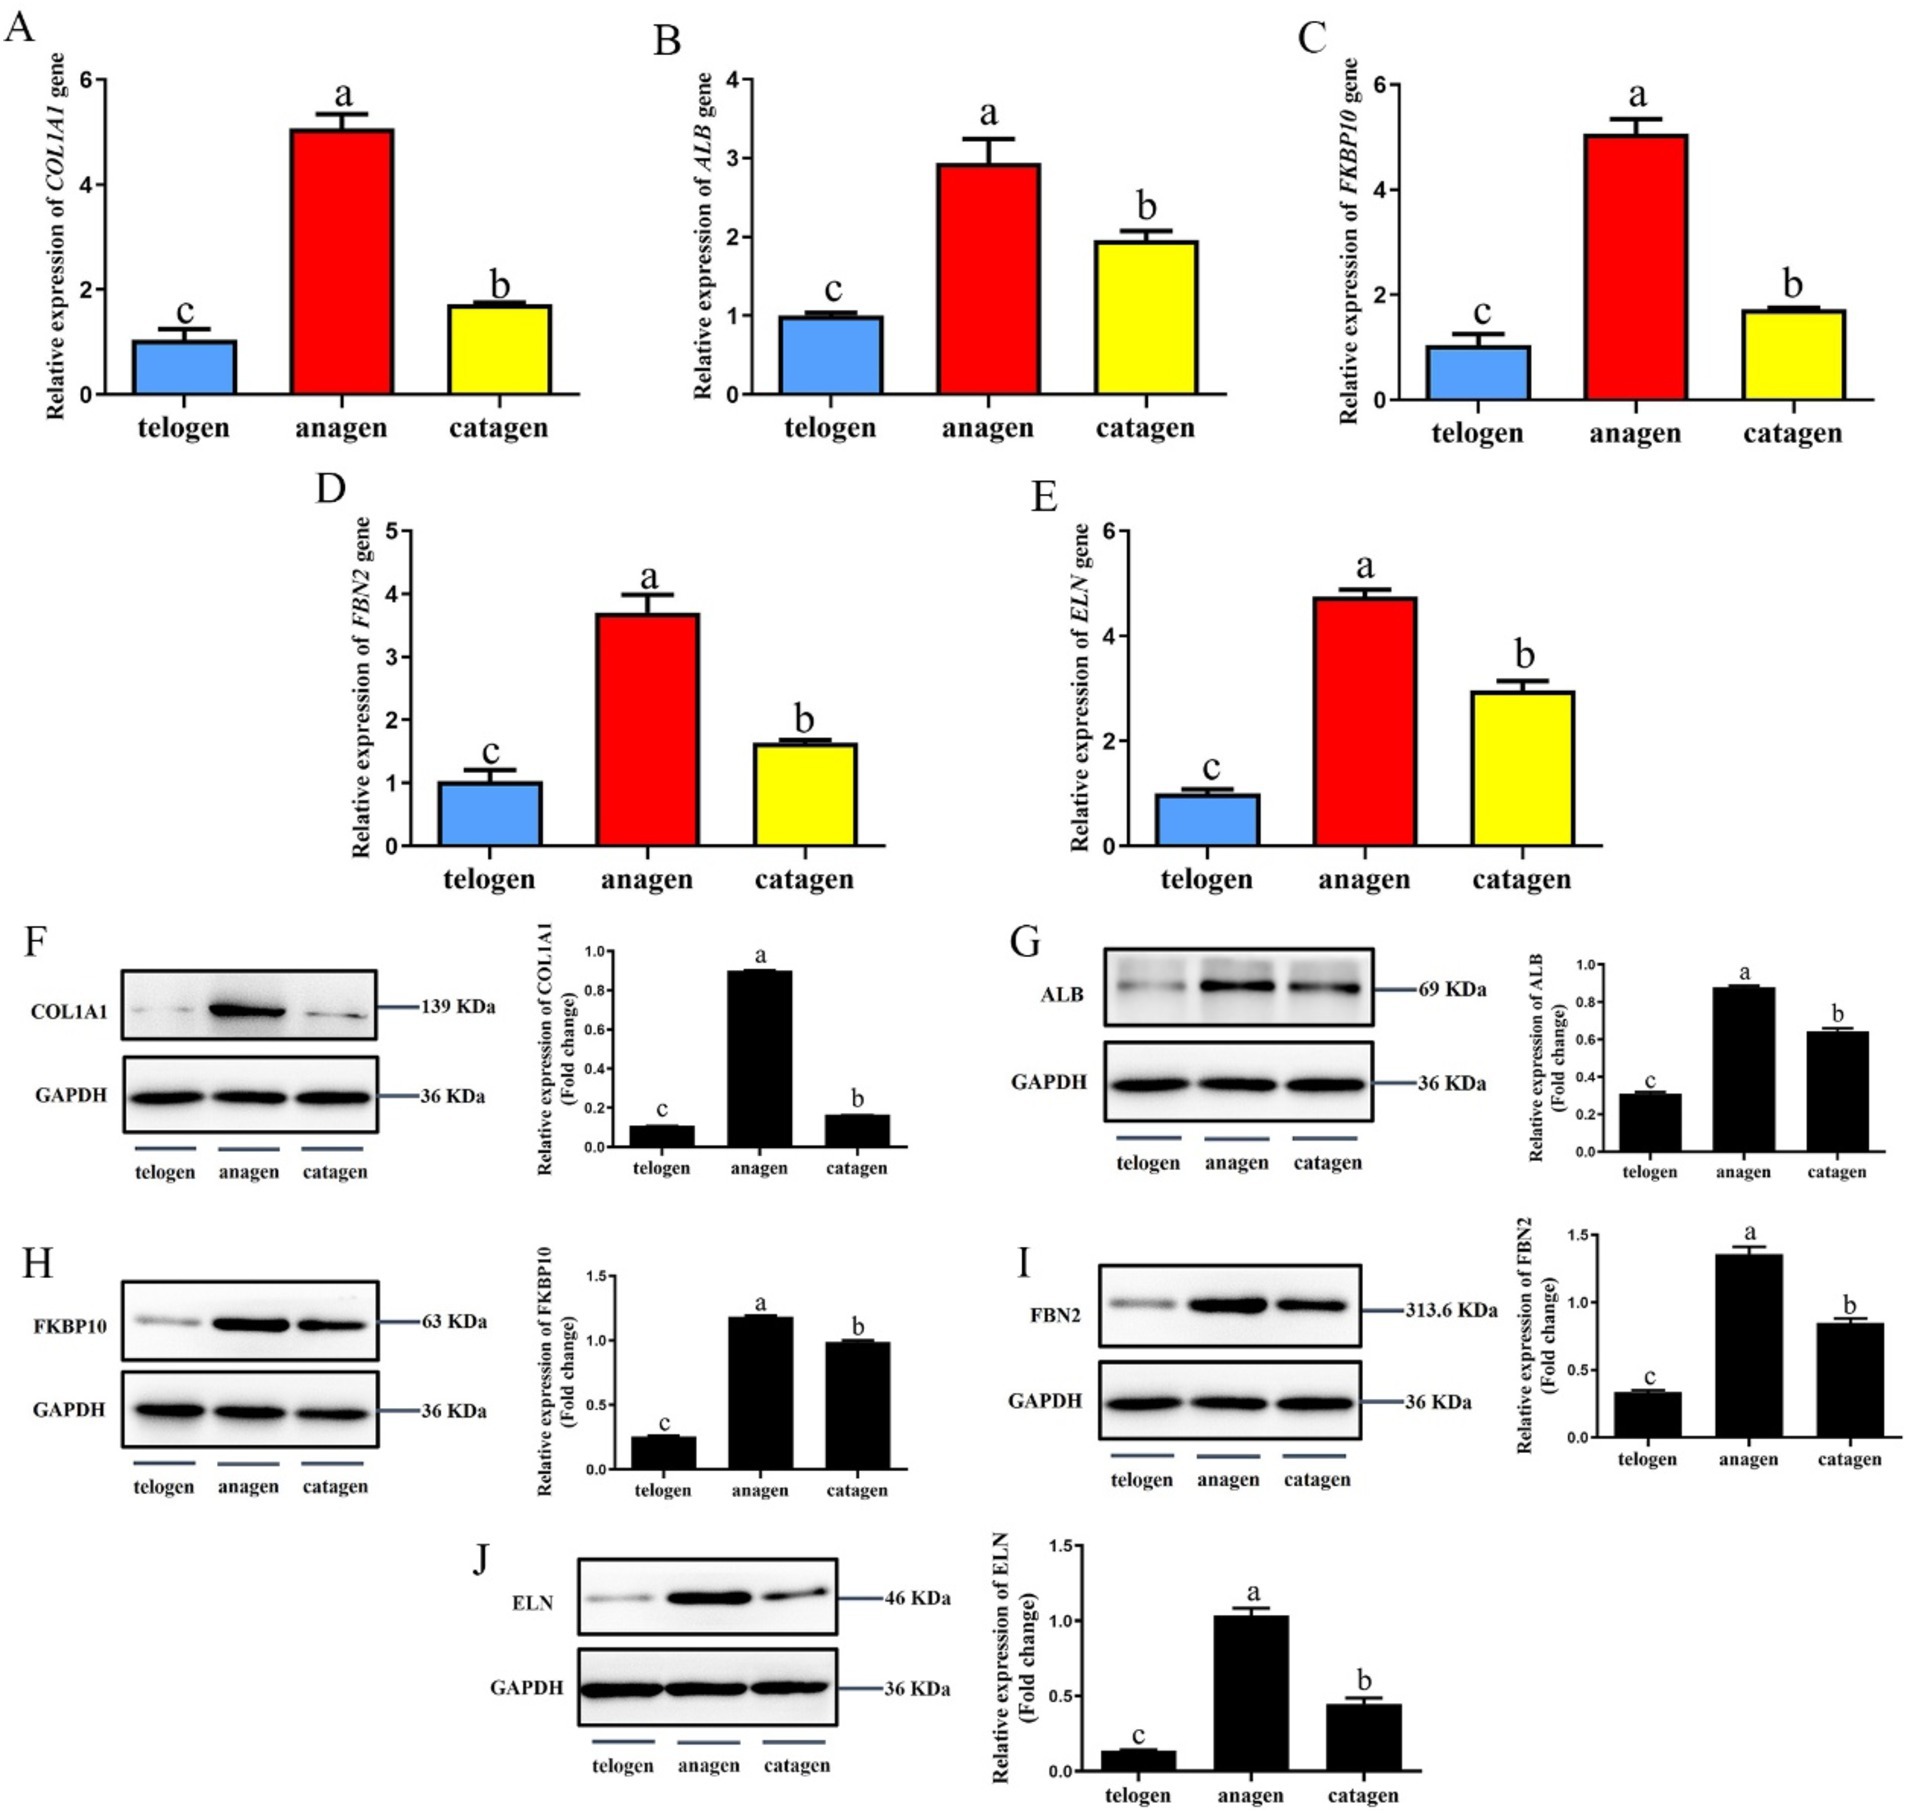
Figure 6. Expression of interaction proteins and their genes in the skins of SHFs in different growth periods. (A) The relative expression levels of COL1A1 gene. (B) The relative expression levels of ALB gene. (C) The relative expression levels of FKBP10 gene. (D) The relative expression levels of FBN2 gene. (E) The relative expression levels of ELN gene. (F) COL1A1 expression and semi-quantitative analysis. (G) ALB expression and semi-quantitative analysis. (H) FKBP10 expression and semi-quantitative analysis. (I) FBN2 expression and semi-quantitative analysis. (J) ELN expression and semi-quantitative analysis.
The protein expression levels of COL1A1, ALB, FKBP10, FBN2, and ELN in skins was detected by western blot (Figures 6F–J). The results showed that the expression trend of these proteins in the skins of different cashmere growth stages was consistent with the corresponding genes expression trend, and the protein expression level was the highest in the growth period, which was significantly higher than that in the regression period and telogen (p < 0.05).
3.8 The expression sites of key proteins and their interacting proteins in SHF growth cycles
The expression sites of FKBP10, FBN2, COL1A1, ELN, and ALB in SHFs was detected by immunohistochemistry. The signal intensity on the slices of different growth cycles was different.
FKBP10 and FBN2 were significantly expressed in the outer and inner root sheaths of SHF growth period, and their expression levels in the inner root sheath were higher than that in the outer root sheath, while the expression level of two proteins in the inner root sheath and outer root sheath was significantly reduced in the degeneration period and significantly higher than that in telogen (Figures 7A,B). COL1A1 was significantly expressed in the outer root sheath and inner root sheath during SHF growth period. During the degeneration period, the protein was expressed more in the outer root sheath and less in the inner root sheath. The expression in the inner root sheath and outer root sheath of SHFs during the resting period was significantly reduced (Figure 7C). ELN is expressed in the outer root sheath of SHFs during the growth period, and it is only expressed in a small amount in the outer root sheath during the degeneration period, and no expression in the inner root sheath and the outer root sheath of SHFs in telogen (Figure 7D). The expression of ALB in the outer root sheath and inner root sheath was obvious in SHF growth period, and the expression in the inner root sheath was more than that in the outer root sheath. In catagen and telogen, ALB expression in the inner root sheath and outer root sheath was significantly reduced (Figure 7E).
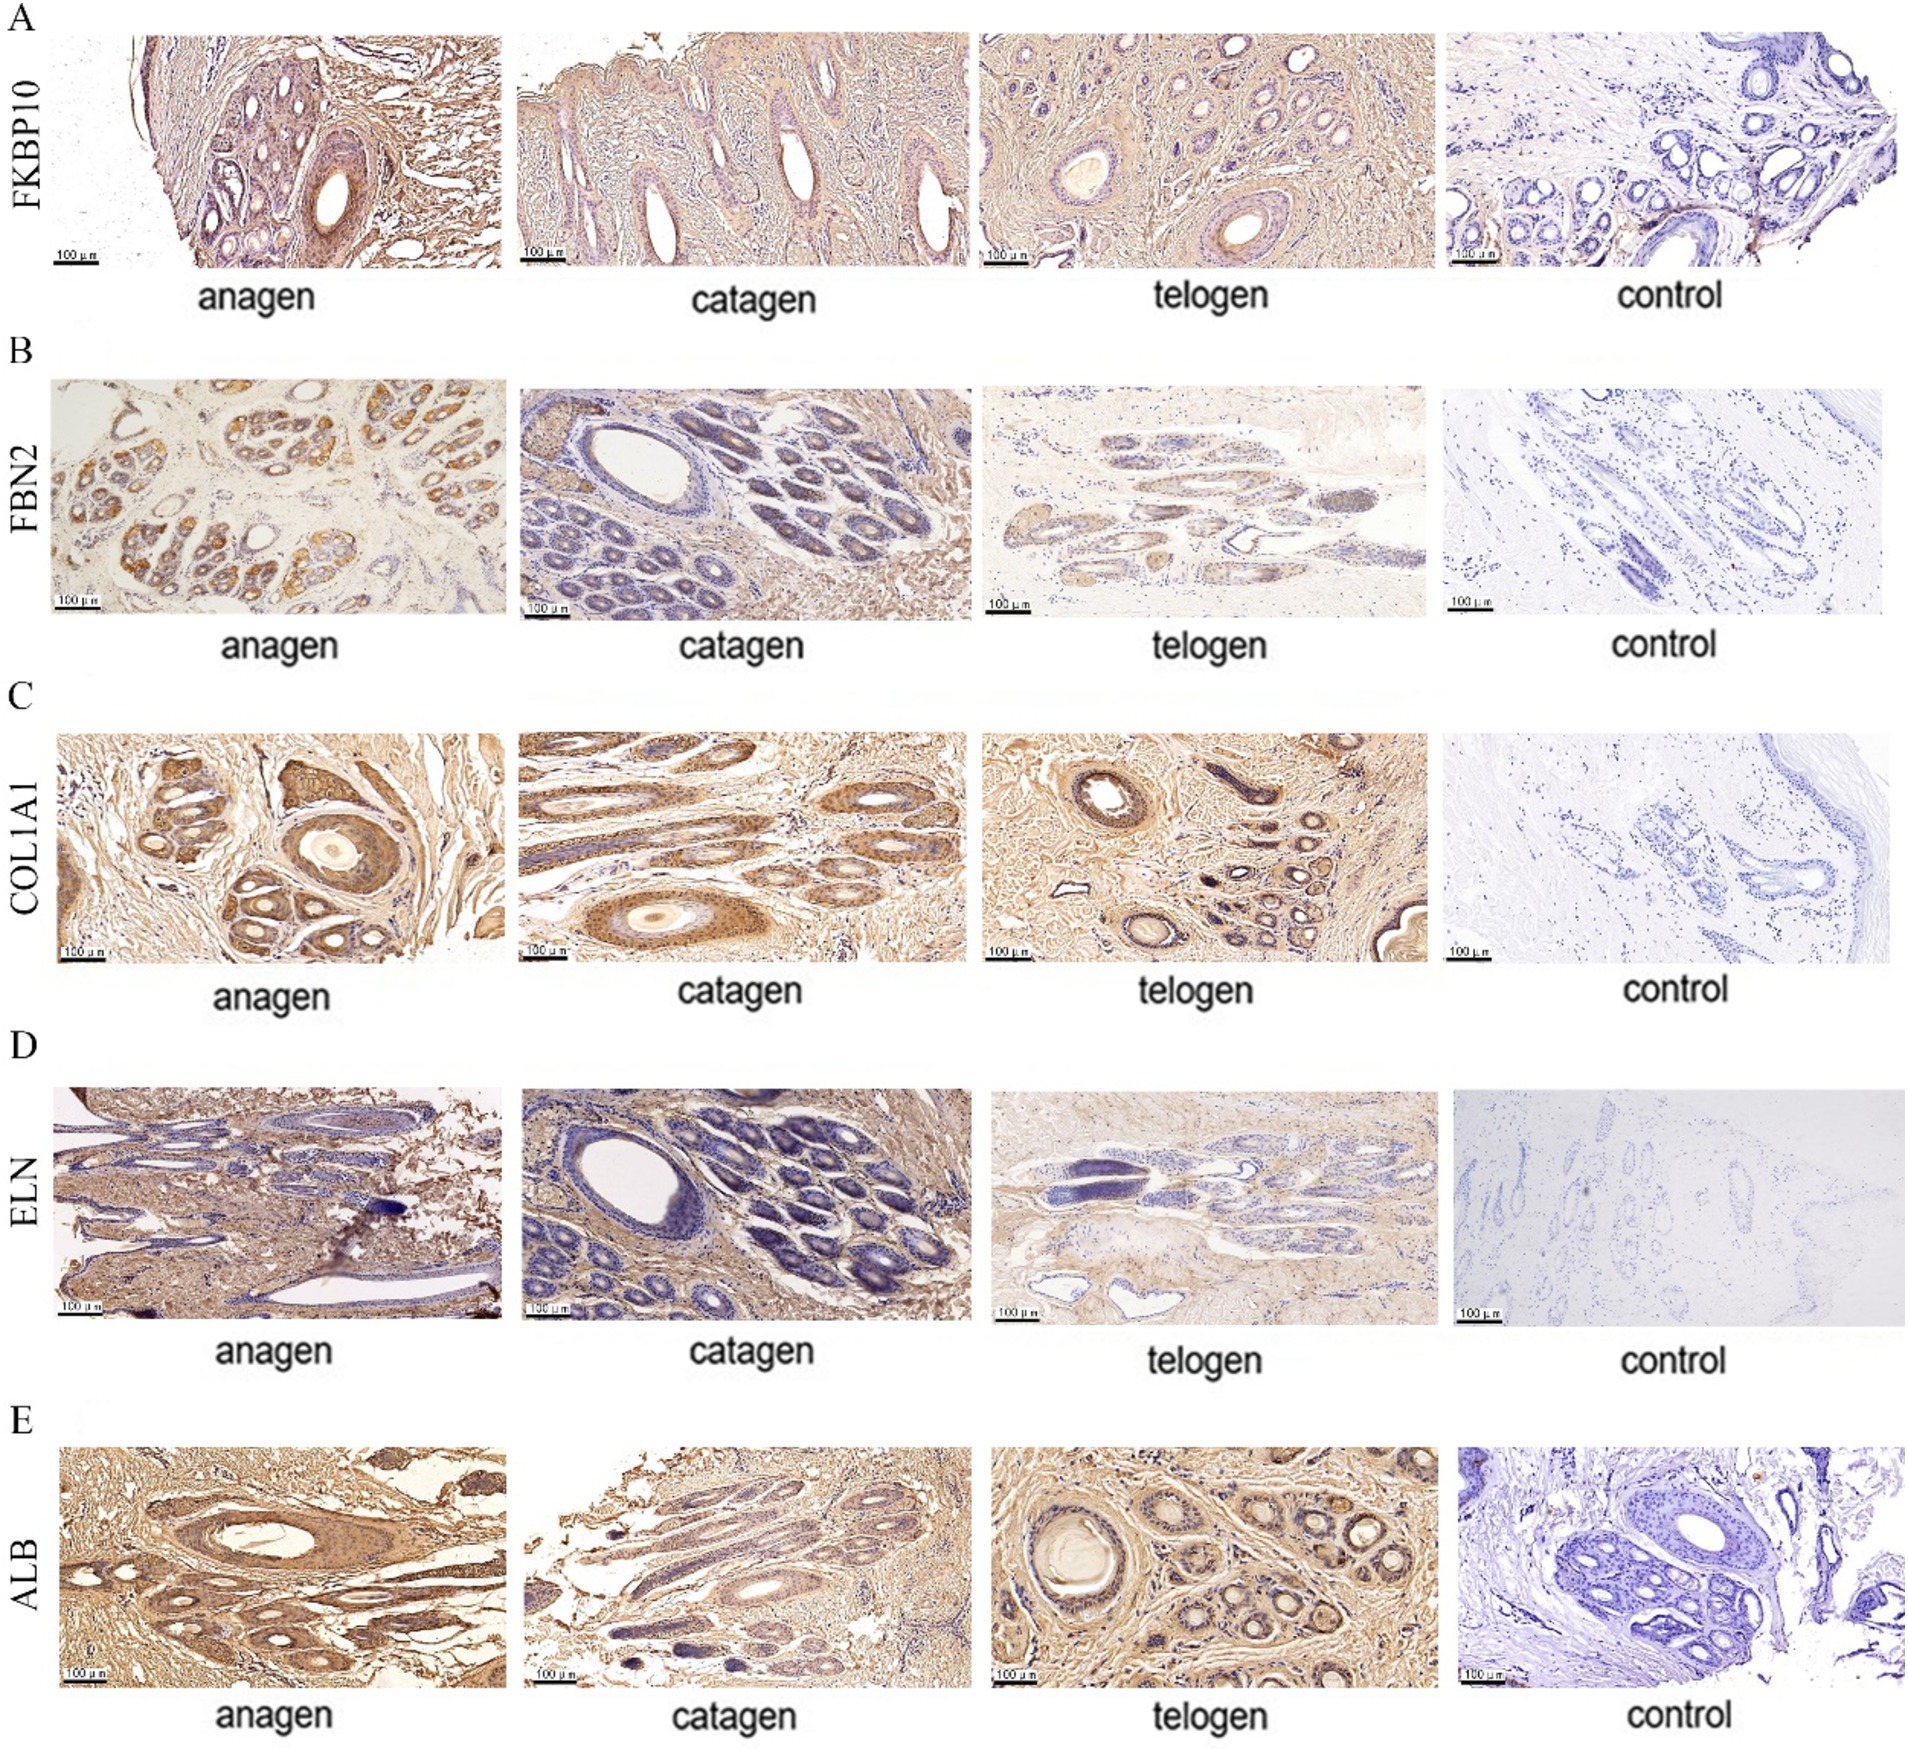
Figure 7. Five protein expression sites in SHFs at different growth stages. (A) FKBP10 immunohistochemistry (B) FBN2 immunohistochemistry (C) COL1A1 immunohistochemistry (D) ELN immunohistochemistry (E) ALB immunohistochemistry. Shades of brown indicate protein expression.
In summary, these proteins are expressed in SHFs in different periods and highly expressed in the outer root sheath in anagen.
4 Discussion
The hair follicles of cashmere goats are divided into two types, namely PHFs and SHFs. SHFs produce unmyelinated cashmere, while PHFs produce medullated coarse hairs (36). Under the influence of in vivo and in vitro environments, as well as the skin microenvironment, hair follicles show strong self-regeneration ability and undergo periodic changes from anagen of rapid growth and development to catagen when hair follicle cells begin to apoptosis and then to telogen of a relatively static state (37). In anagen, SHFs are in an active stage of growth and development, and the length of fleece depends on the duration of this stage. The longer growth period, the longer the wool fiber produced by cashmere goats. In recent years, many researchers have utilized transcriptomics, genomics, and other omics approaches to investigate cashmere goat hair follicles. With the development of modern sequencing technologies, whole genome sequencing is able to examine sequence differences between populations, morphologies, and varieties of a large number of genes and gene families simultaneously (38). Li et al. (39) identified 135 genomic regions associated with cashmere fiber traits in cashmere goat populations through whole genome sequencing of 70 cashmere goats, including genes that may be involved in cashmere fiber production, such as FGF5, SGK3, IGFBP7, etc. Whole transcriptomics is becoming increasingly important due to the increasing research on non-coding RNAs and the boom in high-throughput sequencing. Liu et al. (40) used transcriptomic sequencing to study the mRNA-microRNA regulatory mechanisms of cashmere growth in cashmere goats under different photoperiods, revealing and validating the target relationships of differentially expressed genes and miRNAs. BSDC1 and RHBDF2 were targeted to miRNA-107-3p, and ARSA was targeted to miRNA-107-3p. ALDH3A2 was targeted to miRNA-30b-3p. Xu et al. (41) adopted an integrated approach using transcriptomics, translatomics, proteomics, and metabolomics to identify substances associated with cashmere fineness, determining key regulators of cashmere fineness, including PLA2G12A, KRT79, and prostaglandin B2. During the periodic changes in hair follicle growth, many proteins involve in biological signal transduction, gene expression regulation, material and energy metabolism, cell cycle regulation, and other life activities through interactions with each other (16, 42–44). These proteins are trichohyalin (TCHH), KRT26, repetin (RPTN), cornulin (CRNN), tenascin-C (TNC), arachidonate-15-lipoxygenase (Alox15), SRY-box 18 (SOX18), matrix metalloproteinase-9 (MMP9), COL1A1, S100A7A etc. It is reported that TCHH was expressed in epithelial cells characterized by high mechanical strength, such as the inner root sheath cells of hair follicles. Its function was as an interfilament matrix protein by cross-linking with the head and tail ends of keratin intermediate filaments within the inner root sheath (45), and as a cross-linking enhancement protein, TCHH interacting with proteins such as RPTN, is crucial for the mechanical protection of the hair follicles. Through studying the expression patterns of specific genes of the hair follicles at different developmental stages in the inner root sheath of the embryonic of Tan sheep, Shi et al. (46) found that the expression level of TCHH gene was consistent with the pattern of wool crimping, and by affecting the morphology of the inner root sheath, it thereby affected the crimping of the wool of the beach sheep. Xu et al. (47) found that KRT26 and TCHH genes were associated with cashmere fineness through studying the relationship between KRT26 and TCHH gene polymorphisms and the production performance of Liaoning cashmere goat, which provided more theoretical basis for further research on cashmere fineness. RPTN involved in interactions with TCHH (48). RPTN was a member of the fusion protein family and is located on the epidermal differentiation complex on chromosome 1q21. The fusion protein family was associated with keratin intermediate filaments and is partially cross-linked to the cell envelope (CE) (49). In addition, CRNN of the fusion protein family is predominantly found in the upper spiny and granular layers of the epidermis and may be involved in the formation of the CE (50). Kim et al. (51) studied the anti-inflammatory role of Alox15 in skin homeostasis. The authors knocked out Alox15 in mice resulting in loss of hair follicle stem cells and an abnormal transition of dermal adipocytes to fibroblasts. Although the skin of Alox15 knockout mice appeared to develop normally after birth, impaired skin barrier as well as hair loss was observed in adult mice. TNC was a marker for touch dome keratin-forming cells, which induced new hair follicles upon stimulation (52), and it was thought to be a regulator of WNT signaling in hairs and is required for Wnt/β-catenin signaling (53). SOX2 and SOX18 of SOX family proteins played important roles in determining hair follicle types, and Villani et al. (54) demonstrated that Sox18 regulates the normal differentiation of dermal papillae in all hair types. WNT5A and TNC are potential downstream effectors of SOX18 and were important for epidermal WNT signaling, and the expression of WNT5A, MMP9 and TNC was significantly reduced in the skin of Sox18+/OP mice. Through RNA-seq of skin samples from E60 and E120 cashmere goat embryos as well as newly born cashmere goats, Gao et al. (55) showed that TNC was up-regulated as a key gene and expressed in HF initiation from E60 to E120. To explore the molecular mechanism of hair bending with growth, Liu et al. (17) identified CRNN and TNC as candidate genes for wool bending in Zhongwei goats. Tian et al. (56) showed hair growth is regulated by the KRT4 gene interaction network in a study of vellus hair follicles in different seasons in Min pigs. Based on comprehensive analysis of the transcriptome and proteome of cashmere goat skins, Dai’s et al. (16) showed that KRT4 and tβ 4 may interact to mediate extracellular signal regulated protein kinase (ERK) signaling pathway, thereby affecting hair growth, promoting SHF development, and improving cashmere production. KRTs family showed strong correlation throughout the hair follicle development cycle in yak, where KRT4 was associated with cell cycle regulation, hair follicle development, and proliferation of keratin-forming cells (57). Wu et al. (7) examined mRNA, lncRNA and their candidate genes in SHF development and cycling. It was determined that S100A7A is a key gene with importance in hair follicle development and cycling in the Jiangnan cashmere goat.
In this study, not only TCHH, KRT4, RALGPS2, CRNN, ALOX15, TNC, MMP9 and other proteins were screened, but also FKBP10, FBN2, GNE, TCHH1, KRT73 and GTF2F1, etc. were screened by analyzing the skin proteomics data of cashmere goats at different hair follicle growth stages. Therefore, we mainly verified the expression levels of FKBP10 and FBN2, and predicted their interaction proteins, ALB, COL1A1, and ELN. The experimental results were consistent with the sequencing results by qRT-PCR, western blot, and immunohistochemical verification at the gene and protein levels. They were highly expressed in the growth period of hair follicles, lowly expressed in telogen, and mainly expressed in the outer root sheath of SHFs. It shows that these five proteins promote hair follicle growth through different interactions. However, the specific way they interact in SHFs and their effects on hair follicle cells are still unclear. It is only found in the researches of others in other fields. FKBP10 is a member of the FK506-binding proteins (FKBPs). FKBPs are a class of highly homologous proteins widely expressed in eukaryotic cells that can assist transcription factors to regulate gene expression, participate in protein folding, modification, and transport, and have important functions. For example, studies on the relationship between FKBP10 and COL1A1 have shown that FKBP10 silencing can significantly reduce the mRNA level of COL1A1. It is speculated that FKBP10 silencing will change the quantity or cross-linking of extracellular matrix (58). Both of them can regulate Wnt/β-catenin and PI3K/AKT pathways related to cell proliferation and abnormal cell migration (59), promote the formation of cancer cells or participate in the occurrence of tumors through the interaction of cell adhesion molecules and receptors (60, 61), and regulate the fracture repair of osteoporosis (62). In the study of a mouse lung cancer model, it was found that the low expression of the FKBP10 protein could inhibit the occurrence of lung cancer. When endoplasmic reticulum stress occurred, FKBP10 protein was significantly down-regulated, and the expression of CyclinD1 protein decreased, which blocked the cell cycle and inhibited cell proliferation (63). ELN is an elastin, which is a common extracellular matrix component in connective tissue and plays an important role in maintaining tissue structure and function. The elastic fibers of skin tissue are loose network structures. The main components of elastic fibers are elastin and microfibers, and the formation of elastic fibers requires a variety of extracellular matrix proteins to be synthesized in a specific temporal and space order, while microfibers are composed of fibrillar protein (FBN), of which FBN2 is the main component (64, 65). In the early stage of tissue development, FBN1 and FBN2 synthesize microfiber bundles with a diameter of about 10 nm in the extracellular matrix in the form of N-terminal and C-terminal binding (66, 67), which is the basis for the final formation of the fiber bundle morphology of elastic fibers, binding to fibronectin (FN) and being fixed around the cell (68, 69). Mutations in the FBN2 gene are closely related to hereditary connective tissue diseases, such as congenital contractural arachnodactyly (CCA), macular degeneration (MD), and myopathy, etc. (70). Studies have found that in the early stage of tissue development, the content of microfibers is high, and after tissue development, the content of ELN is also high, indicating that ELN can bind to FBN2 and participate in the assembly of microfibrils and the regulation of growth factors (71, 72). Due to it can participate in many physiological processes such as promoting extracellular matrix synthesis, cell proliferation, and migration (73–76), in recent years, through gene co-expression analysis and proteome sequencing of cashmere goats, COL1A1 has been found to be associated with SHF growth (77, 78). It is believed that it can enhance the aggregation of dermal papilla cells and promote the growth of SHFs by affecting cell adhesion and movement (42). Cashmere fineness is a critical factor in determining cashmere quality. Wang et al. (28) used single-cell RNA sequencing to identify 13 skin cell types in Liaoning cashmere goats. Through cell trajectory analysis, the molecular changes during development were analyzed. SHF dermal papilla cells play a significant role in cashmere growth. It was found that COL1A1 is highly expressed in SHF dermal papilla cells. Zhao et al. (79) studied the molecular mechanism of hair follicle development through methylation and the whole transcriptome, proved the interaction between E65, E85, E105, and E135 and DNA methylation, and studied the development stages and genes related to wool growth, laying a foundation for improving wool trait breeding.
In order to further understand the interaction between the five proteins and reveal their roles in the growth of cashmere goat hair follicles, the following experiments will be carried out through yeast two-hybrid and co-immunoprecipitation to explore the signaling pathways and interaction modes regulated by them. The function of the above proteins in secondary dermal papilla cells will be verified by overexpression and interference techniques.
5 Conclusion
Based on iTRAQ quantitative proteomics technology, we identified and screened differential proteins in skins of cashmere goat in anagen, catagen and telogen. There were 57 differential proteins screened in anagen and catagen, of which 24 were up-regulated and 33 were down-regulated in anagen. There were 31 differential proteins screened in catagen and telogen, of which 12 were up-regulated and 19 were down-regulated in catagen. There were 37 differential proteins screened in anagen and telogen, of which 19 were up-regulated and 18 were down-regulated in anagen. Through analysis, two key proteins and three interacting proteins of hair follicle growth in cashmere goats were identified, namely FKBP10, FBN2, COL1A1, ELN, and ALB. The expression levels of these five proteins in skins of cashmere goat were highest in anagen, followed by catagen, and lowest in telogen. They are highly expressed in the outer root sheath of SHFs during the growing period, which can promote the growth of SHFs.
Data availability statement
Data during the current study are available from the corresponding author on reasonable request. Requests to access these datasets should be directed to Hongmei Xiao: bGh0ZHl4QDEyNi5jb20=.
Ethics statement
The animal study was approved by Inner Mongolia Agricultural University Laboratory Animal Welfare and Ethics Committee. The study was conducted in accordance with the local legislation and institutional requirements.
Author contributions
JC: Conceptualization, Formal analysis, Methodology, Writing – original draft, Writing – review & editing. FM: Conceptualization, Methodology, Writing – original draft, Writing – review & editing. RZ: Conceptualization, Methodology, Writing – original draft, Writing – review & editing. JF: Conceptualization, Formal analysis, Writing – original draft. YL: Methodology, Writing – review & editing. JZ: Methodology, Writing – review & editing. ZL: Formal analysis, Writing – review & editing. JL: Formal analysis, Writing – review & editing. HX: Conceptualization, Resources, Writing – review & editing.
Funding
The author(s) declare that financial support was received for the research, authorship, and/or publication of this article. This work was supported by National Natural Science Foundation of China (32160778 and 31860626), Science and Technology Major Project of Inner Mongolia Autonomous Region (RZ2200000003), Inner Mongolia Autonomous Region Directly Affiliated Universities Basic Scientific Research Fund-Young Teacher Research Capability Improvement Fund Project (BR220131).
Acknowledgments
The authors thank the members of Inner Mongolia Autonomous Region Key Laboratory of Bio-Manufacturing, especially Dong Wang for his assistance in the tissue collection.
Conflict of interest
The authors declare that the research was conducted in the absence of any commercial or financial relationships that could be construed as a potential conflict of interest.
Publisher’s note
All claims expressed in this article are solely those of the authors and do not necessarily represent those of their affiliated organizations, or those of the publisher, the editors and the reviewers. Any product that may be evaluated in this article, or claim that may be made by its manufacturer, is not guaranteed or endorsed by the publisher.
Abbreviations
FKBP10, FKBP prolyl isomerase 10; FBN2, Fibrillin 2; ALB, Albumin; COL1A1, Collagen type I alpha 1 chain; ELN, Elastin; qRT-PCR, Quantitative real-time PCR; iTRAQ/TMT, Isobaric tag for relative absolute quantitation/tandem mass tags; LC-MS/MS, Liquid chromatography-tandem mass spectrometry; PPI, Protein-protein interaction; BCA, Bicinchoninic acid; PVDF, Polyvinylidene fluoride; GAPDH, Glyceraldehyde-3-phosphate dehydrogenase; SHFs, Secondary hair follicles; PHFs, Primary hair follicles; GO, Gene Ontology; KEGG, Kyoto Encyclopedia of Genes and Genomes; BP, Biological process; MF, Molecular function; CC, Cellular component; STEM, Short Time-series Expression Miner; CE, Cell envelope; FKBPs, FK506-binding proteins; FBN, Fibrillar protein; FN, Fibronectin; CCA, Congenital contractural arachnodactyly; MD, Macular degeneration.
Footnotes
References
1. Zhao, Q, Huang, C, Chen, Q, Su, Y, Zhang, Y, Wang, R, et al. Genomic inbreeding and runs of homozygosity analysis of cashmere goat. Animals. (2024) 14:1246. doi: 10.3390/ani14081246
2. Chang, L, Zheng, Y, Li, S, Niu, X, Huang, S, Long, Q, et al. Identification of genomic characteristics and selective signals in Guizhou black goat. BMC Genomics. (2024) 25:164. doi: 10.1186/s12864-023-09954-6
3. Li, J. Study on breeding methods in Inner Mongolia cashmere goats In: PhD dissertation. Beijing: China Agricultural University (2005) (in Chinese)
4. Zhao, J. Screening and functional regulation network and verification of key proteins in the initiation of secondary hair follicle growth period in Liaoning cashmere goats In: MA thesis. Shenyang: Shenyang Agricultural University (2022) (in Chinese)
6. Ansari-Renani, HR, Ebadi, Z, Moradi, S, Baghershah, HR, Ansari-Renani, MY, and Ameli, SH. Determination of hair follicle characteristics, density and activity of Iranian cashmere goat breeds. Small Rumin Res. (2010) 95:128–32. doi: 10.1016/j.smallrumres.2010.09.013
7. Wu, C, Qin, C, Fu, X, Huang, X, and Tian, K. Integrated analysis of lncRNAs and mRNAs by RNA-Seq in secondary hair follicle development and cycling (anagen, catagen and telogen) of Jiangnan cashmere goat (Capra hircus). BMC Vet Res. (2022) 18:167. doi: 10.1186/s12917-022-03253-0
8. Gong, G, Fan, Y, Yan, X, Li, W, Yan, X, Liu, H, et al. Identification of genes related to hair follicle cycle development in Inner Mongolia cashmere goat by WGCNA. Front Vet Sci. (2022) 9:894380. doi: 10.3389/fvets.2022.894380
9. Dai, B, Sha, RN, Yuan, JL, and Liu, DJ. Multiple potential roles of thymosin Β4 in the growth and development of hair follicles. J Cell Mol Med. (2021) 25:1350–8. doi: 10.1111/jcmm.16241
10. Luo, Y, and Hao, F. Hair follicle growth cycle and dermal papilla. Northwest Def Med J. (2004) 25:287–9. (in Chinese). doi: 10.16021/j.cnki.1007-8622.2004.04.026
11. Lavker, RM, Miller, S, Wilson, C, Cotsarelis, G, Wei, ZG, Yang, JS, et al. Hair follicle stem cells: their location, role in hair cycle, and involvement in skin tumor formation. J Invest Dermatol. (1993) 101:16S–26S. doi: 10.1111/1523-1747.ep12362556
12. Geyfman, M, Plikus, MV, Treffeisen, E, Andersen, B, and Paus, R. Resting no more: re-defining telogen, the maintenance stage of the hair growth cycle. Biol Rev Camb Philos Soc. (2015) 90:1179–96. doi: 10.1111/brv.12151
13. Li, L, Huang, Z, Gu, Y, Zhang, J, Feng, X, and Wang, Z. Advances in proteomics technology in animal science. J Xichang Coll. (2023) 37:1–5. (in Chinese). doi: 10.16104/j.issn.1673-1891.2023.01.001
14. Furusawa, T, Ko, JH, Birger, Y, and Bustin, M. Expression of nucleosomal protein HMGN1 in the cycling mouse hair follicle. Gene Expr Patterns. (2009) 9:289–95. doi: 10.1016/j.gep.2009.03.002
15. Yang, B, Cai, MY, Li, YJ, Zhang, H, Cheng, GH, Zhang, JH, et al. Proteomic analysis identifies differentially expressed proteins participating in forming type iii brush hair in Yangtze River Delta white goat. Gene Expr Patterns. (2015) 14:323–38. doi: 10.4238/2015.January.23.6
16. Dai, B, Liang, H, Guo, DD, Bi, ZW, Yuan, JL, Jin, Y, et al. The overexpression of Tβ4 in the hair follicle tissue of Alpas cashmere goats increases cashmere yield and promotes hair follicle development. Animals. (2019) 10:75. doi: 10.3390/ani10010075
17. Liu, Y, Ding, Y, Liu, Z, Chen, Q, Li, X, Xue, X, et al. Integration analysis of transcriptome and proteome reveal the mechanisms of goat wool bending. Front Cell Dev Biol. (2022) 10:836913. doi: 10.3389/fcell.2022.836913
18. Li, Y, Zhou, G, Zhang, R, Guo, J, Li, C, Martin, G, et al. Comparative proteomic analyses using iTRAQ-labeling provides insights into fiber diversity in sheep and goats. J Proteome. (2018) 172:82–8. doi: 10.1016/j.jprot.2017.10.008
19. Gao, L, Zhang, Y, Zhang, W, Wang, Z, Nai, R, Du, C, et al. Analysis of protein expression profile of hair follicle cycle of Inner Mongolia cashmere goat. J Agric Biotechnol. (2014) 22:727–35. (in Chinese)
20. Jin, M, Cao, Q, Wang, R, Piao, J, Zhao, F, and Piao, J. Molecular characterization and expression pattern of a novel keratin-associated protein 11.1 gene in the Liaoning cashmere goat (Capra hircus). Asian Australas J Anim Sci. (2017) 30:328–37. doi: 10.5713/ajas.16.0078
21. Zhao, M, Zhou, H, Hickford, JGH, Gong, H, Wang, J, Hu, J, et al. Variation in the caprine keratin-associated protein 15-1 (Kap15-1) gene affects cashmere fibre diameter. Arch Anim Breed. (2019) 62:125–33. doi: 10.5194/aab-62-125-2019
22. Wang, J, Zhou, H, Luo, Y, Zhao, M, Gong, H, Hao, Z, et al. Variation in the caprine Kap24-1 gene affects cashmere fibre diameter. Animals. (2019) 9:15. doi: 10.3390/ani9010015
23. Zhao, M, Zhou, H, Luo, Y, Wang, J, Hu, J, Liu, X, et al. Variation in the caprine keratin-associated protein 27-1 gene is associated with cashmere fiber diameter. Genes. (2020) 11:934. doi: 10.3390/genes11080934
24. Wang, J, Zhou, H, Hickford, JGH, Zhao, M, Gong, H, Hao, Z, et al. Identification of caprine Krtap28-1 and its effect on cashmere fiber diameter. Genes. (2020) 11:121. doi: 10.3390/genes11020121
25. Zhao, M, Chen, H, Wang, X, Yu, H, Wang, M, Wang, J, et al. aPCR-SSCP and DNA sequencing detecting two silent SNPs at KAP8.1 gene in the cashmere goat. Mol Biol Rep. (2009) 36:1387–91. doi: 10.1007/s11033-008-9325-1
26. Manlin, W, Wenlei, B, Xiyan, H, Xu, Z, Yanfeng, W, and Zhigang, W. Molecular characterization and expression analysis of S6k1 in cashmere goats (Capra hircus). Asian Australas J Anim Sci. (2013) 26:1057–64. doi: 10.5713/ajas.2012.12710
27. Hui, T, Zhu, Y, Shen, J, Bai, M, Fan, Y, Feng, S, et al. Identification and molecular analysis of m6A-circRNAs from from cashmere goat reveal their integrated regulatory network and putative functions in secondary hair follicle during anagen stage. Animals. (2022) 12:694. doi: 10.3390/ani12060694
28. Wang, Z, Wang, Y, Hui, T, Chen, R, Xu, Y, Zhang, Y, et al. Single-cell sequencing reveals differential cell types in skin tissues of Liaoning cashmere goats and key genes related potentially to the fineness of cashmere fiber. Front Genet. (2021) 12:726670. doi: 10.3389/fgene.2021.726670
29. Li, J, Xing, W, Gegen, T, Zhang, C, Ren, Y, and Yang, C. Effect of fasted live-weight gain during the cashmere non-growing period on cashmere production performance and secondary hair follicle activity of cashmere goats. Animals. (2023) 13:3519. doi: 10.3390/ani13223519
30. Wu, C, Ma, S, Zhao, B, Qin, C, Wu, Y, Di, J, et al. Drivers of plateau adaptability in cashmere goats revealed by genomic and transcriptomic analyses. BMC Genomics. (2023) 24:428. doi: 10.1186/s12864-023-09333-1
31. Hu, L, Wang, J, Luo, Y, Liu, X, Li, S, Hao, Z, et al. Identification and characterization of circular RNAs (circRNAs) using RNA-Seq in two breeds of cashmere goats. Genes. (2023) 14:331. doi: 10.3390/genes14020331
32. Wu, C, Xu, Q, Li, J, Qin, C, Tulafu, H, Liu, W, et al. Regulation of cashmere fineness traits by noncoding RNA in Jiangnan cashmere goats. BMC Genomics. (2023) 24:604. doi: 10.1186/s12864-023-09531-x
33. Gao, GZ, Hao, F, Zhu, L, Jiang, GQ, Yan, W, Liu, J, et al. Combination of transcriptomics and proteomics reveals differentially expressed genes and proteins in the skin of EDAR gene-targeted and wildtype cashmere goats. Animals. (2023) 13:1452. doi: 10.3390/ani13091452
34. Bai, Z, Xu, Y, Gu, M, Cai, W, Zhang, Y, Qin, Y, et al. Proteomic analysis of coarse and fine skin tissues of Liaoning cashmere goat. Funct Integr Genomics. (2022) 22:503–13. doi: 10.1007/s10142-022-00856-6
35. String. String: functional protein association networks. Available from: https://string-db.org/ (Accessed August 27, 2022).
36. Yan, W, Hao, F, Zhe, X, Wang, Y, and Liu, D. Neural, adipocyte and hepatic differentiation potential of primary and secondary hair follicle stem cells isolated from Arbas cashmere goats. BMC Vet Res. (2022) 18:313. doi: 10.1186/s12917-022-03420-3
37. Wang, M, Dai, H, Sheng, S, Liu, Y, Zhang, S, Bai, W, et al. Discovery and functional analysis of secondary hair follicle miRNAs during annual cashmere growth. Int J Mol Sci. (2023) 24:1063. doi: 10.3390/ijms24021063
38. Chen, Q, Chai, Y, Zhang, W, Cheng, Y, Zhang, Z, An, Q, et al. Whole-genome sequencing reveals the genomic characteristics and selection signatures of Hainan black goat. Genes. (2022) 13:1539. doi: 10.3390/genes13091539
39. Li, X, Su, R, Wan, W, Zhang, W, Jiang, H, Qiao, X, et al. Identification of selection signals by large-scale whole-genome resequencing of cashmere goats. Sci Rep. (2017) 7:15142. doi: 10.1038/s41598-017-15516-0
40. Liu, B, Zhao, R, Wu, T, Ma, Y, Gao, Y, Wu, Y, et al. Transcriptomes reveal microRNAs and mRNAs in different photoperiods influencing cashmere growth in goat. PLoS One. (2023) 18:e0282772. doi: 10.1371/journal.pone.0282772
41. Xu, Y, Zhang, Y, Qin, Y, Gu, M, Chen, R, Sun, Y, et al. Multi-omics analysis of functional substances and expression verification in cashmere fineness. BMC Genomics. (2023) 24:720. doi: 10.1186/s12864-023-09825-0
42. Wang, J, Sui, J, Mao, C, Li, X, Chen, X, Liang, C, et al. Identification of key pathways and genes related to the development of hair follicle cycle in cashmere goats. Genes. (2021) 12:180. doi: 10.3390/genes12020180
43. Hu, X, Hao, F, Li, X, Xun, Z, Gao, Y, Ren, B, et al. Generation of VEGF Knock-in cashmere goat via the CRISPR/Cas9 system. Int J Biol Sci. (2021) 17:1026–40. doi: 10.7150/ijbs.55559
44. Chai, Y, Sun, Y, Liu, B, Guo, L, Liu, Z, Zhou, L, et al. Role of sulfur metabolism gene and high-sulfur gene expression in wool growth regulation in the cashmere goat. Front Genet. (2021) 12:715526. doi: 10.3389/fgene.2021.715526
45. Steinert, PM, Parry, DA, and Marekov, LN. Trichohyalin mechanically strengthens the hair follicle: multiple cross-bridging roles in the inner root shealth. J Biol Chem. (2003) 278:41409–19. doi: 10.1074/jbc.M302037200
46. Shi, A, Lv, J, Ma, Q, Liu, Z, Ma, L, Zhou, J, et al. Study on the expression patterns of inner root sheath-specific genes in tan sheep hair follicle during different developmental stages. Gene. (2024) 927:148751. doi: 10.1016/j.gene.2024.148751
47. Xu, Y, Zhang, X, Hui, T, Sun, J, Cai, W, Lin, G, et al. Association analysis for Snps of Krt26 and Tchh genes with cashmere production performance, body measurement traits and milk production traits in Liaoning cashmere goats. Anim Biotechnol. (2023) 34:698–708. doi: 10.1080/10495398.2021.1996386
48. Pośpiech, E, Lee, SD, Kukla-Bartoszek, M, Karłowska-Pik, J, Woźniak, A, Boroń, M, et al. Variation in the RPTN gene may facilitate straight hair formation in Europeans and East Asians. J Dermatol Sci. (2018) 91:331–4. doi: 10.1016/j.jdermsci.2018.06.003
49. Huber, M, Siegenthaler, G, Mirancea, N, Marenholz, I, Nizetic, D, Breitkreutz, D, et al. Isolation and characterization of human repetin, a member of the fused gene family of the epidermal differentiation complex. J Invest Dermatol. (2005) 124:998–1007. doi: 10.1111/j.0022-202X.2005.23675.x
50. Makino, T, Mizawa, M, Takemoto, K, and Shimizu, T. Ultraviolet B irradiation increases the expression of cornulin and retepin in human skin xenotransplants. Exp Dermatol. (2024) 33:e15109. doi: 10.1111/exd.15109
51. Kim, SN, Akindehin, S, Kwon, HJ, Son, YH, Saha, A, Jung, YS, et al. Anti-inflammatory role of 15-lipoxygenase contributes to the maintenance of skin integrity in mice. Sci Rep. (2018) 8:8856. doi: 10.1038/s41598-018-27221-7
52. Nguyen, MB, Flora, P, Branch, MC, Weber, M, Zheng, XY, Sivan, U, et al. Tenascin-C expressing touch dome keratinocytes exhibit characteristics of all epidermal lineages. Sci Adv. (2024) 10:eadi5791. doi: 10.1126/sciadv.adi5791
53. Hendaoui, I, Tucker, RP, Zingg, D, Bichet, S, Schittny, J, and Chiquet-Ehrismann, R. Tenascin-C is required for normal Wnt/β-catenin signaling in the whisker follicle stem cell niche. Matrix Biol. (2014) 40:46–53. doi: 10.1016/j.matbio.2014.08.017
54. Villani, R, Hodgson, S, Legrand, J, Greaney, J, Wong, HY, Pichol-Thievend, C, et al. Dominant-negative Sox18 function inhibits dermal papilla maturation and differentiation in all murine hair types. Development. (2017) 144:1887–95. doi: 10.1242/dev.143917
55. Gao, Y, Wang, X, Yan, H, Zeng, J, Ma, S, Niu, Y, et al. Comparative transcriptome analysis of fetal skin reveals key genes related to hair follicle morphogenesis in cashmere goats. PLoS One. (2016) 11:e0151118. doi: 10.1371/journal.pone.0151118
56. Tian, M, He, X, Wang, W, Feng, Y, Zhang, D, Li, Z, et al. Transcriptome analysis reveals genes contributed to min pig villi hair follicle in different seasons. Vet Sci. (2022) 9:639. doi: 10.3390/vetsci9110639
57. Bao, Q, Zhang, X, Bao, P, Liang, C, Guo, X, Yin, M, et al. Genome-wide identification, characterization, and expression analysis of keratin genes (KRTs) family in yak (Bos grunniens). Gene. (2022) 818:146247. doi: 10.1016/j.gene.2022.146247
58. Vollmann, EH, Cao, L, Amatucci, A, Reynolds, T, Hamann, S, Dalkilic-Liddle, I, et al. Identification of novel fibrosis modifiers by in vivo siRNA silencing. Mol Ther Nucleic Acids. (2017) 7:314–23. doi: 10.1016/j.omtn.2017.04.014
59. Liang, X, Chai, B, Duan, R, Zhou, Y, Huang, X, and Li, Q. Inhibition of Fkbp10 attenuates hypertrophic scarring through suppressing fibroblast activity and extracellular matrix deposition. J Invest Dermatol. (2017) 137:2326–35. doi: 10.1016/j.jid.2017.06.029
60. Liang, L, Zhao, K, Zhu, JH, Chen, G, Qin, XG, and Chen, JQ. Comprehensive evaluation of Fkbp10 expression and its prognostic potential in gastric cancer. Oncol Rep. (2019) 42:615–28. doi: 10.3892/or.2019.7195
61. Hagedorn, M, Siegfried, G, Hooks, KB, and Khatib, AM. Integration of zebrafish fin regeneration genes with expression data of human tumors in silico uncovers potential novel melanoma markers. Oncotarget. (2016) 7:71567–79. doi: 10.18632/oncotarget.12257
62. Gao, F, Xu, F, Wu, D, Cheng, J, and Xia, P. Identification of novel genes associated with fracture healing in osteoporosis induced by Krm2 overexpression or Lrp5 deficiency. Mol Med Rep. (2017) 15:3969–76. doi: 10.3892/mmr.2017.6544
63. Ramadori, G, Konstantinidou, G, Venkateswaran, N, Biscotti, T, Morlock, L, Galié, M, et al. Diet-induced unresolved ER stress hinders KRAS-driven lung tumorigenesis. Cell Metab. (2015) 21:117–25. doi: 10.1016/j.cmet.2014.11.020
64. Zhang, H, Apfelroth, SD, Hu, W, Davis, EC, Sanguineti, C, Bonadio, J, et al. Structure and expression of fibrillin-2, a novel microfibrillar component preferentially located in elastic matrices. J Cell Biol. (1994) 124:855–63. doi: 10.1083/jcb.124.5.855
65. Corson, GM, Chalberg, SC, Dietz, HC, Charbonneau, NL, and Sakai, LY. Fibrillin binds calcium and is coded by cDNAs that reveal a multidomain structure and alternatively spliced exons at the 5′ end. Genomics. (1993) 17:476–84. doi: 10.1006/geno.1993.1350
66. Kielty, CM, Wess, TJ, Haston, L, Ashworth, JL, Sherratt, MJ, and Shuttleworth, CA. Fibrillin-rich microfibrils: elastic biopolymers of the extracellular matrix. J Muscle Res Cell Motil. (2002) 23:581–96. doi: 10.1023/A:1023479010889
67. Ashworth, JL, Kelly, V, Wilson, R, Shuttleworth, CA, and Kielty, CM. Fibrillin assembly: dimer formation mediated by amino-terminal sequences. J Cell Sci. (1999) 112:3549–58. doi: 10.1242/jcs.112.20.3549
68. Beene, LC, Wang, LW, Hubmacher, D, Keene, DR, Reinhardt, DP, Annis, DS, et al. Nonselective assembly of fibrillin 1 and fibrillin 2 in the rodent ocular zonule and in cultured cells: implications for Marfan syndrome. Invest Ophthalmol Vis Sci. (2013) 54:8337–44. doi: 10.1167/iovs.13-13121
69. Giusti, B, and Pepe, G. Fibrillins in tendon. Front Aging Neurosci. (2016) 8:237. doi: 10.3389/fnagi.2016.00237
70. Xu, F, Jiang, W, Zhang, T, Jiang, Q, Zhang, R, and Bi, H. Fibrillin-2 gene mutations associated with hereditary connective tissue diseases. Journal of Agricultural Biotechnology. (2014) 22:727–35. (in Chinese). doi: 10.16288/j.yczz.19-052
71. Guo, R. Bioinformatics analysis of albumin (Alb) gene in animals. Heilongjiang Anim Sci Vet Med. (2016):45–8. (in Chinese). doi: 10.13881/j.cnki.hljxmsy.2016.2081
72. Chuang, VT, Kragh-Hansen, U, and Otagiri, M. Pharmaceutical strategies utilizing recombinant human serum albumin. Pharm Res. (2002) 19:569–77. doi: 10.1023/a:1015396825274
73. Cao, W, and Feng, Y. LncRNA XIST promotes extracellular matrix synthesis, proliferation and migration by targeting miR-29b-3p/COL1A1 in human skin fibroblasts after thermal injury. Biol Res. (2019) 52:52. doi: 10.1186/s40659-019-0260-5
74. Xie, H, Zhang, Q, Zhang, N, Zhong, Y, and Xie, M. Gene expression of Tp53, Col1a1 and Fn1 associated with nasopharyngeal carcinoma and their significance. Genom Appl Biol. (2022) 41:2029–38. (in Chinese). doi: 10.13417/j.gab.041.002029
75. Zhang, H, Li, X, Jia, M, Ji, J, Wu, Z, Chen, X, et al. Roles of H19/miR-29a-3p/COL1A1 axis in COE-induced lung cancer. Environ Pollut. (2022) 313:120194. doi: 10.1016/j.envpol.2022.120194
76. Wu, W, and Zheng, L. Comprehensive analysis identifies Col1a1, Col3a1, and Postn as key genes associated with brain metastasis in patients with breast cancer. Evid Based Complement Alternat Med. (2022) 2022:7812218. doi: 10.1155/2022/7812218
77. Gong, G, Fan, Y, Li, W, Yan, X, Yan, X, Zhang, L, et al. Identification of the key genes associated with different hair types in the Inner Mongolia cashmere goat. Animals. (2022) 12. doi: 10.3390/ani12111456
78. Nai, R. Mechanism analysis of vimentin and periodic growth of hair follicle in Inner Mongolia cashmere goat In: PhD dissertation. Inner Mongolia: Inner Mongolia Agricultural University (2018) (in Chinese)
Keywords: cashmere goat, secondary hair follicles, proteomics, western blot, immunohistochemistry, hair follicle cycle
Citation: Chang J, Meng F, Zhang R, Feng J, Liu Y, Zhang J, Liu Z, Liang J and Xiao H (2024) Screening and expression validation of key proteins for secondary hair follicle growth in cashmere goats based on iTRAQ quantitative proteomics technology. Front. Vet. Sci. 11:1441074. doi: 10.3389/fvets.2024.1441074
Edited by:
Xianyao Li, Shandong Agricultural University, ChinaReviewed by:
Wenlin Bai, Shenyang Agricultural University, ChinaXiaolong Kang, Ningxia University, China
Copyright © 2024 Chang, Meng, Zhang, Feng, Liu, Zhang, Liu, Liang and Xiao. This is an open-access article distributed under the terms of the Creative Commons Attribution License (CC BY). The use, distribution or reproduction in other forums is permitted, provided the original author(s) and the copyright owner(s) are credited and that the original publication in this journal is cited, in accordance with accepted academic practice. No use, distribution or reproduction is permitted which does not comply with these terms.
*Correspondence: Hongmei Xiao, bGh0ZHl4QDEyNi5jb20=
†These authors have contributed equally to this work