 Carlos Gomez-Fernandez-Blanco1*
 Dominique Peeters1
 Frédéric Farnir2
 Katja Höglund3
 Vassiliki Gouni4,5
 Maria Wiberg6
 Jakob Lundgren Willesen7Sofia Hanås8,9Kathleen McEntee1,10Laurent Tiret4,5
 Jens Häggström8
 Hannes Lohi11,12,13Valérie Chetboul4,5
 Merete Fredholm14Eija Seppälä11,12,13
 Anne-Sophie Lequarré1
 Alexander James German15Anne-Christine Merveille1
- 1Department of Clinical Sciences, College of Veterinary Medicine, University of Liège, Liège, Belgium
- 2Department of Sustainable Animal Resources, FARAH, College of Veterinary Medicine, University of Liège, Liège, Belgium
- 3Department of Animal Biosciences, Swedish University of Agricultural Sciences, Uppsala, Sweden
- 4INSERM, IMRB, Université Paris-Est Créteil, Créteil, France
- 5IMRB, École Nationale Vétérinaire d’Alfort, Maisons-Alfort, France
- 6Department of Equine and Small Animal Medicine, Faculty of Veterinary Medicine, University of Helsinki, Helsinki, Finland
- 7Department of Veterinary Clinical Sciences, University of Copenhagen, Frederiksberg, Denmark
- 8Department of Clinical Sciences, Swedish University of Agricultural Sciences, Uppsala, Sweden
- 9Evidensia Specialist Animal Hospital Strömsholm, Strömsholm, Sweden
- 10Faculty of Medicine, Université Libre de Bruxelles (ULB), Brussels, Belgium
- 11Department of Medical and Clinical Genetics, University of Helsinki, Helsinki, Finland
- 12Department of Veterinary Biosciences, University of Helsinki, Helsinki, Finland
- 13Folkhälsan Research Center, Helsinki, Finland
- 14Department of Veterinary and Animal Sciences, University of Copenhagen, Frederiksberg, Denmark
- 15Institute of Life Course and Medical Sciences, University of Liverpool, Liverpool, United Kingdom
Serum triglyceride concentrations increase in dogs with obesity, which is typically assessed by body condition score (BCS), however little is known about changes that take place in non-obese dogs in overweight condition. Further, the associations of triglyceride levels with other markers of energy homeostasis are poorly characterised in healthy animals. The present study aimed to evaluate associations between both BCS and triglyceride concentrations with other markers of lipid and glucose metabolism in healthy, non-obese dogs, as well as to assess whether these markers change significantly in non-obese dogs with overweight as compared to their lean counterparts. Serum concentrations of cholesterol, free fatty acids, triglycerides, insulin, glucose and fructosamine were measured in 532 healthy, client-owned dogs, assigned either to ‘lean’ (BCS: 3–5) or ‘overweight’ (BCS: 6–7) categories. Generalised linear mixed models were used to assess associations between BCS categories, triglyceride concentrations and other variables, correcting for the effect of breed. Compared with lean dogs, overweight dogs had a greater serum cholesterol concentration (95% CI, 5.3–6.2 mmol/L or 205–237 mg/dL versus 5.1–5.4 mmol/L or 198–210 mg/dL, p = 0.0032), insulin concentration (95% CI, 17.5–22.1 μU/ml versus 16.7–18.0 μU/ml, p = 0.0374) and were older (95% CI, 4.0–5.3 versus 3.4–3.7 years, p = 0.0005). Triglyceride concentrations were positively associated with fructosamine (r2 = 0.31, p = 0.0012), cholesterol (r2 = 0.25, p < 0.0001), insulin (r2 = 0.14, p = 0.0030) and glucose (r2 = 0.10, p = 0.0014) concentrations, and negatively associated with free fatty acid concentrations (r2 = 0.11, p < 0.0001). However, there was no association between triglyceride concentrations and age. In conclusion, both BCS and triglyceride concentrations were associated with other markers of glucose and lipid metabolism in non-obese healthy dogs, amongst which those with overweight showed metabolic changes as compared to their lean counterparts. Triglyceride concentrations were associated with an increase in insulin and fructosamine concentrations that might reflect an early-phase impairment in glucose tolerance which, surprisingly, was concurrent with lower basal free fatty acid concentrations.
Introduction
Metabolic syndrome (MS) is an entity comprising multiple cardiovascular and metabolic risk factors in humans, characterised by a state of chronic, subclinical inflammation (1). Features of human MS include combinations of increased visceral fat (abdominal obesity), systemic hypertension, increased circulating triglyceride (TG) concentrations, decreased high-density lipoprotein (HDL) cholesterol concentration, and increased fasting glucose concentration (suggesting insulin resistance) (2). Human beings with MS have a greater risk of developing type 2 diabetes mellitus (DM) and cardiovascular complications (2).
Like humans, and as opposed to traditional animal models of obesity (e.g., rodents), obesity develops spontaneously in dogs. For this reason, canine models of obesity are gaining interest, as they may provide insights into the mechanisms of disease and potential new therapeutic approaches (3).
Dogs also suffer from obesity-related metabolic dysfunction (ORMD), but the term metabolic syndrome is avoided because, although some components are shared (e.g., hypercholesterolaemia, hypertriglyceridaemia and insulin resistance), dogs do not develop the obesity-related diseases of human MS, such as atherosclerosis, stroke or type 2 DM (4–7). Studies on canine ORMD have mostly examined dogs with manifest obesity, whilst metabolic changes of dogs in a milder overweight condition have been less well characterised, despite the known association of this condition with comorbidities in the canine species (8–11).
Some people with obesity remain metabolically healthy, at least in the short term (12), during which time their risk of comorbidities is less, they do not develop insulin resistance; are normotensive; and the concentrations of glucose, TG, HDL cholesterol and high-sensitivity C-reactive protein (hsCRP) are all within reference limits (13). Conversely, some normal-weight individuals develop the characteristics of MS despite having a normal body fat mass (14). These ‘metabolically-unhealthy normal-weight’ people can be identified by a thorough biochemical assessment, where increased TG and C-reactive protein (CRP) concentrations, as well as decreased HDL-cholesterol and adiponectin concentrations will be identified (14). Similarly, different biochemical phenotypes have been described in canine obesity; for example, adiponectin concentration was less and plasma insulin concentration greater in dogs with obesity that met the criteria of ORMD, which was defined as having obesity plus two other criteria amongst: TG >200 mg/dL (>2.26 mmol/L), total cholesterol >300 mg/dL (>7.8 mmol/L), systolic blood pressure > 160 mmHg, and either a fasting plasma glucose >100 mg/dL (>5.6 mmol/L) or previously diagnosed diabetes mellitus (15, 16). In these studies, the presence of obesity was defined using a 9-unit BCS (body condition score), a validated semi-quantitative system using assessment and palpation that correlates well with body fat mass determined by dual-energy X-ray absorptiometry (8, 17–19), making it suitable for clinical use as well as in studies on overweight and obesity in dogs. Although descriptions in some BCS categories do mention muscle mass (e.g., “obvious loss of muscle mass” in BCS 1), the system mainly assesses subcutaneous and abdominal adipose tissue.
The first aim of this study was to compare various metabolic variables associated with glucose and fat metabolism in a large cohort of non-obese dogs that were either lean or in overweight condition, as defined by BCS. A second aim was to investigate associations between TG concentrations and the same metabolic variables. We hypothesise that non-obese overweight dogs will show biochemical evidence of metabolic changes as compared to lean individuals, and that TG levels as a sole marker will also be associated to metabolic changes in a general population of non-obese dogs.
Materials and methods
A canine database (European LUPA project) used to study genetic determinants of disease (20) was retrieved. Five centres had participated in the original study between 2009 and 2010: University of Liège (Belgium), University of Copenhagen (Denmark), Swedish University of Agricultural Sciewnces (Sweden), University of Helsinki (Finland) and the National Veterinary School of Maisons-Alfort (France). All centres used the same standardised protocols for recruitment and characterisation of dogs. This is therefore a prospective study which uses an already existing database with no modifications in the original protocol. No retrospective data were generated for the purpose of this study.
Client-owned, pure-bred dogs were recruited, and included different breed cohorts in order to represent a wide range of various phenotypic features. Dogs were 1–7 years old and were genetically unrelated. To minimise potential effects of the oestrous cycle on metabolic parameters, each breed cohort comprised a single sex, namely intact males or female dogs that were spayed or in anoestrus (checked by a vaginal smear). Health status was checked by reviewing history, physical examination, laboratory analyses (including routine haematology and serum biochemistry), and with a thorough cardiovascular investigation comprising ECG recording and echocardiographic examination. After visual assessment and palpation, each dog was assigned a BCS category using the one-to-nine point scale (17); “lean” (including dogs with ideal BCS – 4 to 5 – and slightly thin dogs – BCS 3) and “overweight” (BCS 6–7). Dogs were excluded if they showed clinical signs of any disease (in order to identify changes related to fat accumulation alone), were markedly underweight (BCS ≤2) or had obesity [BCS 8–9, as defined by Brooks et al. (21)].
Three weeks before the study, owners were asked to feed their dogs exclusively with a commercial dry food diet of their choice, avoiding any treats or table food. Dogs were fasted for at least 12 h before blood sampling and, after collection, blood was centrifuged within 30 min and serum then aliquoted. In most centres, serum aliquots were immediately frozen at −80°C; in one centre, samples were frozen at −20°C for the first 2 weeks after collection, before being transferred to a − 80°C thereafter. All samples were subsequently sent to the same laboratory for analysis.
The analytes selected for the present study were chosen based on their reported association with obesity in humans and dogs (2, 4, 15, 22–44). These included markers of lipid metabolism (cholesterol, TG and free fatty acids, FFA), glucose homeostasis (glucose, fructosamine, and insulin) and inflammation (CRP). Insulin was determined by radioimmunoassay (DiaSorin S.p.A Italy) and all other variables were determined by spectrophotometry using a clinical chemistry analyzer (Konelab 60i, Thermo Electron Co, Finland). Thermo Electron kits were used for glucose, CRP, cholesterol, and TG. Kits for fructosamine and FFA were provided by Horiba ABX (Montpellier, France) and Wako Chemical Gmbh (Neuss, Germany), respectively.
To determine assay variability, duplicate samples from 10 dogs randomly selected from the cohort were submitted to the same laboratory 3 months after the first analyses; coefficients of variation were 6% for insulin and ≤ 5% for FFA, cholesterol, TG, glucose and fructosamine. Outliers were inspected with the Reference Value Advisor (45) using the Tukey method (46). All outliers were used in the statistical analyses, since they were considered compatible with physiological values.
All statistical analyses were performed using an open-access statistical language and environment (RStudio 2023.03.0 Build 386). Generalised linear mixed models were performed with the function lm() of the lme4 package (47). For all analyses in this study, p-values <0.05 were considered to be statistically significant, and a Bonferroni correction was applied whenever multiple comparisons were made.
Differences in concentrations of all biochemical variables between lean and overweight dogs were investigated with a generalised linear mixed model, which included BCS and breed, as well as their interaction. A second generalised linear mixed model was created to examine associations between concentrations of TG and other biochemical variables; this second model included TG and breed, as well as their interaction. Type III sums of squares were evaluated. For both models, whenever the interaction term with breed was significant (i.e., BCS and breed for model 1; TG and breed for model 2), the association between the explanatory variable (BCS or TG) and the outcome variable was tested within each breed using non-parametric methods (Mann–Whitney or Spearman’s correlation method, respectively). All models were validated by checking the normal distribution (evaluated by visual inspection of histograms and the Shapiro–Wilk test) and homoscedasticity (evaluated with the Breusch-Pagan test) of residuals. If the assumptions were not met, non-parametric equivalent tests were used instead (e.g., Spearman’s Rank correlation or Mann–Whitney test as appropriate).
Ethics statement
This study was performed following the recommendations of the Guide for the Care and Use of Laboratory Animals of the National Institutes of Health (48), and was approved by the Ethical Committees of the LUPA project (20). Written consent of all owners was obtained.
Results
In total, 532 dogs met the inclusion criteria, with 9 different breeds represented: Boxer (15 dogs), Belgian Shepherd Dog (BSD, 124 dogs), Cavalier King Charles Spaniel (CKCS, 35 dogs), Dachshund (40 dogs), Doberman (39 dogs), Finnish Lapphund (45 dogs), German Shepherd Dog (GSD, 65 dogs), Labrador Retriever (125 dogs), and Newfoundland (44 dogs). All cohorts comprised only male dogs, except for the Newfoundland and Labrador retriever cohorts that comprised only females and dogs of both sexes (73 females and 52 males), respectively. Distribution of dogs by centre, breed, and sex is shown in Table 1; some breeds were unique to one centre whilst others were distributed amongst centres.
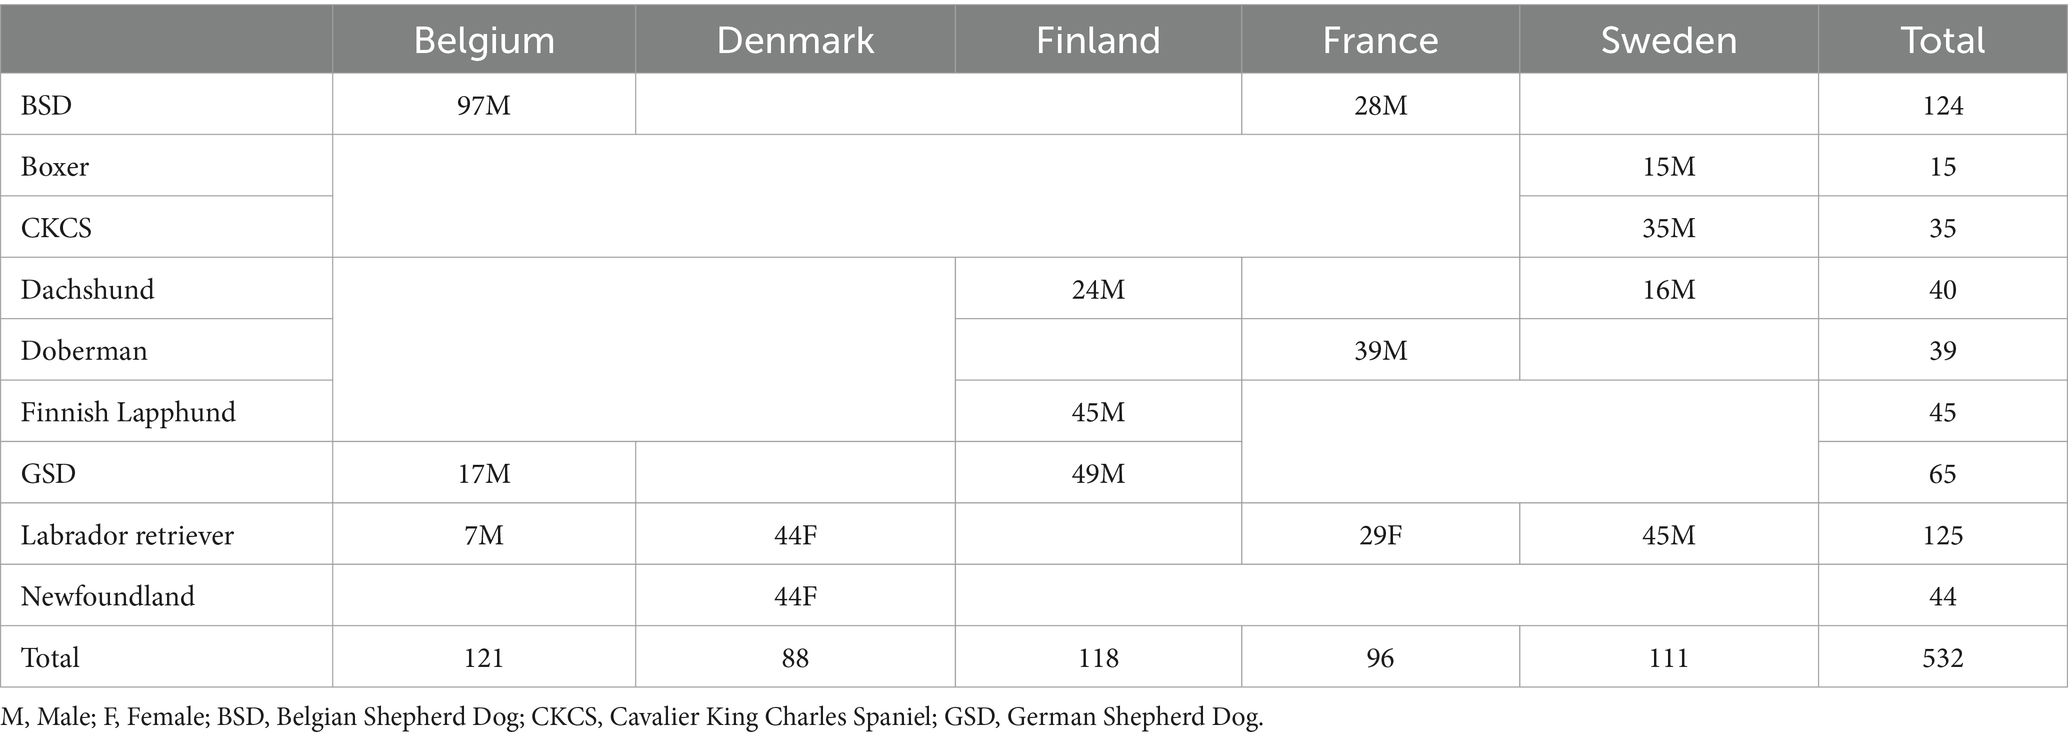
Table 1. Distribution of dogs by centre, breed, and sex.
There were 120 dogs in the “lean” category (median BCS = 5; IQR =1; mean BCS = 4.3; range, 2–5) and 407 “overweight” dogs (median BCS = 6; IQR = 0; mean BCS = 6.1; range, 6–7). Table 2 shows the distribution of BCS amongst breeds. Median BCS was 3 in Finnish Lapphunds (range: 3–4); 4 in GSDs (range: 3–4), Dachshunds (range: 3–5), BSDs (range: 4–5) and Boxers (range: 4–5); 5 in Dobermans (range: 5–5), CKCSs (range: 5–6) and Newfoundlands (range: 5–6); and 5.5 in Labrador retrievers (range: 5–6). BCS information was missing in 3 GSD and in 2 Newfoundlands.
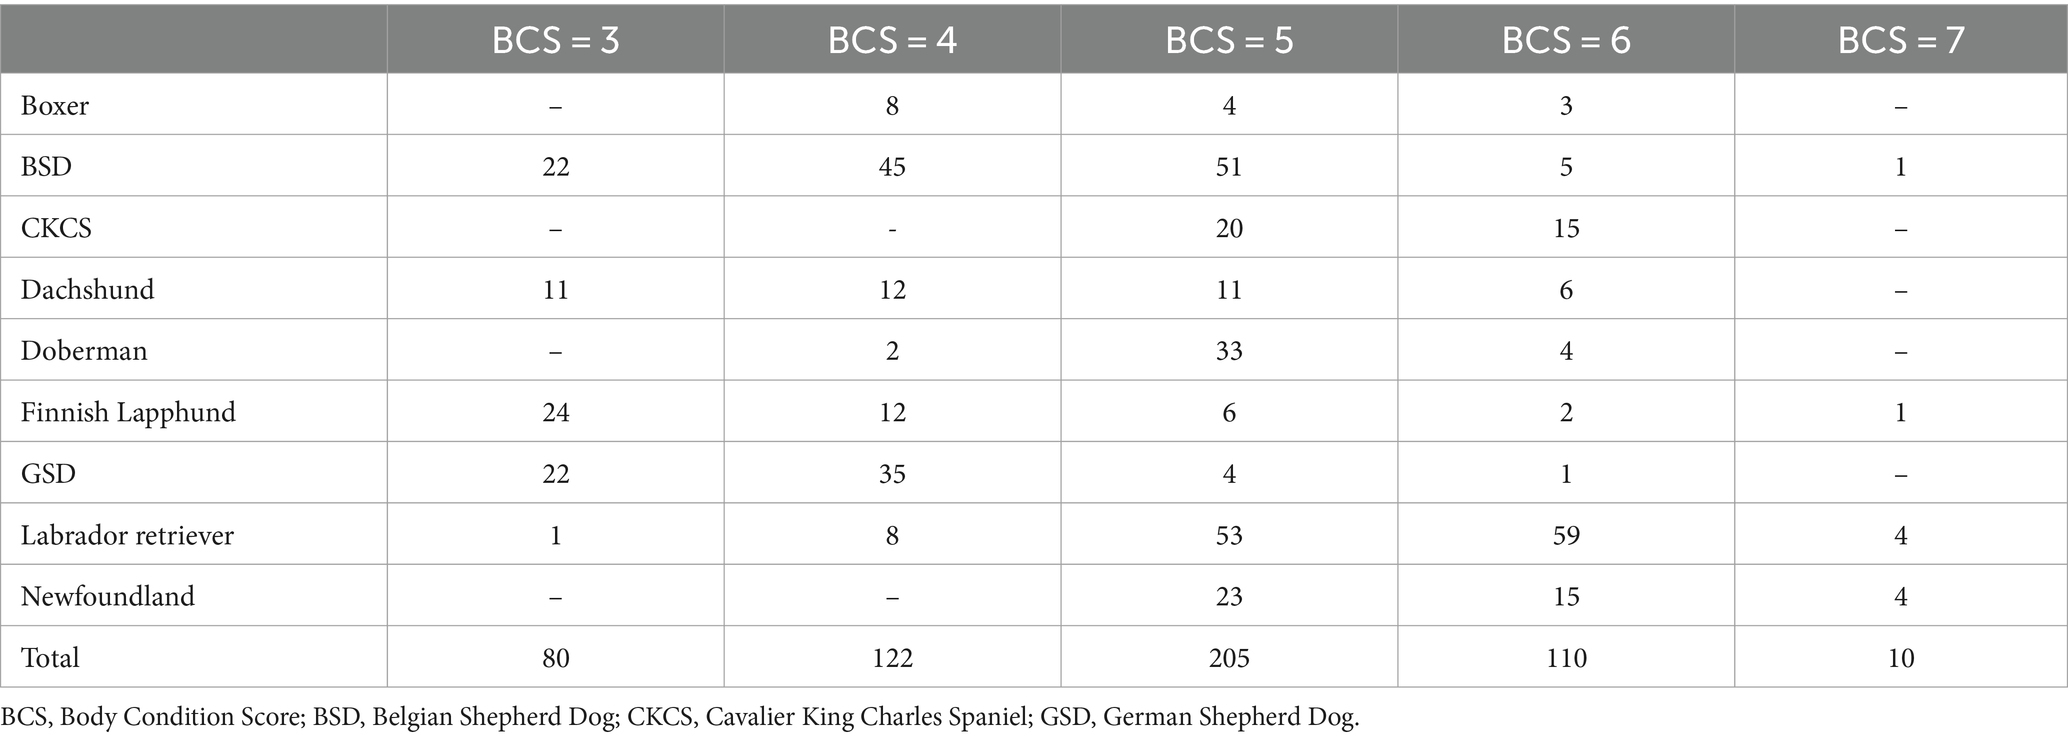
Table 2. Number of dogs in each BCS, distributed by breed.
None of the dogs in the present study met the criteria for ORMD [as defined by Tvarijonaviciute et al. (15)].
There was no effect of age on any analyte tested (cholesterol, p = 0.7424; FFA, p = 0.9631; TG, p = 0.5374; CRP, p = 0.3936; insulin, p = 0.1058; glucose, p = 0.6525.; fructosamine, p = 0.1733). After normalisation for the effect of the breed, dogs in the overweight category were older (p = 0.0005) and had greater serum insulin (p = 0.0374) and cholesterol (p = 0.0032) concentrations than lean dogs. An interaction between BCS category and breed was also identified for both TG and cholesterol concentrations (Table 3); cholesterol concentration was greater in overweight boxers (p = 0.0197) and CKCSs (p = 0.0053) compared with their lean counterparts; overweight CKCSs also had greater TG concentrations than lean CKCSs (p = 0.0023). These differences are illustrated in Figure 1.
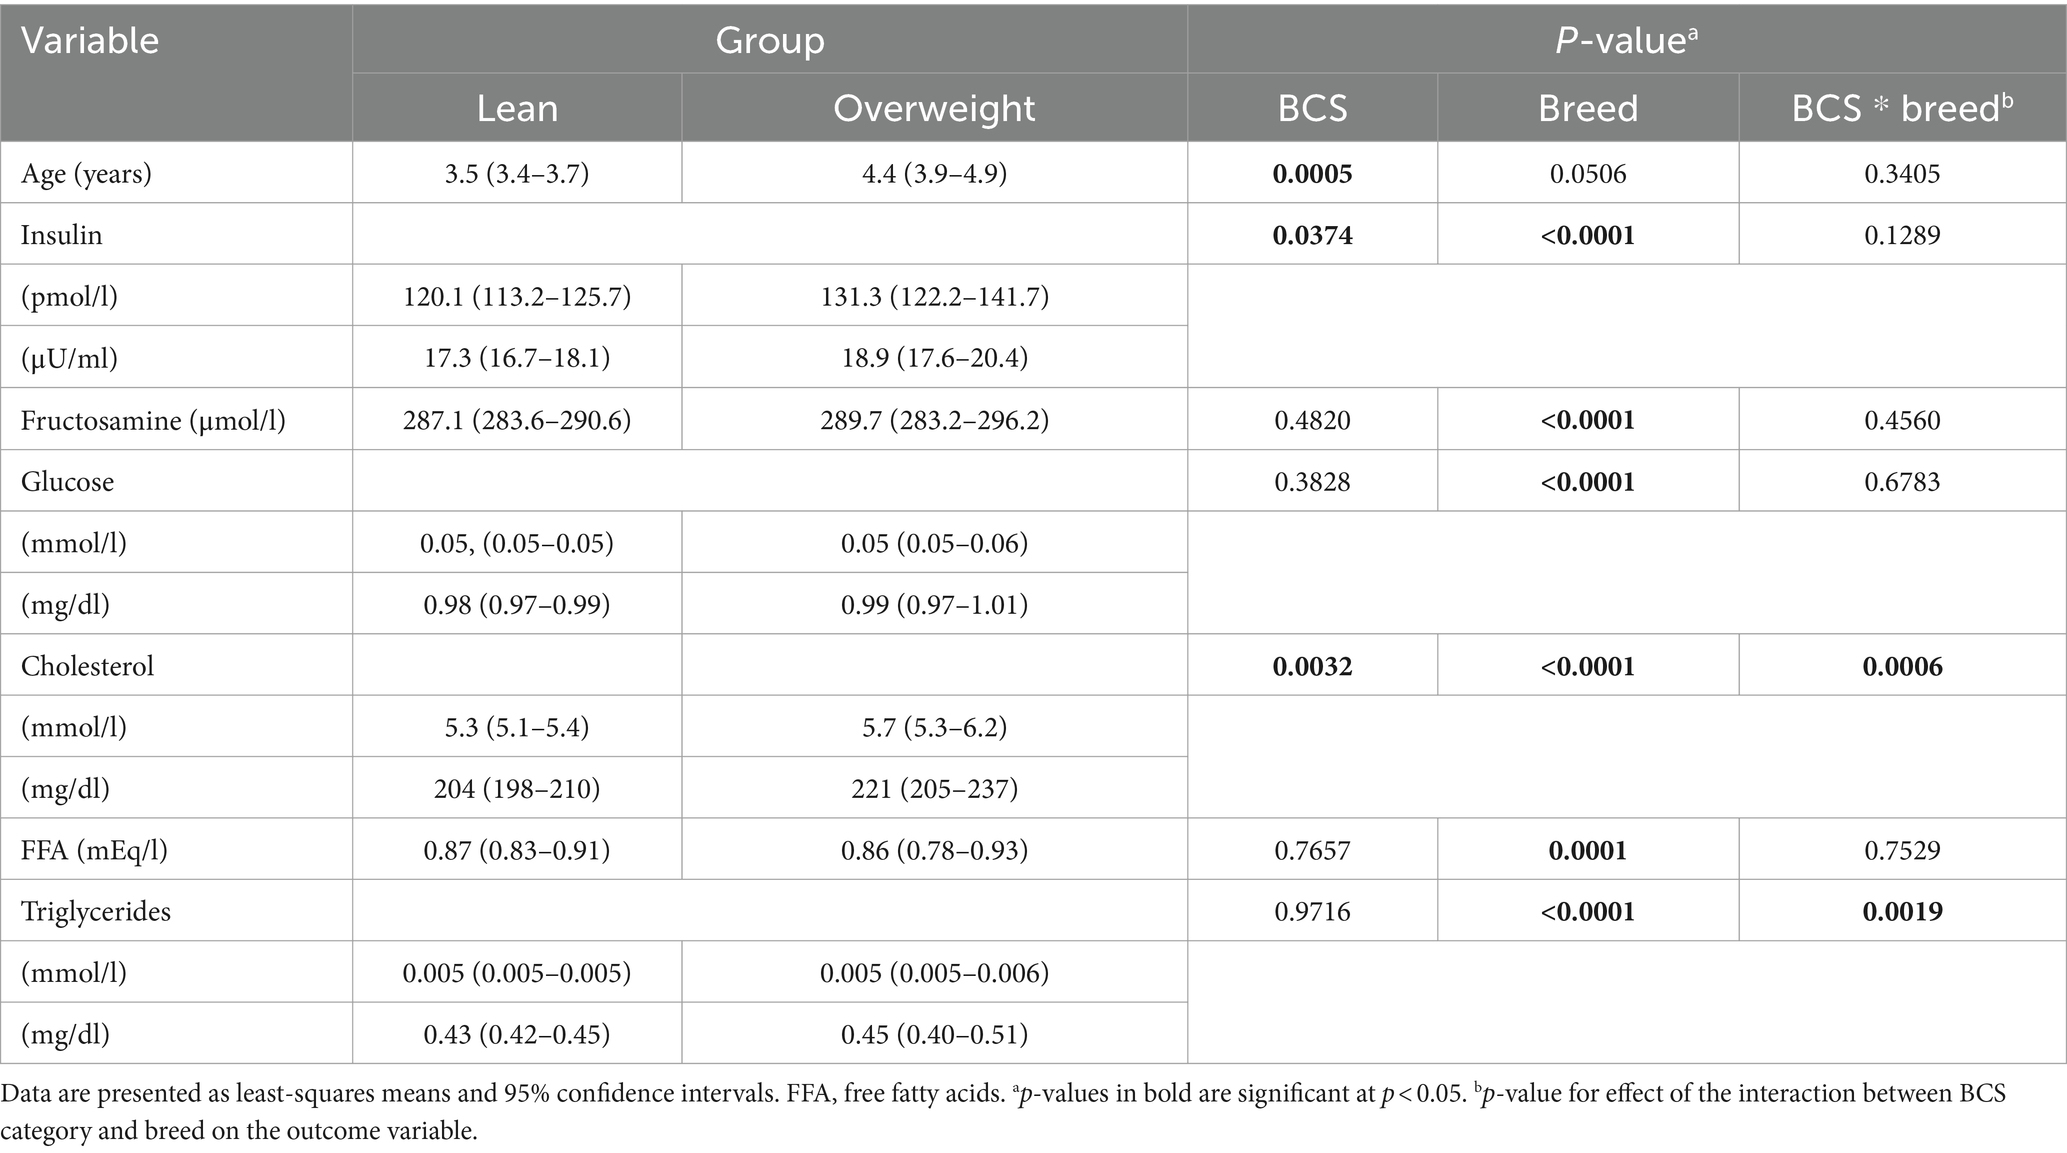
Table 3. Results of a generalised linear mixed model examining the effect of BCS category, and its interaction with the effect of the breed, on age (years) and on concentrations of insulin, fructosamine, glucose, cholesterol, free fatty acids, and triglycerides in overweight and lean dogs.
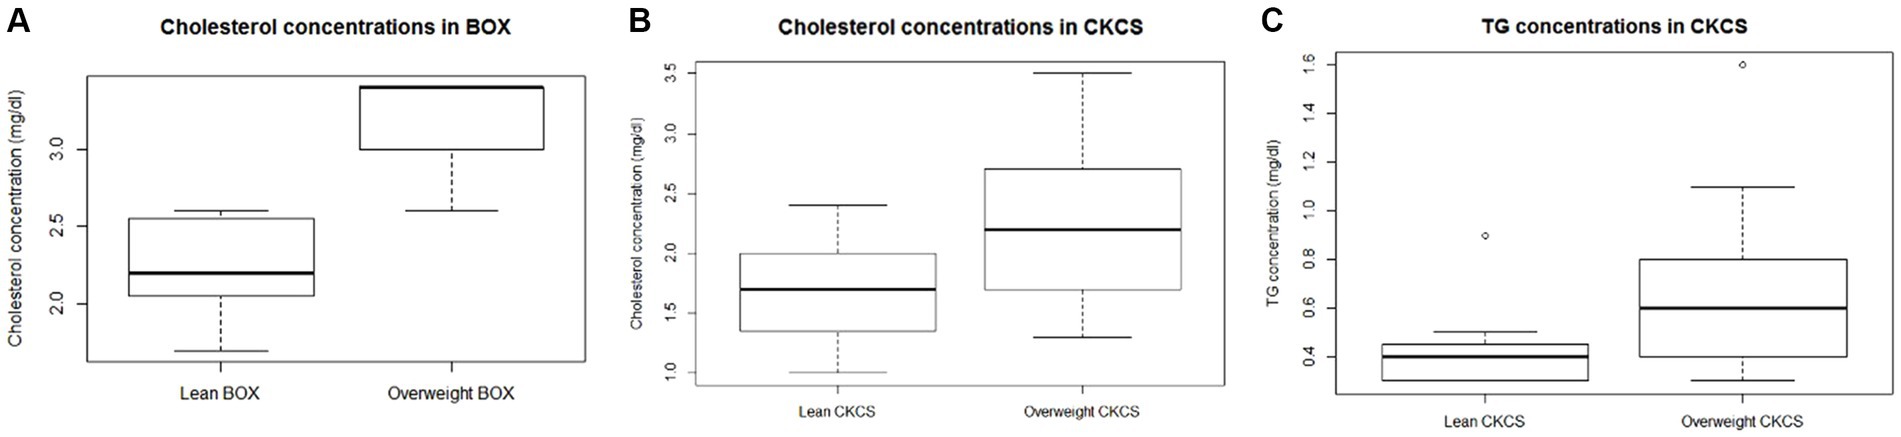
Figure 1. Box plots showing serum cholesterol (A,B) and triglyceride (C) concentrations in Boxer (BOX) and Cavalier King Charles Spaniel (CKCS). Bonferroni-corrected p-value of 0.0056. The lower, middle and upper line of each box represent the 25th percentile (bottom quartile), 50th percentile (median) and the 75th percentile (top quartile). The whiskers, where present, represent the minimum and maximum. Outliers, represented by open circles, were included in the analyses.
Results of the model assessing associations between TG concentrations and the different outcome variables are shown in Table 4. After controlling for the effect of the breed, TG concentrations were positively associated with fructosamine (p = 0.001), cholesterol (p < 0.001), insulin (p = 0.003) and glucose (p = 0.001) concentrations, and negatively associated with FFA concentrations (p < 0.0001). For insulin concentration, there was also a significant interaction between TG and breed (p = 0.0101), and intra-breed analyses revealed positive association between TG and insulin concentrations in several breeds (Table 5).
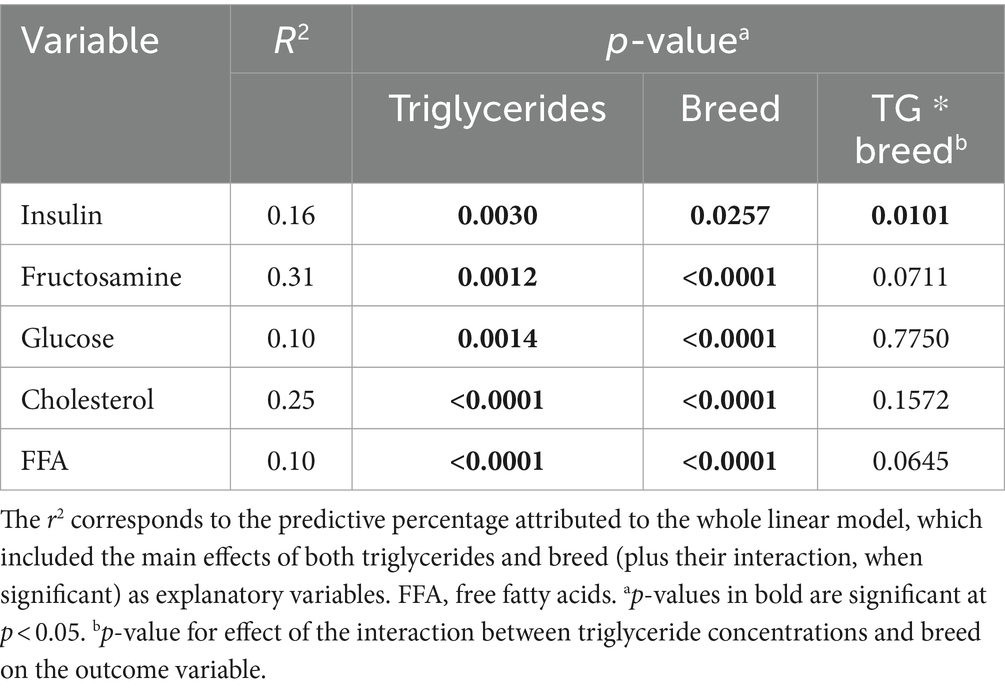
Table 4. Association between triglyceride concentration and insulin, fructosamine, glucose, cholesterol, and free fatty acids.
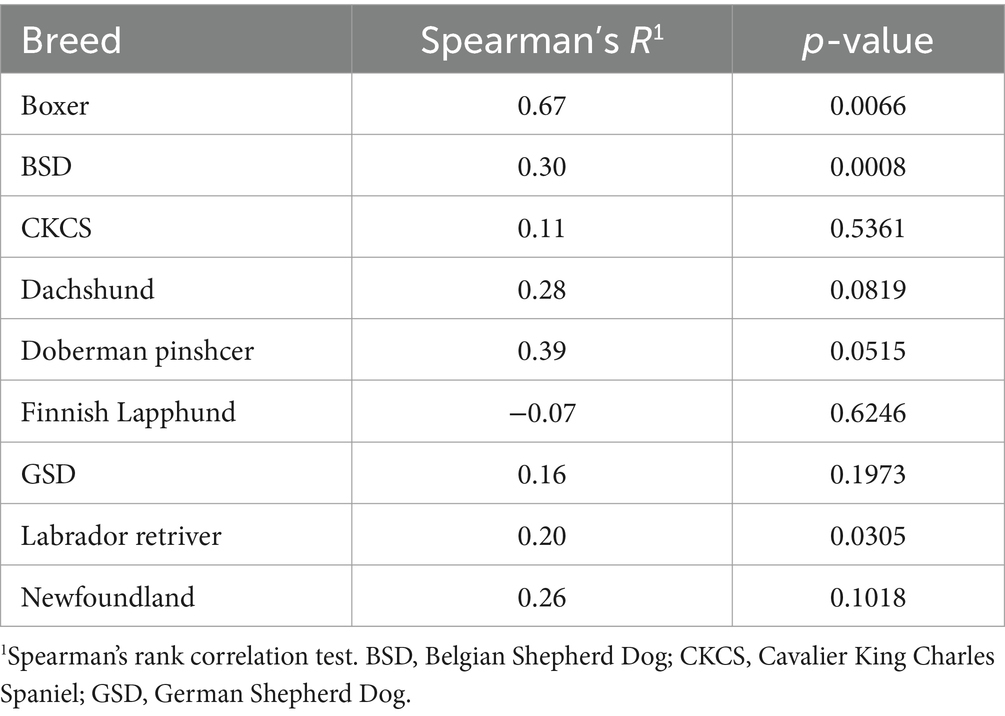
Table 5. Associations between triglyceride concentrations (mg/dl) and insulin (μU/ml) within individual breeds.
CRP was the only variable that did not succeed the tests of normal distribution of residuals. Therefore, it was assessed with nonparametric methods and no associations were found with either BCS or with TG.
Discussion
There are two key findings from this large canine cohort study: first, insulin and cholesterol concentrations were increased in non-obese, overweight dogs [as defined by Brooks et al. (21)] as compared to their lean counterparts; second, when analysing both lean and overweight dogs as a whole, fasting TG concentrations were positively associated with concentrations of cholesterol, glucose, fructosamine and insulin, but negatively associated with FFA. To the best of our knowledge, the current study is the first to report similar changes in a large group of non-obese dogs [i.e., BCS lower than 8 (21)]. The present study is different to previous ones in that the overweight category includes only BCS 6 and 7 (mean 6.1), which are considered to have, respectively, an excess of body fat of 5% (BCS 6) and 10% (BCS 7) (21, 49). Although previous studies have reported increased insulin, cholesterol and TG concentrations in overweight dogs, the “overweight” group in those studies invariably included either some or all dogs in obese body condition [i.e., higher than 7 (21)] (15, 22–25, 29, 33, 50–52). Further, other studies have included dogs with BCS 6/9 within an “ideal weight” group (42, 53, 54). However, dogs with BCS 6 are known to be at greater risk of developing comorbidities, suffering from a poorer quality of life and having a shorter life-expectancy (8–11). Given that there is no consensus about the amount of fat accumulation necessary to trigger pathological consequences in dogs, it seems important to better characterise the physiopathological changes that occur in dogs that are in overweight, but not obese, body condition. Because there are no available studies that focus specifically in the overweight category, and since the biochemical changes in overweight dogs were hypothesised to be similar to those in dogs with obesity, the discussion of the present study largely relies on studies involving obese dogs.
In addition to the main effect of BCS, both TG and cholesterol concentrations were affected by an interaction between overweight status and breed. When such an interaction between two independent variables is found, interpretation of the main effects alone may be misleading. In such instances, each category (in this case, individual breeds) should be investigated independently. Compared with their lean counterparts, overweight dogs of the CKCS breed had greater TG concentrations, whilst overweight dogs of both the Boxer and in the CKCS breeds also had greater cholesterol concentrations.
Although hyperinsulinemia is important in obesity-related disorders in humans (55) and hyperinsulinemia is also a feature of canine obesity (23, 30, 33, 56–60), dogs do not develop the same clinical consequences as humans with MS (15), suggesting that significant physiological and pathophysiological differences might exist between these species (4). In the current study, non-obese overweight status in dogs was associated with increased concentrations of insulin and cholesterol, which might be interpreted as early evidence of ORMD. These changes, although mild and likely not clinically relevant in the short term, might contribute to the long-term consequences of fat accumulation (i.e., reduced lifespan and quality of life, rapid onset of comorbidities) that have been described in both overweight and obese dogs (8–11).
In contrast to TG and cholesterol concentrations, FFA concentrations did not differ between dogs in the overweight and lean categories. Previous studies have shown that both humans and dogs with obesity have increased FFA concentrations, possibly because their concurrent insulin resistance leads to a lack of insulin-mediated suppression of lipolysis (23, 24, 51, 55); further, FFA are considered to be key mediators in the pathogenesis of obesity-induced insulin resistance (55). Therefore, the degree of adiposity in the dogs from the current cohort might have been less than that required to affect circulating FFA concentrations.
In the current study, there was also no difference in glucose concentrations between the dogs in the overweight and lean categories, a finding that contrasts with some (26–28, 61), but not all (15, 22, 24, 29–31, 34, 62) previous studies where glucose concentrations are associated with obesity, weight gain, and weight loss. Fructosamine concentrations were also not different between overweight and lean dogs, again contrasting with previous research where greater fructosamine concentrations were seen in insulin-resistant, but not insulin-sensitive, dogs with obesity (37). The influence of obesity on fructosamine concentrations in humans is believed to be mild (38, 39).
After correcting for the effect of breed, there were positive associations between TG concentrations and the concentrations of glucose, fructosamine, insulin and cholesterol, and also a negative association with FFA concentrations. Some human studies have suggested that TG concentrations are a more sensitive indicator of the risk of developing type 2 DM and cardiovascular complications than having MS, not least in normal-weight humans (63, 64). Similarly, veterinary researchers found that obese dogs with ORMD (as defined by having abnormal values of two of the following: TG, total cholesterol, systolic blood pressure and fasting plasma glucose) had greater insulin and lower adiponectin, without significant differences of body fat. This suggests that biochemical assessment could be helpful classifying dogs at risk of comorbidities irrespective of their level of adiposity (15). Of course, the findings of the present study should be interpreted in light of the fact that none of the dogs were in obese body condition (BCS 8–9). To the author’s knowledge, an association between TG and glucose and fructosamine has not been previously reported in dogs and might reflect an association between increased glucose concentration and altered lipid metabolism. It is important to emphasise that none of the dogs in the present study were considered to have ORMD. Although little research on fructosamine has been undertaken in human MS, this metabolite has been linked to cardiovascular outcomes, increases with dyslipidemia, and is also associated with TG concentrations (65).
Another important finding from this study was the association between fasting TG and insulin concentrations, which has not previously been described in healthy dogs. Increased TG concentrations are commonly associated with both insulin resistance and type 2 DM in humans, and are a central feature of the dyslipidemia that occurs (66–68). In dogs, the development of hypertriglyceridemia is promoted by an increased supply of substrates to the liver, especially glucose and FFA, in insulin-resistant states (23). Previous studies have hypothesised that TG might play a role in compensatory hyperinsulinemia, and that a lack of TG could cause a decrease in insulin compensation for hyperglycaemia (33, 69). This will have an effect on the variability of insulin responses in different physiological states, which should be considered in future studies.
FFA concentrations tend to be greater in insulin-resistant humans because insulin resistance decreases insulin-mediated inhibition of lipolysis, with the effect of increasing FFA concentrations (55). Fatty acids are also mechanistically involved in the pathophysiology of obesity-induced insulin resistance (55). In canine studies, FFA concentrations increase and contribute to insulin resistance (23, 24, 51, 66). In the current study, FFA concentrations were negatively associated with TG concentrations, an unexpected finding given the positive associations seen between TG concentrations and the concentrations of insulin, glucose and fructosamine concentrations, contrasting with previous findings in dogs with ORMD in which all these metabolic markers are increased (55). One possible explanation is that affected dogs in this cohort only had either mild insulin resistance, or were at an early stage, for example, where the liver was affected but not peripheral tissues, previously described (70); in such a state, it could be argued that insulin is unable to inhibit hepatic glucose production whilst still being able to inhibit lipolysis in the periphery. An alternative explanation for the decreased FFA concentration, such as enhanced FFA oxidation, seems unlikely given the other changes identified (e.g., increased insulin, glucose, and fructosamine concentrations).
The acute phase protein CRP is a marker of inflammation and is increased in humans with obesity (41), suggesting possible subclinical inflammation. However, findings have been inconsistent in canine obesity, where an increased CRP concentration has been observed in some (30, 42), but not other (22, 28, 43, 71) studies of canine obesity, including one study where the CRP concentration was less in dogs with obesity (44). In light of this, it is perhaps not surprising that CRP concentrations did not differ between dogs in overweight and lean condition in this study.
As with any study, several limitations should be acknowledged. First, given that only a limited number of breeds were studied, there might be a risk of over-interpreting the breed effects. However, the linear models used were corrected for the effect of the breed. Further, some effects were evident even in overweight dogs within single breeds. Second, the influence of the sex could not be assessed because, apart from Labrador retrievers, the study had been designed in a way that sex was covariate with breed. However, by correcting for the breed effect in linear models, any sex effect would also be corrected, albeit partially. A third limitation was that BCS is an imperfect measure of body fat mass, and is influenced by many factors, including differences in breed morphologies and fat distribution (19), as well as subjectivity when assigning a score. However, all cases were assessed by highly-trained veterinarians, where better agreement would be expected (72). Further, the same investigator was responsible for BCS assessment in each one of the five centres, thus minimising subjectivity.
Also related to BCS, a score of 6 was chosen as a cut-off to divide lean dogs from dogs in overweight because this limit is widely accepted in every-day practise (8, 17–19, 21). When assigning dogs to the overweight or lean categories, there was a predominance of dogs in the lean category in most breeds (≥80% in most breeds, except for CKCS, NF and LAB, which approached 50% in each category). Given such an imbalance, where numbers were small, statistically significant differences between lean and overweight dogs within specific breeds might have been missed. This limitation further shows the interest of using TG concentration as a marker, as the latter can be accurately measured. Indeed, this might have ensured a greater statistical power, explaining the increased number of significant associations with the metabolic variables assessed.
Finally, it could be argued that diet should have been included as a variable in the analyses, for example, by ensuring dogs were fed a limited number of diets. Whilst we acknowledge this limitation, the current study was designed not to test for this parameter and, arguably, assessing a cohort fed a range of different diets is more representative of the situation in client-owned dogs. Therefore, no restriction was imposed in terms of diet, as long as the dogs had only access to a commercial dry food diet and received no supplement during the 3 weeks preceding the analyses.
In conclusion, both BCS and serum TG concentrations were independently associated with changes in markers of lipid and glucose metabolism in this large cohort of healthy, non-obese dogs in lean and overweight condition. This suggests that both BCS and fasting TG concentration may be useful markers of metabolic changes in non-obese dogs. Further analyses using more complex multivariate models are needed to characterise better the interplay between these biochemical analytes.
Data availability statement
The raw data supporting the conclusions of this article will be made available by the authors, without undue reservation.
Ethics statement
The animal studies were approved by European LUPA project (five universities involved: University of Liège, Universiti of Copenhagen, Swedish University of Agricultural Sciences, University of Helsinki, National Veterinary School of Maisons-Alfort). The studies were conducted in accordance with the local legislation and institutional requirements. Written informed consent was obtained from the owners for the participation of their animals in this study.
Author contributions
CG-F-B: Formal analysis, Writing – original draft, Writing – review & editing. DP: Formal analysis, Funding acquisition, Investigation, Methodology, Project administration, Supervision, Validation, Writing – review & editing. FF: Formal analysis, Validation, Writing – review & editing. KH: Methodology, Project administration, Supervision, Writing – review & editing, Data curation, Funding acquisition. VG: Data curation, Methodology, Writing – review & editing. MW: Data curation, Methodology, Writing – review & editing. JL: Data curation, Methodology, Writing – review & editing. SH: Data curation, Methodology, Project administration, Writing – review & editing. KM: Data curation, Funding acquisition, Methodology, Writing – review & editing. LT: Data curation, Methodology, Writing – review & editing. JH: Data curation, Funding acquisition, Methodology, Project administration, Resources, Writing – review & editing. HL: Data curation, Methodology, Writing – review & editing. VC: Data curation, Methodology, Writing – review & editing. MF: Data curation, Methodology, Writing – review & editing. ES: Data curation, Methodology, Writing – review & editing. A-SL: Conceptualization, Data curation, Formal analysis, Funding acquisition, Investigation, Methodology, Project administration, Resources, Supervision, Validation, Writing – review & editing. AG: Formal analysis, Methodology, Supervision, Validation, Writing – review & editing. A-CM: Conceptualization, Data curation, Formal analysis, Funding acquisition, Investigation, Methodology, Project administration, Resources, Supervision, Validation, Writing – review & editing.
Funding
The author(s) declare that financial support was received for the research, authorship, and/or publication of this article. The present study received funding from the European Commission (Grant/Award number: FP7-LUPA, GA-201370).
Acknowledgments
Belgian police and its contribution to the collection of dogs.
Conflict of interest
AG is an employee of the University of Liverpool, but his post is financially supported by Royal Canin. AG has also received financial remuneration for providing educational material, speaking at conferences, and consultancy work from this company; all such remuneration has been for projects unrelated to the work reported in this manuscript.
The remaining authors declare that the research was conducted in the absence of any commercial or financial relationships that could be construed as a potential conflict of interest.
Publisher’s note
All claims expressed in this article are solely those of the authors and do not necessarily represent those of their affiliated organizations, or those of the publisher, the editors and the reviewers. Any product that may be evaluated in this article, or claim that may be made by its manufacturer, is not guaranteed or endorsed by the publisher.
References
1. Ouchi, N, Parker, JL, Lugus, JJ, and Walsh, K. Adipokines in inflammation and metabolic disease. Nat Rev Immunol. (2011) 11:85–97. doi: 10.1038/nri2921
2. Punthakee, Z, Goldenberg, R, and Katz, P. Definition, classification and diagnosis of diabetes, prediabetes and metabolic syndrome. Can J Diabetes. (2018) 42:S10–5. doi: 10.1016/j.jcjd.2017.10.003
3. Osto, M, and Lutz, TA. Translational value of animal models of obesity—focus on dogs and cats. Eur J Pharmacol. (2015) 759:240–52. doi: 10.1016/j.ejphar.2015.03.036
4. Verkest, KR. Is the metabolic syndrome a useful clinical concept in dogs? A review of the evidence. Vet J. (2014) 199:24–30. doi: 10.1016/j.tvjl.2013.09.057
5. Chandler, M, Cunningham, S, Lund, EM, Khanna, C, Naramore, R, Patel, A, et al. Obesity and associated comorbidities in people and companion animals: a one health perspective. J Comp Pathol. (2017) 156:296–309. doi: 10.1016/j.jcpa.2017.03.006
6. Weeth, LP. Other risks/possible benefits of obesity. Vet Clin North Am Small Anim Pract. (2016) 46:843–53. doi: 10.1016/j.cvsm.2016.04.007
7. Clark, M, and Hoenig, M. Metabolic effects of obesity and its interaction with endocrine diseases. Vet Clin North Am Small Anim Pract. (2016) 46:797–815. doi: 10.1016/j.cvsm.2016.04.004
8. Kealy, RD, Lawler, DF, Ballam, JM, Mantz, SL, Biery, DN, Greeley, EH, et al. Effects of diet restriction on life span and age-related changes in dogs. J Am Vet Med Assoc. (2002) 220:1315–20. doi: 10.2460/javma.2002.220.1315
9. Lund, EM, Armstrong, PJ, Kirk, CA, and Klausner, JS. Prevalence and risk factors for obesity in adult dogs from private US veterinary practices. J Appl Res Vet Med. (2006) 4:177–86.
10. Endenburg, N, Soontararak, S, Charoensuk, C, and Van Lith, HA. Quality of life and owner attitude to dog overweight and obesity in Thailand and the Netherlands. BMC Vet Res. (2018) 14:221. doi: 10.1186/S12917-018-1531-Z
11. Yam, PS, Butowski, CF, Chitty, JL, Naughton, G, Wiseman-Orr, ML, Parkin, T, et al. Impact of canine overweight and obesity on health-related quality of life. Prev Vet Med. (2016) 127:64–9. doi: 10.1016/j.prevetmed.2016.03.013
12. Muñoz-Garach, A, Cornejo-Pareja, I, and Tinahones, F. Does metabolically healthy obesity exist? Nutrients. (2016) 8:320. doi: 10.3390/nu8060320
13. Chang, Y, Jung, H-S, Yun, KE, Cho, J, Ahn, J, Chung, EC, et al. Metabolically healthy obesity is associated with an increased risk of diabetes independently of nonalcoholic fatty liver disease. Obesity. (2016) 24:1996–2003. doi: 10.1002/oby.21580
14. Stefan, N, Schick, F, and Häring, H-U. Causes, characteristics, and consequences of metabolically unhealthy Normal weight in humans. Cell Metab. (2017) 26:292–300. doi: 10.1016/j.cmet.2017.07.008
15. Tvarijonaviciute, A, Ceron, JJ, Holden, SL, Cuthbertson, DJ, Biourge, V, Morris, PJ, et al. Obesity-related metabolic dysfunction in dogs: a comparison with human metabolic syndrome. BMC Vet Res. (2012) 8:147. doi: 10.1186/1746-6148-8-147
16. Tvarijonaviciute, A, Ceron, JJ, De Torre, C, Ljubić, BB, Holden, SL, Queau, Y, et al. Obese dogs with and without obesity-related metabolic dysfunction – a proteomic approach. BMC Vet Res. (2016) 12:211. doi: 10.1186/s12917-016-0839-9
17. Laflamme, D. Development and validation of a body condition score system for dogs. Canine Pract. (1997) 22:10–5.
18. German, AJ, Holden, SL, Morris, PJ, and Biourge, V. Comparison of a bioimpedance monitor with dual-energy X-ray absorptiometry for noninvasive estimation of percentage body fat in dogs. Am J Vet Res. (2010) 71:393–8. doi: 10.2460/ajvr.71.4.393
19. Jeusette, I, Greco, D, Aquino, F, Detilleux, J, Peterson, M, Romano, V, et al. Effect of breed on body composition and comparison between various methods to estimate body composition in dogs. Res Vet Sci. (2010) 88:227–32. doi: 10.1016/j.rvsc.2009.07.009
20. Lequarré, AS, Andersson, L, André, C, Fredholm, M, Hitte, C, Leeb, T, et al. LUPA: a European initiative taking advantage of the canine genome architecture for unravelling complex disorders in both human and dogs. Vet J. (2011) 189:155–9. doi: 10.1016/j.tvjl.2011.06.013
21. Brooks, D, Churchill, J, Fein, K, Linder, D, Michel, KE, Tudor, K, et al. 2014 AAHA weight management guidelines for dogs and cats. J Am Anim Hosp Assoc. (2014) 50:1–11. doi: 10.5326/JAAHA-MS-6331
22. Tropf, M, Nelson, OL, Lee, PM, and Weng, HY. Cardiac and metabolic variables in obese dogs. J Vet Intern Med. (2017) 31:1000–7. doi: 10.1111/jvim.14775
23. Bailhache, E, Nguyen, P, Krempf, M, Siliart, B, Magot, T, and Ouguerram, K. Lipoproteins Abnormalities In Obese Insulin-Resistant Dogs. Metabolism. (2003) 52:559–64. doi: 10.1053/meta.2003.50110
24. Gayet, C, Bailhache, E, Dumon, H, Martin, L, Siliart, B, and Nguyen, P. Insulin resistance and changes in plasma concentration of Tnfalpha, IGF1, and NEFA in dogs during weight gain and obesity. J Anim Physiol Anim Nutr. (2004) 88:157–65. doi: 10.1111/j.1439-0396.2003.00473.x
25. Jeusette, IC, Lhoest, ET, Istasse, LP, and Diez, MO. Influence of obesity on plasma lipid and lipoprotein concentrations in dogs. Am J Vet Res. (2005) 66:81–6. doi: 10.2460/ajvr.2005.66.81
26. Tribuddharatana, T, Kongpiromchean, Y, Sribhen, K, and Sribhen, C. Biochemical alterations and their relationships with the metabolic syndrome components in canine obesity. Kasetsart J - Nat Sci. (2011) 45:622–8.
27. José Lahm Cardoso, M, Fagnani, R, Zaghi Cavalcante, C, De Souza Zanutto, M, Júnior, AZ, Holsback Da Silveira Fertonani, L, et al. Blood pressure, serum glucose, cholesterol, and triglycerides in dogs with different body scores. Vet Med Int. (2016) 2016:1–7. doi: 10.1155/2016/8675283
28. Adolphe, JL, Silver, TI, Childs, H, Drew, MD, and Weber, LP. Short-term obesity results in detrimental metabolic and cardiovascular changes that may not be reversed with weight loss in an obese dog model. Br J Nutr. (2014) 112:647–56. doi: 10.1017/S0007114514001214
29. Diez, M, Michaux, C, Jeusette, I, Baldwin, P, Istasse, L, and Biourge, V. Evolution of blood parameters during weight loss in experimental obese beagle dogs. J Anim Physiol Anim Nutr. (2004) 88:166–71. doi: 10.1111/J.1439-0396.2003.00474.X
30. German, AJ, Hervera, M, Hunter, L, Holden, SL, Morris, PJ, Biourge, V, et al. Improvement in insulin resistance and reduction in plasma inflammatory Adipokines after weight loss in obese dogs. Domest Anim Endocrinol. (2009) 37:214–26. doi: 10.1016/j.domaniend.2009.07.001
31. Tvarijonaviciute, A, Tecles, F, Martinez-Subiela, S, and Ceron, JJ. Effect of weight loss on inflammatory biomarkers in obese dogs. Vet J. (2012) 193:570–2. doi: 10.1016/j.tvjl.2012.02.015
32. Kim, SP, Catalano, KJ, Hsu, IR, Chiu, JD, Richey, JM, and Bergman, RN. Nocturnal free fatty acids are uniquely elevated in the longitudinal development of diet-induced insulin resistance and hyperinsulinemia. Am J Physiol - Endocrinol Metab. (2007) 292:E1590–8. doi: 10.1152/ajpendo.00669.2006
33. Verkest, KR, Rand, JS, Fleeman, LM, and Morton, JM. Spontaneously obese dogs exhibit greater postprandial glucose, triglyceride, and insulin concentrations than lean dogs. Domest Anim Endocrinol [Internet]. (2012) 42:103–12. doi: 10.1016/j.domaniend.2011.10.002
34. Söder, J, Wernersson, S, Hagman, R, Karlsson, I, Malmlöf, K, and Höglund, K. Metabolic and hormonal response to a feed-challenge test in lean and overweight dogs. J Vet Intern Med. (2016) 30:574–82. doi: 10.1111/jvim.13830
35. Hoenig, M. Comparative aspects of human, canine, and feline obesity and factors predicting progression to diabetes. Vet Sci. (2014) 1:121–35. doi: 10.3390/vetsci1020121
36. Chan, JM, Rimm, EB, Colditz, GA, Stampfer, MJ, and Willett, WC. Obesity, fat distribution, and weight gain as risk factors for clinical diabetes in men. Diabetes Care. (1994) 17:961–9. doi: 10.2337/diacare.17.9.961
37. Veiga, APM, Santos, AP, Santos, WIM, and FHD, G. Fructosamine as a tool on the evaluation of insulin resistant obese dogs. ARC J Anim Vet Sci. (2016) 2:2455–518. doi: 10.20431/2455-2518.0202004
38. Broussolle, C, Tricot, F, Garcia, I, Orgiazzi, J, and Revol, A. Evaluation of the Fructosamine test in obesity: consequences for the assessment of past glycemic control in diabetes. Clin Biochem. (1991) 24:203–9. doi: 10.1016/0009-9120(91)90586-4
39. Woo, J, Cockram, C, Lau, E, Chan, A, and Swaminathan, R. Influence of obesity on plasma Fructosamine concentration. Clin Chem. (1992) 38:2190–2. doi: 10.1093/clinchem/38.11.2190
40. Zoran, DL. Obesity in dogs and cats: a metabolic and endocrine disorder. Vet Clin North Am Small Anim Pract. (2010) 40:221–39. doi: 10.1016/J.Cvsm.2009.10.009
41. Aronson, D, Bartha, P, Zinder, O, Kerner, A, Markiewicz, W, Avizohar, O, et al. Obesity is the major determinant of elevated C-reactive protein in subjects with the metabolic syndrome. Int J Obes. (2004) 28:674–9. doi: 10.1038/sj.ijo.0802609
42. Radakovich, LB, Truelove, MP, Pannone, SC, Olver, CS, and Santangelo, KS. Clinically healthy overweight and obese dogs differ from lean controls in select CBC and serum biochemistry values. Vet Clin Pathol. (2017) 46:221–6. doi: 10.1111/Vcp.12468
43. Tvarijonaviciute, A, Martinez, S, Gutierrez, A, Ceron, JJ, and Tecles, F. Serum acute phase proteins concentrations in dogs during experimentally short-term induced overweight. a preliminary study. Res Vet Sci. (2011) 90:31–4. doi: 10.1016/j.rvsc.2010.05.008
44. Veiga, APM, Price, CA, De Oliveira, ST, Dos Santos, AP, Campos, R, Barbosa, PR, et al. Association of canine obesity with reduced serum levels of C-reactive protein. J Vet Diagnostic Investig. (2008) 20:224–8. doi: 10.1177/104063870802000214
45. Geffré, A, Concordet, D, Braun, JP, and Trumel, C. Reference value advisor: a new freeware set of macroinstructions to calculate reference intervals with Microsoft excel. Vet Clin Pathol. (2011) 40:107–12. doi: 10.1111/j.1939-165X.2011.00287.x
46. Friedrichs, KR, Harr, KE, Freeman, KP, Szladovits, B, Walton, RM, Barnhart, KF, et al. ASVCP reference interval guidelines: determination of De novo reference intervals in veterinary species and other related topics. Vet Clin Pathol. (2012) 41:441–53. doi: 10.1111/vcp.12006
47. R development Core team: A language and environment for statistical computing. Vienna, Austria: R Foundation For Statistical Computing (2014).
48. National Research Council Of The National Academies. Guide for the care and use of laboratory animals. Washington, DC: National Academy Press (2001).
49. German, AJ, Holden, SL, Bissot, T, Morris, PJ, and Biourge, V. Use of starting condition score to estimate changes in body weight and composition during weight loss in obese dogs. Res Vet Sci. (2009) 87:249–54. doi: 10.1016/j.rvsc.2009.02.007
50. Peña, C, Suárez, L, Bautista, I, Montoya, JA, and Juste, MC. Relationship between analytic values and canine obesity. J Anim Physiol Anim Nutr. (2008) 92:324–5. doi: 10.1111/J.1439-0396.2007.00786.X
51. Bailhache, E, Ouguerram, K, Gayet, C, Krempf, M, Siliart, B, Magot, T, et al. An insulin-resistant Hypertriglyceridaemic normotensive obese dog model: assessment of insulin resistance by the Euglycaemic Hyperinsulinaemic clamp in combination with the stable isotope technique. J Anim Physiol Anim Nutr. (2003) 87:86–95. doi: 10.1046/J.1439-0396.2003.00419.X
52. Jeusette, IC, Detilleux, J, Shibata, H, Saito, M, Honjoh, T, Delobel, A, et al. Effects of chronic obesity and weight loss on plasma ghrelin and leptin concentrations in dogs. Res Vet Sci. (2005) 79:169–75. doi: 10.1016/j.rvsc.2004.11.012
53. Lee, S, Kweon, O-K, and Kim, WH. Increased leptin and leptin receptor expression in dogs with gallbladder Mucocele. J Vet Intern Med. (2017) 31:36–42. doi: 10.1111/jvim.14612
54. Parker, VJ, and Freeman, LM. Association between body condition and survival in dogs with acquired chronic kidney disease. J Vet Intern Med. (2011) 25:1306–11. doi: 10.1111/J.1939-1676.2011.00805.X
55. Kahn, SE, Hull, RL, and Utzschneider, KM. Mechanisms linking obesity to insulin resistance and type 2 diabetes. Nature. (2006) 444:840–6. doi: 10.1038/nature05482
56. Mattheeuws, D, Rottiers, R, Kaneko, JJ, and Vermeulen, A. Diabetes mellitus in dogs: relationship of obesity to glucose tolerance and insulin response. Am J Vet Res. (1984) 45:98–103.
57. Ader, M, Stefanovski, D, Kim, SP, Richey, JM, Ionut, V, Catalano, KJ, et al. Hepatic insulin clearance is the primary determinant of insulin sensitivity in the Normal dog. Obesity. (2014) 22:1238–45. doi: 10.1002/oby.20625
58. Verkest, KR, Fleeman, LM, Rand, JS, and Morton, JM. Evaluation of Beta-cell sensitivity to glucose and first-phase insulin secretion in obese dogs. Am J Vet Res. (2011) 72:357–66. doi: 10.2460/ajvr.72.3.357
59. Verkest, KR, Fleeman, LM, Morton, JM, Ishioka, K, and Rand, JS. Compensation for obesity-induced insulin resistance in dogs: assessment of the effects of leptin, adiponectin, and glucagon-like Peptide-1 using path analysis. Domest Anim Endocrinol. (2011) 41:24–34. doi: 10.1016/j.domaniend.2011.02.001
60. Verkest, KR, Fleeman, LM, Morton, JM, Groen, SJ, Suchodolski, JS, Steiner, JM, et al. Association of postprandial serum triglyceride concentration and serum canine pancreatic lipase Immunoreactivity in overweight and obese dogs. J Vet Intern Med. (2012) 26:46–53. doi: 10.1111/j.1939-1676.2011.00844.x
61. Lawler, DF, Larson, BT, Ballam, JM, Smith, GK, Biery, DN, Evans, RH, et al. Diet restriction and ageing in the dog: major observations over two decades. Br J Nutr. (2008) 99:793–805. doi: 10.1017/S0007114507871686
62. Kim, SP, Ellmerer, M, Kirkman, EL, and Bergman, RN. Β-cell “rest” accompanies reduced first-pass hepatic insulin extraction in the insulin-resistant, fat-fed canine model. Am J Physiol - Endocrinol Metab. (2007) 292:E1581–9. doi: 10.1152/ajpendo.00351.2006
63. Eckel, N, Mühlenbruch, K, Meidtner, K, Boeing, H, Stefan, N, and Schulze, MB. Characterization of metabolically unhealthy Normal-weight individuals: risk factors and their associations with type 2 diabetes. Metabolism. (2015) 64:862–71. doi: 10.1016/j.metabol.2015.03.009
64. Cambuli, VM, Musiu, MC, Incani, M, Paderi, M, Serpe, R, Marras, V, et al. Assessment of adiponectin and leptin as biomarkers of positive metabolic outcomes after lifestyle intervention in overweight and obese children. J Clin Endocrinol Metab. (2008) 93:3051–7. doi: 10.1210/jc.2008-0476
65. Peng, YF, and Wei, YS. The relationships between serum Fructosamine concentrations and lipid profiles in community-dwelling adults. Sci Rep. (2017) 7:3–7. doi: 10.1038/s41598-017-07287-5
66. Ginsberg, HN, Zhang, Y-L, and Hernandez-Ono, A. Regulation of plasma triglycerides in insulin resistance and diabetes. Arch Med Res. (2005) 36:232–40. doi: 10.1016/j.arcmed.2005.01.005
67. Glueck, CJ, Khan, NA, Umar, M, Uppal, MS, Ahmed, W, Morrison, JA, et al. Insulin resistance and triglycerides. J Investig Med. (2009) 57:874–81. doi: 10.2310/JIM.0b013e3181bca9d2
68. Hoffman, RP. Increased fasting triglyceride levels are associated with hepatic insulin resistance in Caucasian but not African-American adolescents. Diabetes Care. (2006) 29:1402–4. doi: 10.2337/dc06-2460
69. Kashyap, S, Belfort, R, Gastaldelli, A, Pratipanawatr, T, Berria, R, Pratipanawatr, W, et al. A sustained increase in plasma free fatty acids impairs insulin secretion in nondiabetic subjects genetically predisposed to develop type 2 diabetes. Diabetes. (2003) 52:2461–74. doi: 10.2337/diabetes.52.10.2461
70. Kim, SP, Ellmerer, M, Van Citters, GM, and Bergman, RN. Primacy of hepatic insulin 622 resistance in the development of the metabolic syndrome induced by an isocaloric 623 moderate-fat diet in the dog. Diabetes [Internet]. (2003) Oct [cited 2016 Aug 52:2453–60. Available from: http://www.ncbi.nlm.nih.gov/pubmed/14514627
71. Leclerc, L, Thorin, C, Flanagan, J, Biourge, V, Serisier, S, and Nguyen, P. Higher neonatal growth rate and body condition score at 7 months are predictive factors of obesity in adult female beagle dogs. BMC Vet Res. (2017) 13:1–13. doi: 10.1186/s12917-017-0994-7
Keywords: canine, metabolic syndrome, BCS, triglycerides, insulin, fructosamine, cholesterol, free fatty acids
Citation: Gomez-Fernandez-Blanco C, Peeters D, Farnir F, Höglund K, Gouni V, Wiberg M, Lundgren Willesen J, Hanås S, McEntee K, Tiret L, Häggström J, Lohi H, Chetboul V, Fredholm M, Seppälä E, Lequarré A-S, German AJ and Merveille A-C (2024) Fasting triglyceride concentrations are associated with markers of lipid metabolism and glucose homeostasis in healthy, non-obese dogs in lean and overweight condition. Front. Vet. Sci. 11:1406322. doi: 10.3389/fvets.2024.1406322
Edited by:
Osman Küçük, Erciyes University, TürkiyeReviewed by:
Brianna R. Beechler, Oregon State University, United StatesDiego Piantedosi, University of Naples Federico II, Italy
Copyright © 2024 Gomez-Fernandez-Blanco, Peeters, Farnir, Höglund, Gouni, Wiberg, Lundgren Willesen, Hanås, McEntee, Tiret, Häggström, Lohi, Chetboul, Fredholm, Seppälä, Lequarré, German and Merveille. This is an open-access article distributed under the terms of the Creative Commons Attribution License (CC BY). The use, distribution or reproduction in other forums is permitted, provided the original author(s) and the copyright owner(s) are credited and that the original publication in this journal is cited, in accordance with accepted academic practice. No use, distribution or reproduction is permitted which does not comply with these terms.
*Correspondence: Carlos Gomez-Fernandez-Blanco, Y2dmZXJuYW5kZXpibGFuY29AZ21haWwuY29t